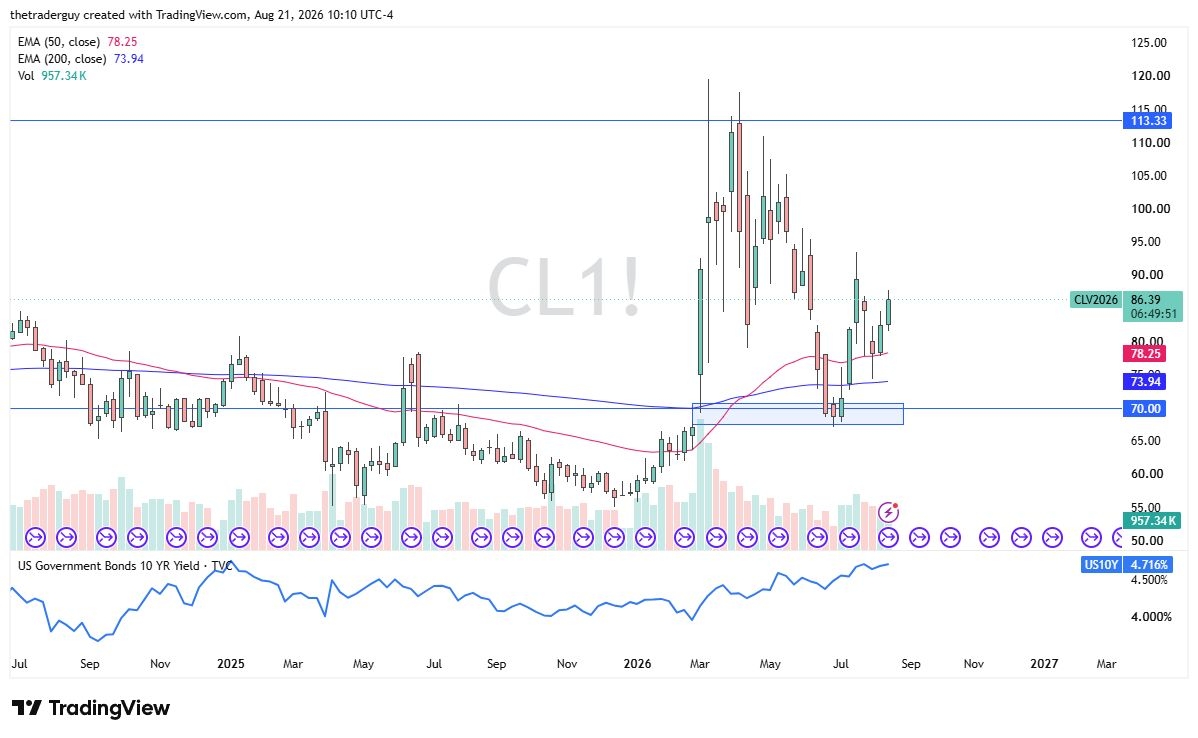
Light Sweet Crude posted strong gains over the past week, a move largely driven by persistent geopolitical tensions in the Middle East that continue to fuel concerns over potential supply disruptions.
The market appears firmly positioned to challenge the $85 per barrel mark. Any near-term weakness or corrective pullbacks are likely to attract fresh buying interest, particularly from short-term traders looking to capitalize on the prevailing bullish momentum.
Gold
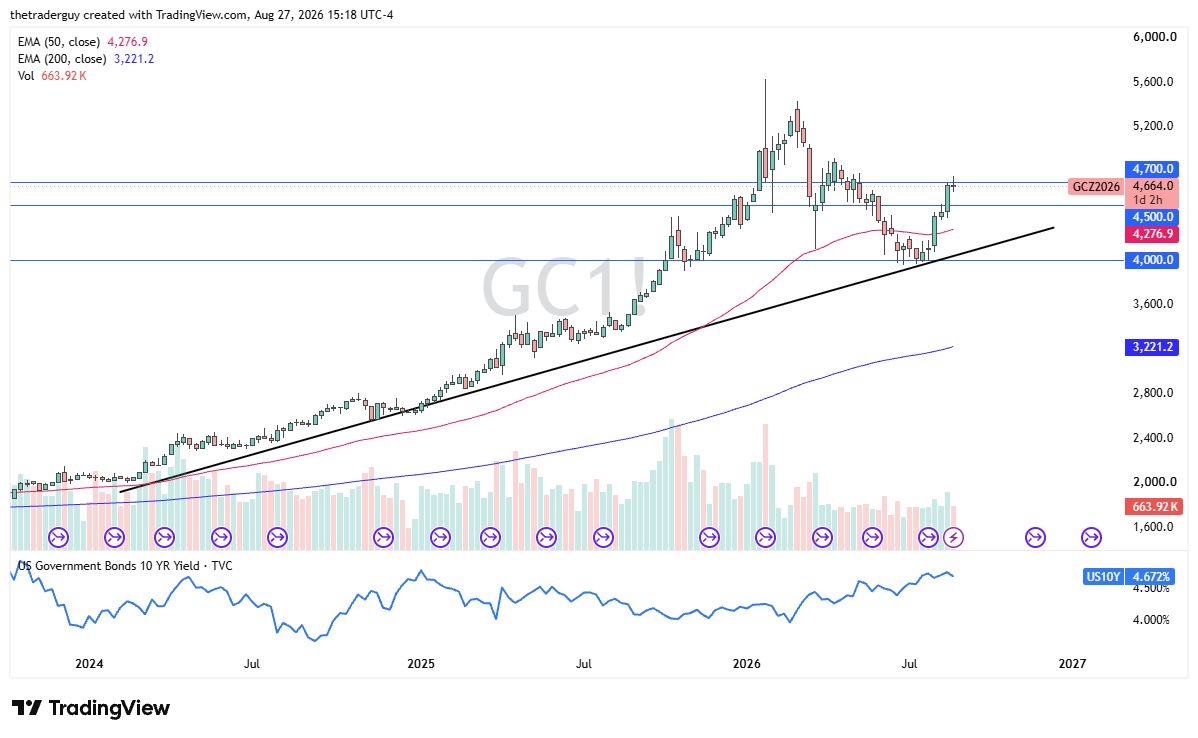
Gold retreated below the $4,000 threshold once again during the week, remaining under pressure as investors continue to assess the interest rate outlook. Persistent concerns that elevated borrowing costs could reduce the appeal of non-yielding assets such as gold have weighed on market sentiment.
The $4,000 level remains a key technical support zone. A sustained hold above this area could help stabilize prices, while a decisive break lower may open the door to additional downside pressure.
Silver
Silver came under heavy selling pressure during the week, dropping to a fresh low before attempting a modest recovery heading into Friday’s session. Despite the rebound, the broader technical outlook remains weak, with rallies likely to encounter renewed selling interest as bearish sentiment continues to dominate the market.
The $50 level remains a significant support zone that has influenced price action on several occasions in the past. Given the current downward momentum, a move toward this area cannot be ruled out. Rising interest rates continue to undermine the appeal of non-yielding assets, leaving silver vulnerable to further declines and offering little incentive for bullish positioning at this stage.
CAC 40
The CAC 40 experienced volatile and range-bound trading throughout the week. However, following the sharp decline seen in the previous week, the recent consolidation can be viewed as a constructive sign that the market may be stabilizing. A decisive break above the 8,400 level could pave the way for further gains toward 8,500.
A sustained move beyond 8,500 would strengthen the bullish outlook and potentially trigger a broader upward advance. On the downside, the 8,000 area continues to provide significant support, and as long as the index remains above this level, the longer-term uptrend is likely to stay intact.
Natural Gas
Natural gas prices edged lower over the past week, extending the prevailing bearish trend. The weakness is largely consistent with seasonal demand patterns, as this period of the year typically experiences softer consumption. Under these conditions, short-term rebounds are likely to be viewed as selling opportunities rather than the start of a sustained recovery.
Market sentiment remains tilted to the downside, with traders likely to sell into rallies that show signs of losing momentum. A break below this week’s low could accelerate selling pressure and expose the $2.50 level as the next significant downside target. Given that the market is currently focused on the August contract, a substantial upward move appears unlikely unless an intense and widespread heatwave significantly boosts energy demand across the United States.
USD/CAD
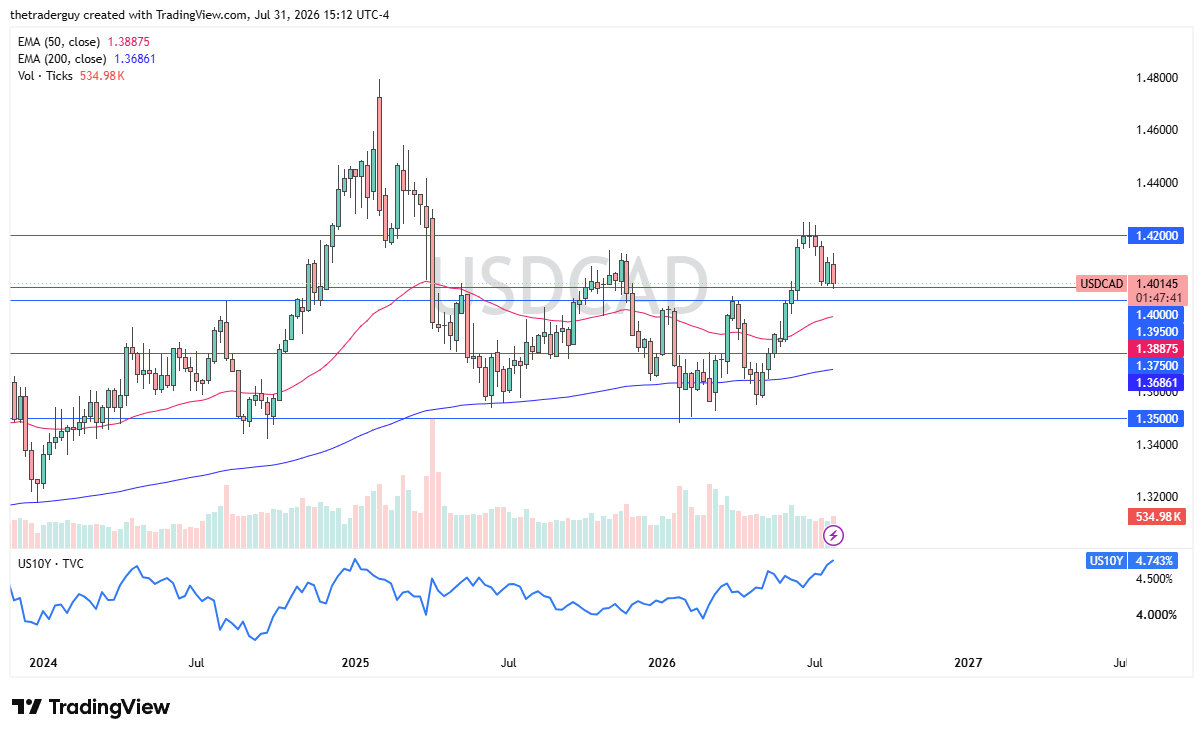
The US dollar came under significant pressure against the Canadian dollar during the week, with the 1.40 level providing a measure of support heading into the weekend. Strength in crude oil prices has contributed to the Canadian dollar’s resilience, as rising energy prices generally benefit Canada’s commodity-linked currency.
The 1.40 area is likely to remain a closely watched support zone, making next week’s price action particularly important for determining the pair’s near-term direction. Recent movements have been influenced by a combination of factors, including ongoing geopolitical tensions in the Middle East, softer-than-expected US CPI and PPI data, and stronger-than-forecast Canadian employment figures released the previous week. Together, these developments have increased pressure on the US dollar while providing support for the Canadian currency.
NASDAQ 100
The Nasdaq 100 declined during the week, revisiting the 28,500 level, a region that has repeatedly acted as an important support zone. The market’s ability to hold above this area is likely to attract attention from investors looking for value opportunities and could help sustain the broader consolidation pattern.
If buyers successfully defend the 28,500 support level, the index may stage a rebound and continue trading within its established range. Under current conditions, the broader outlook still favors a move back toward the 30,000 mark over time. However, a significant deterioration in geopolitical conditions, particularly in the Middle East, could undermine risk sentiment and challenge the bullish scenario.
EUR/USD
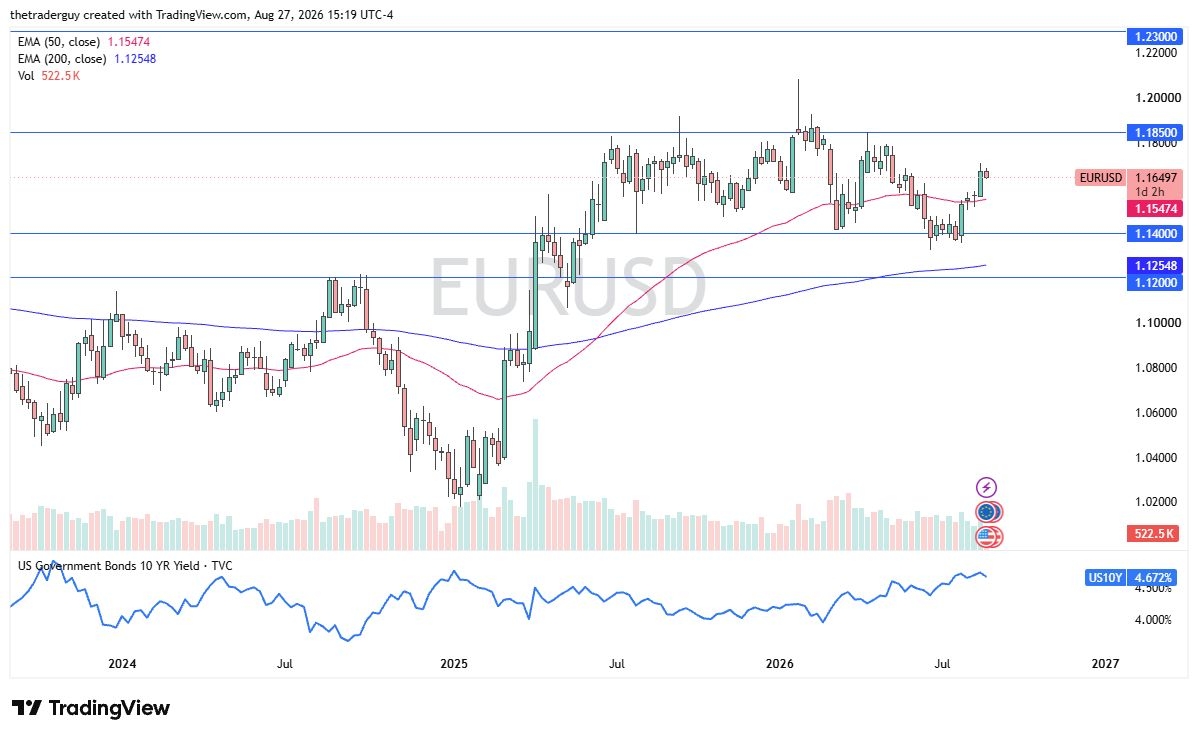
The EUR/USD pair continued to hover around the key 1.14 level throughout the week. This area, which previously served as a major support zone, remains an important reference point for traders. Although the euro managed to recover modestly earlier in the week, higher US interest rates have continued to limit upside momentum and provide underlying support for the US dollar.
The broader bias remains cautious, with rallies likely to face resistance if buying momentum begins to fade. Given the current interest rate dynamics and ongoing demand for the dollar, traders may prefer a short-term trading approach, looking to capitalize on brief upward corrections while remaining alert to signs of renewed weakness in the pair.
The global oil market is losing many of its key shock absorbers as inventories remain tight, shipments through the Strait of Hormuz face ongoing disruptions, and spare supply continues to shrink, increasing the likelihood of stronger oil prices.
One factor that has kept prices from climbing further is China’s sharp decline in crude oil imports. However, analysts believe that support may soon disappear, with the world’s largest oil importer expected to return to the market after drawing down its existing stockpiles.
Should disruptions in the Strait of Hormuz continue while Chinese buying accelerates, market analysts warn that global oil supplies could tighten considerably. The resulting imbalance between supply and demand may place the greatest upward pressure on crude prices in the latter part of the year.
The oil market could soon lose the key supply and demand buffers that have prevented crude prices from surging despite the massive disruption to shipments through the Strait of Hormuz.
A temporary U.S.-Iran memorandum of understanding had allowed Middle Eastern producers to accelerate exports of crude that had accumulated in Gulf storage over the previous four months. That opportunity has now effectively ended as hostilities resumed and the ceasefire collapsed.
At the same time, crude and refined fuel inventories across major consuming regions, including the United States, have fallen to critically low levels. Much of the oil released through the largest coordinated strategic stock drawdown in history has already reached refiners, leaving few reserves available to cushion further supply shocks.
Another important stabilizing factor may also be fading. China, whose reduced crude imports have helped moderate global demand in recent months, is expected to return to the market soon. If that happens, one of the largest forces restraining oil prices during the March-to-June period could disappear.
China’s Demand May Be Reawakening
China cut crude imports to their lowest level in a decade during June, extending three months of unusually weak buying as elevated prices and constrained Middle Eastern supplies discouraged purchases. Compared with its 2025 average, imports are estimated to have declined by roughly 4.4 million barrels per day.
Official customs figures showed June crude imports totaled 29.27 million metric tons, or about 7.12 million barrels per day—down 41.3% from the same month a year earlier and marking the weakest monthly import level since October 2016.
The country’s large commercial and strategic reserves, accumulated before the conflict with Iran intensified, allowed Beijing to sharply reduce imports while still meeting domestic demand. Those stockpiles have acted as a major buffer for the global market, helping prevent prices from soaring despite the disruption of more than 10 million barrels per day of oil flows through the Strait of Hormuz.
As the world’s largest crude importer, China entered the supply crisis better prepared than any other major consumer. Analysts estimate it built reserves of between 1.2 billion and 1.3 billion barrels before the conflict began, although the true size of those inventories remains uncertain because official data are limited.
Recent estimates suggest China began drawing on those reserves in May and continued doing so through June. According to the International Energy Agency (IEA), inventories declined by roughly 41 million barrels last month.
While Goldman Sachs believes China still holds ample reserves and faces no immediate pressure to increase purchases, analysts expect the turning point may be approaching. Lower official selling prices from Gulf producers for July and August could encourage Chinese refiners to step up imports in the coming months.
Since the Middle East conflict escalated in February, China’s restrained buying has effectively acted as the global oil market’s swing demand factor. If imports recover, that important demand buffer could disappear.
Shrinking Inventories Raise Risks
A rebound in Chinese demand could coincide with continuing uncertainty surrounding the Strait of Hormuz, where shipping activity remains well below the pace seen during the brief period following the U.S.-Iran agreement.
Any renewed disruption to tanker traffic would further delay the recovery of Middle Eastern exports and tighten global supplies of both crude oil and refined fuels.
According to Energy Aspects founder Amrita Sen, slower vessel movements through the Strait, combined with renewed U.S. restrictions on Iranian oil exports and rapidly declining inventories, are laying the groundwork for higher oil prices if current conditions persist.
Sen estimates that global oil inventories have fallen by roughly 600–700 million barrels since the crisis began. She warned that if the current situation extends into the end of this month or early next month, the market may face its greatest pressure later in the third quarter or early in the fourth quarter.
Speaking separately to the Financial Times, Sen said that nearly all excess commercial inventories have now been exhausted, leaving only government-held strategic reserves as a meaningful emergency backstop. As a result, confidence that oil flows through the Strait of Hormuz will remain uninterrupted is increasingly being tested.
Gold’s $4,000 Test Signals Interest Rates Are Overriding Safe-Haven Demand
Gold futures dropped to $4,008.80, down $43.00 (1.06%), after opening at $4,068.90, slightly above Wednesday’s close. Spot gold weakened even further, falling to $4,010.33 by 11:03 EDT, a daily loss of $57.22. After trading near $4,041 early in the session, bullion came under steady selling pressure throughout the day.
Gold’s recent performance reflects a sharp reversal in momentum. Prices have declined 5.25% over the past month, although they remain 20.89% higher than a year ago. Since reaching $4,121.05 on July 10, the metal has steadily retreated, ending that week around $4,100 before sliding to $4,013.64 on July 13 as it tested the $4,000 level. Today’s move marks yet another return to that critical support, with the June low resting at $4,002.
The repeated tests of $4,000 suggest the market’s focus has shifted. Rather than responding primarily to geopolitical uncertainty, gold is increasingly trading in line with interest rate expectations. Rising tensions between the United States and Iran have lifted oil prices, reinforcing inflation concerns and increasing expectations that the Federal Reserve could keep monetary policy tighter for longer. Higher real yields raise the opportunity cost of holding non-yielding assets such as gold, limiting the metal’s appeal despite heightened geopolitical risks.
The broader precious metals market reflects the same trend. Silver fell to $56.90, while August Comex silver futures declined more than 3% to $57.095. Platinum slipped to $1,656.30, and palladium dropped to $1,295.75, highlighting broad-based selling across the sector as markets reassessed the outlook for inflation and interest rates.
Although softer-than-expected U.S. inflation data briefly supported gold by reducing expectations of an imminent Fed rate hike, the relief proved short-lived. As oil prices surged on renewed Middle East tensions, inflation concerns quickly resurfaced, sending gold back toward $4,000. The swift reversal from a CPI-driven rally to an oil-driven selloff illustrates the dominant theme shaping the 2026 gold market: interest rate expectations now carry more weight than traditional safe-haven demand.
War Is Hurting Gold Through Oil, Not Supporting It as a Safe Haven
The current weakness in gold reflects a market driven more by interest rate expectations than traditional safe-haven demand. The transmission mechanism is straightforward: military escalation raises concerns over crude oil supply, pushing energy prices higher. More expensive oil feeds into headline inflation, strengthening the case for the Federal Reserve to keep interest rates elevated—or tighten further. Higher real yields increase the opportunity cost of holding non-yielding assets like gold, encouraging institutional investors to reduce exposure.
Rather than acting as a catalyst for safe-haven buying, geopolitical tensions are being interpreted primarily through their impact on inflation and monetary policy.
That dynamic explains why gold has continued to decline despite intensifying conflict in the Gulf. Investors are viewing the risk surrounding the Strait of Hormuz as an interest-rate story: higher oil prices support higher bond yields and a firmer U.S. dollar, reducing gold’s appeal. The conflict itself remains significant, but the market is responding through the inflation channel instead of the traditional flight-to-safety narrative.
Oil prices continue to reinforce that view. Brent crude trades around $84.63, up 6.39% over the past month and 21.74% from a year ago, while WTI crude remains above $80 after rallying more than 11% in three sessions. Recent U.S. strikes on Iranian targets and Iran’s retaliation against American military bases across the Gulf have heightened concerns over energy supplies.
The sequence of events also helps explain the sharp swings in sentiment. A Memorandum of Understanding signed by Iran and the United States on June 17 had raised hopes for improved relations, including the easing of sanctions on Iranian oil exports and reduced disruption around the Strait of Hormuz. Those expectations unraveled on July 6, when attacks on commercial shipping prompted military retaliation, placing the agreement under severe strain.
The contrast with earlier in the year is notable. Gold rallied during the February escalation but has fallen during the July conflict because the macro backdrop has changed. Earlier, geopolitical risks boosted demand for defensive assets. Today, the same risks are reinforcing expectations of tighter monetary policy, fundamentally altering the market’s response.
A reversal remains possible but would likely require either a prolonged disruption to shipping through the Strait of Hormuz that sparks a genuine flight to safety or a deterioration in global growth severe enough to drive bond yields lower. Reports that Tehran remains open to renewed negotiations reduce the likelihood of either scenario in the near term, leaving interest rate expectations as the dominant force weighing on bullion.
Gold Has Fallen 28% From Its Record High
Gold has retreated dramatically from its January 29 record of $5,589 per ounce to approximately $4,008.80, a decline of 28.3%, or $1,580, in less than six months.
The rally earlier this year was extraordinary. Gold surged above $5,000 for the first time, briefly touched $5,595 intraday, and established multiple all-time highs before suffering a historic reversal. After peaking in late January, prices traded sideways through much of the first quarter before breaking sharply lower in March. A modest rebound in April eventually gave way to another steady decline toward the $4,000 area, with June’s low at $4,002.
Despite the correction, the longer-term picture remains relatively resilient. Gold is down roughly 7% year-to-date but still trades nearly 21% above year-ago levels and remains about $578 above its 2025 year-end close of $3,431. In that context, the decline represents a significant retracement of an exceptionally rapid rally rather than the complete breakdown of the longer-term bullish trend.
However, the technical landscape has changed. Analysts previously viewed the $4,550 region—formed by late-December highs and early-2026 support—as a major floor. That level failed during March’s selloff and now sits roughly $460 above current prices, removing an important layer of technical support.
Heavy Liquidation Intensified the Selloff
The decline was amplified by two major liquidation waves rather than a gradual reassessment of gold’s long-term value.
The first came immediately after January’s record highs, when gold plunged nearly $1,200 in just two trading sessions, marking its steepest two-day decline since 1983. The second occurred in March, when prices fell roughly 13%, producing the worst monthly decline since 2009. In both cases, rising interest-rate expectations linked to higher energy prices overshadowed gold’s traditional role as a defensive asset.
Despite the sharp correction, Wall Street remains broadly constructive. A Reuters survey of analysts projects a 2026 median gold price of $4,746.50 per ounce, the highest consensus forecast since the poll began in 2012. With gold currently near $4,009, prices remain roughly 15.6% below that consensus estimate.
Liquidity dynamics also played an important role. During periods of market stress, institutional investors often sell their most liquid holdings to meet margin calls or raise cash quickly. Gold’s liquidity makes it a frequent source of funding, creating a paradox in which a traditional safe-haven asset can come under heavy selling pressure precisely when uncertainty rises.
That behavior was evident on March 4, when the SPDR Gold Shares (GLD) experienced approximately $2.91 billion in net outflows in a single session—the largest daily withdrawal in more than a decade. Combined with profit-taking from investors who benefited from gold’s rapid rise earlier in the year, those outflows accelerated the correction. As momentum traders exited, ownership shifted toward longer-term investors whose buying tends to be steadier but less aggressive, leaving the market without the speculative demand that previously fueled the rally.
Rising Real Yields Continue to Undermine Gold
The surge in U.S. Treasury yields has become one of the primary headwinds for gold. The 10-year Treasury yield climbed to 4.60% on Thursday, approaching the two-month high of 4.62% reached on July 13, as investors increasingly positioned for another Federal Reserve rate hike.
The key driver is real yields—bond yields adjusted for inflation expectations—rather than nominal interest rates alone. As expectations for tighter monetary policy increase, real yields rise, making income-generating assets more attractive relative to gold, which offers no yield. Conversely, when markets anticipate fewer rate hikes or eventual easing, real yields typically decline, improving gold’s relative appeal.
That dynamic briefly supported bullion after June’s softer inflation data. Consumer prices fell 0.4% month over month, the largest monthly decline since April 2020, while annual CPI eased to 3.5% and core inflation held at 2.6%. Producer prices also slipped 0.3%, marking their first monthly decline in nearly a year as energy costs retreated. Gold initially benefited from the weaker inflation readings.
However, the rally proved short-lived as stronger economic data quickly shifted attention back to the Fed. Retail sales remained resilient despite lower fuel prices, while initial jobless claims fell to 208,000, a two-month low, reinforcing confidence in the labor market. Those developments strengthened expectations that the Federal Reserve could still tighten policy later this year. Interest-rate futures currently imply roughly a 44% probability of a September rate hike, down from 50% a day earlier but still keeping additional tightening firmly on the table.
A stronger U.S. dollar has added further pressure. Supported by higher Treasury yields and a resilient U.S. economy, the Dollar Index remains near 100.49. Earlier in 2026, a weaker dollar helped propel gold to its record high of $5,589, but the recent rebound in the greenback has reversed that tailwind.
History, however, offers a note of caution. Gold has often performed well after Federal Reserve rate increases, averaging gains in the month following a 25-basis-point hike during several previous tightening cycles. The decisive factor is not the hike itself but whether tighter policy ultimately slows economic growth enough to push yields lower.
A More Hawkish Federal Reserve Has Increased Uncertainty
Since taking office as Federal Reserve Chair in May 2026, Kevin Warsh has adopted a notably less predictable communication strategy. During congressional testimony in mid-July, he followed a June Federal Open Market Committee meeting that left rates unchanged but shifted the policy outlook in a more hawkish direction.
One notable feature of the June meeting was Warsh’s decision not to publish his own interest-rate projection in the Fed’s dot plot. Combined with the removal of explicit forward guidance, the move increased uncertainty around future monetary policy and made it more difficult for markets to anticipate the Fed’s reaction function.
Markets currently expect the July 28–29 FOMC meeting to end with rates unchanged, assigning roughly a 90% probability to a hold. Nevertheless, investors continue to see September as a realistic opportunity for another rate increase.
The broader policy backdrop also remains restrictive. The World Gold Council (WGC) expects at least one Federal Reserve rate hike in 2026 while anticipating additional tightening by the Bank of England, Bank of Japan, and European Central Bank. Simultaneous tightening across several major central banks reduces the currency-diversification advantages that previously supported gold.
The macroeconomic outlook remains relatively stable, with global growth projected around 2.9%, U.S. growth near 2.1%, U.S. inflation peaking around 3.9%, and global inflation averaging 4.3% during 2026. Under those conditions, elevated real yields continue to reduce the incentive to hold gold.
The primary upside risk for bullion would be a sharper-than-expected economic slowdown. According to Bank of America’s June fund manager survey, 58% of respondents expect stagflation. Should tighter monetary policy significantly weaken growth, declining yields could eventually restore support for gold.
The World Gold Council Sees Gold Near Fair Value
The World Gold Council’sMid-Year Outlook 2026, titled Point Break, values gold using a framework based on real yields, inflation expectations, the U.S. dollar, and central-bank demand. Under its baseline macroeconomic scenario, the model estimates fair value near $4,100 per ounce, with a tolerance range of roughly ±5%, implying a second-half trading band between $3,895 and $4,305.
With gold trading around $4,008.80, prices remain comfortably within that projected range. The implication is that current valuations broadly reflect consensus expectations of one additional Fed rate hike and inflation peaking near 3.9%, suggesting the market is neither significantly overvalued nor deeply undervalued.
That assessment limits both bullish and bearish arguments. It weakens expectations of a sharp collapse because the WGC’s framework identifies fundamental support near $3,895, but it also challenges forecasts of a rapid return to $5,200–6,000 unless the macroeconomic outlook changes substantially.
Future price direction will largely depend on shifts in economic growth, geopolitical developments, and the U.S. dollar. The WGC notes that while geopolitical tensions drove much of gold’s volatility during the first half of the year, currency movements could become an equally important variable in the months ahead.
Central-Bank Buying Provides Support—but Not Momentum
Central banks continue to accumulate gold despite the recent correction. The People’s Bank of China (PBoC) purchased 15 tonnes in June—its largest monthly acquisition since October 2023—marking the 20th consecutive month of reserve accumulation. China’s official gold holdings have now reached 2,346 tonnes, representing roughly 9% of its total foreign-exchange reserves.
Worldwide, central banks acquired an estimated 244 tonnes during the first quarter of 2026, with countries such as Poland also continuing to expand their holdings.
While these purchases provide an important source of structural demand, they have not prevented prices from falling. Central banks typically allocate reserves based on long-term diversification strategies rather than short-term market movements. As a result, they tend to absorb supply steadily instead of aggressively chasing prices higher.
The scale of recent buying also illustrates its limitations. China’s 15-tonne purchase represents roughly 482,000 ounces, equivalent to approximately $1.9 billion at current prices. By comparison, the SPDR Gold Shares (GLD) experienced $2.91 billion in outflows in a single trading session during March. One day of ETF liquidation outweighed an entire month of China’s purchases.
Many longer-term bullish forecasts assume central-bank buying will remain robust, with total official-sector purchases exceeding 800 tonnes in 2026. Even if that pace is achieved, however, official demand is more likely to establish a long-term price floor than trigger another powerful rally.
The broader structural arguments for gold—including reserve diversification, fiscal expansion, de-dollarization, and limited mine-supply growth—remain intact. What has weakened is private investment demand. Because marginal private buyers typically determine short-term price movements, their retreat has had a much larger impact on prices than continued sovereign accumulation.
WTI edges higher during the Asian session, although buying interest remains limited. Escalating tensions between the US and Iran continue to underpin geopolitical risk premiums, while fears of supply disruptions across key shipping routes lend further support to crude prices.
West Texas Intermediate (WTI), the US benchmark for crude oil, trades modestly higher during Friday’s Asian session but continues to move within a well-established multi-day trading range. The commodity is hovering near $79.35, up roughly 0.5% on the day and close to Tuesday’s one-month peak, leaving it on course for a second consecutive weekly gain as investors remain focused on the possibility of further escalation between the United States and Iran.
Market sentiment remains supported after the US military conducted a sixth straight night of airstrikes against Iran on Thursday, including a strike on an empty oil tanker bound for Kharg Island as part of its renewed naval blockade of Iranian ports. In response, Iran launched attacks on US military positions across the region, intensifying concerns that the conflict could evolve into a broader confrontation. These developments have kept geopolitical risk premiums elevated and continue to provide underlying support for crude prices.
Additional concerns emerged after authorities in Bandar Abbas reported damage to civilian infrastructure, including electricity facilities and a railway station. Iran’s Islamic Revolutionary Guard Corps has also warned of expanding military operations by targeting more regional energy transport routes. Adding to supply concerns, Reuters reported that Tehran has instructed Yemen’s Houthi movement to prepare for the possible closure of the Red Sea oil corridor, creating another potential threat to global energy flows.
At the same time, declining shipping activity through the Strait of Hormuz has reinforced fears of tighter oil supplies, strengthening the case for further upside in crude prices. Even so, traders may prefer to wait for a decisive breakout above the current consolidation range before committing to fresh bullish positions. Nevertheless, the broader fundamental backdrop continues to favor buyers, suggesting that any near-term pullback is likely to attract renewed demand and remain relatively limited.
Gold prices fell to around $3,975 during Friday’s early Asian trading session. The decline came after Iran reportedly urged the Houthis to block the Red Sea gateway if the US targeted its power network, intensifying Middle East tensions. The escalating geopolitical conflict strengthened expectations that the Federal Reserve could raise interest rates later this year, putting additional pressure on the precious metal.
Gold prices remained under pressure, slipping toward an eight-month low near $3,975 in early Asian trading on Friday. The precious metal continued to weaken as escalating tensions in the Middle East fueled inflation concerns and strengthened expectations that US interest rates could remain higher for longer.
According to Reuters, Iran has instructed Yemen’s Houthi movement to prepare to block the Red Sea shipping route if the United States targets Iranian power infrastructure. The warning followed US President Donald Trump’s threat earlier this week to strike Iran’s power network.
Any disruption to the Red Sea would significantly worsen the global energy crisis already intensified by Iran’s closure of the Strait of Hormuz. Such a scenario could drive crude oil prices even higher, increasing inflationary pressures and encouraging major central banks to keep monetary policy restrictive. Higher interest rates typically reduce the attractiveness of non-yielding assets such as gold.
The renewed geopolitical tensions have overshadowed recent signs of easing US inflation. Data released earlier this week showed that both the Consumer Price Index (CPI) and Producer Price Index (PPI) cooled in June, suggesting inflationary pressures had moderated.
Despite the softer inflation readings, market participants now see roughly a 55% probability that the Federal Reserve will raise interest rates at its September meeting, according to the CME FedWatch Tool, adding further downside pressure to gold.
Gold attracts fresh selling pressure on Thursday as energy-led inflation concerns revive expectations of additional Fed rate hikes.
Escalating tensions between the US and Iran underpin demand for the safe-haven US Dollar, weighing on the precious metal.
The technical outlook remains bearish, suggesting the path of least resistance is tilted toward further downside.
Gold (XAU/USD) came under renewed selling pressure during Thursday’s Asian session, retreating toward the $4,025 area near the previous day’s swing low. Although recent US inflation data pointed to easing price pressures, elevated crude oil prices continue to fuel expectations that the Federal Reserve could still raise interest rates later this year. The prospect of tighter monetary policy lends support to the US Dollar (USD) and weighs on non-yielding Gold.
Data released by the US Bureau of Labor Statistics showed that the Producer Price Index (PPI) unexpectedly fell 0.3% in June following a revised 0.6% increase in May, while annual producer inflation slowed to 5.5% from 6.0%. The report followed a sharp decline in the Consumer Price Index (CPI), reinforcing signs that inflation pressures are moderating. As a result, traders reduced expectations for an imminent Fed rate hike, sending the USD to its weakest level since June 18 and helping Gold recover on Wednesday.
However, persistent energy-driven inflation risks continue to cloud the outlook. Crude oil prices remain near one-month highs as escalating US-Iran tensions and ongoing disruptions in the Strait of Hormuz raise concerns about global energy supplies. The US launched another wave of airstrikes against Iranian military targets on Wednesday, prompting retaliatory drone and missile attacks by Iran on US-linked facilities across the region. President Donald Trump also warned that additional Iranian infrastructure could be targeted if hostilities intensify.
Meanwhile, Iran’s Islamic Revolutionary Guard Corps threatened to broaden the conflict by targeting key regional energy routes, including shipping lanes near the Bab el-Mandeb Strait through its Houthi allies in Yemen. These developments continue to support oil prices, rekindling inflation concerns and strengthening the argument for at least one 25-basis-point Fed rate hike in 2026. Consequently, USD weakness may remain limited, while the broader outlook for Gold continues to favor further downside.
Gold Daily Chart
Gold remains under bearish pressure as XAU/USD continues to trade below its 200-day Simple Moving Average (SMA) and within a well-defined descending channel. While momentum indicators show signs of stabilization, they have yet to signal a meaningful bullish reversal. The Moving Average Convergence Divergence (MACD) remains slightly positive at 9.43, while the Relative Strength Index (RSI) hovers near 40.77, suggesting weak buying interest rather than a sustained recovery.
A confirmed break and daily close below the key psychological support at $4,000 could trigger a fresh wave of selling. Such a move would bring the June year-to-date low around $3,943–$3,942 into focus. Further downside pressure could then drive Gold toward the channel’s lower boundary near $3,675.71, a major structural support level. A decisive violation of this zone would strengthen the broader bearish outlook and open the door to deeper losses.
On the upside, immediate resistance is located near $4,093.63, corresponding to the upper boundary of the descending channel. Any recovery attempt is likely to encounter renewed selling interest in this region. A sustained breakout above this barrier would improve the technical picture and pave the way for a move toward the 200-day SMA around $4,495.94, which remains the next major resistance level.
Silver remains under pressure as escalating US-Iran tensions in the Strait of Hormuz drive oil prices higher, raising concerns that the Federal Reserve may keep interest rates elevated for longer. Softer-than-expected June CPI and PPI data have helped ease near-term rate-hike concerns. Meanwhile, markets have reduced the probability of a September Fed rate increase to 44%, although the impact of recent military developments has yet to be fully reflected in asset prices.
Silver (XAG/USD) extends its decline for a second consecutive session, trading near $57.00 per troy ounce during Thursday’s Asian session. The precious metal remains under pressure as escalating tensions between the United States and Iran drive oil prices higher, raising inflation risks and reinforcing expectations that the Federal Reserve could maintain elevated interest rates for longer.
According to reports, the US Central Command (CENTCOM) launched additional operations aimed at keeping the Strait of Hormuz open, a critical route for global energy supplies. In a significant escalation, US forces reportedly targeted an oil tanker in the strategic waterway, heightening concerns over further disruptions to oil markets. Meanwhile, President Donald Trump declined to provide a timeline for potential future actions against Iranian infrastructure, adding to geopolitical uncertainty.
Despite these developments, investors are also weighing softer US inflation data. Consumer inflation eased to 3.5% year-over-year in June from 4.2% in May, coming in below the consensus forecast of 3.8%. The weaker CPI reading initially reduced expectations of an imminent Fed rate increase.
Producer inflation data reinforced the disinflationary trend. The annual PPI rate slowed to 5.5% in June from 6.0% previously, missing expectations of 6.2%, while monthly PPI fell 0.3% after a 0.6% rise in May, outperforming forecasts for a flat reading.
As a result, market expectations for a September Fed rate hike eased, with implied odds declining to roughly 44% from 50% a day earlier. However, analysts note that June inflation figures do not yet reflect the economic consequences of the renewed US-Iran conflict, leaving markets cautious about the potential inflationary effects of the latest military escalation.
For the first time in the current market cycle, a silver producer has disclosed concrete figures showing a forced reduction in output, with the decline stemming from China’s mine-safety crackdown rather than changes in silver prices.
Silver is currently trading around $58 an ounce after falling below its early-July low. The metal has dropped about 18% from its year-end 2025 close near $71 and remains roughly 52% below the record high of $121.62 reached on January 29. Even so, silver is still more than 50% higher than it was a year ago. With gold hovering near $4,000 an ounce, the gold-to-silver ratio stands at approximately 69. The recent two-month pullback has largely been driven by macroeconomic forces, including a stronger US dollar and the Federal Reserve’s hawkish stance, while renewed US-Iran tensions have fueled oil prices and inflation concerns, rather than any major shift in silver market fundamentals.
Beneath the recent price weakness, however, the long-term supply outlook remains largely intact. According to Metals Focus and the Silver Institute, the global silver market is expected to record its sixth consecutive annual supply deficit in 2026, with demand projected to exceed production by 46.3 million ounces. A key pillar of the bullish outlook has been the limited ability of silver supply to respond to higher prices. Around three-quarters of global silver production comes as a byproduct of mining for copper, lead, zinc, and gold, making it difficult to significantly increase output simply because silver prices rise. This week provided one of the clearest real-world examples of that constraint, as China’s safety-related mining restrictions forced measurable production cuts despite elevated silver prices.
Silvercorp’s Production Cuts
On June 29, Canadian-listed Silvercorp Metals announced that a tightening mine-safety campaign in China would significantly reduce its production during the July-to-September quarter. Output from its Ying mining district is expected to decline by 40% to 50%, while production at the GC mine is projected to fall by around 50%. Overall, the company estimates a quarterly production decline of 10% to 15%. Based on Silvercorp’s latest annual production of approximately 6.3 million ounces from Ying and 0.5 million ounces from GC, the reductions could remove an estimated 0.9 million to 1.1 million ounces of silver from supply during the affected period.
The significance lies less in the company itself than in the cause of the disruption. The production cuts were not driven by weaker prices or operational decisions but by stricter government safety regulations. Following a fatal coal mine accident in Shanxi Province in late May, Chinese authorities expanded the country’s long-established “Six Major Safety Systems” requirements to cover all underground non-coal mines. The new rules are supported by a nationwide real-time monitoring network overseeing more than one million safety sensors.
For Silvercorp, meeting the updated standards will require roughly $5.5 million in certified safety-system installations over about 50 days, along with an additional $6 million for facility and equipment upgrades. The nearly $11.5 million investment is aimed solely at maintaining regulatory compliance and keeping mines operational, rather than increasing production capacity, effectively raising the cost of every ounce of silver the company continues to produce.
While Silvercorp is only one mining company, the regulations affecting its operations apply to every underground metal mine in China. As a result, the same safety enforcement that forced Silvercorp to scale back production could eventually reduce China’s overall silver output by several million additional ounces, although no confirmed figures beyond Silvercorp’s estimates are available yet. Given China’s position as one of the world’s largest silver producers and an even more significant refining hub, the broader regulatory trend carries greater importance than the impact on any single miner.
What It Means for Silver Investors
The immediate impact should be viewed in perspective. Silvercorp’s estimated production loss of 0.9 million to 1.1 million ounces is relatively modest compared with the roughly 846.6 million ounces of silver mined globally in 2025, representing only slightly more than one-tenth of one percent of annual supply. On its own, the reduction is far too small to meaningfully alter the global supply-demand balance. As such, portraying it as the catalyst for an immediate supply shortage would overstate its significance.
What makes this development significant is not the scale of the production cut but the underlying mechanism. One of the strongest arguments supporting silver’s long-term outlook is that mine supply cannot quickly respond to higher prices. That theory faced a real-world test as silver surged to record highs in early 2026. Instead of increasing, however, production moved in the opposite direction. Supply contracted for reasons unrelated to market prices, as regulatory safety measures forced mines to reduce output. In this case, even substantially higher silver prices could neither prevent the shutdowns nor restore the lost production. If supply continues to tighten under regulatory pressure while remaining largely unresponsive to stronger prices, the industry’s ability to offset the market’s projected sixth consecutive annual deficit becomes even more limited.
The broader significance, therefore, lies in what this episode demonstrates rather than in the number of ounces affected. In Issue #19, I highlighted the growing divergence between a replenished silver inventory in New York and persistently elevated physical premiums in Shanghai, suggesting that Western markets appear well supplied while buyers in Asia continue paying a premium for physical metal. Silvercorp’s production cut adds to that narrative, reinforcing the view that underlying physical tightness may be greater than paper prices imply. While this development does not point to any specific price target, it strengthens the long-term investment case for silver by providing tangible evidence that global mine supply remains structurally constrained and cannot be expanded quickly, even during periods of elevated prices.
Gold stays under selling pressure as a firmer US Dollar and higher oil prices strengthen expectations of a hawkish Federal Reserve.
The upcoming US CPI report and the Fed Chair’s testimony are expected to provide the next key catalyst for gold prices.
Mounting bearish momentum leaves gold vulnerable to a break below the $4,000 mark.
Gold and silver came under heavy selling pressure during the first half of Monday’s trading session. Gold extended last week’s weakness after failing to build on the modest rebound seen the previous week. The broader trend remains bearish. Although the precious metal is still marginally positive for the month, it plunged more than 11% in June, marking its fourth straight monthly decline.
As a result, downside risks continue to dominate, with gold increasingly vulnerable to a break below the key $4,000 support level in the near term.
Rising Oil Prices Keep Pressure on Gold
Renewed geopolitical tensions in the Middle East have driven crude oil prices higher at the start of the week, weighing on global equity markets. While geopolitical uncertainty would typically increase demand for safe-haven assets such as gold, the metal has increasingly moved alongside US equities in recent years, reflecting its growing sensitivity to broader market sentiment rather than its traditional defensive role.
If oil prices continue to climb, inflation concerns are likely to intensify, reinforcing expectations that the Federal Reserve will maintain a restrictive monetary policy. Such a scenario would further weaken gold’s near-term outlook.
Stronger US Dollar Adds to Headwinds
Gold is also facing pressure from a strengthening US Dollar. With the Fed emphasizing its commitment to keeping inflation under control, another surge in energy prices could strengthen expectations that US interest rates will remain elevated for longer. Even if upcoming economic data shows some moderation, persistently high energy costs would likely discourage policymakers from shifting toward a more dovish stance.
This backdrop has helped the US Dollar regain momentum, particularly against currencies such as the euro and Japanese yen, whose economies are more vulnerable to rising energy import costs.
Focus Turns to CPI and Fed Chair Testimony
As oil and natural gas prices remain elevated, markets have become less willing to dismiss the possibility of additional Fed tightening, providing further support for the Greenback while reducing gold’s appeal.
Investor attention now shifts to a busy US economic calendar. Tuesday’s Consumer Price Index (CPI) report is expected to show softer monthly headline inflation, but firm energy costs and stubborn core inflation—still around 2.8% to 2.9% year-over-year—suggest the Fed could still consider another rate increase before year-end.
Markets will also closely monitor Fed Chair Kevin Warsh’s two-day congressional testimony for fresh guidance on the policy outlook. Additional releases, including producer prices, import prices, and retail sales, could further influence market expectations.
Gold Technical Outlook
Technically, gold has repeatedly failed to reclaim the $4,100 level, remaining below both a descending trendline and the 21-day Exponential Moving Average (EMA). The metal is now approaching the critical $4,000 support zone ahead of the US CPI release.
A decisive daily close below $4,000 would likely confirm a bearish breakdown, opening the door toward $3,900, with $3,800 emerging as the next major downside target.
On the upside, initial resistance is located near $4,136, followed by $4,200 and then $4,275.
With energy prices remaining elevated and the US economy showing limited signs of slowing enough to ease inflation concerns, the broader macro backdrop continues to favor the US Dollar. Consequently, non-yielding and low-yielding assets—including gold, the Japanese yen, and the Swiss franc—remain exposed to further downside pressure.
Gold drifts lower as the market’s initial response to Tuesday’s softer-than-expected US inflation data loses momentum. Persistently high oil prices continue to fuel expectations of at least one additional Federal Reserve rate hike, weighing on the non-yielding metal. Meanwhile, escalating tensions between the US and Iran could boost demand for the safe-haven US Dollar, adding further downside pressure to XAU/USD.
Gold (XAU/USD) comes under renewed selling pressure after failing to sustain gains above the $4,100 level in the previous session, though it continues to hold above the key $4,000 psychological support during Wednesday’s Asian trading hours. While softer-than-expected US Consumer Price Index (CPI) data initially weighed on the US Dollar (USD), persistent concerns over energy-driven inflation continue to dominate sentiment. Escalating tensions between the US and Iran, along with the closure of the Strait of Hormuz, have kept crude oil prices elevated, reinforcing inflation fears. Meanwhile, Federal Reserve (Fed) Chair Kevin Warsh reaffirmed the central bank’s commitment to restoring price stability during his first congressional testimony, signaling that another rate hike remains possible before year-end. The hawkish tone largely offsets the impact of a weaker USD and limits demand for the non-yielding precious metal.
Data released by the US Bureau of Labor Statistics showed headline CPI fell by 0.4% in June, marking the steepest monthly decline since April 2020 and falling short of expectations for a 0.1% decrease. Core CPI, which excludes food and energy prices, was unchanged during the month, well below the expected 0.3% increase. On an annual basis, headline inflation eased to 3.5%, while core inflation slowed to 2.6%, both undershooting market forecasts. The softer inflation figures briefly dragged the USD to its weakest level in nearly four weeks as traders pared back expectations for additional Fed tightening. However, the Greenback quickly recovered after Warsh emphasized that the Fed remains firmly committed to combating inflation and highlighted the resilience of the US economy.
At the same time, crude oil prices have climbed to their highest level in nearly a month, increasing concerns that higher energy costs could reignite inflationary pressures and justify further monetary tightening. Reflecting this outlook, the CME FedWatch Tool indicates that markets continue to price in the possibility of one additional Fed rate hike, potentially in September or December. Geopolitical tensions also continue to underpin the USD’s safe-haven appeal. The US carried out another wave of airstrikes on Iranian targets, while Tehran responded by attacking US military facilities across Gulf nations. In addition, President Donald Trump warned that Washington could target Iranian bridges and power infrastructure if Tehran refuses to resume nuclear negotiations.
Overall, the prevailing fundamental backdrop remains supportive of the US Dollar and suggests that downside risks for Gold persist. Investors now await the release of the US Producer Price Index (PPI) and the second day of Fed Chair Kevin Warsh’s congressional testimony for fresh clues on the interest rate outlook. Meanwhile, any new developments in the Middle East conflict are likely to remain a key driver of market sentiment and could trigger heightened volatility across financial markets, particularly in Gold.
Technical Analysis
From a technical perspective, Gold continues to trade within a descending parallel channel and remains firmly below the 200-day Simple Moving Average (SMA), indicating that the broader trend remains tilted to the downside despite the recent recovery. The Moving Average Convergence Divergence (MACD) has crossed into positive territory and continues to improve, signaling a modest pickup in bullish momentum, while the Relative Strength Index (RSI) hovers near the neutral 40.80 mark, suggesting limited buying conviction.
The upper boundary of the descending channel, located around $4,140.69, represents the first significant resistance level. A sustained break above this barrier would be required to weaken the prevailing bearish outlook and open the door for additional gains. On the downside, immediate support is seen near the channel’s lower boundary at $3,718.03. A decisive rebound from this level would be needed to indicate that bearish momentum is fading and that sellers are beginning to lose control of the short-term trend.
Silver prices declined as escalating tensions in the Middle East drove oil prices higher, fueling inflation concerns and reinforcing expectations that the Federal Reserve will keep interest rates elevated for longer.
According to the CME FedWatch Tool, markets now assign a 51% probability to a Fed rate hike in September, compared with a 23% chance that policymakers leave rates unchanged.
Meanwhile, U.S. President Donald Trump reinstated a blockade targeting Iranian vessels and introduced a 20% transit fee on non-Iranian ships using the Strait of Hormuz under U.S. protection.
Silver prices (XAG/USD) extended their decline for a third straight session, trading near $57.60 per troy ounce during Tuesday’s Asian session. The non-yielding precious metal remained under pressure as intensifying tensions in the Middle East pushed crude oil prices higher, raising concerns that stronger energy-driven inflation could keep the Federal Reserve on a restrictive policy path for longer.
Rate expectations have turned increasingly hawkish. According to the CME FedWatch Tool, traders now see a 51% chance of a Fed rate increase in September, while the probability of policymakers leaving rates unchanged has dropped to 23%.
Geopolitical risks escalated after US President Donald Trump reinstated a naval blockade targeting Iranian vessels and ships linked to Iran passing through the Strait of Hormuz. He also announced a 20% transit fee on all other commercial cargo vessels using the strategic shipping route.
Investors are now focused on two key US events scheduled for Tuesday. The June Consumer Price Index (CPI) report is expected to show headline inflation falling 0.1% month-over-month, while core CPI is forecast to remain firm with a 0.3% monthly increase, highlighting persistent underlying price pressures.
Attention will also turn to Federal Reserve Chair Kevin Warsh, who is set to testify before Congress. Market participants will closely scrutinize his remarks for clues on whether Fed officials share the market’s increasingly hawkish outlook and are prepared to keep monetary policy tighter for longer.
Gold prices fell to around $3,995 during Tuesday’s early Asian trading session.
The decline followed President Trump’s decision to reinstate the Iran port blockade and his pledge to impose a 20% levy on cargo transiting the Strait of Hormuz.
Investors are now awaiting the release of the US June Consumer Price Index (CPI), which is expected to be the key market catalyst later on Tuesday.
Gold prices (XAU/USD) continued to trade under pressure, hovering around $3,995 during Tuesday’s early Asian session. The precious metal remained on the defensive as escalating tensions between the United States and Iran reinforced concerns over persistent inflation. Investors are now focused on the release of the US June Consumer Price Index (CPI) and testimony from Federal Reserve Chair Kevin Warsh, both scheduled for later on Tuesday.
According to Bloomberg, US President Donald Trump reinstated the blockade on Iranian vessels passing through the Strait of Hormuz and announced a 20% fee on all other cargo transiting the strategic waterway. Trump also pledged to intensify military action against Iran, stating that the US would continue launching heavy strikes over the coming days.
The renewed blockade raises the risk of retaliation from Tehran, potentially increasing attacks on commercial shipping in the Strait of Hormuz. Such disruptions could fuel higher energy prices, adding to inflationary pressures and reinforcing expectations that the Federal Reserve will keep interest rates elevated for longer. Although gold typically benefits from heightened geopolitical uncertainty, its appeal is often limited in a high-interest-rate environment because it does not generate yield.
Market participants are also awaiting the latest US inflation figures for further policy clues. Economists expect the headline CPI to decline 0.1% month-over-month in June, while core CPI is forecast to increase 0.3% over the same period. If inflation comes in below expectations, the US Dollar could weaken, providing short-term support for dollar-denominated gold prices.
Gold extends its losses, falling more than 1% toward the $4,050 level during Monday’s Asian session as escalating tensions between the United States and Iran boost demand for the safe-haven US Dollar. At the same time, concerns that higher Crude Oil prices could fuel inflation are reinforcing expectations of a Federal Reserve rate hike in 2026, strengthening the Greenback further and adding pressure on the non-yielding precious metal.
Fundamental Analysis
Gold remains under heavy selling pressure at the beginning of the week as the US Dollar strengthens, supported by a sharp rebound in Oil prices and renewed inflation concerns that reinforce expectations of a hawkish stance from the Federal Reserve.
The move follows a fresh escalation of tensions in the Middle East after the United States launched additional strikes against Iran on Sunday. In response, Iran reportedly targeted US facilities across Gulf states and reiterated the closure of the strategically important Strait of Hormuz.
Rising inflation worries have also contributed to Gold’s weakness after the Fed highlighted increasing price pressures in its semi-annual Monetary Policy Report released on Friday. The central bank noted that inflation accelerated further this spring, driven by the combined effects of tariffs, higher energy costs linked to the conflict, and continued investment in artificial intelligence infrastructure.
Market participants remain cautious ahead of Tuesday’s release of the US Consumer Price Index (CPI) report and Federal Reserve Chair Kevin Warsh’s first semi-annual testimony before Congress.
For now, traders are expected to keep a close eye on developments surrounding the US-Iran conflict and fluctuations in Oil prices for fresh market direction. From a technical perspective, the bearish outlook for Gold remains intact, with downside risks continuing to dominate the near-term picture.
Technical Analysis
On the daily timeframe, Gold (XAU/USD) is trading near $4,069, maintaining a bearish short-term bias as it remains below both the 21-day SMA at $4,128 and the 50-day SMA at $4,344. The longer-term technical outlook also continues to favor sellers, with the 200-day SMA at $4,495 and the 100-day SMA at $4,583 positioned well above current market levels. Meanwhile, the RSI near 41 suggests bearish momentum is still present, although selling pressure appears to be moderating rather than reaching oversold territory.
On the upside, the first resistance zone is located around the 21-day SMA at $4,128. A sustained move higher could then target the 50-day SMA near $4,344, followed by the 200-day SMA around $4,495 and the 100-day SMA near $4,583. With no significant moving-average support levels immediately beneath the current price, any rebound attempt remains fragile while Gold continues to trade below this cluster of resistance levels. Unless buyers can regain control above the 21-day SMA, the broader risk profile remains tilted toward further downside pressure.
Gold tumbles toward $4,070 during Monday’s Asian session after fresh US missile strikes on Iran, while investors await Tuesday’s US CPI data.
Gold (XAU/USD) came under renewed selling pressure during Monday’s early Asian session, slipping toward the $4,070 level as escalating tensions between the United States and Iran weighed on market sentiment. Investors are now turning their attention to Tuesday’s release of the US June Consumer Price Index (CPI), which could provide fresh direction for both the US dollar and precious metals.
According to reports, the US military carried out additional strikes against Iran on Sunday, targeting capabilities believed to be linked to attacks on civilian vessels passing through the Strait of Hormuz. The US Central Command (CENTCOM) stated that the operation was intended to reduce Iran’s ability to threaten commercial shipping in the strategically important waterway.
The ongoing exchange of missile strikes between Washington and Tehran has fueled concerns over higher energy prices and a potential resurgence in inflationary pressures. As a result, expectations have strengthened that the Federal Reserve may keep interest rates elevated for longer. While gold is traditionally viewed as a safe-haven asset during periods of geopolitical uncertainty, its appeal can diminish when interest rates remain high because the metal does not generate yield.
Market participants are also closely monitoring the upcoming US CPI report. Economists expect headline inflation to fall by 0.1% month-over-month in June, while core CPI is forecast to increase by 0.3%. A weaker-than-expected inflation reading could undermine the US dollar and provide support for gold prices in the short term.
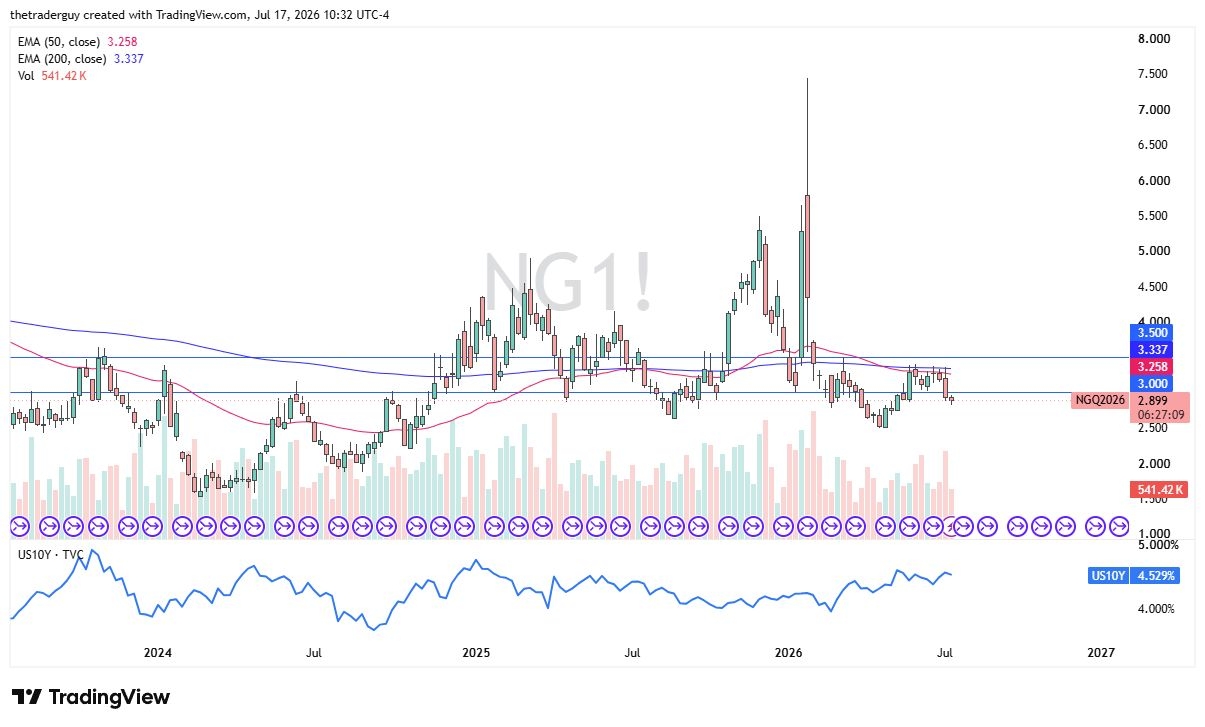
Natural gas came under strong selling pressure during the week, with prices breaking below the key $3.00 level on Friday. While this move points to continued bearish momentum in the near term, the scope for further declines may be relatively limited.
Seasonal patterns typically keep the natural gas market confined within a broad trading range during this period of the year. Although the overall bias tends to remain slightly negative, any upward moves should still be approached cautiously due to soft demand conditions. Unless unusually high temperatures trigger a surge in electricity consumption, demand for natural gas is unlikely to strengthen significantly.
As the primary heating season remains several months away in the United States, the market lacks a major catalyst for sustained gains. Consequently, natural gas prices are likely to remain range-bound for the time being, with traders awaiting stronger seasonal demand later in the year.
WTI Crude Oil
WTI crude oil posted a modest gain over the week, although much of the earlier strength was driven by market reactions to U.S. strikes on Iran. Since then, a large portion of those gains has been erased, indicating that the market remains uncertain about its next directional move.
At present, crude oil appears to be settling into a typical summer trading range as traders assess geopolitical developments alongside broader supply and demand dynamics. The $68 level may emerge as an important support zone, potentially providing a floor for prices if selling pressure persists.
For now, the market seems more likely to consolidate than trend decisively in either direction. A period of sideways trading over the next week or two could help establish a clearer range before the next significant move develops.
Gold
Gold prices spent much of the week under pressure, but the key development was the market’s successful defense of the $4,000 level. The strong rebound from this area reinforces its importance as a major support zone and suggests that buyers remain active on dips.
While the recovery is encouraging for bullish sentiment, it remains uncertain whether the upward momentum can be sustained in the near term. Traders will likely continue to monitor broader macroeconomic factors, particularly movements in the U.S. dollar, for clues about gold’s next direction.
A weaker dollar could provide additional support for the precious metal by improving its appeal to international investors. Conversely, renewed strength in the greenback may limit further gains and keep gold trading within its recent range.
EUR/USD
The euro ended the week lower but managed to hold above the important 1.1400 support area, suggesting that buyers are still defending this level despite recent weakness. While the overall tone remains somewhat bearish, the next few trading sessions should provide greater clarity regarding the pair’s near-term direction.
Market participants will be closely watching price action around current levels to determine whether support can continue to hold. A sustained move below 1.1400 would likely reinforce downside pressure and shift attention toward lower technical targets.
Should the pair break decisively beneath support, the 1.1200 region could become the next key area of interest. This level aligns with the projected target from a bearish flag formation on the daily chart and is further supported by the presence of the 200-week Exponential Moving Average, making it a potentially significant zone for buyers to re-enter the market.
USD/CAD
The U.S. dollar traded in a relatively choppy manner against the Canadian dollar throughout the week, reflecting ongoing uncertainty surrounding Canada’s economic outlook and broader market sentiment. Price action remains confined within a historically significant area that previously served as the starting point of a major breakdown in early 2025, which helps explain the market’s current lack of directional conviction.
Given the technical backdrop, a near-term pullback would not be surprising. Even if prices retreat, demand could emerge on dips, particularly as the pair approaches lower support levels where buyers have previously shown interest.
The 1.4000 region remains a key support zone and may continue to act as a solid floor due to the substantial amount of historical trading activity associated with it. On the upside, a move toward 1.4500 remains possible, although the market will likely require a stronger fundamental or macroeconomic catalyst before such a rally can gain momentum.
USD/MXN
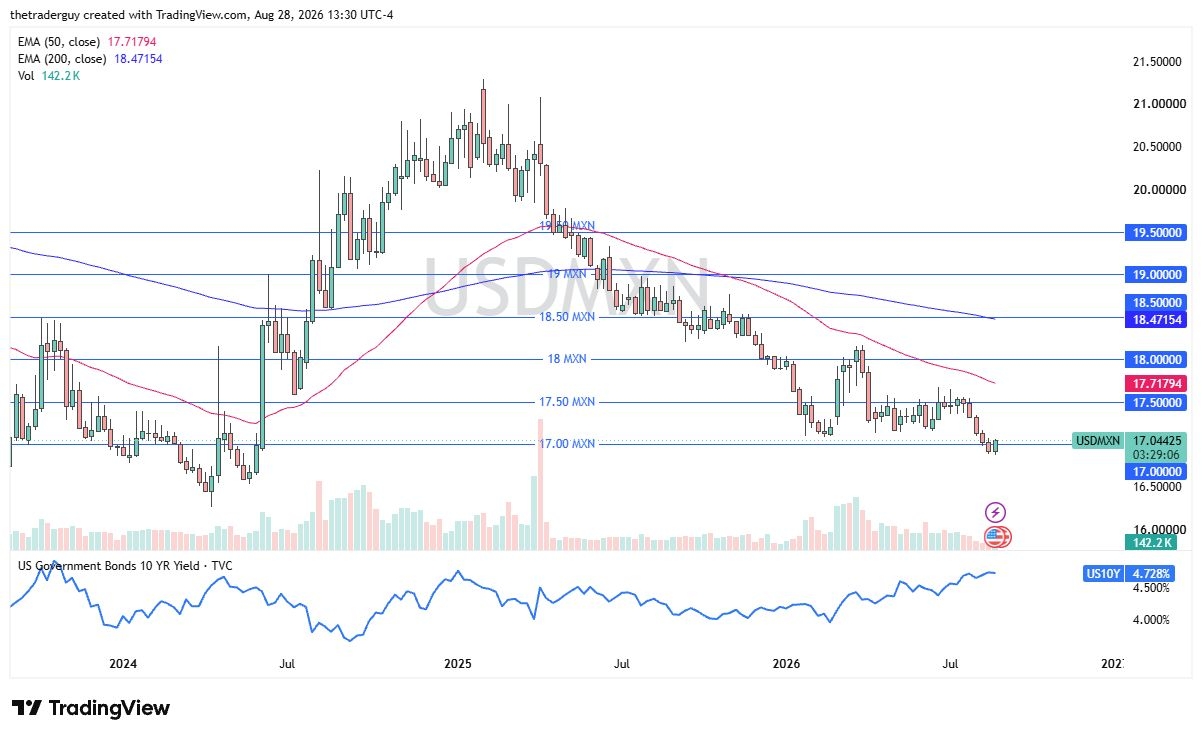
USD/MXN spent much of the week moving sideways, with the pair continuing to hover around the 17.50 level. This area is particularly noteworthy from a technical perspective, as it previously acted as a significant resistance zone and may now play an important role in determining the market’s next directional move.
Traders will be watching closely to see whether the pair can establish momentum above current levels. A breakout beyond this week’s high could open the door for a move toward the 18.00 mark, which represents the next major psychological resistance level.
Despite this potential upside scenario, the broader fundamental backdrop continues to favor the Mexican peso due to the interest rate differential between the two countries. As a result, the longer-term bias may still lean toward USD/MXN weakness. However, clearer bearish price signals would likely be needed before a convincing short-selling opportunity emerges.
Silver
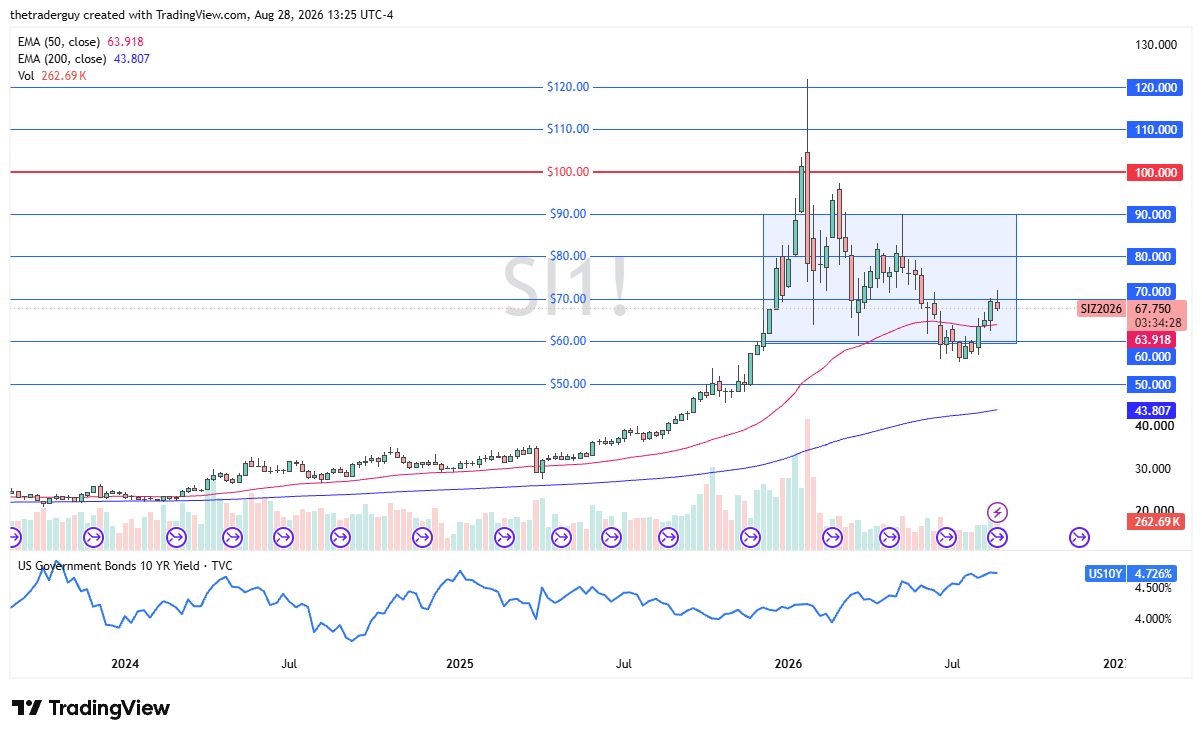
Silver experienced a sharp decline during the week, briefly falling below the critical $60 level before recovering and attracting renewed buying interest. Despite the rebound, the metal remains in a vulnerable position, with the $60 area continuing to serve as a key battleground between buyers and sellers.
While silver has managed to stabilize for the moment, the broader outlook remains cautious. Sustained upside momentum may prove difficult unless supported by a more favorable macroeconomic environment, particularly through lower U.S. interest rates or a weakening U.S. dollar.
From a technical standpoint, the $57 level represents an important support zone. A decisive break below this area could trigger additional selling pressure and pave the way for a deeper decline toward the $50 mark. Until stronger bullish catalysts emerge, traders are likely to remain focused on downside risks and broader market conditions.
GBP/USD
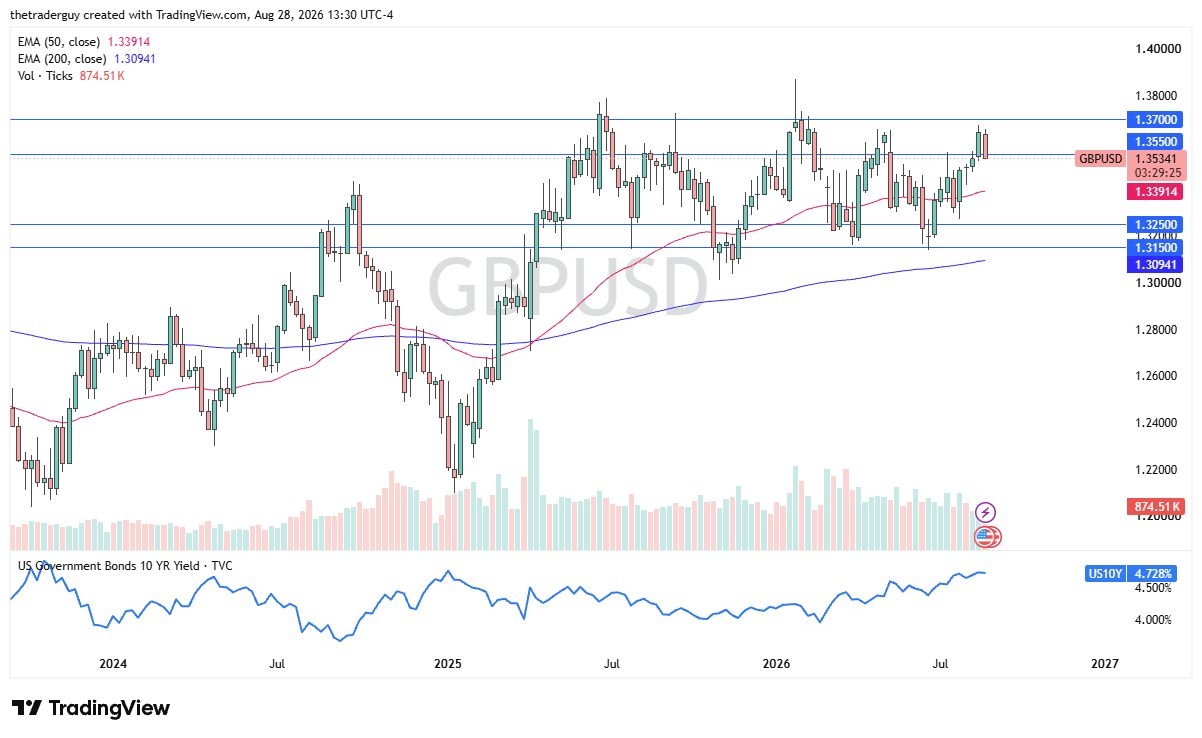
The British pound advanced over the course of the week, although gains remained capped near the 1.3450 region. This area continues to act as a significant resistance zone, with selling pressure likely extending toward the psychologically important 1.3500 level.
While the broader trend has shown signs of resilience, the pair has yet to generate enough momentum to break convincingly above resistance. As a result, traders may remain cautious until a clearer directional signal emerges.
For the time being, GBP/USD appears likely to remain within a broader trading range. In this environment, short-term rallies that begin to lose momentum could present opportunities for sellers, particularly if resistance levels continue to hold and market conditions fail to support a sustained breakout.
Gold prices drew renewed attention as geopolitical tensions in the Middle East intensified. On Thursday, the United States carried out a new round of airstrikes against Iran, prompting Tehran to retaliate with attacks on targets across the Persian Gulf. The latest exchange of military action has raised concerns over the stability of the already fragile ceasefire agreement between the two nations.
Since the framework truce was signed in June, periodic flare-ups followed by temporary pauses in fighting have become a familiar pattern, casting doubt on the durability of the accord. Washington and Tehran have repeatedly accused one another of breaching the agreement.
Earlier in the week, gold futures came under heavy pressure after President Donald Trump declared that the ceasefire was effectively “over” and stated that he no longer wished to engage with Iran. Speaking to reporters following a NATO summit in Türkiye on Wednesday, Trump’s remarks contributed to a sharp sell-off that drove gold futures down to an intraday low of $4,032.56, narrowly holding above key support at $4,030.51. The metal later recovered some losses and settled at $4,082.24.
Gold also found support from the minutes of the Federal Reserve’s June policy meeting. The report revealed a divide among policymakers regarding the need for further interest-rate increases, fueling market expectations that borrowing costs could be reduced later in the year. Such a scenario is generally favorable for gold, as lower rates reduce the opportunity cost of holding non-yielding assets.
At the same time, the Fed minutes highlighted ongoing concerns about stubborn inflationary pressures. Inflation has remained elevated since the outbreak of the U.S.-Iran conflict in late February and continues to run well above the central bank’s 2% target. As a result, policymakers may be reluctant to move aggressively toward rate cuts despite growing expectations for monetary easing.
Key Technical Levels to Monitor
On Thursday, gold futures opened at $4,085.90 and advanced to an intraday high of $4,145.40, briefly surpassing the resistance level that capped gains the previous day. After retreating to a low of $4,063.40, prices rebounded and were trading around $4,138 at the time of writing. Despite the recovery, questions remain about the sustainability of the move, given the broader bearish factors that continue to weigh on the market.
Daily Chart Outlook
On the daily timeframe, gold futures are attempting to remain above the important support level at $4,125.61. However, the metal continues to encounter strong selling pressure beneath the immediate resistance at $4,144.72. Concerns over energy-driven inflation remain a key headwind, while U.S. Treasury yields have stayed close to multi-week highs and eurozone bond yields are hovering near one-month peaks. These elevated yields have been supported by heightened geopolitical tensions in the Middle East, limiting gold’s upside potential.
1-Hour Chart Outlook
From an intraday perspective, gold has managed to hold above the 200-period Exponential Moving Average (EMA) at $4,117.92 for the past several hours, indicating that near-term support remains intact. Nevertheless, the metal has struggled to establish a foothold above the key resistance level at $4,144.72.
The emergence of a bearish hourly candle has pushed prices back toward $4,137, suggesting that selling interest has increased during the past six hours. Adding to the cautious outlook, the 100-period EMA remains below the 200-period EMA, maintaining a bearish crossover on the hourly chart. This technical setup indicates that downside risks persist unless buyers can secure a sustained break above resistance in the sessions ahead.
Escalating tensions between the US and Iran drove oil prices higher, reigniting inflation worries and dampening investor sentiment.
A stronger US Dollar continues to weigh on EUR/USD, with geopolitical uncertainty taking precedence over economic fundamentals.
Investors are looking ahead to the Fed minutes for policy clues, although developments in the Middle East remain the primary catalyst for market direction.
After a turbulent first half of the year marked by the US-Israel conflict with Iran and President Trump’s frequent policy reversals, investors were hoping for a quieter period as the summer holiday season approached. Instead, geopolitical tensions appear to be resurfacing.
Oil prices have climbed sharply over the past few sessions, recovering to levels last seen before the conflict. While Trump may later attempt to ease market concerns with softer rhetoric, the immediate reaction has been a renewed focus on geopolitical risks.
My view is that Trump is unlikely to favor a major escalation, which could limit the magnitude of any oil rally compared with the dramatic price swings witnessed during the peak of the conflict earlier this year. However, his recent remarks have undeniably heightened concerns over potential supply disruptions from Iran and the broader Middle East. In particular, markets are once again watching the possibility of Tehran restricting traffic through the Strait of Hormuz, a critical global energy chokepoint.
The coming days should provide greater clarity on how the situation develops, but for now, there is a growing risk that markets could find themselves facing a familiar geopolitical backdrop once again.
Fed Minutes Likely to Take a Back Seat as Geopolitical Risks Return
Markets initially appeared to shrug off the renewed tensions between the US and Iran earlier this week, but sentiment has shifted noticeably. As geopolitical concerns intensify, investors are likely to pay less attention to incoming macroeconomic data. While the minutes from the Federal Reserve’s June meeting are due later today and are expected to reaffirm a hawkish policy stance, supporting the US Dollar, the market’s primary focus has returned to oil prices and their implications for inflation and interest-rate expectations.
Investor sentiment deteriorated after President Trump’s remarks at the NATO summit unsettled financial markets, prompting a broad risk-off move that weighed on European equities and US stock futures. Addressing reporters, Trump stated that the memorandum of understanding with Iran was no longer valid and referred to Iranian leaders in highly critical terms, signaling a tougher stance toward Tehran.
The change in rhetoric has significantly reduced hopes for renewed diplomatic engagement. Only a few days ago, expectations were growing that both Washington and Tehran would maintain restraint ahead of another round of negotiations. Instead, concerns over renewed confrontation have resurfaced, placing geopolitical risks back at the forefront of market attention.
Euro Lacks Clear Catalysts Amid Mixed Fundamental Signals
The euro continues to face a challenging outlook as conflicting economic and geopolitical factors shape market sentiment. On the positive side, Germany’s industrial production data surprised to the upside, with output increasing by 0.9% in May, supported by stronger activity in the automotive and construction sectors.
The data suggests that Europe’s industrial economy has remained relatively resilient despite recent geopolitical uncertainty. However, the renewed escalation of tensions in the Middle East threatens to push energy costs higher once again, potentially weighing on economic growth across the region. At the same time, investors remain divided over the European Central Bank’s policy path, with expectations for a September rate hike no longer representing the market’s base-case scenario.
Nevertheless, ECB policymakers are unlikely to signal an end to the inflation fight while geopolitical risks remain elevated. Underlying price pressures continue to run above desired levels, prompting officials to maintain a cautious and data-dependent stance. Comments from senior ECB members this week may reinforce that message, providing intermittent support for the euro. Even so, such support could prove limited as the US Dollar continues to benefit from safe-haven demand and expectations that US interest rates will remain elevated for longer.
EUR/USD Technical Analysis
From a technical standpoint, EUR/USD remains trapped in a consolidation phase, although the near-term bias appears to favor the downside. The pair is currently hovering around the key 1.1400 support zone. A sustained break below this level could open the door for a deeper pullback toward the 1.1300 region.
On the upside, resistance is initially seen near 1.1450. If buyers manage to push the pair above this barrier, attention would shift to the psychological 1.1500 level, followed by the next major resistance around 1.1575.
At present, a stronger bullish move in EUR/USD would likely require a meaningful change in expectations surrounding Federal Reserve policy or a notable weakening in US economic conditions. With neither scenario appearing likely in the near term, investors continue to favor the US Dollar, supported by its yield advantage and renewed geopolitical concerns stemming from rising US-Iran tensions, which have also helped sustain higher oil prices.
WTI is trading within a narrow range as investors remain cautious amid conflicting signals from the US and Iran.
Ongoing exchanges of fire between the US and Iran continue to fuel geopolitical concerns, providing underlying support for crude oil prices.
However, market anxiety has eased after US President Donald Trump stated that Iran is willing to negotiate a deal, limiting further gains in WTI.
West Texas Intermediate (WTI), the US benchmark for crude oil, remains stable during Friday’s Asian trading session after recovering from the previous day’s decline. Mixed signals from Washington and Tehran have encouraged traders to stay on the sidelines, with prices hovering near $71.75 and showing little change on the day as markets await fresh developments in the Middle East.
Geopolitical concerns returned to the forefront this week after the US launched a new round of military strikes against Iran in response to attacks on commercial vessels transiting the Strait of Hormuz. Tehran retaliated by targeting regional US allies and striking American military facilities in Bahrain and Kuwait. Adding to the tensions, US President Donald Trump announced on Wednesday that the ceasefire was effectively over, helping drive crude prices higher earlier in the week.
However, sentiment improved on Thursday after Trump stated that Iran had reached out seeking negotiations to prevent further escalation. A White House official also reaffirmed Washington’s commitment to the existing memorandum of understanding with Tehran. These developments, combined with OPEC+’s decision to raise production targets once again, may limit upside momentum in oil prices and prompt traders to remain cautious about initiating new bullish positions.
Meanwhile, the latest report from the US Energy Information Administration (EIA) showed an unexpected increase in crude inventories for the week ending July 3, marking the first stockpile build in eleven weeks. Commercial crude inventories climbed by 2.998 million barrels, well above market expectations. The larger-than-forecast increase could continue to weigh on prices, although WTI remains on track to post a modest weekly gain and potentially end a four-week losing streak.
Gold prices edge higher toward the $4,120 mark during Friday’s early Asian trading session. The precious metal finds support after US officials indicated that Washington remains committed to its memorandum of understanding (MOU) with Iran, despite President Trump’s statement that the agreement is “over.” However, expectations that the Federal Reserve will maintain a hawkish policy stance could limit further gains in Gold.
Gold prices rebounded to around $4,120 during Friday’s early Asian session as investors assessed the risk of renewed conflict in the Middle East. Demand for the safe-haven metal strengthened amid persistent geopolitical uncertainty surrounding the US-Iran situation.
The White House indicated that it remains committed to the memorandum of understanding (MOU) with Iran, despite President Donald Trump’s recent statement that the framework agreement aimed at ending the conflict was “over” following Iranian attacks on vessels in the Strait of Hormuz and neighboring countries.
Nevertheless, tensions remain elevated. Trump warned that military action would intensify if Iran launched further attacks on shipping in the strait. On Thursday, Iran reportedly targeted US military bases in Bahrain, Kuwait, and Qatar, while Jordan intercepted eight missiles fired by Tehran, according to Axios.
Rising hostilities between the US and Iran have fueled concerns over potential disruptions to global oil supplies. Higher crude oil prices could increase inflationary pressures, potentially prompting the Federal Reserve to keep interest rates elevated for a longer period, which may limit Gold’s upside.
Meanwhile, minutes from the Fed’s June policy meeting—the first chaired by Kevin Warsh—revealed significant disagreement among policymakers regarding the future path of interest rates. While many officials suggested that the federal funds rate could end the year within or slightly below its current range, others argued that rates may need to remain above current levels, reflecting continued uncertainty over the inflation outlook.
WTI crude oil prices drift lower on Thursday, ending a two-session advance that had lifted the commodity to its highest level in more than two weeks. Technical signals remain mixed, suggesting traders should exercise caution before committing to strong directional positions. Meanwhile, a decisive break above the 200-day Exponential Moving Average (EMA) is required to challenge the prevailing near-term bearish outlook.
West Texas Intermediate (WTI), the US benchmark crude oil, struggles to build on its recent two-day advance that pushed prices to their highest level in more than two weeks on Wednesday. During Thursday’s Asian session, the commodity trades modestly lower, though selling pressure remains limited, with prices hovering just above $74.00 and down roughly 0.65% on the day.
From a broader technical perspective, the latest rebound from the late-February low has lost momentum near the 23.6% Fibonacci retracement of the May-to-July decline. WTI also remains below its 200-day Exponential Moving Average (EMA), preserving a bearish near-term outlook. Furthermore, mixed momentum indicators suggest that recent gains are more likely corrective in nature rather than signaling a meaningful trend reversal.
The MACD has crossed into positive territory and remains above the zero line, indicating improving bullish momentum. However, the RSI is still near 44, highlighting relatively subdued buying interest. As a result, even if prices break above the immediate Fibonacci barrier at $75.69, upside progress could be constrained by resistance around the 200-day EMA at $77.27. A decisive move above that level would strengthen the case for a broader recovery.
Beyond the 200-day EMA, additional resistance levels emerge at the 38.2% retracement near $81.23 and the 50% Fibonacci level around $85.71. Further bullish extension could target the 61.8% retracement at $90.19, followed by higher retracement zones at $96.56 and $104.69. On the downside, key support remains at the recent cycle low of $66.73, where selling pressure may ease should the broader bearish trend regain control.
Gold remains under pressure as buyers stay cautious despite a weaker US Dollar. Escalating US-Iran tensions, persistent inflation concerns, and expectations of further Fed tightening continue to support the greenback, while the technical outlook suggests bullion could face additional downside.
Gold (XAU/USD) extends its decline for a fourth consecutive session on Thursday, hovering near the one-week low around $4,020 reached the previous day. Renewed conflict between the United States and Iran has reignited inflation concerns and strengthened expectations that the Federal Reserve could resume tightening policy in 2026, weighing on the non-yielding precious metal during Asian trading. However, a softer US Dollar, pressured by the absence of a strongly hawkish signal in the latest FOMC Minutes, is helping to cushion gold’s losses.
The minutes from the Federal Reserve’s June 16–17 meeting, released Wednesday, showed policymakers remain divided on the future path of interest rates. Several officials suggested that the federal funds rate could end the year at or slightly below its current level. Combined with last week’s weaker-than-expected US Nonfarm Payrolls report, the minutes did little to significantly shift market expectations. Nonetheless, Fed officials emphasized that inflation risks remain skewed to the upside and acknowledged that further policy tightening may be necessary to bring inflation back toward the 2% target.
Market participants continue to assign roughly a 70% probability to a Fed rate hike in September. That outlook, together with escalating tensions in the Middle East, is preventing a deeper decline in the US Dollar. The latest developments saw US forces launch additional strikes against Iran following attacks on commercial vessels in the Strait of Hormuz. Tehran responded with continued strikes on US military assets in Bahrain and Kuwait, while President Donald Trump declared on Wednesday that the ceasefire with Iran had effectively ended.
Against this backdrop, the broader fundamental picture remains supportive of the US Dollar and suggests that any rebound in gold could face selling pressure. Investors are now awaiting US Weekly Initial Jobless Claims data and remarks from key Federal Reserve officials for fresh policy clues. Even so, market attention is likely to remain focused on developments in the Middle East, which could continue to drive volatility across global markets and create significant trading opportunities in gold.
Gold Daily Chart
Gold may continue to struggle in attracting significant buying interest as the technical outlook remains tilted to the downside.
From a chart perspective, XAU/USD retains a bearish near-term structure, trading below its 200-day Simple Moving Average (SMA) and remaining confined within a descending channel. Although the Moving Average Convergence Divergence (MACD) indicator has crossed into positive territory and the Relative Strength Index (RSI) has improved to 40.26 from previously oversold levels, momentum remains relatively weak. As a result, any recovery attempt could encounter stiff resistance near the upper boundary of the channel around $4,247.94.
For sentiment to improve meaningfully, gold would need to break decisively above the channel resistance, with the next major hurdle located at the 200-day SMA near $4,492.08. On the downside, immediate support is seen at the lower edge of the descending channel around $3,811.93. A move toward that area could attract renewed buying interest from longer-term bulls seeking to preserve the broader upward trend if the current corrective phase deepens further.
Regardless of any assistance the US team received, the outcome against Belgium remained unchanged: elimination from the tournament.
Clearly, no matter what support governments provide to their fiat currencies in the battle against gold, the outcome remains the same: a knockout victory for gold.
A glance at the weekly chart highlights the strength of the technical setup, particularly the impressive positioning of the 14,5,5 Stochastics oscillator.
I recently recommended accumulating gold, silver, and mining stocks in the $4,100–$3,900 range while maintaining ample cash reserves to take advantage of any deeper pullback toward the $3,500–$3,200 area.
With those purchases now completed, investors can reasonably look forward to a recovery phase, with prices potentially advancing toward the initial profit-taking zone between $4,800 and $5,000.
What are the main obstacles facing gold? The conflicts in Iran and Ukraine have prompted some central banks to tap into their gold reserves, using bullion accumulated for difficult times. That selling has partially offset continued purchases by other central banks.
Meanwhile, the Indian government has taken a different approach. Rather than liquidating its own gold holdings, it has imposed tariffs and taxes that discourage gold ownership and purchases, potentially reducing demand by an estimated 50–75 tonnes per month.
In the West, many analysts continue to focus almost exclusively on gold’s lack of yield. Despite the metal’s remarkable advance from roughly $1,800 to $5,600 while interest rates remained around 4.5%–5%, they persist in arguing that higher rates are inherently bearish for gold.
This narrative overlooks a key contradiction: governments face growing challenges servicing massive debt burdens as interest costs rise, yet investors are often told to abandon gold and funnel capital into that same debt.
The issue is further complicated by official inflation measures such as CPI, PPI, and PCE, which many critics argue fail to fully reflect the inflation experienced by households. As a result, reported real interest rates may appear stronger than they are in practice.
Overall, the balance of probabilities now favors a move toward the $4,800–$5,000 range rather than a decline to $3,500–$3,200. However, central bank sales, weaker Indian demand, and persistent skepticism from Western analysts could keep gold’s advance gradual and uneven.
Many Western analysts also encourage investors to rotate out of gold, silver, and mining shares and into what they view as an increasingly expensive U.S. equity market—a strategy that carries significant risks.
Major bear markets often begin beneath the surface, with the more speculative stocks and broader secondary indexes weakening first while the Dow Jones Industrial Average continues to advance. That pattern appears to be unfolding today.
Investors holding these speculative names are frequently reassured that the Dow’s strength is evidence of a healthy market. The common belief is that their highly valued stocks will eventually catch up with the stronger-performing, more reasonably valued blue-chip shares and push to fresh highs.
Seasonally, July has historically been a favorable month for equities, while the August-to-October period has earned a reputation as a more volatile stretch and is often associated with major market corrections.
As speculative stocks lose momentum and the Dow continues to climb, rising valuation measures such as the Shiller CAPE ratio may signal growing market risk. In that environment, investors who have chased recent price gains rather than focusing on fundamentals could become increasingly vulnerable to a broader market downturn.
The silver chart continues to look exceptionally strong. In healthy bull markets, prices often find support before reaching widely recognized support zones, reflecting underlying buying pressure. Silver appears to be exhibiting that behavior at present.
The $50 level in silver roughly corresponds to the $4,000 area in gold, making both zones attractive from a value perspective. When markets enter these perceived value ranges, investors may benefit more from gradually building positions than from trying to pinpoint the exact bottom.
Rather than waiting for a perfect entry or a definitive final low, a disciplined approach of modest accumulation at attractive valuations can often prove more effective over the long term.
What about mining stocks? The daily CDNX chart continues to offer an encouraging technical picture. The market has already delivered several strong rebounds from the three accumulation zones established during the current consolidation phase.
The key question now is whether that consolidation has run its course and is setting the stage for a much larger advance. While no outcome is guaranteed, the evidence currently points to that being the higher-probability scenario.
Notably, the decline since mid-April has unfolded as a gradual drift lower rather than a sharp, panic-driven selloff. This type of slow, grinding weakness is often characteristic of consolidations nearing completion, as selling pressure gradually fades and the market prepares for its next directional move.
The GDX chart remains highly impressive from a technical perspective. A large bullish wedge pattern appears to be developing, with the ETF positioned near what many technicians would consider an ideal breakout zone. At the same time, silver is rebounding from the $50 support area, while gold continues to recover from the $4,000 region.
Fundamentally, many major mining companies are also in strong financial condition. Industry leaders such as Barrick Gold and Newmont maintain conservative balance sheets, with debt-to-equity ratios below 0.20, providing a solid financial foundation.
Taken together, the technical and fundamental backdrop remains constructive for both senior and junior gold miners. While risk management remains essential, current conditions suggest an environment that may favor gradual accumulation rather than excessive caution.
Silver extends its decline for a third straight session on Wednesday.
The prevailing technical structure continues to favor sellers, supporting the prospect of additional downside.
A decisive break below the lower boundary of the channel would strengthen the bearish bias and confirm further losses.
Silver (XAG/USD) remains on the defensive for a third consecutive session on Wednesday, trading around the $59.80 area during Asian hours. Despite the weakness, the metal continues to find support near the lower boundary of a short-term descending channel in the mid-$59.00s, close to Tuesday’s weekly low.
From a broader technical perspective, the descending channel resembles a bearish flag pattern following the recent sharp decline. Repeated rejections near the 100-period Simple Moving Average (SMA) on the 4-hour chart further reinforce the prevailing downside bias, suggesting sellers retain control of the near-term trend.
Momentum indicators also lean bearish. The MACD remains in negative territory at -0.33, while the Relative Strength Index (RSI) hovers near 44.16, indicating room for additional losses. Nevertheless, a decisive breakdown below channel support is still required to confirm a deeper corrective move.
Should sellers gain traction below the mid-$59.00 region, XAG/USD could slide beneath the $59.00 psychological level and target the next support zone around $58.35-$58.30, followed by $58.00. Further weakness may expose the $57.25 area, with the decline potentially extending toward $57.00 and the year-to-date low near $55.70 recorded in June.
On the upside, the first significant barrier is the 100-period SMA at $62.32. A sustained move above this level could trigger a test of the upper boundary of the descending channel near $64.21. Only a clear breakout above these resistance levels would negate the current bearish structure and improve the short-term outlook for silver.
Gold attracts modest buying interest as traders turn cautious on the US Dollar ahead of the release of the FOMC Minutes. However, renewed hostilities between the US and Iran, coupled with expectations that the Federal Reserve will maintain a hawkish stance, could continue to underpin demand for the safe-haven Greenback. At the same time, rising inflation concerns are driving US Treasury yields higher, limiting the appeal of the non-yielding precious metal and potentially capping further upside.
Gold (XAU/USD) edges higher during Wednesday’s Asian session, snapping a two-day losing streak after retreating to weekly lows below $4,100 in the previous session. The precious metal finds support as the US Dollar struggles to extend recent gains, with investors adopting a cautious stance ahead of the release of the June FOMC Minutes. Nevertheless, the broader backdrop suggests caution, as it remains unclear whether the recent pullback from Monday’s two-week high above $4,200 has fully run its course.
Geopolitical tensions remain elevated after the United States launched fresh strikes against Iran in response to reported attacks on oil tankers in the Strait of Hormuz, putting the fragile ceasefire at risk. The escalation has reinforced demand for the US Dollar’s safe-haven and reserve-currency appeal, limiting Gold’s upside potential. Adding to market concerns, Washington revoked a key exemption that had allowed Iran to export oil, fueling a sharp rally in crude prices and reviving fears of energy-driven inflation. These developments strengthen expectations that the Federal Reserve will maintain a restrictive monetary policy stance for longer.
Markets continue to anticipate further Fed tightening, with CME FedWatch data indicating an over 80% probability of at least one additional 25-basis-point rate hike before year-end. Expectations for a hawkish tone in the upcoming FOMC Minutes have also lifted Treasury yields, with the benchmark 10-year yield rising to 4.567% and the two-year yield climbing to 4.189%. Higher yields enhance the appeal of the Dollar while reducing demand for non-yielding assets such as Gold. As a result, despite the current rebound, traders may seek stronger follow-through buying before concluding that a sustainable bullish move in XAU/USD is underway.
Gold Daily Chart
From a technical standpoint, Gold continues to trade within a descending channel and remains below its 200-day Simple Moving Average (SMA), preserving a bearish near-term outlook. Although the Moving Average Convergence Divergence (MACD) has crossed into positive territory, signaling a potential recovery attempt, the Relative Strength Index (RSI) remains subdued at 44.33 and below the neutral 50 level, suggesting that bullish momentum is not yet strong enough to confirm a lasting trend reversal.
As a result, any upside move is likely to encounter significant resistance. Initial selling pressure could emerge near the upper boundary of the descending channel around $4,164.35. To shift the broader technical outlook toward a more constructive stance, Gold would need to break decisively above this level and then clear the key 200-day SMA at $4,491.30, which remains a major resistance barrier.
On the downside, the channel’s lower boundary near $3,713.85 serves as the first important support zone. A failure to sustain the current rebound could expose Gold to renewed downside pressure, with buyers likely to step in around this area in an effort to defend the longer-term trend floor. Until a decisive breakout occurs, the broader technical picture continues to favor selling into strength rather than chasing rallies.
Gold comes under renewed selling pressure as resurging inflation concerns push US Treasury yields higher, reducing the appeal of the non-yielding metal.
However, fading expectations of additional Federal Reserve rate hikes continue to limit upside momentum in the US Dollar, which could help cushion gold’s downside in the near term.
From a technical perspective, price action remains biased to the downside, with chart signals favoring bearish traders and suggesting the potential for further declines.
Gold (XAU/USD) remains under modest selling pressure during Tuesday’s European session, though prices continue to hold above the $4,100 level. Renewed tensions in the Strait of Hormuz have pushed crude oil prices higher, fueling concerns that elevated energy costs could reignite inflationary pressures. As a result, US Treasury yields have moved higher, lending support to the US Dollar and reducing demand for the non-yielding precious metal for a second consecutive day.
Geopolitical risks remain elevated after Iran reaffirmed its intention to impose fees on vessels passing through the Strait of Hormuz, arguing that the charges are linked to security oversight and environmental protection rather than transit tolls. Adding to market concerns, an oil tanker was reportedly hit by an unidentified projectile while navigating the strategic waterway, highlighting the fragility of the current US-Iran ceasefire arrangement and helping keep oil prices supported.
At the same time, softer-than-expected US labor market data has reduced expectations for additional Federal Reserve tightening. Following June’s weaker Nonfarm Payrolls report, markets have scaled back forecasts for future rate increases, with traders now pricing in between zero and one Fed hike in 2026, compared with expectations for up to two hikes previously. The shift has limited the US Dollar’s upside and helped prevent a deeper decline in gold prices.
Additional economic data offered little fresh direction. The US ISM Services PMI slipped to 54.0 in June from 54.5 previously, matching market expectations and failing to provide meaningful support for the Greenback.
Looking ahead, investors are likely to remain cautious ahead of Wednesday’s FOMC Minutes, which could provide further insight into the Federal Reserve’s policy outlook. Until then, geopolitical developments and movements in Treasury yields are expected to remain the primary drivers of both the US Dollar and gold prices. Given the mixed fundamental backdrop, traders may prefer to wait for stronger confirmation before concluding that gold’s recent rebound from last week’s year-to-date low has fully lost momentum.
Gold Daily Chart
Gold remains biased to the downside in the near term, with XAU/USD continuing to trade below its 200-day Simple Moving Average (SMA) at $4,489.97 and within a well-defined descending channel. A decisive break below the $4,100 support zone could trigger an acceleration of intraday selling pressure and expose lower technical levels.
That said, momentum indicators show some signs of stabilization. The MACD has crossed into positive territory, with the MACD line moving above the signal line and the positive histogram widening, indicating improving bullish momentum. However, the signal remains insufficient to negate the broader bearish structure. Meanwhile, the RSI stands at 44.16, below the neutral 50 threshold, suggesting that bearish conditions still prevail despite the recent rebound.
On the downside, the $4,100 level serves as the first line of defense for bulls. A sustained move below this threshold could pave the way for a test of the descending channel support near $3,844.34, where stronger buying interest may emerge.
On the upside, initial resistance is located near the upper boundary of the descending channel around $4,296.64. A break above this level would shift focus toward the 200-day SMA at $4,489.97, followed by a more significant resistance zone near $4,572.41. Until these barriers are cleared, rallies are likely to be viewed as corrective within the broader downtrend.
WTI crude extends its advance as renewed geopolitical tensions in the Strait of Hormuz raise concerns over potential supply disruptions. Iran reportedly launched at least two missiles at commercial vessels passing through the key maritime chokepoint on Monday, bolstering risk premiums in the oil market. However, gains may be tempered after Saudi Aramco reduced the price of its Arab Light crude for Asian customers by $11, bringing it to a $1.50 discount to the regional benchmark.
West Texas Intermediate (WTI) crude oil edged higher to around $69.20 per barrel during Tuesday’s Asian session, recovering part of the previous day’s decline as renewed tensions in the Strait of Hormuz provided short-term support to prices.
Market sentiment improved after a Bloomberg report, citing a US official, indicated that Iran launched at least two missiles at commercial vessels navigating the crucial shipping corridor late Monday. Although two ships suffered significant damage, no fatalities were reported. Meanwhile, the UK Maritime Trade Operations (UKMTO) said a southbound tanker was hit by an unidentified projectile on its port side, triggering a fire onboard.
However, the upside in crude prices remained limited, with WTI hovering near a four-month low amid growing signs of ample global supply. Easing some immediate concerns over disruptions, maritime traffic through the Strait of Hormuz has begun to normalize. Data showed that at least eight Japan-linked vessels, including five supertankers capable of carrying roughly two million barrels of crude each, successfully transited the waterway via routes close to Iran.
Further weighing on the market, Saudi Aramco slashed the official selling price of its benchmark Arab Light crude for Asian customers by $11 per barrel, leaving it at a $1.50 discount to the regional benchmark. The rare and aggressive price cut—previously seen only during the oil market downturns of 2015 and 2020—underscores weakening demand conditions. The move came shortly after OPEC+ agreed over the weekend to increase production quotas for next month, reinforcing expectations of a more oversupplied global oil market and limiting the scope for sustained gains in WTI.
Gold finds it difficult to build on its modest gains during the Asian session and remains below a newly established two-week high reached just above the $4,200 level. The US Dollar draws support from safe-haven demand as investors remain cautious over ongoing uncertainties related to tensions in the Strait of Hormuz, creating pressure on the precious metal. Nevertheless, expectations for fewer interest-rate hikes from the US Federal Reserve continue to limit the Dollar’s upside, preventing buyers from taking more aggressive positions.
Technical Analysis of XAU/USD
Friday’s break above the 100-period Simple Moving Average (SMA) on the four-hour chart, followed by a move through the 23.6% Fibonacci retracement of the April-to-June decline, provided a significant boost for XAU/USD bulls. In addition, the Relative Strength Index (RSI), which remains elevated near 63, together with a positive Moving Average Convergence Divergence (MACD) signal, suggests that bullish momentum is still intact despite Gold consolidating below its recent highs.
As a result, any pullback below the 23.6% Fibonacci level around $4,164 could attract buying interest near the 100-period SMA, which is positioned around $4,147 and may act as an important support zone. A decisive drop beneath this level, however, could pave the way for a deeper decline toward the key structural support area near $3,940.
On the upside, the first resistance is located around the 38.2% Fibonacci retracement at $4,302. Beyond that, the next targets are the 50% retracement level near $4,415 and the 61.8% Fibonacci level around $4,527. A sustained advance could then bring the 78.6% retracement at $4,686 into focus, with the April swing high near $4,889 marking the next major bullish objective.
Fundamental Analysis
Although the interim agreement between the US and Iran remains in place, tensions in the Strait of Hormuz continue to simmer as Tehran moves to strengthen its influence over the vital shipping route. Over the weekend, Iran’s ambassador to China indicated that the country intends to impose new service charges on vessels transiting the strait, a proposal that has already been opposed by the United States. These developments have kept geopolitical concerns elevated, boosting safe-haven demand for the US Dollar and creating some near-term pressure on Gold prices.
At the same time, expectations for further interest-rate hikes by the US Federal Reserve have eased following weaker-than-expected US labor market data released last Thursday, which pointed to moderating employment conditions. Lower inflation concerns, reinforced by the recent decline in Crude Oil prices, could also give the Fed greater flexibility to maintain a cautious policy stance. As a result, prospects for an extended period of restrictive monetary policy have softened, limiting the Dollar’s upside potential and helping to cushion Gold from a deeper pullback.
Supporting the longer-term bullish case for the precious metal, a recent survey by the World Gold Council found that central banks are increasingly viewing Gold as a safeguard against inflation, financial instability, and geopolitical uncertainty. Nearly 90% of surveyed institutions expect global central-bank gold holdings to rise over the coming year. In addition, the European Central Bank recently reported that Gold has surpassed US Treasuries as a reserve asset in global allocations. The People’s Bank of China also continued its accumulation trend, adding 320,000 ounces of Gold in May and extending its buying streak to 19 consecutive months.
Looking ahead, investors will closely monitor the release of the US ISM Services PMI, while remarks from key members of the Federal Open Market Committee (FOMC) could influence US Dollar sentiment during the North American session. Even so, the broader fundamental backdrop remains supportive for Gold. Consequently, any short-term declines are likely to attract fresh buying interest, suggesting that the recent rebound from the year’s low may still have room to extend.
Silver prices retreated to around $62 after posting gains for four consecutive sessions. Expectations of additional weakness in crude oil prices could help cap the metal’s downside by supporting its broader market outlook. Meanwhile, investors are turning their attention to the upcoming Federal Open Market Committee (FOMC) minutes for fresh signals on the future direction of US interest rates.
Silver prices (XAG/USD) slipped around 1% to approximately $61.80 during Monday’s Asian session, pulling back after recording gains over the previous four trading days. Despite the correction, the precious metal could regain momentum as analysts increasingly expect oil prices to weaken further, a development that may reduce global inflationary pressures.
In recent months, silver came under significant pressure as crude oil prices surged amid supply concerns linked to geopolitical tensions in the Middle East. Higher energy costs fueled inflation worries, weighing on the outlook for precious metals.
Analysts at Citigroup have projected that Brent crude could decline toward $60 per barrel by the end of the year, citing improving market fundamentals. They noted that concerns over disruptions in the Strait of Hormuz are easing, while shipping activity is gradually returning to normal levels.
During Asian trading hours, Brent crude was down roughly 0.5%, trading near $71.80 per barrel and remaining close to Thursday’s five-month low of $70.26.
At the same time, easing expectations for further interest-rate increases by the Federal Reserve are providing additional support for silver. The shift in sentiment followed the release of the latest US Nonfarm Payrolls report on Thursday.
Data from the CME FedWatch Tool indicates that the probability of the Fed implementing at least one additional rate hike by the end of September has fallen to 53.2%, compared with 59.4% a week earlier.
Looking ahead, market participants will focus on the minutes from the June meeting of the Federal Open Market Committee, scheduled for release on Wednesday, for further insight into the US central bank’s policy outlook.
Technical Analysis
Silver (XAG/USD) is trading lower near $61.94 at the time of writing, coming under renewed selling pressure after a corrective rebound toward its 20-day Exponential Moving Average (EMA), currently positioned around $63.53.
Technical indicators suggest bearish sentiment remains in place, although downside momentum has weakened. The Relative Strength Index (RSI) has recovered from the 20–40 range and is now hovering near 42, indicating that selling pressure has moderated but has not yet shifted the overall trend to bullish.
On the upside, the 20-day EMA at $63.53 serves as the first significant resistance level. A daily close above this barrier would help neutralize the prevailing bearish outlook and could pave the way for a stronger recovery toward the June 22 peak of $67.17, with the psychologically important $70.00 level as the next target.
Conversely, if silver resumes its downward trajectory and breaks below the June 24 low of $55.63, the metal could enter a fresh phase of decline, exposing it to deeper losses in the sessions ahead.
Gold buyers have become more cautious as concerns surrounding the Strait of Hormuz boost safe-haven demand for the US dollar. However, expectations that the Federal Reserve is unlikely to resume rate hikes limit the dollar’s upside, helping to underpin gold prices. In addition, the technical outlook remains constructive, suggesting that any pullback could attract fresh buying interest and keep the broader bullish trend intact.
Gold (XAU/USD) came under renewed selling pressure after climbing above the $4,200 level during the Asian session, reaching its highest point in two weeks. The decline appears to interrupt a three-day rally as investors shift toward the US dollar, which is benefiting from safe-haven demand amid ongoing tensions surrounding the Strait of Hormuz. Nevertheless, expectations that the Federal Reserve is unlikely to raise interest rates further continue to limit the dollar’s upside potential. At the same time, sustained purchases by central banks are providing underlying support for the precious metal.
Although the interim agreement between the United States and Iran remains in place, concerns over the Strait of Hormuz continue to linger. Iran has indicated plans to impose new service charges on vessels transiting the strategically important waterway, a proposal opposed by Washington. These developments have kept geopolitical risks elevated, boosting demand for the US dollar and weighing on gold prices at the start of the week.
On the monetary policy front, market participants have scaled back expectations for additional Fed rate hikes following weaker-than-expected US employment data released last Thursday, which pointed to a moderation in labor market strength. Furthermore, lower inflationary pressures resulting from the recent decline in crude oil prices could give the Fed more flexibility to maintain a patient policy stance. As a result, expectations for prolonged restrictive monetary policy have eased, limiting further gains in the US dollar and helping to cushion gold from deeper losses.
Support for gold also continues to come from central bank demand. A recent survey by the World Gold Council showed that central banks increasingly view gold as a safeguard against financial instability, inflation, and geopolitical uncertainty, with nearly 90% of respondents expecting global gold reserves to grow over the coming year. In addition, data from the European Central Bank revealed that gold has surpassed US Treasury holdings in global reserve allocations. China’s central bank further reinforced this trend by adding 320,000 ounces of gold to its reserves in May, marking the nineteenth consecutive month of accumulation.
Looking ahead, investors will closely monitor the release of the US ISM Services PMI and comments from key Federal Open Market Committee officials. These events could influence demand for the US dollar and provide fresh direction for gold prices. However, the broader fundamental backdrop remains supportive of the precious metal, suggesting that any near-term pullbacks are likely to attract buyers and that the overall bullish outlook remains intact.
Gold H4 Chart
Gold remains close to an important technical support zone around $4,150–$4,145, where the 100-period Simple Moving Average (SMA) on the four-hour chart is currently located. The bullish breakout above this moving average on Friday, followed by a move beyond the 23.6% Fibonacci retracement of the April–June decline, provided a strong signal that buyers were regaining control of the market.
Momentum indicators continue to support a constructive outlook. The Relative Strength Index (RSI) remains elevated near 63, while the Moving Average Convergence Divergence (MACD) stays in positive territory, suggesting that the broader upward momentum remains intact despite the recent period of consolidation below the latest highs.
As a result, any decline below the 23.6% Fibonacci retracement level at approximately $4,164 is likely to attract buying interest around the 100-period SMA near $4,147. This area should serve as an important support floor. However, a decisive break beneath this zone could open the door for a deeper correction toward the major support region around $3,940.
On the upside, immediate resistance is located near the 38.2% Fibonacci retracement level at $4,302. A sustained move above this barrier could target the 50% retracement level around $4,415, followed by the 61.8% retracement near $4,527. Beyond that, the 78.6% Fibonacci level at approximately $4,686 marks the next major bullish objective, ahead of a potential retest of the April peak around $4,889.
Bitcoin showed a modest recovery over the week, finding support around the $60,000 level and signaling a potential stabilization after its recent decline. However, caution remains warranted, as the cryptocurrency has experienced significant downward pressure and market sentiment is still fragile.
Looking ahead, any upward movement is likely to face resistance from sellers until Bitcoin can establish itself firmly above the $65,000 mark. On the downside, a break below the low of the current weekly candle could trigger renewed bearish momentum, increasing the likelihood of a move toward the $50,000 level.
EUR/USD
EUR/USD traded within a relatively narrow range throughout the week, with the 1.14 level continuing to serve as an important support zone for market participants. Sentiment shifted slightly following a weaker-than-expected U.S. Non-Farm Payrolls report, which prompted investors to scale back expectations of further interest rate hikes by the Federal Reserve.
Despite this development, the broader outlook remains uncertain. A break below the previous week’s low could accelerate bearish momentum and pave the way for a decline toward the 1.12 level. On the upside, any recovery attempts should be approached cautiously until the pair can convincingly move above 1.15, ideally supported by a daily close above that threshold.
NZD/USD
NZD/USD posted solid gains for most of the week, although the pair began to lose momentum on Friday, suggesting that bullish sentiment may be fading. If the U.S. dollar strengthens broadly in the coming sessions, the New Zealand dollar could be among the currencies most vulnerable to a reversal.
The pair has remained trapped within a long-standing trading range, while New Zealand’s monetary policy outlook differs from that of several other major economies. The central bank has maintained a relatively less hawkish stance, which could limit the kiwi’s upside potential. Given these factors, bearish opportunities may emerge if further signs of weakness develop. Additionally, Friday’s price action resembles a shooting star candlestick pattern, often viewed as a warning of potential downside pressure, making it a technical signal worth monitoring closely.
USD/CAD
USD/CAD traded largely sideways throughout the week, reflecting a period of consolidation after recent moves. While the pair may appear somewhat stretched in the short term, price action is likely to remain volatile given the close economic relationship between the United States and Canada.
Although the latest U.S. employment data came in weaker than expected, broader fundamentals continue to support the U.S. dollar. At the same time, concerns over the Canadian economy’s performance may limit the Canadian dollar’s strength. As a result, any near-term pullback in USD/CAD could present buying opportunities, particularly if the pair declines toward the key 1.40 support area, where demand may re-emerge.
GBP/USD
GBP/USD delivered a strong performance during the week, advancing above the 1.33 level and testing the 50-week Exponential Moving Average (EMA). A decisive break above this week’s high, near 1.34, could reinforce bullish momentum and pave the way for a move toward the 1.35 area.
The pair has spent an extended period trading within a range, making the recent recovery a relatively natural development. The British pound has also demonstrated greater resilience against the U.S. dollar compared with several other major currencies. Should the U.S. dollar come under renewed selling pressure, sterling could emerge as one of the primary beneficiaries. Conversely, even if the dollar regains strength, the current market structure offers little incentive for a bearish outlook on GBP/USD, as the pair continues to show underlying support and positive momentum.
Silver
Silver experienced considerable volatility throughout the week, with price action remaining choppy and directionless. The $60 level continues to act as a key psychological resistance zone, creating a significant hurdle for any sustained upward movement.
Despite periodic rebounds, the broader technical picture remains cautious following the recent formation of a new swing low. This suggests that rallies may continue to face selling pressure, particularly if bullish momentum begins to fade. From a technical perspective, the 50-week Exponential Moving Average (EMA), currently near $64.36, represents an important resistance area and may serve as the primary upside barrier in the near term. Until silver can break convincingly above this level, the market is likely to remain vulnerable to further downside pressure.
Gold
Gold has shown signs of improvement over the past several weeks, with prices recovering and attempting to build a stronger foundation. The market is now approaching the 50-week Exponential Moving Average (EMA), a key technical level that could determine the next major move. A successful breakout above this resistance may strengthen bullish momentum and open the door for a rally toward the $4,400 level.
On the downside, a decline below the $3,900 support zone would likely weaken the outlook and increase the risk of a deeper correction toward $3,500. Overall, gold appears to be in the process of establishing a long-term bottom, although confirmation is still needed. Traders should continue to monitor the performance of the U.S. dollar, as further dollar weakness could provide additional support for gold prices and enhance the prospects for a sustained recovery.
The Nasdaq 100
The Nasdaq 100 advanced for most of the week, continuing to reflect the market’s underlying strength. However, trading activity was shortened due to the market closure on Friday, which slightly distorts the weekly candlestick. Additionally, Thursday’s session was heavily influenced by the release of the U.S. Non-Farm Payrolls report. While the data came in weaker than expected, the impact does not appear severe enough to significantly alter the broader market outlook.
Looking ahead, the index may enter a period of consolidation following its substantial gains over the past several months. Rather than expecting an immediate continuation of the rally, a sideways trading phase could help absorb recent gains and establish a stronger foundation for future advances. Within this context, short-term pullbacks may present attractive buying opportunities, as the longer-term trend remains constructive and investor sentiment continues to favor equities.
Energy – Brent Forward Curve Signals Improving Supply Conditions
The oil market is heading for a fourth straight weekly decline as traffic through the Strait of Hormuz continues to recover. Rising crude flows are placing increasing pressure on the front end of the ICE Brent forward curve, which has been shifting deeper into contango—a market structure often associated with ample near-term supply. The return of disrupted barrels, combined with ongoing releases from strategic petroleum reserves, has improved supply availability. However, lower outright prices and a contango market structure may begin attracting additional buying interest.
In the ARA hub, data from Insight Global showed total refined product inventories declined by 22,000 tonnes week-on-week to 4.53 million tonnes. The decrease was mainly driven by lighter products, with gasoline and naphtha stocks dropping by 75,000 tonnes and 26,000 tonnes, respectively. Meanwhile, middle distillates posted gains, as jet fuel inventories increased by 66,000 tonnes and gasoil stocks rose by 16,000 tonnes.
Singapore’s refined product inventories also moved lower, falling by 1.73 million barrels to 40.45 million barrels. Although stock levels remain below the five-year average of 45.32 million barrels, they have recovered significantly from early-June lows of 34.41 million barrels. Declines were recorded across all major categories, with light products, middle distillates, and residual fuels decreasing by 665,000 barrels, 420,000 barrels, and 648,000 barrels, respectively.
In the natural gas market, front-month Henry Hub futures came under pressure after U.S. storage data showed a larger-than-expected build. Gas inventories increased by 87 billion cubic feet last week, surpassing both market expectations of 84 bcf and the five-year average increase of 64 bcf. Nevertheless, persistent heatwaves across parts of the United States are expected to support gas demand for electricity generation as cooling requirements remain elevated.
Metals – Aluminium Retreats as Supply Concerns Ease
LME aluminium prices weakened again, with three-month contracts slipping toward $3,000 per tonne as traders continued to remove the geopolitical risk premium that had accumulated during the Middle East conflict.
Market sentiment was dampened by an update from Emirates Global Aluminium (EGA), which announced that approximately 7% of production pots at its Al Taweelah smelter have been restarted. The progress highlights a gradual recovery in output following missile and drone attacks that disrupted operations earlier this year.
The development strengthened expectations that supply interruptions in the Gulf region will be temporary. Earlier fears of production losses and shipping disruptions through the Strait of Hormuz had fueled a strong rally in aluminium prices. However, improving production levels and easing geopolitical tensions have significantly enhanced the supply outlook.
Although a large share of Al Taweelah’s capacity remains offline and a complete recovery is still some distance away, the latest progress indicates that lost supply is steadily returning to the market, helping to alleviate concerns about aluminium availability.
Precious Metals – Gold Advances on Softer U.S. Economic Data
Gold posted strong gains after weaker-than-expected U.S. employment figures reduced concerns that the Federal Reserve might need to tighten monetary policy further this year. The softer labor market data pushed both Treasury yields and the U.S. dollar lower, increasing the attractiveness of non-yielding assets such as gold.
The rally extended gains already supported by less hawkish remarks from Fed Chair Kevin Warsh earlier in the week. Investors are increasingly reassessing the trajectory of U.S. monetary policy, with upcoming economic releases likely to play a crucial role in determining whether labor market weakness persists. Continued moderation in economic activity could lessen pressure on the Fed to raise rates, providing further support for gold prices.
Central banks also remained significant buyers of gold in May, purchasing a net 41 tonnes according to the World Gold Council. Poland led acquisitions with 18 tonnes, bringing its purchases for the year to 64 tonnes. China continued its long-running accumulation strategy, adding 10 tonnes and extending its buying streak to 20 consecutive months. Uzbekistan and Kazakhstan increased their reserves by 9 tonnes and 7 tonnes, respectively.
In contrast, Russia was a net seller, reducing its gold holdings by 6 tonnes during May and bringing year-to-date sales to 34 tonnes. Turkey also trimmed reserves by 3 tonnes, resulting in total sales of 81 tonnes so far this year. Despite these sales, robust demand from central banks continues to provide a strong underlying foundation for the gold market.
Gold price inches higher toward $4,125 during Friday’s Asian trading session.
Weaker-than-expected US Nonfarm Payrolls, which rose by just 57,000 in June, supported the precious metal.
Meanwhile, geopolitical tensions persisted after the latest round of indirect US-Iran talks ended Wednesday without meaningful progress toward a lasting peace agreement.
Gold price (XAU/USD) advanced to around $4,125 during Friday’s early Asian session, extending its upward momentum after softer-than-expected US Nonfarm Payrolls (NFP) data dampened expectations for further Federal Reserve (Fed) rate hikes this year.
According to data released by the US Bureau of Labor Statistics (BLS) on Thursday, the US economy added just 57,000 jobs in June, well below market forecasts of 110,000. Meanwhile, the Unemployment Rate eased to 4.2% from 4.3% in May. The report followed Wednesday’s weaker US private payrolls figures, which also pointed to slowing labor market momentum.
“The weaker jobs data reduces the likelihood of additional rate hikes later this year. Gold typically performs better in a lower interest rate environment,” said David Meger, director of metals trading at High Ridge Futures. He added that the disappointing employment data triggered a strong rally in the gold market.
At the same time, geopolitical tensions remained elevated after indirect talks between the US and Iran ended on Wednesday without any meaningful progress toward a lasting peace agreement, according to Reuters. Ongoing uncertainty in the Middle East could fuel inflation concerns, potentially reviving expectations for tighter monetary policy and limiting gains in non-yielding assets such as gold.
Silver is poised for a strong rebound amid a softer Fed outlook, easing inflation concerns, and weaker oil prices.
Silver gains momentum as signs of a slowing US labor market prompt investors to reassess the path of interest rates.
According to the CME FedWatch tool, the probability of a September rate hike fell to 52% from 66% following the latest data release.
Silver prices extended gains for a fourth straight session on Friday, with XAG/USD trading near $62.60 per troy ounce during Asian trading hours. A softer inflation outlook, weaker oil prices, and a less aggressive Federal Reserve are providing strong support for the non-yielding metal’s recovery.
Silver is attracting renewed buying interest as signs of a slowing US labor market prompt investors to sharply reassess the outlook for interest rates. The shift in sentiment followed Thursday’s June Nonfarm Payrolls (NFP) report, which showed the US economy added only 57,000 jobs, well below expectations of 110,000. Although the unemployment rate unexpectedly edged down to 4.2% from 4.3% in May, the weak hiring figures reinforced concerns about broader economic cooling.
In response, traders pared back expectations for tighter monetary policy. Data from the CME FedWatch tool showed the probability of a September rate hike falling to 52%, compared with 66% before the jobs report.
Additional support came from recent comments by Federal Reserve Chair Kevin Warsh at the ECB Sintra Conference, where he reiterated the Fed’s commitment to its 2% inflation target while noting that inflation pressures and expectations have eased in recent weeks.
Silver is also benefiting from declining energy prices, which are helping reduce inflationary pressures. Crude oil prices have weakened as shipping activity through the Strait of Hormuz continues to normalize following progress in US-Iran diplomatic negotiations in Doha. The easing geopolitical tensions have reduced the risk premium that had previously supported energy markets.
WTI crude continues to trade lower below the $68.00 level as investors remain optimistic that diplomatic negotiations will bring an end to the conflict between the United States and Iran. Reports from Qatari mediators indicate that talks held in Doha this week have made meaningful progress, easing concerns over potential supply disruptions. Adding to the bearish pressure, Reuters reported that OPEC+ is considering raising output by 188,000 barrels per day in August, further improving the global supply outlook.
Crude oil prices continued to move lower on Thursday as signs of progress in diplomatic efforts between the United States and Iran reduced concerns about potential supply disruptions. West Texas Intermediate (WTI), the US benchmark crude grade, slipped below the $68.00 mark and was trading around $67.80 at the time of writing, its lowest level since the conflict began in February.
According to Qatar’s Foreign Ministry, indirect negotiations held in Doha earlier this week produced encouraging results. Officials stated that both sides made headway on matters related to the memorandum that ended hostilities in June and were building on discussions initiated during a recent summit in Switzerland.
Uncertainty Remains Despite Diplomatic Progress
While reports suggest the talks are moving in a constructive direction, key details remain limited. US President Donald Trump said the negotiations yielded progress regarding potential restrictions on Iran’s nuclear program, adding that efforts toward denuclearization were advancing positively. However, US Vice President JD Vance indicated that nuclear-related issues would likely be addressed in future discussions.
Meanwhile, Iran’s Deputy Foreign Minister Kazem Gharibabadi stated that both parties had agreed to establish a communication mechanism to monitor and report any violations of the existing memorandum of understanding.
A major source of uncertainty remains the Strait of Hormuz. Although shipping activity through the vital waterway has increased since the ceasefire, traffic levels remain well below pre-conflict norms, suggesting that full normalization has yet to occur.
On the supply side, oil prices also came under pressure after reports that the OPEC+ alliance is considering raising production quotas by 188,000 barrels per day in August. Expectations of additional supply entering the market have further weighed on crude prices, reinforcing the bearish sentiment driven by easing geopolitical risks.
Gold remains supported for a second consecutive session as the US dollar edges lower. However, expectations for further Fed tightening and lingering geopolitical tensions involving Iran may limit losses in the greenback and restrain upside in the precious metal. Traders are also likely to stay cautious ahead of the closely watched US Nonfarm Payrolls report.
Gold prices (XAU/USD) edged higher on Thursday, climbing to a fresh daily high during the European session as a modest pullback in the US dollar provided support. However, gains remained limited as expectations for further Federal Reserve tightening and ongoing geopolitical tensions continued to underpin the greenback, keeping bullion largely within the previous day’s trading range. Investors also appeared cautious ahead of the highly anticipated US Nonfarm Payrolls (NFP) report.
The dollar came under mild pressure after weaker-than-expected US economic data. According to ADP, private-sector employment increased by 98,000 jobs in June, falling short of forecasts for 113,000 and slowing from May’s 122,000 gain. Meanwhile, the ISM Manufacturing PMI slipped to 53.3 from 54.0, signaling a moderation in manufacturing activity. The report also showed a notable decline in the Prices Paid Index to 73.0 from 82.1, suggesting easing cost pressures, while the Employment Index improved slightly to 49.7 from 48.6. Combined with the recent decline in crude oil prices, these developments have helped reduce near-term inflation concerns and weighed on the US dollar, offering support to gold.
Despite the softer data, markets continue to expect further Fed tightening. The CME FedWatch Tool shows traders pricing in roughly a 64% probability of a rate hike in September and nearly an 85% chance that borrowing costs will be increased before year-end. Those expectations were reinforced by comments from Kevin Warsh, who reiterated the Fed’s commitment to its 2% inflation target and dismissed expectations of a shift toward looser monetary policy despite calls from Donald Trump for lower interest rates. Several Fed officials have also suggested that rates may need to remain elevated for longer, a factor that should continue to support the dollar and limit upside potential for non-yielding assets such as gold.
Geopolitical developments are also influencing market sentiment. Indirect negotiations between the United States and Iran in Qatar ended without meaningful progress toward easing tensions surrounding the strategically important Strait of Hormuz. At the same time, Russia launched a new wave of missile and drone attacks on Ukraine, keeping geopolitical risks elevated and maintaining demand for safe-haven assets.
Looking ahead, attention now turns to the US Nonfarm Payrolls report. As one of the Fed’s most closely watched indicators, the employment data could significantly influence expectations for future interest-rate moves, shaping the near-term direction of both the US dollar and gold prices.
XAU/USD Technical Analysis: Recovery Attempts Face Resistance Within Bearish Structure
From a technical standpoint, gold remains vulnerable despite its recent rebound. The latest short-covering rally stalled near the 38.2% Fibonacci retracement of the decline recorded over the past two weeks, suggesting that buyers are struggling to regain control. In addition, XAU/USD continues to trade below its 100-period Simple Moving Average (SMA) on the 4-hour chart, keeping the broader near-term outlook tilted to the downside.
That said, momentum indicators have improved. The MACD remains in positive territory and is trending higher, while the Relative Strength Index (RSI) holds near 54, indicating modest bullish momentum without entering overbought conditions. Gold’s ability to sustain gains above the 23.6% Fibonacci retracement level also supports the possibility of further recovery, although any advance is likely to remain constrained unless key resistance levels are broken.
On the upside, the first hurdle is the 38.2% Fibonacci retracement at $4,112.32. A decisive move above this level could open the door toward the 100-period SMA at $4,145.47, followed by the 50% retracement level at $4,164.62. Beyond that, resistance is seen at the 61.8% Fibonacci level near $4,216.91, then the 78.6% retracement at $4,291.37, with the record high around $4,386.20 representing the ultimate bullish target.
On the downside, immediate support lies at the 23.6% Fibonacci retracement around $4,047.62, a level recently reclaimed by buyers. Failure to hold above this zone would weaken the recovery narrative and expose the key support area near the recent swing low of $3,943.03.
Overall, while improving momentum indicators suggest scope for additional upside corrections, gold remains trapped within a broader bearish technical framework as long as it trades below the 100-period SMA and fails to break above the $4,112–$4,145 resistance zone. A move beyond that area would be needed to shift the near-term outlook toward a more constructive stance.
Gold fell 12% in June, prompting questions over whether further downside is likely, while USD/JPY remains in focus amid intervention concerns.
Gold has rebounded above the 4,000 level but is still set to record a 12% monthly loss in June—its steepest decline since October 2008. The drop reflects a broader market shift away from geopolitical risk premiums and back toward concerns over elevated U.S. interest rates.
The metal is also heading for its first quarterly loss since 2024 and its largest three-month drop since Q2 2013.
The selloff has been driven by rising expectations that the Federal Reserve will continue tightening policy. After a hawkish FOMC meeting and persistently high Core PCE inflation at 3.4%, markets are now pricing in more than a 60% chance of a 25-basis-point rate hike in September, with up to three hikes still seen as possible this year.
These expectations have pushed the U.S. dollar to a 13-month high, while higher real yields have increased the opportunity cost of holding non-yielding assets like gold.
Together, a stronger dollar, rising real yields, and a hawkish Fed stance continue to pressure gold prices.
Market attention now shifts to Fed Chair Kevin Walsh’s remarks at the ECB Sintra Forum and Thursday’s U.S. non-farm payrolls report, which could offer further clues on the rate outlook and gold’s direction.
For a sustained recovery, gold would likely need lower real yields, a weaker dollar, or a reversal in hawkish Fed expectations—none of which currently appear imminent.
Gold Forecast – Technical Analysis
Gold has broken down from its symmetrical triangle formation and slipped below the 200-day simple moving average, hitting a low of 3,942—its weakest level since November.
The 50-day SMA has now crossed beneath the 200-day SMA, confirming a bearish “death cross” signal. Alongside an RSI reading below 50, technical indicators continue to point toward downside momentum.
On the downside, sellers may target 3,930—the November low—followed by 3,800. A break beneath that level could open the door toward the psychological support zone around 3,500.
On the upside, any recovery would first need to reclaim 4,100, which aligns with this week’s high and the March low. Beyond that, resistance is seen near a declining trendline around 4,300, followed by horizontal resistance at 4,350. A sustained move above this zone would bring the 200-day SMA near 4,500 back into focus.
USD/JPY
USD/JPY has surged to a 40-year high above 162, heightening concerns that Japanese authorities may intervene to support the yen.
The currency has weakened to levels last seen in 1986, increasing speculation that Tokyo could step into the market in the near term, even as the U.S. dollar has eased slightly from its 13-month peak.
The yen is down 2% in the second quarter, marking its fourth consecutive quarterly decline and the longest losing streak in four years, as the wide interest rate gap between the U.S. and Japan continues to weigh on the currency.
Finance Minister Satsuki Katayama has reiterated that authorities are prepared to act at any time if necessary. Historically, interventions have often occurred during periods of thin liquidity, and with a holiday-shortened trading week, conditions could be conducive to action.
The key market debate is increasingly shifting from whether intervention will occur to when it might happen. However, unless any intervention is supported by a narrowing U.S.-Japan yield differential, its impact is likely to be short-lived.
Previous interventions in late February and early May briefly strengthened the yen, but USD/JPY resumed its uptrend as markets quickly re-priced U.S. rate expectations. In that context, intervention has often been faded, as underlying macro forces remain unchanged.
The carry trade continues to be supported by the persistent yield advantage in the U.S., keeping upward pressure on USD/JPY.
Recent hawkish Federal Reserve signals and sticky Core PCE inflation at 3.4%, a three-year high, have led markets to price in around a 60% chance of a 25-basis-point rate hike in September, with expectations of up to three hikes this year.
Looking ahead, attention turns to Federal Reserve Chair Kevin Walsh’s remarks at the ECB Sintra Forum, alongside Thursday’s U.S. non-farm payrolls report. Ahead of that, U.S. consumer confidence and JOLTS job openings data will also be closely watched for further clues on the interest rate outlook.
USD/JPY Forecast – Technical Analysis
USD/JPY has broken above the upper boundary of its rising wedge pattern, extending gains to a new 40-year high at 162.40 and effectively invalidating the prior bearish reversal setup.
Momentum indicators show the RSI in overbought territory across multiple timeframes, suggesting the pair may pause for consolidation before attempting further upside.
On the bullish side, buyers are now eyeing a move toward 165, with the longer-term projection extending to 170 if momentum persists.
On the downside, initial support is seen at 160.20, followed by the key psychological level at 160.00. A break below that zone would expose the 50-day SMA near 159.50, with deeper support at 157.90, where the rising trendline aligns with horizontal support.
Silver remains trapped below the $60 mark, with the broader bearish trend still firmly in place.
The RSI is approaching oversold levels, indicating that sellers continue to dominate market sentiment.
A decisive break beneath $56.61 could pave the way for a retest of the year-to-date low and the key $55.00 support zone.
Silver prices climbed more than 1.5% on Tuesday despite rising US Treasury yields and a resilient US Dollar. Ongoing concerns over the stability of the fragile ceasefire agreement between the United States and Iran helped support the precious metal, with XAG/USD trading around $58.73, above its opening level.
Technical Outlook
Silver continues to trade in a consolidation phase below the $60.00 threshold, struggling to break above either the psychological resistance at $60.00 or move decisively away from its year-to-date low of $55.63.
Technical momentum remains tilted to the downside, as reflected by the Relative Strength Index (RSI), which is approaching oversold territory and suggests bearish pressure remains dominant.
Should sellers regain control, a break below the intraday low at $56.61 could trigger further losses. The next downside targets lie at the YTD low of $55.63 and the key $55.00 support level. A sustained move beneath these levels could open the door to the November 13 former resistance-turned-support at $54.39, with the psychological $50.00 mark emerging as a longer-term downside objective.
Conversely, a bullish reversal would require buyers to reclaim the March 23 swing low, now acting as resistance, at $61.01. If that barrier is overcome, attention would shift to the 200-day Simple Moving Average near $69.72, followed by the significant $70.00 level.
Gold prices remain steady near $4,015 during Wednesday’s early Asian trading session as investors monitor ongoing US-Iran negotiations. Market sentiment was influenced after US envoy Steve Witkoff and Jared Kushner met with Qatar’s prime minister on Tuesday to discuss diplomatic efforts between Washington and Tehran.
Traders are also turning their attention to key US labor market data due later this week, with the ADP Employment Change report and the closely watched Nonfarm Payrolls (NFP) release expected to provide fresh clues on the Federal Reserve’s policy outlook and the near-term direction of gold prices.
Gold prices (XAU/USD) remained largely unchanged near the $4,015 level during Wednesday’s early Asian session as investors assessed the outlook for potential US-Iran negotiations in Doha. Market participants remained cautious after conflicting statements from Washington and Tehran highlighted the uncertain nature of the temporary peace agreement reached earlier this month.
According to CNBC, US President Donald Trump stated on Tuesday that discussions between the two nations would take place in Qatar, adding that Iran had requested a meeting following the recent exchange of US airstrikes. However, an Iranian Foreign Ministry spokesperson reportedly rejected claims that talks were scheduled in the coming days.
US representatives Jared Kushner and Steve Witkoff arrived in Doha on Tuesday, where they were expected to meet with Qatar’s prime minister to discuss regional developments and ongoing diplomatic efforts involving Iran. Despite these engagements, no direct high-level talks between US and Iranian officials have been confirmed.
Progress toward a lasting diplomatic resolution could enhance demand for Gold as investors seek safe-haven assets amid geopolitical developments. Conversely, continued uncertainty surrounding the negotiations may fuel concerns about inflation and monetary policy, potentially increasing expectations for tighter interest rates. While Gold is widely viewed as a hedge against inflation, its lack of yield can make it less attractive in a higher-rate environment.
Attention now shifts to key US labor market releases, including the ADP employment report on Wednesday and the Nonfarm Payrolls (NFP) report on Thursday. Stronger-than-expected employment figures could reinforce expectations that the Federal Reserve will keep interest rates elevated for longer, supporting the US Dollar and potentially limiting upside momentum in Gold prices.
WTI extends losses as conflicting reports on potential US-Iran peace talks fuel uncertainty over the Middle East outlook. President Trump said US and Iranian officials would meet in Doha on Tuesday, but Tehran denied that any talks with Washington had been scheduled. Meanwhile, although vessel traffic has slowed and several ships were damaged following weekend hostilities, tanker operators continue to navigate the strategically important waterway.
West Texas Intermediate (WTI) crude oil surrendered part of its recent advance, slipping toward $70.10 per barrel during Tuesday’s Asian session. The decline followed a mix of conflicting geopolitical developments in the Middle East and uncertainty surrounding potential diplomatic engagement between the United States and Iran.
According to CNBC, US President Donald Trump said Washington and Tehran were set to resume peace talks in Doha, Qatar, on Tuesday after a weekend marked by renewed tensions. Iran, however, swiftly rejected the claim, insisting that no meetings with US officials were planned at any level. Iranian authorities stressed that their priority remains implementing the existing memorandum of understanding rather than pursuing a final settlement.
Further clouding the outlook, Tehran reiterated its intention to monitor shipping activity through the strategically important Strait of Hormuz, even if Oman chooses not to take part. Under the temporary arrangement currently in place, Iran has agreed not to levy transit fees for 60 days, although it has suggested such charges could be introduced afterward. The idea has been strongly opposed by the US, European nations, and Gulf Arab countries.
Despite a slowdown in maritime traffic and damage to two vessels following weekend clashes, tanker operators and crews have continued to navigate the crucial shipping corridor, helping to ease immediate concerns over major supply disruptions.
Gold erased part of its two-day recovery from seven-month lows as sellers returned ahead of the key US Nonfarm Payrolls report. A firmer US Dollar, supported by renewed Middle East tensions and expectations that the Federal Reserve will keep rates higher for longer, continued to weigh on the precious metal. With the daily RSI remaining bearish and a Death Cross still in effect, gold retains a negative technical outlook and remains vulnerable to selling pressure on rallies.
XAU/USD Technical Overview
On the daily chart, XAU/USD is trading around $4,068.30, extending its decline and remaining firmly below key short- and medium-term moving averages, which keeps the near-term outlook bearish. Gold is currently trading beneath the 21-day SMA at $4,240.86, the 50-day SMA at $4,453.85, and the 200-day SMA at $4,479.26. Meanwhile, the 100-day SMA at $4,674.59 remains significantly higher, highlighting strong overhead resistance and reinforcing the broader downtrend. The 14-day Relative Strength Index (RSI) hovers near 36, signaling ongoing bearish momentum while still staying above oversold territory.
Adding to the negative outlook, gold confirmed a bearish Death Cross on Friday after the 50-day SMA closed below the 200-day SMA on a weekly basis, a technical signal often associated with prolonged downside risks.
On the upside, immediate resistance is located at the 21-day SMA near $4,240.86, followed by the 50-day SMA at $4,453.85 and the 200-day SMA at $4,479.26. Together, these levels form a significant resistance zone that buyers would need to overcome to improve the technical outlook. A decisive move above this cluster could pave the way toward the 100-day SMA around $4,674.59. Until then, gold remains exposed to further weakness, with market participants closely monitoring for the emergence of fresh support levels below the current $4,068 area.
Fundamental Analysis Summary
Gold bears are regaining control as the US Dollar (USD) continues to head toward its strongest monthly performance in nearly a year. This comes amid renewed uncertainty surrounding the ceasefire between the United States and Iran, as well as doubts over whether peace talks will resume.
Over the weekend, both sides exchanged strikes and accused each other of violating the ceasefire before eventually agreeing to stop retaliatory attacks and hold negotiations in Qatar on Tuesday.
Despite emerging optimism around diplomatic talks and a pullback in oil prices, markets remain cautious and continue to favor the US dollar—the world’s reserve currency—over gold.
At the same time, gold is also under pressure from rising expectations of further US Federal Reserve interest rate hikes, with markets pricing in at least two increases before year-end.
Looking ahead, attention will shift beyond geopolitics to US Nonfarm Payrolls (NFP) data due Thursday, a key indicator of labor market strength and a major signal for the Fed’s policy direction.
Since gold typically performs better in lower interest rate environments, upcoming Fed guidance is expected to play a crucial role in shaping bullion’s trajectory.
Earlier in the week, traders will also closely monitor the European Central Bank’s annual forum in Sintra, Portugal. A highlight will be Wednesday’s policy panel featuring Fed Chair Kevin Warsh, following his unexpectedly hawkish tone at the beginning of the month.
WTI crude oil prices slid to around $69.60 during early Asian trading on Monday as optimism grew over a potential diplomatic breakthrough between the US and Iran. Market sentiment improved after reports indicated that both countries were moving back toward negotiations aimed at ending the conflict, with Axios reporting that US and Iranian officials are scheduled to meet in Qatar on Tuesday.
WTI crude oil retreated to around $69.60 during early Asian trading on Monday as easing geopolitical tensions weighed on prices. The decline followed reports that the United States and Iran had agreed to suspend military strikes and resume negotiations, with officials from both countries expected to meet in Qatar on Tuesday.
According to Axios, citing unnamed US officials, Washington and Tehran have agreed to halt more than three days of retaliatory attacks in and around the Strait of Hormuz and continue technical discussions aimed at de-escalating the conflict. The move marks a shift from the weekend, when talks were reportedly suspended after US strikes on Iranian military targets in response to Tehran’s attacks on shipping vessels in the strategic waterway.
Meanwhile, Iran’s Islamic Revolutionary Guard Corps (IRGC) claimed responsibility for attacks on eight US military sites in Kuwait and Bahrain, describing them as retaliation for recent American strikes on Iranian facilities.
Market participants will remain focused on the outcome of the upcoming US-Iran talks. Any diplomatic progress could help secure oil flows through the Strait of Hormuz, a critical route that handles roughly one-fifth of global oil shipments, potentially putting further pressure on crude prices. Conversely, renewed hostilities could reignite concerns over supply disruptions and support higher oil prices.
Investors are also awaiting the latest weekly crude inventory data from the American Petroleum Institute (API) on Tuesday. A larger-than-expected decline in stockpiles would signal stronger demand and could provide support for WTI, while an unexpected inventory build may point to weaker consumption or excess supply, weighing on prices.
Gold slips toward $4,050 as uncertainty surrounds US-Iran talks.
Gold slips toward $4,060 in Monday’s Asian trading session as uncertainty surrounding US-Iran relations weighs on market sentiment. A US official indicated that both countries will “stand down for now,” easing immediate geopolitical concerns. Investors are now turning their attention to the upcoming US Nonfarm Payrolls report on Thursday for further clues on the Federal Reserve’s policy outlook.
Gold prices (XAU/USD) edged lower to around $4,060 during Monday’s Asian session as investors weighed ongoing uncertainty surrounding US-Iran relations and growing expectations that the Federal Reserve could raise interest rates later this year.
According to reports, the United States and Iran have agreed to temporarily halt hostilities and are scheduled to meet in Doha, Qatar, on Tuesday to discuss the dispute over the Strait of Hormuz. US officials indicated that both sides would “stand down for now” after recent military exchanges near the strategically important waterway.
Despite the diplomatic efforts, geopolitical risks remain elevated. Iranian Foreign Minister Abbas Araghchi stressed that responsibility for the Strait of Hormuz rests solely with Tehran, while another Iranian official warned that attempts to bypass Iran’s preferred shipping route could trigger further tensions and escalation. Renewed instability in the Middle East could fuel inflation concerns and strengthen expectations for tighter monetary policy, reducing the appeal of non-yielding assets such as gold.
Meanwhile, market participants are increasingly betting on a Federal Reserve rate hike, with the CME FedWatch Tool indicating nearly a 59.7% probability of an increase as early as September 2026. Investors are now focused on Thursday’s US Nonfarm Payrolls (NFP) report, which is expected to show that 114,000 jobs were added in June while the unemployment rate remained steady at 4.3%. Strong labor market data could reinforce the case for higher interest rates and add further pressure on gold prices.
Silver remains below $59.00 as renewed Strait of Hormuz tensions support safe-haven demand.
Silver (XAG/USD) remains under pressure below $59.00 as renewed US-Iran tensions over the Strait of Hormuz fuel concerns about higher oil prices and rising inflation. However, losses are limited after Washington and Tehran agreed to pause hostilities ahead of peace talks scheduled in Doha later this week. Meanwhile, persistent expectations of a hawkish Federal Reserve continue to weigh on the non-yielding precious metal, keeping silver prices subdued.
Silver (XAG/USD) retreats to around $58.80 during Monday’s Asian session, snapping a two-day winning streak as renewed tensions between the United States and Iran in the Strait of Hormuz boost oil prices and reignite inflation concerns. Market sentiment remains sensitive to developments in the Middle East amid fears that escalating geopolitical risks could disrupt global energy supplies.
Despite the renewed clashes, downside pressure on silver is somewhat limited after Washington and Tehran agreed to suspend attacks ahead of peace talks in Doha this week. The diplomatic breakthrough follows several days of retaliatory strikes triggered by an incident involving a cargo vessel, with both sides accusing each other of breaching the June 17 ceasefire. Officials from the US and Iran are expected to meet in Qatar on Tuesday in an effort to de-escalate tensions.
Meanwhile, silver continues to face headwinds from persistent expectations of tighter US monetary policy. According to the CME FedWatch Tool, markets are pricing in a 59.7% probability of a Federal Reserve rate hike in September 2026. Investors are now focused on this week’s US labor market data, particularly Thursday’s Nonfarm Payrolls report. Economists expect the US economy to add 114,000 jobs in June, while the unemployment rate is projected to remain unchanged at 4.3%. Strong employment figures could reinforce the Fed’s hawkish stance and further weigh on non-yielding assets such as silver.
Gold started the previous week with a noticeable gap lower, highlighting the market’s ongoing uncertainty and elevated volatility. Price fluctuations are likely to remain significant in the near term as traders continue to react to various external factors.
The $4,000 level remains a key support zone. As long as gold stays above this threshold, short-term pullbacks could present buying opportunities. However, a decisive break below $4,000 may trigger a deeper correction, potentially sending prices toward the $3,500 area.
On the upside, a move above the 50-week EMA would strengthen the bullish outlook and could pave the way for a rally toward $4,600. That said, gold continues to be influenced by a range of macroeconomic and geopolitical developments, making its direction less predictable.
For now, the most likely scenario may be a period of consolidation, with prices trading within a broad range while the market searches for its next major catalyst.
EUR/CHF
The euro declined notably against the Swiss franc over the past week, yet the 0.92 level continues to serve as an important support area. A rebound from this zone would not be surprising, as the pair appears to be searching for enough momentum to resume a move higher, potentially targeting a break above 0.93.
In the near term, buying on a bounce remains an attractive strategy, especially if support at 0.92 continues to hold. However, if the pair falls decisively below this level, downside pressure could intensify, opening the door for a move toward 0.91.
Overall, EUR/CHF may remain range-bound in the short run, with traders closely watching whether support at 0.92 can sustain another upward attempt.
USD/CHF
The U.S. dollar posted gains against the Swiss franc during the week, but a significant portion of those advances was later erased. This price action suggests that the pair may be due for a corrective pullback after its recent rally.
The 0.80 level stands out as a key area to watch. A retreat toward this support zone could provide a potential buying opportunity if the market shows signs of stabilization and renewed bullish momentum. Traders may look for a bounce from this level as confirmation of a possible continuation higher.
On the upside, a breakout above the high of the current weekly candlestick would strengthen the bullish outlook and could lead to a test of the 0.82 level.
Overall, the short-term bias remains cautiously positive, although a pullback toward support may be needed before the next leg higher can develop.
USD/MXN
The U.S. dollar advanced against the Mexican peso during the week, but the 17.50 level once again proved to be a strong area of resistance. The subsequent pullback from those highs is not particularly surprising and suggests that the pair may continue trading within its established consolidation range.
Looking ahead, USD/MXN is likely to remain volatile and range-bound as traders assess the next directional catalyst. While occasional swings above or below recent levels are possible, the broader price action continues to favor consolidation rather than the start of a sustained trend.
Even if the U.S. dollar manages to break decisively higher against the Mexican peso, the move may not offer an attractive trading opportunity given the pair’s tendency to remain choppy and unpredictable. For now, traders may be better served by focusing on short-term range dynamics rather than chasing a potential breakout.
Nasdaq 100
The Nasdaq 100 moved lower throughout the week, but the broader picture suggests that the index is simply consolidating after an extended rally. Recent weakness appears to be a healthy pause as the market works off some of the excess optimism and overbought conditions that developed earlier.
Despite the pullback, the longer-term outlook remains constructive. Buyers are likely to re-emerge over time, although current market conditions do not necessarily justify taking large positions. The index may continue to trade within a range while investors assess economic data, corporate earnings, and monetary policy expectations.
Short-term declines could present attractive buying opportunities, particularly if prices approach the 28,500 level, which may act as a significant support area. For now, the focus remains on identifying value during pullbacks rather than betting against the broader uptrend.
Overall, the bias remains cautiously bullish, with dip-buying favored over short-selling.
GBP/USD
The British pound posted a modest recovery against the U.S. dollar during the week, with the 1.32 level continuing to establish itself as an important support zone. The market’s ability to hold above this area suggests that buyers remain active and willing to defend the pair on pullbacks.
On the upside, the 1.33 level remains a key resistance barrier. A successful move above this threshold would strengthen bullish sentiment and could pave the way for a further advance toward the 1.35 level.
In the near term, GBP/USD is likely to remain range-bound between support at 1.32 and resistance at 1.33 as traders wait for a stronger catalyst. However, a breakout above the upper boundary of this range could signal the start of a more sustained upward move.
Overall, the outlook remains cautiously positive, with the potential for additional gains if buyers can push the pair decisively above 1.33.
EUR/USD
The euro experienced a notable decline against the U.S. dollar during the week but managed to recover and return to the 1.14 area. This level has served as a major short-term support zone for much of the past year, making current price action particularly important for determining the pair’s next direction.
After briefly breaking below 1.14, the market has rebounded to retest this key level. Traders will be watching closely to see whether it acts as resistance following the breakdown or if buyers can regain control and push the pair higher.
A sustained move above 1.1450 would improve the bullish outlook and could encourage additional buying interest in the euro. However, there is also a strong possibility that EUR/USD remains anchored around the 1.14 level while the market searches for a clearer catalyst.
Ultimately, the pair’s direction may depend less on euro-specific factors and more on the broader performance of the U.S. dollar. As a result, developments in U.S. economic data, interest rate expectations, and overall dollar sentiment are likely to play a decisive role in shaping EUR/USD’s next major move.
USD/JPY
The U.S. dollar continued its gradual advance against the Japanese yen during the week, maintaining the bullish momentum established by recent breakouts. As a result, USD/JPY remains one of the key currency pairs to watch in the current market environment.
The 162.00 level represents an important resistance zone. A decisive break above this threshold could signal the continuation of the broader uptrend and open the door to further gains for the U.S. dollar.
While Japanese authorities have recently intervened in the currency market to support the yen, the underlying fundamentals still appear favorable for USD/JPY. In particular, the significant interest rate differential between the United States and Japan continues to attract investors toward the pair.
Short-term pullbacks may therefore present buying opportunities, especially if prices retrace toward the key 160.00 level, which is likely to act as an important support area. As long as this zone holds, the overall bullish bias remains intact.
Overall, the outlook continues to favor the upside, with traders closely monitoring whether USD/JPY can break through 162.00 and extend its recent rally.
Silver stays under pressure near $57.00 after plunging roughly 12% over the past two sessions.
Growing expectations of further Fed rate hikes have weighed heavily on precious metals this week.
XAG/USD is now trading in deeply oversold territory, signaling the possibility of a corrective rebound.
Silver (XAG/USD) extends its decline on Thursday, hovering near seven-month lows around $57.00 at the time of writing after tumbling nearly 12% over the previous two sessions. Growing expectations that the Federal Reserve (Fed) could raise interest rates later this year have pressured precious metals throughout the week, while investors now turn their attention to the upcoming US Personal Consumption Expenditures (PCE) Price Index data for further policy clues.
A series of stronger-than-expected US economic releases, particularly improving labor market conditions and persistently elevated inflation, has reinforced the Fed’s hawkish tone in recent weeks. Markets currently see a 32% probability of a rate hike at next month’s meeting and a 65% chance of monetary tightening by September. This outlook has lifted US Treasury yields and strengthened the US Dollar, adding further downside pressure on Silver.
Thursday’s US economic calendar features several key releases, though the spotlight remains on the May PCE Price Index report. Annual PCE inflation is forecast to accelerate to 4.1%, marking its highest level in three years, as the data precedes the recent drop in Crude Oil prices. Such figures are unlikely to offer meaningful relief for Silver prices.
Technical Analysis: The intraday RSI has slipped into oversold territory, signaling the potential for a short-term corrective rebound.
XAG/USD trades around $57.14, maintaining a bearish short-term outlook, although oversold conditions suggest the recent decline may be overstretched. On the 4-hour chart, the Relative Strength Index (14) sits near 20, while the Moving Average Convergence Divergence (MACD) histogram remains in negative territory but is gradually moving toward the zero line, indicating that bearish momentum could be fading.
The December 4, 2025 low near $56.45 continues to provide immediate support, with the next downside target located around the mid-$54.00 region, corresponding to the October and November 2025 highs. A deeper decline could then expose the November 21, 2025 low at $48.64.
On the upside, any recovery attempt is expected to encounter initial resistance around the previous support zone near $61.40. Additional barriers are seen near the June 22 high around $67.00, followed by the June 17 peak close to $71.60.
Gold comes under selling pressure for a third straight session, showing little reaction to a slight pullback in the US Dollar.
Meanwhile, easing inflation concerns have led traders to scale back expectations of further Federal Reserve rate hikes, limiting the US Dollar’s upside.
Investors are now turning their attention to the upcoming US PCE inflation data for clearer signals on the Fed’s future policy direction and fresh market momentum.
Gold (XAU/USD) recovers from the area near its lowest level since November 2025, reached in the previous session, and trades around the key $4,000 level during Thursday’s late Asian trading hours. A slight pullback in the US Dollar (USD) provides some support for the precious metal as traders adjust positions ahead of the release of the US Personal Consumption Expenditures (PCE) Price Index. The important inflation report is expected to shape expectations for the Federal Reserve’s (Fed) future monetary policy and influence the non-yielding metal.
At the same time, inflation concerns have eased in recent weeks as Crude Oil prices dropped sharply following the reopening of the Strait of Hormuz. In addition, a temporary 60-day sanctions waiver allowing the production, shipment, and sale of Iranian crude oil and petrochemical products pushed oil prices to their lowest levels since before the US-Iran conflict. Lower oil prices could reduce inflationary pressure, prompting traders to cut back expectations for additional Fed rate hikes. As a result, US Treasury yields have weakened, limiting further gains in the USD and offering some relief to Gold prices.
However, according to the CME Group FedWatch Tool, investors still see more than an 80% probability that the Fed will raise interest rates again before the end of the year, which may help prevent a significant decline in the USD. Meanwhile, the recent global selloff in technology stocks continues to hurt market sentiment and supports demand for the safe-haven US Dollar. This strengthens expectations for further short-term weakness in Gold prices, suggesting that any recovery attempts may face selling pressure and remain limited. In addition, staying below the important $4,000 psychological level reinforces the bearish outlook for the precious metal.
Gold H4 Chart
Gold sellers remain cautious as oversold market conditions hint that the recent decline may be losing momentum, though the broader bearish outlook remains intact. Repeated failures near the 100-period Simple Moving Average (SMA) on the 4-hour chart, combined with the overnight drop below the previous year-to-date low and the key $4,000 level, reinforced bearish sentiment toward XAU/USD. However, the 14-period Relative Strength Index (RSI) is hovering near oversold territory around 28, suggesting that the downward momentum could begin to slow. As a result, traders may prefer to wait for a period of consolidation or a short-term rebound before expecting another deeper decline.
At the same time, the Moving Average Convergence Divergence (MACD) remains below the zero line and continues to weaken, indicating that any recovery attempts may struggle while Gold trades well below the 100-period SMA near $4,258. Meanwhile, any stronger rebound above the $4,000 psychological level could attract renewed selling interest around the $4,065–$4,070 zone, likely limiting gains near the $4,100 area. Buyers would need to break decisively above that resistance region to reduce immediate bearish pressure and support a more sustained upward move toward the 100-period SMA.
After the latest price action, markets are nearing a key inflection point.
The U.S. dollar is pressing against a significant resistance area, while precious metals are holding just above important support levels. The way today’s session closes could offer the confirmation traders have been waiting for and help define the next major directional move.
U.S. Dollar Index (DX.F)
As noted in the prior session:
“(…) The dollar remains confined within a relatively tight range, with recently reclaimed March highs acting as support, while a major resistance zone caps upside near the 38.2% Fibonacci retracement, the upper edge of the rising channel, and a bearish gap from late May 2025 (100.75–100.95). (…)”
From a current standpoint, buyers have successfully defended the reclaimed March highs, giving the dollar enough momentum to retest the highlighted resistance cluster.
At present, the index is trading above both the 38.2% Fibonacci retracement and the prior bearish gap from last year. However, the upper boundary of the rising channel remains a key barrier.
This level is important because today’s close could prove decisive not only for the dollar but also for the broader metals complex.
A daily close above the channel resistance would signal a potential breakout, opening the path toward the next resistance zone around 101.39–101.59, where the 127.2% Fibonacci extension aligns with the May 2025 highs. Such a development would likely weigh on precious metals.
Conversely, another failed breakout—similar to Friday’s rejection—could push the dollar back toward the March highs, offering relief to metals and easing downside pressure.
In short, today’s close may be one of the most consequential of the week.
Platinum (PL.F)
On the daily chart, one clear observation stands out.
Although platinum has not yet registered a daily close below the key 1641 level, buyers were unable to hold the June low—a technical signal that raises doubts about their commitment to sustaining higher prices.
The current low is now positioned within an important support zone, formed by two bullish gaps from late November, the lower boundary of the orange channel, and the 127.2% Fibonacci extension.
Put differently, support is still present.
However, support by itself is not sufficient.
If buyers fail to reclaim 1665 by today’s close—in effect losing the bullish gap from June 12—a move toward the 1600 area becomes increasingly probable, particularly if the U.S. dollar maintains upward momentum, consistent with Friday’s bearish scenario.
On the other hand, the first meaningful sign of recovery would be a daily close back above 1707, which would also reinforce the earlier invalidation of the break below the March low.
Palladium (PA.F)
To frame today’s session, it is useful to revisit yesterday’s outlook:
“(…) Palladium remains below the previously broken lower boundary of the orange consolidation. As long as price holds below 1305, a further decline toward the 1234 area cannot be ruled out. (…)”
From today’s perspective, palladium has largely followed that bearish roadmap, with the downside target now reached. Price is currently trading beneath the lower boundary of the June 12 bullish gap.
This is an unfavorable development for buyers.
The reason is straightforward: a sustained break below that gap threatens the validity of the previously discussed double-bottom structure.
At this stage, bulls need to act quickly to reclaim the gap. If they fail to do so, the market is likely to shift its focus toward the possibility of another downside extension.
Copper (HG.F)
Copper (HG.F) moved in line with yesterday’s technical expectations. As previously noted:
“(…) As long as Thursday’s price gap remains unfilled, the bearish outlook for Friday stays in place:
“(…) with the downside gap from Thursday still acting as overhead resistance, a retest of today’s low and a possible move toward the next support area around 617–619 remains on the table.”
The failed attempt to break back into the lower edge of Thursday’s bearish gap sparked renewed selling pressure, and price ultimately reached the projected downside target (well done to those who positioned for the move).
From here, the setup becomes more nuanced.
Copper has now entered a key support region defined by prior highs from February and April, along with the May 20 low. This zone previously stabilized price action in May and could again act as a base for buyers to step in.
However, given the strength and momentum of today’s bearish candle, any recovery may initially be limited, with a move toward the 38.2% Fibonacci retracement near 611 looking more likely than a full bullish reversal at this stage.
Today’s Takeaway
Dollar (DX.F)
Focus on the upper boundary of the rising channel
A daily close above it would open the path toward 101.39–101.59
Rejection would likely lead to a retest of the March highs
Today’s close is a key confirmation point
Platinum (PL.F)
Key level to watch: 1665
A close below this support keeps bearish pressure in place
Next major support lies near 1600
Bullish momentum only improves on a move back above 1707
Palladium (PA.F)
Trading below the June 12 bullish gap at 1249 raises the risk of further downside and a retest of recent lows
A recovery back above this level would weaken the bearish setup
Copper (HG.F)
Currently testing the 612.85–615 support zone
Next key level below is 611
A move back above 627.50 would invalidate today’s bearish breakdown
Stay disciplined, respect key levels, and let confirmation guide positioning.
The S&P 500 Shiller CAPE ratio suggests US equities are extremely expensive, yet even that overvaluation pales in comparison to the apparent distortion in US government bond pricing.
Back in 1979, during the peak of the last 40-year stagflation cycle, interest rates around 15% pushed federal debt servicing costs (on roughly $800 billion of debt) to about $120 billion—nearly a quarter of government revenues.
At current scale, 15% interest rates on roughly $40 trillion of US debt would imply about $6 trillion in annual interest expense—exceeding the federal government’s roughly $5 trillion in yearly revenues.
Put differently, the same rate environment that produced severe fiscal stress in the late 1970s would translate into debt-service costs larger than total government income today, underscoring how much more sensitive the system has become to interest rates.
The implication often drawn is that meaningful rate increases could create extreme fiscal pressure for the US government, raising questions about how households and investors might seek protection from such a scenario, including through assets like gold.
A long-term Dow chart reflects how persistently low interest rates and monetary expansion have supported equity valuations over time, contributing to elevated market multiples relative to historical norms.
At the same time, this period has coincided with a significant rise in government indebtedness, while official gold reserves have remained largely unchanged, becoming proportionally smaller relative to the expanding scale of the economy and financial system.
Long-term US interest rate dynamics raise concerns in this view about fiscal vulnerability in a scenario where equities fall sharply while inflation rises. The argument is that such a combination would erode tax revenues while simultaneously pushing debt servicing costs higher, potentially placing extreme strain on public finances.
From this perspective, the system is described as a large debt-dependent structure exposed to significant macro shocks, with gold seen as having a diminished role relative to the scale of today’s economy. The comparison is often made that the US now holds roughly 8,000 tons of gold versus about 20,000 tons in 1940, despite a much larger population and a vastly expanded GDP measured in nominal terms.
However, the conclusion that this necessarily leads to “financial collapse” or “government bankruptcy” is a strong and contested interpretation. Modern sovereign debt systems operate differently from households or commodity-backed regimes, and outcomes in high-debt environments depend heavily on monetary policy, refinancing capacity, inflation dynamics, and institutional credibility—not only on static gold coverage ratios.
Suggestions like large-scale gold accumulation or strict spending reductions reflect one policy viewpoint, but they are not the only proposed or historically used tools for managing debt stress, and their effectiveness would depend on broader macroeconomic conditions rather than acting as a standalone solution.
The short-term hourly gold chart is showing conditions that some traders interpret as oversold on weekly stochastic indicators, alongside price action that could be consistent with a potential double-bottom formation around the $4,000 level.
If that pattern plays out, it is typically viewed as a bullish reversal setup, with projected upside targets in the $4,700–$4,900 area based on the measured move of the formation.
From a technical perspective, the setup being described frames gold as sitting in a broader consolidation phase where momentum oscillators (like a 14,5,5 stochastic) have rolled into oversold territory. In that kind of regime, price action often becomes less linear: oversold conditions can either resolve quickly with a sharp mean-reversion bounce, or persist while price drifts lower to retest liquidity zones.
The highlighted levels—around $3,900 and $3,500—are being treated as lower-bound “value areas” where longer-horizon buyers might look for entry, assuming the broader structural uptrend remains intact.
That said, stochastic signals alone don’t define durable bottoms. In macro-driven assets like gold, those turning points tend to align more reliably with shifts in real yields, USD liquidity conditions, and risk sentiment rather than oscillators in isolation. So the setup you’re describing is less a prediction and more a conditional map: if momentum stabilizes while macro pressure eases, oversold can convert into a recovery phase; if not, oversold can simply stay oversold while price re-prices lower.
A daily chart view framed this way is essentially mapping recurring “support-zone behaviour” across multiple asset classes, highlighting where dip-buying interest has historically emerged in 2026.
In that structure, the idea is that gold, equities, and silver are not moving in isolation but are instead rotating through shared liquidity-driven pullbacks—each time testing prior demand areas before resuming broader trends. The February move into ~$4,400, the Dow’s pullback toward ~45,000, and the more recent gold dip into the $4,100–$4,000 zone are being interpreted as successive examples of that same pattern.
From a technical standpoint, this kind of narrative depends heavily on whether those levels consistently produce rebounds with expanding momentum afterward. If they do, they can reinforce a “buy-the-dip” regime; if they fail, the same zones often convert into breakdown levels as trend structure shifts.
So the core takeaway isn’t just the levels themselves, but whether the market continues to respect them as demand areas—or begins to trade through them with increasing acceptance.
That statement is essentially describing a discretionary swing-trading framework rather than a verifiable universal outcome.
In that narrative, 2026 is being characterized as a “range-with-dips” environment where buying major support zones in correlated assets—gold, silver, and equities like the Dow—has repeatedly offered favorable risk/reward entries. If those levels held and produced rebounds, traders operating that playbook would indeed have captured a series of tactical moves.
However, it’s worth separating selected successful instances from a broader claim about outcomes. Swing trading performance depends heavily on timing, position sizing, and exit discipline—so even within the same “zones,” results can vary significantly across participants. In addition, what looks like clean support in hindsight is often less reliable in real time, where breakdowns and false bounces are common.
So the more precise framing is: this describes a period where dip-buying major support in correlated macro assets has been a viable strategy for some traders, rather than a consistently reliable or guaranteed edge.
If that’s what’s been happening in parts of the CDNX (TSX Venture) universe, it fits a familiar pattern: small-cap resource and exploration names tend to be highly sensitive to macro “risk-on/risk-off” swings in precious metals and major indices.
When gold and the Dow both stabilize or rebound from widely watched support zones, liquidity typically improves across the risk spectrum. In that environment, higher-beta equities—especially junior miners and exploration names—often amplify the underlying move, which is how you can get 30–100% advances off the lows in relatively short windows.
That said, those kinds of moves also come with a structural caveat: CDNX rallies are usually very asymmetric. The same liquidity conditions that drive sharp upside can reverse quickly when metals or equities roll over again, so performance dispersion tends to be extreme—big winners coexist with names that don’t recover at all.
So the dynamic you’re describing is consistent with a classic “beta expansion phase” in resource juniors, but it’s inherently cyclical rather than steady-state behavior.
What you’re describing is a classic “high-beta confirmation” narrative: when gold stabilizes at major support zones, the gold miners (via something like VanEck Gold Miners ETF) tend to amplify the move, so rebounds in the metal can translate into outsized percentage gains in equities.
That part is structurally reasonable: miners are leveraged to the gold price through operating leverage (fixed costs + revenue tied to gold), so 10–15% moves in gold can sometimes produce 20%+ moves in the index during strong liquidity phases. When that aligns with broader risk-on conditions in equities like the Dow, you can get compressed “surge phases” where multiple dips across assets reverse together.
Where the framing becomes more interpretive is in the leap from observed cyclical rallies to conclusions about certainty, inevitability, or macro end-state outcomes. Markets rarely move cleanly from “identified buy zones” to uninterrupted advances; even strong trends typically include sharp retracements, failed breakouts, and volatility resets that punish conviction leverage.
So a more grounded way to put it would be:
Yes, miners can and often do outperform gold in rebound phases
Yes, multiple 20%+ bursts in a year are entirely plausible in that segment
But no, those zones don’t function as fixed “rules,” and timing risk remains high even when the broader trend is right
In other words, the opportunity set can be real, but it’s probabilistic, not deterministic—and the same structure that produces fast upside also produces equally fast reversals when liquidity shifts.
WTI crude oil entered a phase of bearish consolidation after sliding to its lowest level since March, with sentiment remaining weighed down by easing supply concerns. The resumption of shipping activity through the Strait of Hormuz reduced fears of major supply disruptions, putting additional pressure on oil prices.
However, the downside appears somewhat limited as traders remain cautious amid mixed signals surrounding relations between the United States and Iran. Conflicting statements regarding nuclear negotiations and broader geopolitical developments have discouraged market participants from aggressively increasing bearish positions, helping WTI hold above the mid-$72.00s region.
West Texas Intermediate (WTI) crude oil traded in a narrow range during Wednesday’s Asian session, consolidating just above the mid-$72.00s per barrel after falling to its lowest level since early March in the previous session.
Oil prices remained under pressure as signs of improving supply conditions eased market concerns. Shipping activity through the Strait of Hormuz has gradually resumed, with reports indicating that a limited number of vessels are being allowed to transit the strategic waterway each day under coordination with Iran’s naval authorities. At the same time, the United States Department of the Treasury granted a temporary 60-day sanctions waiver permitting the production, transportation, and sale of Iranian crude oil, petroleum, and petrochemical products through August 21. Combined with progress in diplomatic discussions between the United States and Iran, as well as a reduction in hostilities involving Lebanon, these developments have helped alleviate fears of supply disruptions and reinforced the bearish outlook for crude prices.
However, sellers remain cautious about extending losses aggressively due to lingering geopolitical uncertainty. While Donald Trump stated that Iran had agreed to extensive long-term nuclear inspections, Iranian officials pushed back against the claim, insisting that no new commitments had been made regarding inspections. The conflicting narratives have kept geopolitical risk premiums embedded in the market, offering some support to oil prices.
From a technical perspective, the absence of strong follow-through selling below the closely watched 200-day Simple Moving Average (SMA) suggests that downside momentum may be losing pace in the short term. Even so, with supply concerns continuing to ease and diplomatic progress reducing immediate geopolitical risks, the broader fundamental backdrop still points to a bearish bias for WTI crude oil.
Gold remained under pressure, extending its decline as growing expectations of additional Federal Reserve rate hikes continued to strengthen the US Dollar. Meanwhile, easing inflation concerns provided little incentive for buyers to return to the market, leaving the precious metal vulnerable. With technical indicators still pointing lower, traders are increasingly focused on upcoming US PCE inflation data for clues on the Fed’s next policy move.
Gold (XAU/USD) remains under pressure for a second consecutive session, marking its fifth decline in the last six trading days, and slips to its lowest level in nearly two weeks during Wednesday’s Asian trading hours. Although falling crude oil prices have helped ease inflation concerns, markets are increasingly pricing in the possibility of another interest rate hike from the US Federal Reserve in 2026. This expectation has lifted the US Dollar (USD) to its strongest level since May 2025, reducing demand for non-yielding assets such as gold.
Oil prices have dropped sharply over the past month and reached their lowest point since early March on Wednesday following the gradual reopening of shipping routes through the Strait of Hormuz. According to Iran’s Fars News Agency, a military source confirmed that a limited number of vessels are being permitted to transit the waterway each day under the supervision of Iran’s Revolutionary Guards Navy. At the same time, the US Treasury granted a temporary 60-day sanctions waiver allowing the production, transportation, and sale of Iranian crude oil and petrochemical products. These developments have eased concerns about global energy supplies, keeping downward pressure on oil prices and reducing inflationary risks.
Despite softer inflation expectations, investors have strengthened their bets that the Fed could raise interest rates by at least 25 basis points in 2026 after last week’s hawkish policy guidance. Nine out of the Fed’s 19 policymakers indicated that further tightening may be necessary to keep inflation under control. Reinforcing this view, newly appointed Fed Chair Kevin Warsh emphasized the importance of price stability during his post-meeting remarks, signaling that the central bank may be reluctant to cut rates even if economic growth slows.
Meanwhile, conflicting signals surrounding Iran’s nuclear program continue to support the US Dollar. US Vice President JD Vance stated on Monday that negotiations in Switzerland had led Iran to agree to allow inspectors from the International Atomic Energy Agency (IAEA) access to its nuclear facilities. President Donald Trump also claimed that Tehran had accepted the highest level of nuclear inspections for the foreseeable future. However, Iran’s foreign ministry, quoted by state media, denied making any new commitments regarding inspections. The uncertainty surrounding these negotiations maintains geopolitical risk in the market, supporting the dollar and adding further downside pressure to gold prices.
Market participants are now awaiting Thursday’s release of the US Personal Consumption Expenditures (PCE) Price Index, which could provide fresh direction for both the dollar and gold markets.
XAU/USD 4-hour chart
Following several failed attempts to break above the 100-period Simple Moving Average (SMA) on the 4-hour chart, a decisive move below the $4,100 level could provide fresh momentum for XAU/USD sellers. Technical indicators continue to favor the downside, with the Relative Strength Index (RSI) lingering near oversold territory around 31, while the Moving Average Convergence Divergence (MACD) remains firmly negative and continues to trend lower. Although occasional short-covering rallies may occur, the broader technical outlook suggests that bearish pressure remains intact, increasing the likelihood of a move back toward the year-to-date low around $4,024-$4,023, which was recorded earlier this month.
On the upside, the 100-period SMA at $4,287.33 represents the first significant resistance level. A sustained break above this barrier would be required to weaken the current bearish outlook and potentially pave the way for a broader consolidation phase. Until such a breakout materializes, rallies into the $4,280-$4,290 zone are likely to attract renewed selling interest, particularly as momentum indicators continue to show little evidence of a lasting bullish reversal.
Silver came under pressure after Fed Chair Kevin Warsh struck a surprisingly hawkish tone, with updated projections pointing to possible future rate hikes.
However, the white metal could regain momentum as easing inflation concerns tied to advancing US-Iran peace talks improve overall market sentiment. US Vice President JD Vance said negotiations had made “great progress,” despite lingering tensions.
Silver prices fell more than 1% during Tuesday’s Asian session, slipping to around $64.50 per troy ounce after posting modest gains a day earlier, as markets reacted to the Federal Reserve’s hawkish policy outlook.
Although the Fed kept interest rates unchanged at 3.50%–3.75% last week, updated projections and comments from new Fed Chair Kevin Warsh signaled a more aggressive stance than investors expected. Markets are now fully pricing in a 25-basis-point rate hike in September, with some traders even anticipating a small chance of tightening as early as next month.
Still, losses in Silver may remain limited as progress in US-Iran peace negotiations eases inflation concerns. US Vice President JD Vance said talks had made “great progress” despite lingering tensions, while Iranian Foreign Minister Abbas Araghchi also reported significant advances in the Swiss negotiations. Iran’s agreement to allow inspectors from the International Atomic Energy Agency back into the country further boosted optimism.
Precious metals, including Silver, have remained under pressure since Middle East tensions escalated in late February, as fears of disrupted oil flows through the Strait of Hormuz pushed crude prices higher and fueled expectations of prolonged elevated interest rates. However, sentiment improved after Washington granted Tehran a 60-day license to resume international oil sales, raising expectations of stronger global crude supply and easing inflationary pressures that had weighed on safe-haven assets.
United States Dollar Index remains close to 13-month highs
The United States Dollar Index stays near a 13-month peak around 101.13, supported by hawkish expectations surrounding the Federal Reserve policy outlook. Meanwhile, US Vice President JD Vance stated that negotiations have achieved “great progress,” despite lingering tensions behind the scenes.
The United States Dollar Index (DXY), which tracks the US Dollar against six major currencies, traded steadily near the 101.00 mark during Tuesday’s Asian session after posting modest gains in the previous session.
The index continues to hover close to its 13-month high of 101.13, reached on June 19, as markets maintain a hawkish view on the Federal Reserve policy outlook. The Fed kept interest rates unchanged at 3.50%–3.75% during its June meeting.
Still, updated economic forecasts and remarks from Kevin Warsh, who chaired his first Fed meeting, were viewed as more hawkish than expected. Following the announcement, futures markets fully priced in a 25-basis-point rate hike for September, while also assigning a small probability to a potential increase as early as next month.
Despite the Dollar’s resilience, easing geopolitical tensions may limit further upside. Ongoing peace discussions between the US and Iran have improved market sentiment and reduced inflation concerns. According to CNBC, US Vice President JD Vance said negotiations had made “great progress,” although some tensions remain unresolved.
On Monday, Vance also stated that Iran had agreed to allow inspectors from the International Atomic Energy Agency back into the country. Iranian Foreign Minister Abbas Araghchi echoed the positive tone, noting that the Switzerland talks had produced “major progress.”
Gold holds steady near $4,200 as US–Iran peace progress offset by Fed hawkish stance
Gold prices remain flat near $4,190 during early Asian trading on Tuesday. Progress in US–Iran peace negotiations may pressure the precious metal, while expectations of a Fed rate hike later this year grow after the new Fed Chair struck a hawkish tone.
Gold prices remained steady near $4,190 during Tuesday’s early Asian session as traders monitored ongoing developments surrounding the US–Iran peace negotiations.
US Vice President JD Vance said talks between Washington and Tehran had made “great progress,” despite recent tensions. He noted that negotiations in Bürgenstock were continuing and that Iran had agreed to allow inspectors from the International Atomic Energy Agency back into the country.
However, discussions became strained after Iran announced the closure of the Strait of Hormuz in response to Israeli strikes on Lebanon, arguing the attacks violated the ceasefire agreement.
According to Saxo Bank analyst Ole Hansen, energy prices remain a major short-term driver for precious metals. He added that the uneven progress in US–Iran talks could pressure oil prices while supporting demand for gold.
Meanwhile, expectations for tighter US monetary policy also weighed on bullion. Markets increasingly anticipate a Federal Reserve rate hike later this year after new Fed Chair Kevin Warsh adopted a hawkish stance on inflation during his first policy meeting. Higher interest rates tend to reduce gold’s appeal since the metal does not offer yields.
Traders are now pricing in nearly an 89% probability of a Fed rate hike in December, up sharply from 61% before last week’s FOMC meeting, according to the CME FedWatch Tool.
Fresh negotiations between the United States and Iran were abruptly cancelled, reviving concerns about whether the recently agreed ceasefire can hold.
The talks had been planned for Friday in Switzerland and were intended to continue discussions on Iran’s nuclear program under a memorandum of understanding aimed at ending recent hostilities. However, they were called off soon after U.S. Vice President JD Vance withdrew from the meeting.
Iranian state-linked media said Tehran is seeking stronger proof that Washington is fully honoring the agreement before agreeing to resume negotiations. While the cancellation does not automatically signal a breakdown in the peace process, it underscores that significant mistrust remains between both sides.
Oil markets reacted negatively, with prices declining again in London trading on Friday and heading for their steepest weekly loss in months. Earlier optimism around the U.S.–Iran understanding had raised expectations of additional oil supply returning to global markets.
Both major benchmarks are now on track to fall nearly 10% for the week, trading close to their lowest levels since early March. The conflict between the two countries initially escalated in late February.
A key element of the agreement involves the gradual reopening of the Strait of Hormuz—an essential route for about one-fifth of global oil and LNG flows—which has been largely disrupted during the conflict.
Still, investors remain cautious that any renewed escalation could tighten energy supply, revive inflation pressures, and increase volatility across global financial markets.
At the same time, a more hawkish shift among major central banks suggests policymakers are increasingly focused on controlling inflation, even if it limits support for risk assets such as precious metals.
Recent policy meetings have reinforced this tone. The European Central Bank delivered its first rate hike since 2023, followed by the Bank of Japan, which raised borrowing costs to their highest level since 1995.
Both institutions pointed to inflation risks linked to potential energy disruptions from instability around the Strait of Hormuz as a key justification for tighter policy.
In the United States, the Federal Reserve left rates unchanged but signaled a stronger tightening bias ahead, with nine officials projecting further hikes this year. The latest statement under new Chair Kevin Warsh emphasized “price stability” and dropped earlier references to maximum employment.
Similarly, the Bank of England held rates steady but maintained a hawkish voting split despite softer inflation and labor data, according to Barclays analysts.
Turning to gold, futures have shown a sustained downward trajectory after peaking at $5,643.29, with a steep decline forming since January 2026.
Despite a brief rebound toward $4,577.30, prices have since fallen to a low of $4,046.20 and were last trading near $4,173.25. This keeps the market vulnerable to further downside, particularly if it breaks below the 20-day EMA around $3,885, especially amid renewed geopolitical uncertainty following the postponed talks.
Technical Levels to Watch
Monthly chart: Gold futures remain in a broad downtrend, having broken below the 9 EMA ($4,368). The next major support is the 20 EMA near $3,885, and a break below this level could accelerate selling pressure.
Weekly chart: Prices opened the week at $4,289.40, reached a high of $4,403.60 and a low of $4,139.20, and are now trading below the 50 EMA ($4,264). A bearish crossover has formed, with shorter-term EMAs trading below longer-term ones, leaving the market vulnerable to a move toward support around $4,124.
Daily chart: After opening at $4,207.47, gold moved between $4,216.90 and $4,139.20, currently trading below the 200 EMA ($4,305.84). Multiple EMAs have turned bearish, reinforcing downside momentum and leaving $4,124 as the immediate level to watch.
Friday’s closing price will likely be important in determining near-term direction, though weekend geopolitical developments—particularly shifts in U.S. policy—could still influence sentiment.
Overall, a decisive break below $4,124 could trigger accelerated selling over the short term, although confirmation will depend heavily on where the market settles into the weekly close.
Gold rebounds from a more than one-week low, ending a three-session losing streak, though upside momentum remains limited.
Softer inflation concerns and expectations for lower interest rates provide some support for the precious metal.
However, uncertainty surrounding Iran and the Federal Reserve’s hawkish stance continue to strengthen the US Dollar and restrain gold’s gains.
Gold (XAU/USD) started the week on a firmer footing, recovering from a more than one-week low reached on Friday and ending a three-session losing streak. The rebound comes as crude oil prices retreat after opening with a modest bullish gap, following the announcement by Qatar and Pakistan of a formal 60-day framework designed to advance a final peace agreement between the United States and Iran. Lower oil prices have helped ease concerns about inflationary pressures and the prospect of higher interest rates, providing some support for the precious metal.
However, the upside for gold remains limited as markets continue to anticipate tighter monetary policy from the Federal Reserve. Traders currently see a strong likelihood that the Fed will raise interest rates before the end of the year, following last week’s hawkish guidance. Policymakers indicated that additional tightening may be necessary if inflation proves persistent. Fed Chair Kevin Warsh also emphasized the importance of maintaining price stability, suggesting that the central bank may be reluctant to cut rates quickly even if economic growth slows.
At the same time, geopolitical tensions continue to support the US Dollar. Over the weekend, Iran accused the United States and Israel of breaching the ceasefire agreement and announced the renewed closure of the Strait of Hormuz, citing ongoing Israeli military operations in Lebanon. Adding to market concerns, US President Donald Trump warned of further military action against Iran should Hezbollah continue its attacks on Israel. These developments highlight the fragile nature of the diplomatic process and keep geopolitical risk firmly in focus.
Further support for the safe-haven US Dollar comes from the escalating conflict in Eastern Europe, where Russia has intensified strikes on major Ukrainian cities. As a result, the Greenback has remained well supported after retreating from its highest level since May 2025, limiting the scope for a stronger gold recovery and encouraging caution among bullish traders.
Looking ahead, investors will closely monitor developments surrounding US-Iran relations, as any new headlines could generate significant volatility across global markets. In addition, remarks from key FOMC officials are likely to influence expectations for US monetary policy, shaping demand for the US Dollar and affecting gold prices. Given the current fundamental backdrop, any near-term rebound in gold may continue to attract sellers and struggle to gain sustained momentum.
XAU/USD Daily Chart Analysis
Gold may find it difficult to build on its intraday rebound as the broader technical outlook continues to favor the downside. Last week’s inability to break back above the 200-day Exponential Moving Average (EMA), which has now turned into a significant resistance level, followed by a renewed decline, reinforces the bearish bias surrounding XAU/USD.
Momentum indicators also suggest that buyers remain cautious. The Relative Strength Index (RSI) is holding in the upper-30s, reflecting weak bullish momentum and limited appetite for aggressive buying. Meanwhile, the Moving Average Convergence Divergence (MACD) remains below the zero line, with a slightly negative histogram indicating that bearish momentum is moderating but has yet to show signs of a meaningful reversal.
On the upside, the 200-day EMA around $4,334 represents the first major hurdle for gold bulls. A sustained daily close above this level would be required to ease the current bearish pressure and improve the near-term outlook. Until then, any recovery attempts are likely to be viewed as corrective moves within a broader consolidation phase, while prevailing momentum signals continue to leave the door open for additional downside tests in the sessions ahead.
Oil prices weakened after the US and Iran signaled advances in diplomatic talks.
Tehran says it secured waivers allowing continued oil and petrochemical exports.
A sustained reopening of the Strait of Hormuz could push WTI back toward the pre-war area around $67.20.
West Texas Intermediate (WTI) crude futures on NYMEX fell 1.2% to around $75.50 during Monday’s Asian session, surrendering early gains as optimism grew over diplomatic progress between the United States and Iran following negotiations held in Switzerland over the weekend.
Iranian Foreign Minister Abbas Araghchi described the talks as having achieved “great progress,” stating that Tehran had secured waivers for oil and petrochemical exports, the lifting of the US naval blockade on Iranian ports, the release of certain frozen assets, and the initiation of a reconstruction and development program.
The positive remarks from Tehran carried particular weight because Iran had recently announced the renewed closure of the Strait of Hormuz, citing ongoing hostilities in Lebanon. Any indication of easing tensions reduces concerns over potential disruptions to global oil supplies.
US Vice President JD Vance also welcomed the outcome of the negotiations, describing the discussions with Iranian representatives as productive and highlighting substantial progress toward a broader agreement.
Adding to the constructive sentiment, mediators from Qatar and Pakistan reported meaningful advances in the peace process. A joint statement indicated that a high-level committee had agreed on a roadmap aimed at reaching a final agreement within 60 days, paving the way for immediate technical negotiations.
Further easing supply concerns, a spokesperson for Iran’s Foreign Ministry announced that a formal transit mechanism had been established to ensure the safe passage of commercial vessels through the Strait of Hormuz, a crucial chokepoint for global energy shipments.
With geopolitical risk premiums fading and concerns over supply disruptions diminishing, oil markets are increasingly pricing in the possibility that WTI could continue retreating toward pre-conflict levels if stability in the region is maintained.
WTI Technical Analysis
WTI crude remains under pressure, trading near $75.50 and maintaining a bearish short-term outlook. The commodity continues to trade significantly below its 20-day Exponential Moving Average (EMA) at approximately $84.05, indicating that any near-term rebounds are likely to be corrective rather than the start of a sustained uptrend. Meanwhile, the Relative Strength Index (RSI 14) is hovering around 33, reflecting persistent selling momentum and suggesting that downside risks remain dominant.
On the upside, the 20-day EMA at $84.05 serves as the first major resistance level. A decisive break above this barrier would be required to weaken the current bearish structure and could pave the way for a stronger recovery toward the $90.00 region.
To the downside, immediate support is located at the June 18 low of $72.79. A breakdown below this level could accelerate selling pressure and expose the market to a deeper decline toward the pre-conflict price zone around $67.20. As long as WTI remains below the 20-day EMA, the broader near-term bias is likely to stay tilted to the downside.
The US dollar strengthened against the Japanese yen for most of the week, extending the broader bullish trend that has dominated the pair in recent months. As long as this momentum remains intact, traders are likely to view pullbacks as buying opportunities rather than signs of a reversal.
The ¥160 level may provide initial support in the near term. If the pair falls below that threshold, additional support could emerge around ¥158, where buyers may step in once again.
Bitcoin
Bitcoin moved lower during the week, but the cryptocurrency continues to find support around the key $60,000 level. This area remains an important technical floor for the market, and traders will be closely watching whether buyers can defend it in the coming sessions.
A decisive break below $60,000 could trigger additional selling pressure, potentially opening the door for a decline toward the $50,000 level, which represents the next major support zone.
AUD/USD
The Australian dollar attempted to move higher during the week but struggled to maintain its gains, with the market retreating and signaling a degree of underlying weakness. Despite the pullback, the pair remains confined within a well-defined trading range.
The 0.6950 level continues to serve as a key support zone, while 0.7150 remains a significant resistance area. As long as these boundaries hold, AUD/USD is likely to remain range-bound, with traders looking for opportunities at the extremes of the range.
USD/MXN
The US dollar advanced against the Mexican peso during the week, but the pair continues to encounter strong resistance around the 17.50 level. This area has repeatedly attracted selling interest and remains a key barrier for further upside momentum.
A sustained break above 17.50 could signal a shift in market sentiment and pave the way for a move toward the 18.00 peso level, which would become the next major upside target.
USD/CAD
The US dollar strengthened significantly against the Canadian dollar during the week, supported by growing concerns that the Canadian economy is losing momentum. Signs of slowing economic activity and increasing recession risks have weighed on the Canadian dollar, helping to drive USD/CAD higher.
As economic conditions in Canada remain challenging, the US dollar could continue to benefit from its relative strength, particularly if investors favor safer and higher-yielding assets.
Nasdaq 100
The Nasdaq 100 posted solid gains over the course of the week, reflecting the strong bullish sentiment that continues to support the technology-heavy index. Although the market opened with a gap higher on Monday, prices later pulled back to fill that gap before resuming their upward trajectory.
The successful rebound following the gap fill suggests that buyers remain firmly in control, reinforcing the positive outlook for the index.
Gold
Gold spent most of the week under pressure, although the broader market remained relatively stable as prices continued to hold above the critical $4,000 support level. This area has become a key battleground between buyers and sellers and is likely to determine the next major directional move.
A sustained break below $4,000 could signal a significant shift in market sentiment and potentially mark the beginning of a new bearish phase. For now, however, buyers appear willing to defend this important support zone.
Silver
Silver continued to trade in a volatile and directionless manner during the week, with prices hovering around the 50-week Exponential Moving Average (EMA). Similar to gold, the metal appears to be stuck in a broad consolidation phase, lacking the momentum needed to establish a sustained trend.
The market is currently positioned between two major technical levels: $60 on the downside and $70 on the upside. These boundaries have become the primary areas to watch for the next significant breakout.
Crude oil prices continued their sharp decline on Thursday, with West Texas Intermediate (WTI) dropping nearly 3% to around $74.52 per barrel and Brent crude losing 2.7% to trade near $77.40. Both benchmarks fell to their lowest levels since early March as markets reacted to the newly signed US-Iran peace agreement and the partial reopening of the Strait of Hormuz. These developments have significantly reduced the geopolitical risk premium that had supported oil prices for months, reversing one of the largest supply-driven rallies in recent years. As tanker traffic resumes through the world’s most critical oil transit route, downward pressure on crude prices remains dominant.
The magnitude of the pullback has been remarkable. Since reaching a four-month peak in April, oil prices have fallen by roughly 38%. At the height of the US-Iran conflict, the effective closure of the Strait of Hormuz disrupted a substantial portion of global seaborne oil flows, driving Brent crude to levels not seen since the 2022 energy crisis. More than 11 million barrels per day of Middle Eastern production were temporarily removed from the market, inventories tightened sharply, and prices surged into triple-digit territory. With the ceasefire now in place and shipping activity gradually returning, traders are rapidly adjusting expectations to reflect the prospect of recovering supply.
However, the outlook remains far from straightforward. Global inventories are still under pressure after months of heavy drawdowns, and restoring Iranian and regional oil production could take considerably longer than current market pricing suggests. In addition, uncertainty surrounding the ceasefire persists, as unresolved nuclear negotiations and warnings from President Trump about potential renewed military action continue to pose risks. As US markets head into the Juneteenth holiday closure, crude oil finds itself caught between two opposing forces: the bearish impact of reopening supply routes and the supportive influence of tight inventories and lingering geopolitical uncertainty. The key question is whether returning production will outweigh supply tightness, or whether a slower recovery process will help stabilize prices before any meaningful surplus emerges.
Current Oil Market Levels: WTI, Brent, and the 38% Retreat From April Peaks
Recent price action underscores the scale of the oil market’s reversal. On Thursday, West Texas Intermediate (WTI) slipped nearly 3% to approximately $74.52 per barrel, while Brent crude declined around 2.7% to $77.40. Both benchmarks reached their lowest levels since early March, extending losses as optimism surrounding the US-Iran peace agreement strengthened throughout the week. At the same time, the premium between Brent and WTI has narrowed from the elevated levels recorded during the peak of shipping disruptions.
The sharp decline illustrates the unwinding of a substantial geopolitical risk premium. During the height of the conflict, when the Strait of Hormuz was effectively closed and more than 11 million barrels per day of Middle Eastern production were offline, Brent surged into triple-digit territory, reaching its highest levels since the 2022 energy crisis. WTI also rallied dramatically, climbing from below $60 earlier in the year to nearly $100. April marked the peak of that fear-driven advance. Since then, expectations of a diplomatic resolution have steadily gained traction, triggering a roughly 38% correction as the market reassesses the likelihood of supply returning.
The speed of the selloff highlights how heavily oil prices had become dependent on geopolitical concerns rather than underlying supply-and-demand fundamentals. Once traders began pricing in the restoration of disrupted barrels, the risk premium rapidly evaporated. With crude now trading at three-month lows and even below levels seen before the conflict’s most severe phase, market participants are evaluating how much downside remains. The answer will largely depend on whether returning supply outweighs the ongoing effects of historically tight inventories. As a result, both WTI and Brent are attempting to establish a new equilibrium in a post-conflict environment, a process likely to remain volatile as developments surrounding Hormuz and regional production recovery continue to unfold.
The Agreement That Triggered the Selloff
The primary catalyst behind oil’s sharp decline has been the interim peace agreement signed by President Trump and Iran’s leadership, aimed at ending months of hostilities in the Middle East. According to US officials, the memorandum of understanding is already in effect and extends the current ceasefire while creating a framework for reopening the Strait of Hormuz and ending the US naval blockade. Under the arrangement, Iran will permit vessels to transit the waterway without fees for 60 days, while the United States begins lifting restrictions, with the broader objective of fully restoring maritime traffic and easing sanctions on Iranian oil exports.
The deal marks a major shift after months of severe disruption. Since the conflict erupted in late February, oil flows through one of the world’s most critical energy corridors had been heavily constrained. The prolonged closure of Hormuz forced Gulf producers to curtail output as storage capacity tightened and export routes became inaccessible. By facilitating the reopening of the strait, the agreement paves the way for suspended production and exports to gradually return to the market.
Investors have responded by aggressively removing the geopolitical premium embedded in crude prices. As confidence grows that oil shipments can once again move freely through Hormuz, fears of prolonged supply shortages are fading. Although the agreement remains temporary and key issues—particularly negotiations surrounding Iran’s nuclear program—have yet to be resolved, the reopening of the strait has convinced many traders that the most severe phase of the supply disruption has passed. That shift in sentiment has fueled the rapid decline that has pushed oil prices to their lowest levels in three months.
Hormuz Reopens: Shipping Flows Signal a Return of Supply
One of the clearest signs of easing tensions in the Middle East is the revival of maritime traffic through the Strait of Hormuz. Government officials reported that more than 12 million barrels of crude oil have already passed through the waterway, marking the highest volume since the conflict began. They also noted that Iran has refrained from targeting commercial vessels for several consecutive days, adhering to the terms of the ceasefire agreement. Saudi crude tankers, LNG carriers, and fuel shipments have resumed departures from Gulf ports, providing tangible evidence that the reopening is progressing beyond diplomatic commitments and into operational reality.
The importance of this development cannot be overstated. Prior to the conflict, the Strait of Hormuz handled roughly 14 million barrels of crude oil per day, along with approximately 6 million barrels of refined petroleum products, making it the world’s most critical energy transit corridor. The prolonged disruption of this route removed a significant portion of global supply from international markets, fueling the sharp rally in oil prices. As traffic gradually normalizes, confidence is growing that those lost volumes will return. Every successful transit through the strait strengthens market belief that the ceasefire is holding and that supply chains are being restored.
The faster-than-expected return of shipping activity has become the primary driver behind this week’s sharp selloff in crude prices. Markets had largely anticipated a prolonged disruption, and the rapid reopening has forced traders to reassess supply expectations. The movement of more than 12 million barrels through the corridor serves as concrete evidence that the bottleneck is easing, while the absence of attacks on commercial shipping reinforces confidence in the agreement. Although risks remain—particularly given the temporary nature of the ceasefire and the 60-day implementation window—the restoration of physical oil flows has emerged as the dominant bearish factor. As long as vessels continue to navigate Hormuz without disruption, pressure on crude prices is likely to persist.
Returning Production: Saudi Arabia, the UAE, and Iraq Prepare to Ramp Up
The reopening of Hormuz also creates a pathway for major Gulf producers to restore output that was suspended during the conflict. Saudi Arabia, the United Arab Emirates, and Iraq collectively curtailed millions of barrels per day as export routes became constrained and storage facilities approached capacity limits. At the peak of the crisis, more than 11 million barrels per day of regional production were effectively removed from the market. Even a partial recovery of these volumes would significantly increase global oil supply.
How quickly this production returns will play a crucial role in determining future price movements. During the closure, producers were forced to either store unsold crude or shut in wells as inventories accumulated. With shipping routes reopening, they can gradually reduce storage levels, resume exports, and reactivate idle production. Some facilities may be able to restart relatively quickly, while others could require additional time before reaching normal operating levels. Given the substantial revenue losses incurred during the disruption, Gulf producers have strong incentives to accelerate the recovery process wherever possible.
The prospect of returning supply remains the central reason behind the market’s bearish repricing. Traders are increasingly factoring in the return of millions of barrels per day that were previously unavailable, shifting expectations from severe scarcity toward the possibility of future oversupply. This helps explain why crude prices have fallen not only from their conflict-driven highs but also below some pre-crisis levels. However, the timing of the recovery remains critical. A rapid production restart would reinforce downward pressure on prices, while a slower-than-expected return could allow tight inventories to provide support. Ultimately, the interaction between recovering supply and depleted stockpiles will shape the next phase of the oil market, making production trends in Saudi Arabia, the UAE, and Iraq key indicators for investors to watch.
How Quickly Can Oil Production Recover?
One of the most important questions facing the oil market is how quickly physical supply can return compared with the pace at which prices have already adjusted. While crude prices have plunged on expectations of renewed supply, industry experts warn that restoring Iranian production and refining operations may take considerably longer than markets currently assume. Damage to infrastructure, the need to clear mines and secure shipping routes around the Strait of Hormuz, and the technical complexity involved in restarting oil fields and refineries all suggest that recovery will likely be gradual rather than immediate.
Most official projections reflect this more measured outlook. Energy analysts generally expect shipping activity through Hormuz to normalize in stages, with tanker traffic gradually increasing and production levels recovering over an extended period. Trade flows and regional output may not fully return to pre-conflict conditions until well into next year. In several Gulf countries, prolonged production shut-ins and operational challenges could further delay the restoration of output. Forecasts vary widely, with some financial institutions expecting a relatively quick recovery in maritime traffic, while others believe the process could take months before reaching full capacity.
The disconnect between market pricing and physical recovery remains a key source of uncertainty. If supply returns more slowly than traders currently anticipate, tight inventories could remain in place longer, providing support for oil prices and potentially triggering periodic rebounds. On the other hand, a faster-than-expected recovery would reinforce the current bearish outlook by accelerating the return of supply to the market. As a result, investors will closely monitor tanker movements, production data, and refinery activity for clues about the pace of normalization. The possibility of a slow recovery remains one of the strongest arguments against an extended decline in crude prices.
Inventory Constraints: Cushing, OECD Stocks, and the Global Drawdown
Despite the bearish implications of reopening supply routes, the oil market continues to face an important counterbalance: exceptionally tight inventories. Months of supply disruptions forced countries and companies to rely heavily on stored crude, resulting in significant stockpile reductions across major consuming regions. At Cushing, Oklahoma—the delivery hub for WTI futures—inventory levels have fallen to roughly 20 million barrels, highlighting the strain placed on available supplies. Recent US data also showed a decline of more than 8 million barrels in crude inventories within a single week, reinforcing evidence of ongoing stock depletion.
The global inventory situation appears even more restrictive. Analysts project that OECD inventories could decline to approximately 50 days of forward demand coverage by year-end, potentially marking the lowest level in more than twenty years. During the second quarter, limited oil flows through Hormuz forced the market to draw heavily from existing stockpiles to satisfy consumption needs. As a result, inventories were depleted at a rapid pace and are unlikely to return to pre-conflict levels anytime soon, even with shipping routes gradually reopening.
These depleted inventories provide a meaningful source of support for oil prices. Before the market can experience a true oversupply, much of the returning production will likely be absorbed by the need to rebuild stockpiles. Thin inventory buffers also leave the market vulnerable to renewed price spikes if any disruptions occur during the recovery process. Consequently, the oil market remains caught between two competing forces: the bearish impact of returning supply and the bullish influence of historically low inventories. While the reopening of Hormuz has triggered a sharp selloff, the need to replenish depleted stocks suggests that the path lower may be uneven, with periods of support emerging as market participants assess the scale of future restocking demand.
The IEA’s Surplus Warning Meets OPEC’s Skepticism
Adding to the bearish outlook for crude oil is the International Energy Agency’s warning that global markets could face a significant supply surplus in the years ahead. According to the agency’s latest projections, oil production is expected to expand substantially while demand growth remains comparatively modest. As shipping activity through the Strait of Hormuz normalizes and Gulf producers restore previously curtailed output, the resulting increase in supply could outpace consumption growth, creating downward pressure on prices.
The implications of this supply-demand imbalance are substantial. A market that only recently grappled with severe shortages could quickly transition into one characterized by abundant supply. The conflict itself has also weakened demand in some regions, as elevated energy costs and economic disruptions weighed on consumption, particularly across Asia, where many economies depend heavily on Middle Eastern oil imports. If demand recovery remains sluggish while production rebounds aggressively, conditions for a sustained oversupply could emerge.
However, not all market participants agree with the IEA’s assessment. OPEC officials and several industry observers have challenged the surplus narrative, arguing that the pace of supply recovery may be slower than anticipated and that depleted inventories will continue to absorb a portion of the returning barrels. The divergence between those expecting a glut and those emphasizing tight stock levels highlights the uncertainty currently facing the market. While the IEA’s warning has contributed to recent price weakness, its realization ultimately depends on supply recovering more rapidly than demand—a scenario that remains far from guaranteed. The debate between surplus risks and inventory-driven support is likely to remain a key driver of oil prices during the second half of the year.
Banks Cut Oil Price Forecasts
The rapid improvement in geopolitical conditions has triggered a broad reassessment among major financial institutions, with most revisions pointing toward lower oil prices. Investment banks that had previously incorporated a prolonged closure of Hormuz into their forecasts have quickly reduced their expectations following the breakthrough in US-Iran negotiations. The return of regional supply and the reopening of a critical shipping corridor have significantly reduced the scarcity premium that previously supported elevated forecasts.
Updated projections now point to Brent crude averaging around $80 per barrel during the fourth quarter, compared with earlier estimates that frequently exceeded $90 per barrel. Several institutions have also lowered their outlooks for the following year. These revised forecasts reflect expectations that tanker traffic through Hormuz will steadily recover over the coming months, easing supply constraints and reducing market tightness. Importantly, the adjustments extend beyond spot prices and have reshaped expectations across the entire forward curve.
The scale of these revisions illustrates how quickly market sentiment has shifted. Only weeks ago, many analysts were raising their forecasts based on assumptions that the disruption in Hormuz would persist through the summer, with some expecting Brent to trade above $100 per barrel for an extended period. The unexpectedly rapid progress toward a ceasefire has rendered those assumptions obsolete. The transition from increasingly bullish forecasts to widespread downgrades underscores the extent to which geopolitical developments have dictated market direction. While the revised outlook favors lower prices in the near term, institutions continue to acknowledge significant risks tied to the durability of the agreement and the pace at which supply ultimately returns.
The Trump Factor: Why Geopolitical Risk Has Not Disappeared
Despite the recent de-escalation, one of the biggest uncertainties facing the oil market remains the fragile nature of the agreement itself. President Trump has repeatedly emphasized that the memorandum should be viewed as an interim arrangement rather than a permanent settlement, warning that military action could resume if Iran fails to meet its commitments. While the agreement extends the ceasefire for 60 days and establishes a framework for broader negotiations, unresolved issues—including discussions surrounding Iran’s nuclear program—continue to pose risks to long-term stability.
Recent market reactions demonstrate how sensitive crude prices remain to geopolitical developments. Earlier in the week, oil prices briefly surged more than 1.5% after comments suggesting that military operations could restart if negotiations deteriorate. This response highlighted that a portion of the geopolitical risk premium remains embedded in the market and can quickly re-emerge whenever tensions escalate. The temporary nature of the agreement ensures that the coming weeks will be heavily influenced by headlines and diplomatic developments.
For oil traders, this remains the primary upside risk to an otherwise bearish narrative. The reopening of Hormuz and the prospect of returning supply support lower prices, but any breakdown in negotiations could rapidly reverse sentiment and trigger a renewed rally. Market participants must therefore balance improving fundamentals against the possibility of renewed conflict—a risk that remains difficult to quantify. As long as the ceasefire remains conditional and negotiations continue, crude prices are likely to remain highly sensitive to developments in US-Iran relations, leaving room for significant volatility despite the broader downward trend.
Silver remains under pressure as investors increasingly price in a more hawkish Federal Reserve outlook, reducing demand for precious metals. Fed Chair Kevin Warsh reinforced this view by emphasizing that maintaining price stability remains the central bank’s primary objective, signaling that policymakers may be prepared to keep interest rates elevated for longer if inflation remains persistent.
Meanwhile, geopolitical tensions eased after the United States and Iran signed an initial agreement that launches a 60-day negotiation period aimed at reaching a comprehensive peace deal. The diplomatic progress has improved market sentiment and reduced some safe-haven demand for silver, adding to the downside pressure on the metal.
Silver (XAG/USD) remained under selling pressure for a third consecutive session on Friday, slipping to around $64.40 during Asian trading hours. The precious metal continued to weaken as investors adjusted to a more hawkish Federal Reserve outlook, which has increased expectations that US interest rates could remain elevated for longer. Higher borrowing costs typically weigh on non-yielding assets such as silver by raising the opportunity cost of holding them.
During his first press conference as Fed Chair, Kevin Warsh reaffirmed that maintaining price stability remains the central bank’s top priority. While the Federal Open Market Committee (FOMC) unanimously decided to keep interest rates unchanged at 3.5%–3.75%, policymakers delivered a hawkish message, with nearly half of committee members indicating that additional rate increases may still be necessary before the end of the year.
Although the recent US-Iran peace initiative helped ease inflation concerns by pushing oil prices lower, its positive impact on silver has been overshadowed by expectations of tighter monetary policy. According to reports, Washington and Tehran signed a preliminary agreement that initiates a 60-day negotiation period aimed at securing a comprehensive peace settlement.
Further supporting market optimism, the US military announced the end of its blockade of Iranian ports near the Strait of Hormuz, allowing oil shipments to resume through one of the world’s most important energy corridors. While these developments have improved risk sentiment and supported higher-risk assets, investors remain cautious, recognizing that global shipping and energy markets may require several months to fully recover from the disruptions caused by the conflict.
WTI crude oil trades in a narrow range during Friday’s Asian session as opposing market forces keep prices largely contained. On one hand, uncertainty surrounding the US-Iran peace process intensified after US Vice President JD Vance canceled his planned trip to Switzerland for talks with Iranian officials, lending support to oil prices through renewed geopolitical risk concerns. On the other hand, the resumption of shipping activity through the Strait of Hormuz has eased fears of supply disruptions, limiting further gains in crude and keeping the market in consolidation mode.
West Texas Intermediate (WTI) crude oil remains confined to a narrow trading range during Friday’s Asian session, struggling to build on its rebound from the $72.80 area, the lowest level since early March. Although prices are modestly higher on the day, trading above $75.50, bullish momentum remains limited as traders weigh conflicting fundamental and technical signals.
Geopolitical developments continue to offer some support to the oil market. Uncertainty surrounding US-Iran peace negotiations increased after US Vice President JD Vance canceled his planned visit to Switzerland for talks with Iranian officials. At the same time, renewed Israeli air strikes in Lebanon have raised concerns that the fragile US-Iran agreement could unravel, providing a risk premium for crude prices. However, gains remain capped as shipping activity through the Strait of Hormuz resumes, allowing previously delayed oil cargoes to reach global markets and easing supply concerns.
From a technical standpoint, the recent break below the key $83.00 level—previously the lower boundary of a three-month trading range—strengthened the bearish outlook for WTI. Momentum indicators continue to favor sellers, with the RSI near 32, indicating that the market is approaching oversold conditions but has not yet reached an exhaustion point. Meanwhile, the MACD remains in negative territory, suggesting that downward momentum is still intact.
Despite the bearish bias, crude oil continues to hold above its crucial 200-day Simple Moving Average (SMA) near $72.83. This support level remains a key line in the sand for traders, and a decisive break below it would likely open the door to deeper losses. Until then, buyers may continue to defend price dips, although a stronger recovery would likely require clear improvements in momentum indicators such as the RSI and MACD.
Gold extended its decline for a third consecutive session on Friday as renewed US Dollar strength weighed on the precious metal. The Greenback continued to draw support from the Federal Reserve’s hawkish stance, reducing demand for non-yielding assets such as gold. Meanwhile, reports that the US Vice President canceled a planned trip to Switzerland for talks with Iran further boosted the Dollar, adding to the downside pressure on bullion.
Gold (XAU/USD) remained under pressure during Friday’s Asian session, falling to a fresh weekly low near $4,122 as the US Dollar stayed close to its strongest level since May 2025. The precious metal continued its three-day decline as investors reacted to the Federal Reserve’s hawkish outlook, which reinforced expectations that interest rates could remain elevated for longer. Following its latest policy meeting, the Fed left rates unchanged at 3.5%-3.75%, but policymakers signaled the possibility of further tightening if inflation proves persistent. Fed Chair Kevin Warsh also emphasized the importance of maintaining price stability, reducing expectations for near-term rate cuts.
Market participants are now assigning a roughly 70% probability of a Fed rate hike in September, according to CME FedWatch data. Higher Treasury yields and a stronger Dollar have consequently weighed on non-yielding assets such as gold. At the same time, fading optimism surrounding a preliminary US-Iran peace agreement has further boosted demand for the Greenback. Uncertainty increased after US Vice President JD Vance canceled a planned meeting with Iranian officials in Switzerland, while renewed Israeli air strikes in Lebanon raised concerns about a potential escalation of regional tensions.
Looking ahead, any deterioration in Middle East stability or setbacks in US-Iran negotiations could continue supporting the safe-haven US Dollar and keep gold prices under pressure. Although trading activity may remain subdued due to the Juneteenth holiday in the United States, bullion appears on track for a third consecutive weekly decline as investors closely monitor geopolitical developments and the outlook for US monetary policy.
Gold Daily Chart
Gold remains under bearish pressure after multiple unsuccessful attempts to break above its 100-day Exponential Moving Average (EMA), reinforcing the negative outlook for XAU/USD. Technical indicators continue to favor sellers, with the Relative Strength Index (RSI) hovering around 36, signaling weak buying interest without yet reaching oversold territory. At the same time, the Moving Average Convergence Divergence (MACD) remains below its signal line in negative territory, indicating that downward momentum is still intact.
On the upside, the 200-day EMA near $4,358 serves as a key resistance level. A decisive daily close above this barrier would be needed to reduce bearish sentiment and support the possibility of a broader recovery. Until such a breakout occurs, gold is likely to remain vulnerable to additional losses, with momentum-driven selling expected to keep prices under pressure in the near term.
WTI crude prices could come under pressure after the United States and Iran reached a preliminary agreement to end their conflict, reducing concerns over potential supply disruptions.
At the same time, signals from the Federal Reserve pointing to possible interest rate hikes in 2026 have reinforced expectations of tighter monetary conditions, weighing on energy prices.
Adding to the bearish outlook, the International Energy Agency (IEA) projects global oil supply to increase by 8 million barrels per day, significantly exceeding the expected 2 million barrels per day recovery in demand by 2027.
West Texas Intermediate (WTI) crude oil prices are showing a modest recovery during Thursday’s Asian session, trading near $75.10 per barrel after posting losses for five consecutive days. The rebound comes despite easing geopolitical tensions in the Middle East and reduced concerns over potential supply disruptions.
Oil prices remain vulnerable after reports emerged that the United States and Iran have signed a preliminary agreement aimed at ending hostilities. According to the White House, US President Donald Trump and Iranian President Masoud Pezeshkian approved a memorandum of understanding designed to pave the way for a broader peace settlement. The framework follows earlier electronic endorsements by Vice President JD Vance and Iranian Parliamentary Speaker Mohammad Bagher Ghalibaf.
Initial details suggest the agreement establishes a 60-day negotiation period to finalize a comprehensive peace accord. Key provisions include the rapid reopening of the Strait of Hormuz and the immediate removal of significant sanctions on Iranian oil exports. While the deal secures a ceasefire across active conflict zones, discussions surrounding Iran’s nuclear program and long-term economic arrangements are expected to continue in the months ahead.
Meanwhile, the Federal Open Market Committee (FOMC) unanimously decided to keep the federal funds rate unchanged at 3.50%–3.75%. In his first policy meeting as Federal Reserve Chair, Kevin Warsh reaffirmed the central bank’s commitment to bringing inflation under control and restoring price stability.
However, policymakers also indicated growing support for potential rate increases later this year, reinforcing expectations of tighter monetary conditions. The prospect of higher borrowing costs weighed on energy markets, limiting oil’s upside potential.
Adding to the bearish narrative, the International Energy Agency (IEA) warned of a substantial global oil surplus by 2027 in its latest monthly report. As the market adjusts to the normalization of flows through the Strait of Hormuz, the agency expects production growth to significantly outpace demand. Supported by a strong recovery in Gulf exports and expanding non-OPEC+ output, global oil supply is projected to rise by 8 million barrels per day, while demand is expected to increase by only 2 million barrels per day, creating a sizeable supply-demand imbalance that could pressure prices over the longer term.
Gold attracts fresh buying interest after tumbling to a weekly low in the wake of the Fed’s policy announcement.
Growing optimism surrounding a potential US–Iran peace agreement triggers profit-taking in the US Dollar, lending support to the precious metal.
However, the Fed’s hawkish stance boosts expectations of a December rate hike, helping the Dollar limit its decline and keeping gold’s upside in check.
Gold prices rebounded above $4,300 during Thursday’s Asian session as investors took profits on the US Dollar following optimism surrounding a preliminary US–Iran peace agreement.
The agreement, signed by US President Trump and Iranian President Pezeshkian, aims to end hostilities and reopen the Strait of Hormuz, while Trump’s indication that nuclear negotiations remain flexible further improved market sentiment. The resulting decline in safe-haven demand for the Dollar helped support gold prices.
However, gold’s upside remains limited after the Federal Reserve’s hawkish policy decision. The Fed left interest rates unchanged at 3.5%–3.75%, but removed language suggesting further easing and raised its year-end rate forecast to 3.8% from 3.4%. Markets now see an approximately 85% probability of a 25-basis-point rate hike in December, pushing US Treasury yields higher and providing underlying support for the Dollar.
As a result, while gold has recovered from recent lows near $4,020, stronger follow-through buying may be needed to confirm a sustained bullish recovery. Investors will closely monitor upcoming US economic data, including the Philadelphia Fed Manufacturing Index and Weekly Initial Jobless Claims, as well as comments from Fed officials, for further direction in both the Dollar and gold markets.
Gold Daily Chart
Gold’s recovery remains tentative after failing to establish a foothold above the $4,350–$4,360 resistance zone, where the 38.2% Fibonacci retracement of the April–June decline converges with the 200-day EMA. This key technical barrier continues to cap upside momentum and suggests that bullish conviction remains limited.
Although the subsequent pullback found support near the 23.6% Fibonacci retracement level around $4,237, momentum indicators paint a mixed picture. The RSI remains near 44, indicating weak momentum and a lack of strong buying pressure, while the MACD histogram has turned slightly positive, suggesting that bearish momentum is fading rather than signaling a decisive bullish reversal.
As a result, a sustained break and close above $4,350–$4,360 would be needed to confirm a stronger recovery and open the door for a move toward the 50% retracement level at $4,461. Beyond that, the next upside targets are located at $4,562, $4,705, and ultimately the recent high near $4,887.
On the downside, $4,237 serves as the first line of support. A break below this level could expose the previous swing low around $4,036, a critical area where buyers are expected to defend the broader long-term bullish trend. Overall, the near-term bias remains cautiously constructive, but confirmation above the $4,350–$4,360 resistance zone is needed before a stronger rally can be anticipated.
After more than three months of conflict that triggered a major shock across global energy markets, the United States and Iran have agreed to a peace settlement. Financial markets reacted exactly as expected: oil prices tumbled, government bond yields declined, and risk-sensitive assets rallied sharply as investors welcomed the easing of geopolitical tensions.
The key issue for investors now is not the announcement itself, but what follows: whether the agreement can endure and how portfolios should be positioned in a scenario where one of the most significant geopolitical risks of 2026 is being eliminated rather than materializing.
1. The Agreement: Current Situation and Next Steps
What has happened? Following approximately 107 days of conflict—sparked by U.S. and Israeli strikes on Iran in late February and intensified by Iran’s closure of the Strait of Hormuz in early March—the United States and Iran announced over the weekend that they had reached a peace agreement. The talks were mediated by Pakistan and Qatar, with support from Saudi Arabia and Turkey. According to Pakistan’s prime minister, both sides have committed to an immediate and permanent cessation of military operations across all fronts, including Lebanon.
President Trump described the agreement as “complete” and authorized the reopening of the Strait of Hormuz without restrictions, along with the lifting of the U.S. naval blockade. The deal is currently framed as a memorandum of understanding and is scheduled to be formally signed in Switzerland on June 19.
However, implementation remains conditional. Tehran has stated that it will not begin carrying out the agreement until the signing takes place. Moreover, negotiations on a comprehensive final settlement will be postponed to a 60-day second phase, which will begin only after the United States has clearly fulfilled its initial commitments—including ending military actions, removing the blockade, reopening Hormuz, and releasing frozen Iranian assets.
Importantly, the most sensitive and complex issue—the future of Iran’s nuclear program—has been deferred to these follow-up negotiations, leaving a major source of uncertainty still unresolved.
Why Both Sides Are Motivated to Make the Deal Succeed
The incentives for both Washington and Tehran to preserve the agreement are unusually strong and closely aligned.
For the U.S. administration, the political stakes are significant. Approval ratings remain near historic lows, while prediction markets increasingly suggest the possibility of losing control of the House and facing greater challenges in the Senate during the upcoming midterm elections. Meanwhile, the recent energy shock has pushed headline inflation to 4.2%, creating additional pressure on policymakers. Lower oil prices, reduced inflation concerns, and the ability to claim a diplomatic breakthrough where previous efforts failed would provide a valuable political boost.
Iran also has compelling reasons to support the agreement. The U.S. naval blockade has severely constrained Iranian oil exports and placed substantial strain on the broader economy. Securing sanctions relief, regaining access to frozen assets, and ending the blockade are critical economic priorities. After enduring a costly and damaging conflict, Tehran likewise has a strong incentive to reduce tensions and stabilize the situation.
The involvement of highly committed mediators—including Pakistan, Qatar, Saudi Arabia, and Turkey—further strengthens the case for de-escalation. With multiple regional actors invested in the process, the path toward cooperation currently appears more attractive than renewed confrontation.
What Could Still Cause the Deal to Fail
Despite the optimism, investors should not consider the agreement fully secured until it is formally signed and, more importantly, implemented. Several risks remain.
Israel’s role. Israel is not a party to the agreement, making it the most immediate source of uncertainty. Reports of Israeli operations in Lebanon are already testing a deal that explicitly calls for ending hostilities on all fronts, including Lebanon. Continued military actions by a non-signatory could undermine the broader ceasefire framework.
Sequencing and trust issues. The agreement requires the United States to fulfill key commitments before Iran proceeds with implementation. While this structure provides safeguards for Tehran, it also creates opportunities for delays, disputes over compliance, and potential breakdowns during the planned 60-day negotiation period.
Domestic opposition. Political hardliners in Iran and hawkish factions in Washington may view compromise as unacceptable and could attempt to obstruct the process through political pressure or other means.
The unresolved nuclear question. The most difficult issues—such as uranium enrichment levels, verification mechanisms, and nuclear stockpile limits—have merely been postponed. These topics remain central to any lasting settlement and could become major obstacles in future negotiations.
Implementation risk. Iran has stated that it will not begin implementing the agreement before the scheduled signing on Friday, and many details remain undisclosed. As a result, the period between the announcement and the formal signing remains vulnerable to unexpected developments and market volatility.
What Happens Next?
Several key milestones lie ahead:
Preparatory discussions in Doha.
Electronic approval of the agreement by both parties.
The formal signing ceremony in Switzerland on June 19.
U.S. implementation of its initial commitments.
The launch of a 60-day technical negotiation process aimed at reaching a permanent agreement.
Each of these stages will be closely monitored by investors, and markets are likely to react to progress—or setbacks—at every step along the way.
2. Market Conditions: Slowing, Not Cracking
The peace agreement arrives at a time when financial markets were already showing considerable resilience. Even during the conflict, our central expectation was that the global economy would avoid both stagflation and recession. In our view, the critical factor for equity markets was not the existence of the war itself, but rather how long it would persist.
As a result, the recent de-escalation removes one of the major sources of uncertainty that had been weighing on investor sentiment. Instead of facing a prolonged geopolitical crisis with the potential to disrupt growth and inflation dynamics, markets now have greater clarity and a more supportive environment for risk assets.
In essence, the economy was already demonstrating signs of moderation rather than deterioration. A lasting peace agreement reinforces that outlook by reducing energy-related risks, easing inflationary pressures, and lowering the probability of a negative macroeconomic shock. For investors, the key takeaway is that the market backdrop remains one of cooling growth and inflation—not economic breakdown—and the resolution of the conflict strengthens that narrative.
The Bull Market Remains Healthy and Is Expanding
The long-term upward trend in U.S. equities continues to hold, with market leadership broadening in a constructive and sustainable manner. Rather than being driven by a small group of mega-cap stocks, gains are increasingly being shared across a wider range of companies and sectors.
Small- and mid-cap stocks have emerged as the strongest performers this year. The S&P SmallCap 600 has gained 18.7% year-to-date, closely followed by the Russell 2000 at 18.4% and the S&P MidCap 400 at 14.7%. These returns comfortably exceed those of the S&P 500 (8.6%) and the Russell 1000 (8.5%), while the Nasdaq 100 has also maintained strong momentum with a 17.0% gain.
Market breadth further supports the positive outlook. Approximately two-thirds of listed stocks are currently trading above their 200-day moving averages, indicating that participation in the rally is widespread rather than concentrated in a handful of names.
Taken together, these trends suggest a bull market that is evolving and becoming more inclusive, not one that is losing momentum. Broadening leadership and strong market breadth are typically characteristics of a mature but still healthy expansion phase, rather than signs of an approaching market peak.
Technology Is Consolidating, Not Reversing
The recent weakness in the technology sector should be viewed as a pause within an ongoing uptrend rather than the beginning of a broader downturn. Semiconductor stocks, which had experienced an exceptionally strong and almost parabolic advance, underwent a correction of roughly 12% before recovering part of those losses.
Importantly, this pullback appears to have been driven largely by profit-taking and position rebalancing rather than any meaningful deterioration in underlying business fundamentals. The key drivers supporting the sector remain firmly in place.
Spending by major cloud providers and hyperscalers continues to accelerate as they invest heavily in artificial intelligence infrastructure. At the same time, AI adoption across industries is still expanding, reinforcing the long-term growth outlook for the technology ecosystem.
Another notable development is the outperformance of the equal-weighted S&P 500 relative to its market-cap-weighted counterpart. This suggests that investor interest is broadening beyond a handful of large technology companies and spreading to a wider range of stocks across the market.
In other words, capital is rotating into the “average” stock rather than leaving equities altogether. Such a shift is generally considered healthy, as it reflects improving market breadth and a more balanced bull market rather than a loss of confidence in technology or growth assets.
IPO Enthusiasm Is the Ultimate Gauge of Investor Risk Appetite
The current surge in IPO activity is providing one of the clearest indications of investor confidence and willingness to take risk. The recent debut of SpaceX serves as a striking example. The stock rose approximately 18–19% on its first trading day, while the offering raised around $75 billion—making it the largest IPO in history. Despite having less than 5% of its shares available for public trading and carrying a valuation of roughly $2.1 trillion, equivalent to more than 100 times trailing revenue, investor demand was exceptionally strong, attracting record levels of retail participation on its opening day.
This successful listing could mark the beginning of a new wave of mega-IPOs. Market participants are already speculating that companies such as OpenAI and Anthropic may eventually follow with public offerings of their own.
The broader implications are significant. For the first time in more than two decades, net equity supply in the U.S. market could become positive. Large technology companies are increasingly raising capital to finance massive AI infrastructure investments, while a growing pipeline of high-profile IPOs introduces substantial new share supply into the market.
Historically, however, such issuance waves have not necessarily been negative for equities. Research from Deutsche Bank suggests that periods of heavy stock issuance tend to coincide with strong market environments rather than precede major downturns. On average, markets generated returns of roughly 8% over the following three months and about 20% over the subsequent year after previous issuance surges, with the 2008 financial crisis standing out as a notable exception.
At present, investor demand appears strong enough to absorb the increase in supply. As long as capital continues flowing into equities and risk appetite remains elevated, the growing number of new listings is more likely to be interpreted as a sign of market strength than a warning signal.
The Federal Reserve Can Afford to Wait
The Federal Reserve currently has little reason to rush into further policy tightening. While headline inflation has climbed to 4.2%, its highest level since early 2023, the increase is largely attributable to higher energy prices rather than broad-based inflationary pressures across the economy.
Underlying inflation trends remain considerably more moderate. Core CPI, which excludes volatile food and energy components, rose just 2.9% and came in slightly below expectations. Goods prices recorded their first annual decline in a year, while services inflation has shown little evidence of a renewed acceleration. Together, these indicators suggest that inflation pressures outside the energy sector remain relatively contained.
As a result, the most likely policy path is an extended period of patience from the Fed. Policymakers may remove any remaining signals that rate cuts are imminent, but they are unlikely to respond aggressively to inflation that is primarily driven by temporary energy-market developments.
Looking ahead, oil prices remain the critical variable. If the ceasefire between the United States and Iran holds and crude prices continue to decline, headline inflation should gradually ease, reducing pressure on the Fed and potentially delaying any discussion of additional rate hikes. In such a scenario, the possibility of future rate cuts could eventually return to the conversation.
Conversely, if tensions re-emerge and oil prices surge again—pushing headline inflation above roughly 4.5%—the prospect of renewed monetary tightening would become much more realistic.
Even before the peace agreement, market expectations for further rate increases had already begun to fade. Economic growth remained resilient, core inflation was moderating, and WTI crude oil had fallen below $85 per barrel, reducing concerns about persistent inflation. A durable peace deal strengthens these trends and shifts the outlook more decisively toward a favorable combination of stable growth, easing inflation, and a patient Federal Reserve.
Hormuz Reopened? Why Declaring Victory on Oil May Be Premature
Before investors rush to conclude that the oil crisis is over, there are two important realities that deserve closer attention.
1. A Reopening Is Not the Same as a Resolution
The first issue is straightforward: there is still no finalized agreement.
While negotiations between the United States and Iran appear to be progressing, a formal deal has not yet been signed or implemented. Markets are increasingly pricing in a successful outcome, but that outcome remains an expectation rather than an established fact.
As a result, confidence in the reopening of the Strait of Hormuz is largely based on optimism about what will happen next, not on a completed and tested agreement. Every tanker passing through the strait is effectively relying on the assumption that the diplomatic process remains on track.
In other words, Hormuz is reopening because market participants believe the conflict is ending—not because the conflict has definitively ended. That distinction matters, particularly in a region where political developments can change rapidly.
2. Reopening Shipping Routes Does Not Instantly Restore Supply
Even if a peace agreement is signed, the return to normal market conditions will take time.
The release of roughly 300 vessels that have been delayed by the blockade may seem substantial, but that number represents less than two days of normal pre-war traffic through the strait. In addition, hundreds of other ships remain queued for loading and unloading operations.
Before the conflict, approximately 150 vessels moved through Hormuz each day. During the crisis, traffic fell dramatically, in some cases approaching a standstill. Restoring those logistics networks, clearing backlogs, repositioning tankers, and normalizing shipping schedules cannot happen overnight.
A reopening is a single event. A full recovery of global energy flows is a gradual process that could take months.
A Shrinking Margin for Error
The broader energy backdrop also remains less comfortable than recent market reactions suggest.
For several months, global energy markets have operated under significant strain. The situation remained manageable partly because the disruption occurred when supply conditions were relatively favorable and inventories were still increasing. However, global oil reserves have since fallen toward some of their lowest levels in decades.
That means the buffer that previously protected markets from severe shortages has become considerably thinner. Investors are being asked to assume that the worst is over at precisely the moment when reserve cushions are no longer as reassuring as they once were.
The Strategic Reality Has Changed
Perhaps the most important lesson extends beyond this particular crisis.
Iran has demonstrated that it possesses the ability to create significant disruptions in the global economy through its influence over a single strategic chokepoint: the Strait of Hormuz.
Even if the current blockade ends and diplomatic relations improve, that underlying reality remains unchanged. Markets, governments, and energy consumers now have direct evidence of how vulnerable global supply chains can be to disruptions in the region.
The blockade itself may prove temporary. The strategic leverage it revealed is not.
For that reason, the recent collapse in oil prices may be justified by improving short-term prospects, but it does not necessarily mean that geopolitical risk has disappeared from the energy market. Instead, investors may be moving from a period of acute crisis to one of lingering structural uncertainty.
3. Portfolio Positioning and the Immediate Beneficiaries of a Peace Agreement
Our Long-Term Framework Remains Unchanged
Our strategic asset allocation continues to be guided by a durable, all-weather investment framework. At its core is a significant allocation to U.S. equities, reflecting our belief in the continued strength of the U.S. economy and corporate sector. We also maintain meaningful exposure to technology, a substantial allocation to alternatives—particularly hedge funds—a diversified fixed-income portfolio, and partially hedged currency exposure.
The recent geopolitical developments do not alter this long-term investment compass.
Current Tactical Positioning
Since May 21, 2026, our tactical stance has been moderately overweight equities. Market appreciation has naturally increased that overweight over time, while regional allocations remain broadly neutral. U.S. equity exposure has risen slightly through market drift rather than active allocation changes.
At the same time, we remain underweight fixed income overall, particularly government bonds. Within alternatives, we continue to hold overweight positions in commodities and gold while maintaining a neutral stance toward hedge funds. In foreign exchange markets, our positioning remains broadly neutral toward the U.S. dollar.
The central theme connecting these positions is our belief that markets are experiencing a transition rather than a deterioration. Leadership is gradually broadening beyond a narrow group of mega-cap technology stocks toward cyclical sectors, value-oriented companies, and smaller-cap equities. Volatility is normalizing, momentum-driven investing is moderating, and market performance is increasingly supported by resilient economic growth and expectations for approximately 21% second-quarter earnings growth.
Accordingly, we remain constructive on equities and continue to view market pullbacks as opportunities rather than threats.
At the same time, we remain cautious about excessive enthusiasm surrounding highly publicized IPOs. Historical evidence suggests that many of the largest IPOs struggle after their initial excitement fades. Among the 30 largest IPOs in the Russell 3000 over the past two decades, the median one-year return was approximately negative 31%, while the median maximum drawdown reached roughly 53%.
Positioning for the Next Phase of the Market Cycle
Where a Peace Deal Has the Greatest Impact
A successful agreement between the United States and Iran would remove a major geopolitical risk that could otherwise have complicated the Federal Reserve’s policy path. More importantly, it reinforces our existing investment thesis rather than forcing us to change it.
The most immediate beneficiaries would likely be assets tied to lower energy prices and a declining geopolitical risk premium.
International Developed-Market Value Stocks
In our view, developed-market value equities outside the United States represent the clearest beneficiary.
A fully functioning Strait of Hormuz and lower oil prices would reduce energy costs for economies such as Japan and countries across Europe, where value and cyclical sectors make up a larger share of the market. These regions would likely experience some of the most direct economic benefits from cheaper energy.
Cyclicals, Mid-Caps, and Equal-Weight Strategies
The broadening market leadership already underway could accelerate in a lower-oil, risk-on environment.
Industries such as transportation, airlines, industrials, and consumer businesses with significant energy exposure would benefit directly from lower fuel costs. U.S. mid-cap stocks and equal-weight equity strategies could also outperform as investors continue moving beyond a narrow set of mega-cap winners.
Bonds and Rate-Sensitive Equities
Falling oil prices would help reduce headline inflation, reinforcing expectations that the Federal Reserve can remain patient.
This environment would generally support fixed-income assets and interest-rate-sensitive sectors such as real estate and utilities. We would expect intermediate-duration bonds to benefit more than long-duration bonds if economic growth remains healthy.
Currencies
In a risk-friendly environment characterized by lower oil prices and a softer U.S. dollar, cyclical and emerging-market currencies typically perform well.
Conversely, currencies tied closely to energy exports may face headwinds as oil prices decline.
The Trade-Off Within Our Current Portfolio
A successful peace agreement also creates a challenge for two of our existing overweight positions.
Both commodities and gold have benefited from elevated geopolitical uncertainty. Lower oil prices and a shrinking geopolitical risk premium would likely create short-term pressure on commodities, while a stronger risk appetite environment tends to reduce demand for gold as a safe-haven asset.
Nevertheless, we do not view these developments as a reason to abandon either position.
Our allocations to gold and commodities are designed as long-term portfolio stabilizers rather than short-term tactical trades. Gold, in particular, continues to provide diversification benefits in a world characterized by elevated government debt levels and interest rates that may remain higher for longer than investors expect.
Instead of abandoning these positions, we see the greater opportunity in gradually shifting incremental capital toward developed-market value stocks and cyclical equities, which stand to benefit most from a sustained de-escalation of geopolitical tensions.
Bottom Line
We remain positive on equities and view a successful peace agreement as confirmation of our existing outlook rather than a reason to aggressively chase markets higher.
Our strategic framework remains unchanged. Tactically, however, we would look to increase exposure to areas where market leadership is broadening—particularly international developed-market value stocks, cyclical sectors, and diversified equity exposure—especially during periods of market volatility.
Gold and commodities should continue to serve as portfolio ballast rather than primary return drivers, while participation in the growing wave of mega-IPOs should be based on fundamentals, valuation, and portfolio fit rather than headline excitement.
Ultimately, the greatest threat to this outlook is not the market itself but the possibility that the peace process fails during implementation. For that reason, each milestone in the agreement’s execution will remain a critical signal for both markets and portfolio positioning.
Silver gains momentum as optimism surrounding Friday’s interim US-Iran peace agreement in Switzerland is expected to improve global oil supply conditions.
Adding to market sentiment, US Vice President JD Vance said that Donald Trump could unveil the preliminary US-Iran peace deal earlier than anticipated.
Meanwhile, the Federal Reserve is broadly expected to keep its benchmark interest rate unchanged within the 3.50%–3.75% range.
Silver prices (XAG/USD) extended their rally for a fifth straight session, hovering near $70.40 per troy ounce during Wednesday’s Asian trading hours. The precious metal remains supported as investors look ahead to the signing of an interim US-Iran peace agreement scheduled for Friday in Switzerland.
The anticipated agreement is expected to restore Iranian oil exports immediately while ensuring the safe movement of international tankers through the strategically important Strait of Hormuz. The development has helped calm concerns over energy-driven inflation and the outlook for global interest rates.
Diplomatic progress has intensified in recent days. US Vice President JD Vance stated on Tuesday that Donald Trump could unveil a preliminary peace framework sooner than expected, after previously suggesting that an agreement framework had already been reached. At the same time, Iranian Foreign Minister Seyed Abbas Araghchi confirmed that a fresh round of negotiations aimed at securing a broader and permanent peace deal will begin in Switzerland.
Investor focus is now turning to Wednesday’s highly anticipated policy decision from the Federal Reserve. Markets broadly expect the central bank to adopt a cautious wait-and-see stance and leave interest rates unchanged within the 3.50%–3.75% range. Traders will also closely watch the post-meeting press conference for signals on how newly appointed Fed Chair Kevin Warsh plans to steer monetary policy going forward.
Gold steadies above $4,300 as investors await the Fed’s rate decision for fresh market direction.
Gold trades within a tight range as investors remain cautious ahead of the key FOMC rate announcement.
Market participants are awaiting clearer signals on the Fed’s future policy direction before making new bullish or bearish positions.
Meanwhile, optimism surrounding a US-Iran peace agreement continues to pressure the US Dollar, providing underlying support for the precious metal.
Gold (XAU/USD) struggles to build on its weekly rebound but continues to hold above the $4,300 level during Wednesday’s Asian session. Optimism surrounding a temporary US-Iran peace agreement keeps the US Dollar under pressure, offering some support to bullion prices. However, the precious metal remains capped below Monday’s weekly peak and the key 200-day Simple Moving Average (SMA) as investors stay cautious ahead of the outcome of the two-day FOMC policy meeting. The Fed’s decision is expected to influence US Dollar demand and provide fresh direction for non-yielding assets like Gold.
The United States and Iran have reportedly agreed on a framework peace deal aimed at ending the conflict that erupted earlier in 2026. The preliminary memorandum of understanding (MoU) includes a 60-day ceasefire, the reopening of the Strait of Hormuz, and plans for further negotiations regarding Iran’s nuclear program. However, uncertainty remains as details of the agreement are still limited and conflicting statements continue to emerge. US President Donald Trump stated that the deal would ensure Iran never acquires nuclear weapons, while Iranian state media claimed that no detailed nuclear negotiations had yet taken place.
Meanwhile, reports suggesting the creation of a $300 billion private investment fund for Iran were dismissed by Trump as “fake news,” adding to market uncertainty. This cautious sentiment is preventing aggressive bearish bets against the US Dollar ahead of the Federal Reserve’s policy announcement later today. The Fed is widely expected to keep interest rates unchanged, though policymakers may adopt a less dovish tone as inflation remains stubbornly elevated. Investors will therefore focus closely on updated economic projections and the Fed’s dot plot for clues on future policy moves.
Attention will also turn to Fed Chair Kevin Warsh’s post-meeting press conference for further guidance on the central bank’s outlook. Markets have recently scaled back fears of extreme inflation and aggressive Fed tightening that intensified during the US-Iran conflict. Even so, traders still see around a 60% probability of a 25-basis-point rate hike in December. As a result, a clearer dovish pivot from the Fed may be required before investors regain confidence in extending Gold’s recovery from last week’s year-to-date low.
XAU/USD daily chart
From a technical standpoint, Gold (XAU/USD) remains under pressure as prices continue to trade below both the 38.2% Fibonacci retracement level of the April-to-June decline and the descending 200-day SMA, preserving the broader bearish outlook. Meanwhile, the Relative Strength Index (RSI) near 44 and a mildly positive MACD signal suggest that downside momentum is fading, although bullish conviction remains limited.
As a result, any additional upside could initially face resistance around the $4,400 psychological level, followed by the key $4,445–$4,450 region, where the 50% Fibonacci retracement and the 200-day SMA converge. A sustained daily close above this zone would help weaken bearish pressure and potentially pave the way toward the 61.8% Fibonacci retracement near $4,560, with further resistance levels seen around $4,707 and $4,893.
On the downside, immediate support is located near the 23.6% Fibonacci retracement around $4,227. Below that, the recent swing low near $4,022 remains a crucial structural support level. A decisive break beneath this area would reinforce the prevailing bearish trend and increase the risk of deeper losses.
Gold supported by rising central bank buying and global de-dollarization trends, says Rabobank.
Rabobank’s RaboResearch Global Economics & Markets team highlighted growing central bank demand for Gold amid rising geopolitical uncertainty and the ongoing global de-dollarization trend. The report noted that central banks are increasingly repatriating Gold reserves instead of storing bullion overseas, while most survey respondents expect official Gold holdings to continue rising over the next five years.
The report also pointed to broader concerns surrounding global financial stability and security risks. Citing the Financial Times, Rabobank noted that capital continues flowing into “insurance assets” despite elevated geopolitical tensions, prompting fears that markets may be underpricing risk. Traditionally, investors have relied on central banks to stabilize markets during periods of stress, though Rabobank questioned whether policymakers can continue playing that role while also dealing with growing geopolitical and security challenges.
In addition, the report referenced a Wall Street Journal article about a $40 million Gold heist that could potentially expose sensitive CIA intelligence operations. Rabobank also highlighted Nikkei Asia survey findings showing that 84% of respondents expect central banks to increase Gold reserves further as countries continue reducing reliance on the US Dollar in global trade and reserve management.
Gold prices ticked higher during Tuesday’s Asian trading session. A memorandum of understanding aimed at ending the conflict was signed by Trump, JD Vance, and the speaker of Iran’s parliament. Meanwhile, swap markets reduced the probability of a Federal Reserve rate hike by December, providing additional support for the precious metal.
Gold prices extended their gains during Tuesday’s Asian session as investors reacted positively to a framework agreement between the United States and Iran aimed at ending hostilities, reducing concerns about energy-driven inflation. The rally was further supported after Bloomberg reported that President Donald Trump and Vice President JD Vance signed a memorandum of understanding with Iran, with Trump stating that the Strait of Hormuz is already partially reopened and is expected to be fully operational by Friday.
According to Phillip Streible, chief market strategist at Blue Line Futures, markets have begun to price out the geopolitical conflict, with the peace agreement weighing on Treasury yields, the US dollar, and oil prices—key drivers of inflation expectations. Nevertheless, uncertainty remains as Washington and Tehran continue to disagree on important details, including Iran’s plans to charge fees for passage through the Strait of Hormuz. Trump also warned that military action could resume if a final nuclear agreement is not reached.
Meanwhile, expectations for additional Federal Reserve tightening eased following the diplomatic breakthrough, benefiting non-yielding assets such as gold. CME FedWatch data showed traders lowered the probability of a December rate hike to 58%, down from nearly 70% a week earlier. Investors are now focused on Wednesday’s Fed policy decision, where the central bank is widely expected to leave interest rates unchanged at 3.50%–3.75% while assessing the economic impact of recent energy-market developments.
Gold Daily Chart
Gold remains under bearish pressure in the near term as prices continue to trade below the key 100-day Simple Moving Average (SMA). On the daily chart, XAU/USD is holding beneath the Bollinger Band midpoint, suggesting that the broader recovery remains constrained. Meanwhile, the Relative Strength Index (RSI) is hovering around 43, below the neutral 50 level, indicating that downside momentum still dominates despite recent stabilization efforts.
On the upside, the first resistance level is located at the June 9 high near $4,363. A move above that could target the Bollinger Band midpoint around $4,415, followed by stronger resistance at the upper Bollinger Band near $4,685 and the 100-day SMA around $4,762, which together form a significant supply zone.
On the downside, immediate support is seen at the lower Bollinger Band near $4,145. A sustained break below this level could reinforce bearish sentiment and open the door for a deeper decline toward previous swing lows.
“Space: the final frontier…” is the iconic opening narration of the long-running sci-fi series Star Trek, celebrating humanity’s drive to explore the unknown and venture beyond familiar boundaries.
On Friday, Elon Musk achieved a milestone that would have seemed equally futuristic: becoming the world’s first trillionaire. The IPO of SpaceX was a resounding success, raising $75 billion, with the stock surging 19% on its first day of trading. Despite being the largest IPO on record, it represented only a small fraction of the roughly $74 trillion market capitalization of the Wilshire 5000.
While congratulating Musk on this remarkable accomplishment, we would offer a few suggestions. First, the case for establishing a human presence on Mars remains debatable, given the immense costs and limited practical benefits currently on offer. Second, locating data centers beneath the ocean may prove more efficient than placing them in orbit, as installation, maintenance, and repairs would be significantly easier to manage. Orbital facilities would also face ongoing risks from space debris.
Finally, we would suggest that Tesla consider expanding its lineup with a hybrid vehicle, a move that could help strengthen demand and broaden its customer base.
Fueling the enthusiasm surrounding SpaceX’s blockbuster debut on Friday was growing optimism that the United States and Iran could soon reach a memorandum of understanding (MOU). Whether the agreement ultimately delivers meaningful progress remains uncertain, and skeptics may view it as a potential “memorandum of misunderstanding.” Even so, the prospect of easing geopolitical tensions helped push Brent crude prices lower, with the global benchmark settling at $87.33 per barrel on Friday. Iranian officials, however, indicated today that they would not be ready to sign the agreement on Sunday as previously anticipated.
Additional downward pressure on oil prices came from reports that the US military is escorting vessels carrying roughly 7 million barrels per day of crude oil and refined fuel products through the Strait of Hormuz. According to Chris Wright, the operation is intended to ensure the uninterrupted flow of energy supplies through one of the world’s most critical maritime chokepoints. This development has eased concerns about potential supply disruptions and contributed to the recent decline in crude prices.
The prospect of easing tensions in the Middle East also provided a modest boost to Wall Street on Friday, helping both the S&P 500 and Nasdaq edge higher. Importantly, each index found support at its respective 50-day moving average, reinforcing the resilience of the broader uptrend.
The market’s powerful advance continues to be driven by what might be called fabulous earnings momentum (FEMO). Analysts have become increasingly optimistic about corporate profitability, with consensus forecasts for long-term earnings growth (LTEG) climbing to an annualized 24.0% over the next five years during the week ending June 12.
That figure marks a new record high and stands at roughly double the historical average since 1985. Such expectations reflect extraordinary confidence in the earnings outlook, fueled by themes such as artificial intelligence, automation, and productivity gains.
Yet there is also reason for caution. Sustaining earnings growth at that pace for five consecutive years would be an exceptional achievement by historical standards. In that sense, the forecast may prove almost as ambitious as Elon Musk’s vision of establishing a human colony on Mars. Investors are currently pricing in a remarkably optimistic future, one that leaves little room for disappointment if corporate earnings fail to keep pace with expectations.
A more grounded measure of the market’s earnings outlook is the S&P 500 forward earnings per share (EPS), which climbed to another record high last week. The forward EPS estimate now stands at $366.92, representing a time-weighted blend of analysts’ current consensus forecasts for 2026 EPS of $340.39 and 2027 EPS of $397.87.
While these projections are less ambitious than the market’s lofty long-term earnings growth expectations, they still imply a notably strong profit outlook for corporate America. Indeed, the consensus forecasts remain well above our own estimates of $330 for 2026 and $375 for 2027, suggesting that Wall Street analysts continue to anticipate robust earnings expansion over the next two years.
The gap between consensus estimates and more conservative forecasts highlights the degree of optimism currently embedded in equity valuations. As long as earnings continue to surprise to the upside, investors may remain willing to support elevated stock prices. However, the higher expectations rise, the greater the risk of disappointment if corporate profit growth fails to match the market’s bullish assumptions.
In any case, fabulous earnings momentum (FEMO) is no longer confined to large-cap stocks. The trend is spreading across the broader market, with forward earnings estimates for the S&P 500, S&P MidCap 400, and S&P SmallCap 600 all surging to fresh record highs in recent weeks.
This broad-based improvement in earnings expectations is an encouraging sign for equity bulls, as it suggests that profit growth is expanding beyond a handful of mega-cap companies. Instead, analysts are becoming increasingly optimistic about the earnings prospects of mid-sized and smaller firms as well, indicating a healthier and more inclusive corporate profit cycle.
The widening participation in earnings growth helps reinforce the market’s resilience and provides a stronger fundamental foundation for the ongoing rally. However, it also means that elevated expectations are becoming embedded across a larger segment of the market. As a result, companies will need to continue delivering robust results to justify current valuations and sustain investor enthusiasm in the months ahead.
Despite our Fabulous Earnings Momentum (FEMO) thesis remaining intact, we have maintained since June 3 that the market was vulnerable to a “June Swoon”—a temporary pullback that could ultimately create an attractive buying opportunity. Arguably, that correction may have already occurred on June 5, when the S&P 500 dropped 2.6% following a much stronger-than-expected May employment report.
The surprisingly robust labor data raised the possibility that the Federal Open Market Committee could adopt a more hawkish tone at its upcoming meeting on Wednesday, a scenario we have viewed as a contrarian risk since early May. Strong economic data tends to reduce the urgency for monetary easing and can lead investors to reassess interest-rate expectations.
The pullback has been particularly noticeable among the Magnificent Seven, which have underperformed the rest of the market so far this month. In contrast, the remaining members of the S&P 500—the so-called “Impressive 493”—have held up relatively well.
One explanation may be portfolio rebalancing. Investors looking to participate in the highly anticipated SpaceX IPO may have funded purchases by taking profits in large-cap technology names that had delivered substantial gains. Another possibility is growing concern that corporate customers are becoming more disciplined with artificial intelligence spending. If businesses begin tightening AI budgets, suppliers of AI infrastructure and services could face increased pricing pressure, particularly in the market for AI computing and token-based services.
As a result, while enthusiasm for AI remains strong, investors appear to be questioning whether the extraordinary growth expectations embedded in leading technology stocks can continue to be met at the same pace.
So, has the June Swoon already run its course now that the highly anticipated SpaceX IPO has been successfully completed? There are several reasons to believe that may be the case.
A potential memorandum of understanding between the United States and Iran could provide an additional tailwind for equities by easing geopolitical tensions and putting further downward pressure on oil prices. Lower energy costs would help improve the inflation outlook, potentially creating a more supportive backdrop for risk assets.
Such a development could also strengthen the position of the more dovish members of the Federal Open Market Committee, giving them greater scope to argue against a more restrictive policy stance. Falling oil prices and reduced inflation risks would lessen the need for additional tightening measures.
That said, we continue to lean toward the view that the FOMC may signal a modest hawkish shift in Wednesday’s policy statement. However, recent geopolitical and market developments have increased the likelihood that policymakers adopt a more neutral tone instead.
If that proves to be the case, the recent pullback could ultimately be remembered as a brief correction rather than the start of a deeper downturn. Combined with strong earnings momentum, easing energy prices, and improving investor sentiment, a neutral Fed stance could provide the foundation for the broader bull market to resume its advance toward fresh record highs.
After more than 100 days of conflict, financial markets finally have a clearer framework to price in developments. However, with Iran’s nuclear ambitions still unresolved, the coming two months could be just as pivotal as the period that preceded them.
A US-Iran memorandum of understanding (MOU) has created a pathway toward a formal peace agreement that could be finalized within 60 days.
Brent crude has plunged and the US dollar has softened as investors unwind positions established to hedge against geopolitical tensions.
Gold has continued to advance, reflecting lingering caution over unresolved nuclear-related risks.
EUR/USD bulls are targeting a key resistance area overhead.
Following more than three months of war, an official MOU is now in place and could serve as the foundation for a comprehensive peace accord within the next 60 days. Iran has confirmed the agreement, while a formal signing ceremony is scheduled to take place in Switzerland on Friday.
As expected, the announcement has triggered a sharp reversal of geopolitical risk trades. Even so, markets remain far from pre-conflict conditions, as investors are still concerned about how easily negotiations could break down. Iran’s nuclear program and uranium stockpiles remain major obstacles to a lasting settlement. Those concerns were highlighted just hours before the agreement, when Israel and Hezbollah were still exchanging missile strikes, underscoring the fragility of the situation.
Trump, meanwhile, presented a far more optimistic narrative on Truth Social, proclaiming that “the deal with the Islamic Republic of Iran is now complete.” He said the Strait of Hormuz would reopen and that the US naval blockade would be removed, concluding with the message: “Ships of the world, start your engines. Let the oil flow!”
Brent Crude Approaches Key Support Zone
Following the diplomatic breakthrough, Brent crude — the global oil benchmark — extended its decline to fresh multi-month lows, slipping into the low-$80s for the first time since mid-April, when an earlier agreement to reopen the Strait of Hormuz was announced. Markets appear to be betting that this latest deal could have a more lasting impact.
After breaking below both its 100-day moving average and the 50% Fibonacci retracement of the Iran-war rally late last week, Brent is now closing in on a key technical support zone around $80 per barrel. This level has repeatedly acted as both support and resistance over extended periods and previously triggered significant bullish reversals when tested during the conflict, making it the most important downside level in the near term.
A decisive break below $80 could shift attention to the 200-day moving average near $77, followed by an unfilled price gap between $76 and $73.55. The latter marks Brent’s closing price on February 27, just before the outbreak of the Iran conflict.
On the upside, the first notable resistance level sits at $88.65, representing the 50% retracement of the war-driven advance. Any rebound toward this area would likely coincide with renewed concerns about the durability of the peace process.
Technical indicators continue to favor the bears. Both the RSI (14) and MACD point to strengthening downside momentum, suggesting that short positions remain more attractive than longs while the current trend persists.
DXY Tests Key Support as Selling Pressure Intensifies
The US Dollar Index (DXY) opened the week with a downside gap, slipping below a key support area defined by the May uptrend line and horizontal support at 99.51. This zone is now the immediate battleground for price action. A decisive break beneath it could pave the way for a deeper decline toward the May 29 low of 98.75, with additional support found near the convergence of the 50-day, 100-day, and 200-day moving averages.
If buyers manage to regain control and push the index back above the broken support zone, attention would shift to last week’s high at 100.31, which represents the first significant resistance level overhead.
Momentum indicators are beginning to tilt in favor of the bears, although they have yet to generate a definitive sell signal. The RSI (14) is drifting back toward the neutral 50 mark, indicating fading bullish momentum, while the MACD appears close to a bearish crossover despite remaining in positive territory. For now, the signals serve more as a warning to dollar bulls than a clear invitation for aggressive short positioning.
EUR/USD Rally Encounters Key Resistance
EUR/USD broke above a resistance area formed by the 23.6% Fibonacci retracement of the January–March decline and the May 21 low at 1.1577 at the start of the week, allowing the pair to test the ascending trendline that has guided price action higher since the March lows. However, the pair briefly touched this trendline before retreating, making it the key resistance level to monitor in the near term.
A sustained move above the trendline would expose an even more formidable resistance cluster overhead. This zone includes the 50-day, 100-day, and 200-day moving averages, horizontal resistance around 1.1670, and a descending trendline extending from the January highs. Together, these levels form a significant technical barrier that could prove difficult for euro bulls to overcome, even amid the current supportive backdrop.
On the downside, if the March uptrend continues to cap gains, the former breakout area around 1.1577—marked by the 23.6% Fibonacci retracement and the May 21 low—may now act as initial support. A break below this level would shift focus toward the June lows near 1.1500.
Momentum indicators are currently sending neutral signals. The RSI (14) has broken above its recent downtrend, suggesting selling pressure is easing, while the MACD has just crossed higher from below, although it remains in negative territory. Together, these signals indicate that the downside momentum seen in recent sessions is fading, but they do not yet point to a strong bullish breakout.
Gold: Bullish Momentum Starts to Build
Gold has staged a decisive breakout following the deal announcement, surging above $4,240, a level that had capped gains late last week. With the breakout now confirmed, this area could shift into a support zone should prices experience a near-term pullback.
On the upside, the next key level to monitor is $4,352, the low recorded on March 23, which has acted as resistance on several occasions this month. Beyond that, attention turns to the May 28 low at $4,370 and former support at $4,427. If bullish momentum continues to accelerate, traders will also be watching the 200-day moving average near $4,450, a major technical hurdle visible on the daily timeframe.
Momentum indicators are beginning to support a more constructive outlook. The RSI (14) has climbed back above the neutral 50 mark, signaling improving buying pressure, while the MACD has crossed higher from below and is rapidly approaching positive territory. Together, these developments suggest that bullish momentum is building and could support further gains in the sessions ahead.
The NASDAQ 100 has experienced choppy price action this week as traders continue searching for clearer market direction. Despite the short-term uncertainty, the broader outlook remains bullish. However, ongoing geopolitical developments and headline-driven volatility could create additional risks, making it prudent to remain cautious rather than aggressively increasing exposure at current levels.
While the index continues to trade within a longer-term uptrend, investors may be wary heading into the weekend due to the possibility of unexpected developments in the Middle East that could impact market sentiment. Even so, the overall technical picture remains constructive, and any meaningful pullback is likely to be viewed as a buying opportunity, with traders looking to capitalize on potential rebounds within the prevailing bullish trend.
Gold
The gold market came under notable selling pressure at the start of the week, declining sharply and briefly testing the key $4,000 support level. This area remains a critical technical zone and is likely to attract close attention from traders in the coming sessions.
Gold prices continue to be heavily influenced by interest rate expectations. Recently, bond yields have edged lower as market participants speculate that the United States and Iran may be moving closer to a diplomatic agreement, reducing some geopolitical uncertainty and affecting demand for safe-haven assets.
From a longer-term perspective, the outlook for gold remains bullish. However, volatility is expected to remain elevated, and traders should be prepared for significant price swings. A sustained break below the $4,000 support level could trigger a deeper correction and lead to a more pronounced sell-off, making this a crucial level to monitor.
Silver
The silver market experienced volatile and uneven trading throughout the week, with price action remaining relatively noisy. Despite the fluctuations, the $60 level appears to be emerging as an important support zone and could serve as a near-term floor for the market.
On the weekly chart, the current candlestick is beginning to resemble a hammer pattern, which is often viewed as a potential bullish signal. It is also worth noting that much of the recent upward momentum was driven by Friday’s gap higher, suggesting that short-covering activity ahead of the weekend may have contributed significantly to the rally.
Looking ahead, a decisive break above the $70 level could signal a continuation of bullish momentum. If that resistance is cleared, silver may have the potential to advance another $10 relatively quickly as buyers regain control of the market.
DAX
Germany’s DAX index declined during the week, testing the important €24,000 support level before rebounding and showing renewed signs of strength. The recovery suggests that buyers remain active at lower levels, helping to stabilize the market after the recent pullback.
At present, the index appears to be trading within a broad consolidation range, with support near €24,000 and resistance around €25,000–€25,250. This upper zone continues to act as a significant barrier, limiting further upside progress in the short term.
The overall outlook remains moderately bullish, but expectations for explosive gains are limited. Instead, the DAX continues to favor a “buy-the-dip” approach, with traders likely viewing pullbacks as opportunities to enter long positions. Before a more substantial upward move can develop, the market may need additional time to build momentum and establish a stronger foundation above current levels.
S&P 500
The S&P 500 posted modest losses during the week, but the 7,300 level continues to provide strong support, a pattern that has been observed on several occasions in recent months. Buyers have consistently stepped in around this area, helping to maintain the broader bullish structure of the market.
On the upside, the 7,500 level remains an important resistance zone. However, a decisive breakout above 7,600 could serve as a catalyst for a stronger bullish move, potentially opening the door to a fresh leg higher in the ongoing uptrend.
The preferred strategy remains buying on pullbacks, although traders should be prepared for increased volatility. Seasonal summer trading conditions, concerns surrounding the bond market, and ongoing geopolitical tensions in the Middle East could contribute to choppy price action in the near term. Nevertheless, the overall outlook remains constructive. The market is still firmly in an uptrend, and while momentum has slowed somewhat, the underlying bullish trend remains intact.
EUR/USD
The euro strengthened against the U.S. dollar during the week, but the broader market structure remains largely range-bound. Despite the recent rally, EUR/USD appears to be trapped within a well-established trading range that has been in place since July 2025, with the 1.16 level serving as a key equilibrium or “fair value” area.
Given the current price dynamics, the pair may continue gravitating toward the middle of this range, with the 1.1600–1.1650 zone likely acting as an important area for traders to reassess market direction. Whether the euro can sustain further gains from there remains uncertain and will depend on broader macroeconomic developments.
One key indicator to monitor is the U.S. 10-year Treasury yield. Rising yields typically support the U.S. dollar by increasing the attractiveness of dollar-denominated assets. As a result, if Treasury yields begin moving higher, EUR/USD could come under renewed selling pressure and potentially reverse some of its recent gains. Overall, the pair continues to trade without a clear long-term directional bias, favoring a range-trading environment for now.
USD/JPY
The U.S. dollar traded largely sideways against the Japanese yen during the week, as the market continued to test a major resistance area near a swing high dating back to 1990. Although USD/JPY briefly moved above this level in 2024, the breakout lacked sustained momentum, leaving traders focused on whether a more decisive move higher can develop.
A key factor influencing sentiment is the possibility of intervention by the Bank of Japan. The central bank’s intervention several weeks ago helped slow the pair’s advance, but its long-term effectiveness remains uncertain. Many market participants believe that intervention alone may not be enough to reverse the broader trend.
From a fundamental perspective, the interest rate differential between the United States and Japan continues to favor the U.S. dollar, supporting a bullish outlook for USD/JPY. As a result, short-term pullbacks are still viewed as potential buying opportunities. Unless there is a significant shift in monetary policy or economic conditions, the pair appears positioned for another attempt at a sustained breakout. Even if intervention temporarily pushes prices lower, such declines could attract buyers looking to re-enter the market at more favorable levels.
USD/MXN
The U.S. dollar weakened against the Mexican peso during the week, a move that aligns with the pair’s recent technical structure. The 17.50 level has continued to act as a significant resistance zone, limiting upside attempts and reinforcing the broader range-bound environment.
On the downside, the 17.00 level remains an important area of support. With resistance clearly defined above and support holding below, USD/MXN appears likely to continue trading sideways in the near term, lacking a strong catalyst for a sustained breakout in either direction.
From a fundamental perspective, the interest rate differential continues to favor Mexico, making the peso relatively attractive compared with the U.S. dollar. As a result, short-term rallies in USD/MXN may continue to attract sellers. However, expectations for large directional moves remain limited. Ongoing uncertainty surrounding global risk sentiment, trade conditions, and supply-chain dynamics suggests that traders may prefer a cautious approach rather than taking aggressive positions in a currency pair that is often more sensitive to shifts in investor appetite for risk.
Gold’s recent pullback appears more like a healthy normalization than a sign of underlying weakness.
Its outsized outperformance versus equities had become increasingly difficult to maintain.
For investors, the key issue now is whether the correction has brought valuations back to more attractive levels.
Gold prices have recently taken many investors by surprise. After a powerful rally earlier this year, much of the optimism surrounding the metal has faded. Since the start of the year, gold has declined by roughly 5.6% — despite an environment marked by geopolitical tensions, persistent inflation concerns, and renewed demand for defensive assets.
Under normal circumstances, these conditions would strongly support higher gold prices. This time, however, the market has behaved differently. Gold has retreated while equities have regained momentum, leaving investors wondering whether the earlier rally simply became excessive.
In the short term, the answer appears to be yes.
Gold had significantly outperformed equities, reaching relative strength levels not seen in nearly two decades. When such a gap becomes too extreme, markets often respond in a familiar way: the trend reverses — rapidly, sharply, and with little warning.
The recent decline does not necessarily suggest that gold itself has become fundamentally weak. Rather, it may indicate that the metal had previously become too strong relative to other asset classes.
At first glance, the pullback seems difficult to explain. Ongoing geopolitical risks, inflation pressures, and broader uncertainty would typically favor safe-haven assets like gold. Yet markets are not driven solely by fundamentals; they also depend heavily on expectations and positioning.
And that is where the issue emerged.
Gold had become exceptionally stretched relative to the S&P 500. Investors comparing gold against U.S. equities could clearly see that the performance gap had widened to historically unusual levels — a divergence that became increasingly difficult for markets to ignore.
A review of the rolling one-year relative performance between gold and the S&P 500 since 2006 makes the relationship especially clear. Whenever gold sits above equities, the precious metal has outperformed over the previous twelve months. When it falls below, stocks have delivered stronger returns.
Over this period, gold outperformed the S&P 500 by an average of 3.1 percentage points across rolling 12-month windows and led equities in roughly 56% of those periods. On the surface, that appears impressive. Yet the more important detail lies beneath the averages.
The advantage was relatively modest, while the swings were extremely large.
The standard deviation of gold’s relative performance reached around 24 percentage points. In practical terms, that means gold can outperform stocks by more than 27 percentage points in a year — or underperform by roughly 21 percentage points — and both outcomes would still fall within historical norms.
This is where many investors misjudge the gold market. Gold does not steadily and consistently outperform equities. Instead, it moves in cycles. There are periods when it dramatically outshines stocks, and others when it underwhelms for years at a time.
Gold vs. Stocks: Where Investors Often Miscalculate
Many investors treat gold as a permanent hedge against every form of uncertainty. Economic crisis? Buy gold. Inflation? Buy gold. Geopolitical risk? Buy gold. But markets rarely work in such a straightforward way.
Gold tends to perform best when confidence in risk assets weakens. During the 2008–2009 financial crisis, for example, the metal benefited as investors sought safety while equity markets struggled.
The environment between 2013 and 2019 looked very different. During those years, equities significantly outperformed while gold delivered relatively disappointing returns for an extended period.
This highlights an important point: gold is not a guaranteed return enhancer. It is a cyclical asset. And that cyclical nature is exactly what gives it value within a diversified portfolio.
Gold’s greatest strength is not necessarily its ability to beat stocks over time, but rather the fact that it often behaves differently from them. Since 2006, the correlation between monthly gold returns and the S&P 500 has been only around 0.07, suggesting that the two asset classes move largely independently.
Gold’s Extreme Lead Became a Warning Sign
The divergence became particularly pronounced around the turn of 2025/26, when gold’s outperformance relative to the S&P 500 surged to roughly 69 percentage points — the largest gap seen in about two decades.
That level no longer represented a normal market move. It reflected an extreme.
Gold was approaching the upper three-sigma threshold near 75 percentage points, implying that the metal had become historically overstretched relative to equities. It was no longer simply expensive or overheated; it had entered territory where caution became increasingly necessary.
The correction that followed was therefore not entirely surprising.
Since its peak, gold has fallen by roughly 23%, while the S&P 500 gained around 6% over the same period. Much of gold’s extraordinary lead disappeared rapidly — a classic example of mean reversion in financial markets.
For investors, the lesson is important. Once an asset has rallied excessively, a compelling long-term narrative alone is no longer enough to sustain prices indefinitely. At some stage, optimism becomes overly priced in, and markets begin to rotate toward relatively more attractive opportunities elsewhere.
Gold Is Moving Back Toward Historical Norms
At present, gold’s 12-month outperformance versus the S&P 500 has narrowed to roughly 6 percentage points, much closer to the long-term average of 3.1 percentage points.
Very little remains of the extreme divergence seen earlier in the year. The previous overextension has already been substantially corrected — and far more quickly than many investors anticipated.
That is what makes the current environment particularly interesting. Investors focusing only on the recent decline may conclude that gold has suddenly turned weak. In reality, the market may simply be witnessing a normalization after an unusually powerful rally.
Gold’s Long-Term Case Remains Intact
Despite the recent correction, gold’s long-term performance remains stronger than many assume. Since 2006, gold prices have risen by approximately 616%, compared with roughly 470% for the S&P 500 on a price-only basis.
However, this comparison requires context. Dividends are excluded from the S&P 500 figure, and over nearly two decades dividend reinvestment makes a substantial difference.
On a total-return basis, including dividends, equities still hold a slight advantage. That is why it would be misleading to declare gold the definitive long-term winner.
Stocks possess structural advantages that gold lacks. Companies generate earnings, expand operations, reinvest capital, buy back shares, and distribute dividends. Gold does none of these things. Its value is driven primarily by scarcity, investor confidence, and supply-demand dynamics.
That is also why gold should not be viewed as a replacement for equities, but rather as a complement to them within a broader portfolio strategy.
Why Gold Still Deserves Attention
In the near term, gold could continue losing relative ground to equities after its exceptional outperformance. Over the next six to twelve months, there are reasonable arguments that stocks may continue to narrow the gap further.
Yet the long-term structural backdrop for gold remains supportive.
One major factor is central bank demand. Around the world, central banks continue diversifying reserves away from U.S. Treasury assets, with gold playing a central role in that process. Unlike sovereign debt, gold is politically neutral, finite in supply, and globally recognized as a store of value.
Importantly, this is not a short-term trend. Reserve allocation shifts typically unfold over many years, creating a persistent structural source of demand for the precious metal.
Geopolitical uncertainty, inflation concerns, and broader questions surrounding long-term currency stability also continue to support gold’s strategic relevance within portfolios.
Still, valuation matters.
Investors buying after an extended rally often need considerable patience. Those evaluating gold after a meaningful correction may once again find a more balanced risk-reward setup. That is precisely why the current phase in the gold market deserves closer attention.
Silver prices retreat as renewed military tensions in the Middle East weigh on the recent wave of diplomatic optimism.
US forces reportedly intercepted and destroyed two Iranian attack drones aimed at commercial vessels near the Strait of Hormuz. Meanwhile, President Trump indicated that a peace agreement with Iran could be reached over the weekend after calling off planned US strikes on Iranian energy facilities.
Silver prices (XAG/USD) retreat during Friday’s Asian session after surging more than 6% in the previous trading day, with the metal hovering near $67.00 per troy ounce. The pullback comes as renewed military tensions in the Middle East undermine the recent improvement in diplomatic sentiment.
According to Fox News, US forces intercepted and destroyed two Iranian one-way attack drones near the strategically vital Strait of Hormuz after the aircraft allegedly targeted commercial ships. Meanwhile, Iranian state media said the explosion noises reported in Sirik were linked to an encounter with a vessel accused of violating regional maritime restrictions. Tehran claimed the Islamic Revolutionary Guard Corps (IRGC) warned an oil tanker and compelled it to follow the imposed traffic controls.
Even so, hopes for a diplomatic breakthrough remain alive. US President Donald Trump stated that a broad peace agreement with Iran could potentially be completed as soon as this weekend, marking a notable change after he suspended planned US military action against Iranian energy facilities. Although the agreement still awaits formal approval from both sides, Iran’s semi-official Fars news agency suggested Tehran is expected to endorse the proposal. Trump added that the deal would focus on reopening shipping routes through the Strait of Hormuz and securing firm Iranian commitments to halt its nuclear weapons ambitions.
At the same time, geopolitical instability continues to influence global monetary policy and reinforce hawkish central bank expectations. On Thursday, the European Central Bank (ECB) delivered its first interest rate increase since 2023 and revised its inflation outlook higher for both 2026 and 2027. In the United States, producer prices climbed 6.5% year-over-year in May, highlighting persistent inflationary pressure tied to Middle East-related energy disruptions. The data further strengthened market expectations that the Federal Reserve (Fed) could raise interest rates again later this year.
Gold comes under renewed selling pressure on Friday as uncertainty surrounding the Iran peace deal boosts the US Dollar.
Expectations of a hawkish Federal Reserve continue to support the USD and weigh on the non-yielding precious metal.
XAU/USD remains on track to post significant losses for the second consecutive week.
Gold (XAU/USD) faces renewed selling pressure on Thursday after a modest rebound to the $4,246–$4,247 area during the Asian session, halting the previous day’s strong recovery from its lowest level since November 2025. Conflicting signals from the US and Iran regarding a possible peace agreement revive demand for the safe-haven US Dollar (USD). Combined with expectations of a hawkish US Federal Reserve (Fed), the stronger USD continues to weigh on the non-yielding precious metal.
US President Donald Trump stated on Thursday that a deal with Iran had been reached and that the final agreement could be signed soon, possibly over the weekend. However, optimism faded after Iran denied making a final decision on the agreement. Reports also indicated that Iran’s new Supreme Leader, Mojtaba Khamenei, has yet to approve the proposed US-backed peace deal. In addition, Iran’s Foreign Ministry reportedly noted that key issues, including access through the Strait of Hormuz and frozen assets, remain unresolved.
Meanwhile, Iranian forces reportedly stopped a tanker from passing through the strategic waterway without prior coordination, highlighting continued uncertainty over Iran’s stance. Further escalating tensions, Fox News reported that US forces intercepted and destroyed two Iranian one-way attack drones near the Strait of Hormuz. These developments keep geopolitical risks elevated and support a modest rebound in crude oil prices, increasing inflation concerns. This comes as recent US inflation data points to renewed price pressures, strengthening the case for higher interest rates for a longer period.
This week’s US Consumer Price Index (CPI) and Producer Price Index (PPI) data signaled a reacceleration in inflation, reinforcing expectations that the Fed could raise interest rates again before year-end. The outlook continues to support the Greenback and pressure Gold prices. Still, traders may avoid making aggressive bearish moves on XAU/USD while awaiting further developments in the Middle East situation. Even so, the precious metal remains on course to record heavy losses for the second consecutive week.
Gold Daily Chart
Gold’s technical outlook continues to favor bearish traders, supporting the possibility of further downside in the near term.
From a technical standpoint, the precious metal maintains a negative bias while trading below the 200-day Simple Moving Average (SMA). In addition, Friday’s rejection near the 23.6% Fibonacci retracement level of the decline from the April swing high indicates that the recent rebound may simply represent a short-covering rally rather than a true trend reversal.
At the same time, the Moving Average Convergence Divergence (MACD) remains in bearish territory, with the indicator staying below its signal line and the histogram still negative. The Relative Strength Index (RSI) also remains around the mid-30 region, suggesting that selling pressure is still present despite the modest recovery from recent lows.
On the upside, immediate resistance is seen near the 23.6% Fibonacci level around $4,229, followed by the 38.2% retracement near $4,355. Further resistance appears around the 200-day SMA at approximately $4,450, which aligns closely with the 50% Fibonacci retracement near $4,456. Beyond that, the 61.8% retracement at $4,558 and the 78.6% level around $4,703 could pave the way toward the cycle peak near $4,887.
On the downside, the key support level remains the recent swing low around $4,026. A decisive break below this area would increase the likelihood of a deeper corrective decline.
Commodity markets experienced heightened volatility as investors assessed rising US inflation, shifting Federal Reserve expectations, and increasing geopolitical tensions in the Middle East. Precious metals came under pressure from a firmer US Dollar and elevated inflation expectations, while crude oil extended its advance amid concerns over potential disruptions to global energy supplies.
Gold (XAU/USD) Stays on the Defensive
Gold prices continued to trend lower, approaching the $4,100 area as US inflation accelerated to 4.2%, strengthening the view that the Federal Reserve could keep interest rates higher for longer. Meanwhile, renewed geopolitical friction between the United States and Iran supported the US Dollar, reducing demand for gold despite its traditional safe-haven appeal.
Key Levels
Resistance: 4,180 | 4,250 | 4,300
Support: 4,100 | 4,050 | 4,000
Market bias: Bearish below 4,180.
A sustained break below $4,100 could expose further downside toward the $4,050 and $4,000 support zones. Conversely, any recovery would need to clear the $4,180 resistance level to signal a potential shift in short-term momentum.
Silver (XAG/USD) Remains Under Selling Pressure
Silver prices extended their decline, slipping toward the 64.50 level as stronger US economic data and rising inflation expectations continued to support the US Dollar. With markets increasingly pricing in a prolonged period of elevated interest rates, the precious metal remains vulnerable to additional downside pressure.
Key Levels
Resistance: 66.00 | 68.00 | 70.00
Support: 64.50 | 63.00 | 61.50
Market Bias: Bearish below 66.00.
A sustained move below 64.50 could pave the way for a deeper decline toward the 63.00 and 61.50 support levels. On the upside, silver would need to reclaim and hold above 66.00 to ease bearish pressure and improve the near-term outlook.
Crude Oil (WTI) Extends Rally on Supply Risk Fears
WTI crude oil continued to move higher, trading near $91 per barrel as growing tensions between the United States and Iran heightened concerns over potential supply disruptions in the Strait of Hormuz, a critical route for global energy shipments. Additional bullish momentum came from a larger-than-expected drawdown in US crude inventories, signaling tighter supply conditions and robust demand.
Key Levels
Resistance: 91.00 | 93.50 | 95.00
Support: 88.50 | 86.00 | 84.00
Market Bias: Bullish above 88.50.
A sustained break above the $91.00 resistance level could open the door for further gains toward $93.50 and potentially $95.00. On the downside, the $88.50 area remains key support; holding above this level would preserve the current bullish structure, while a break below could trigger a deeper correction toward $86.00.
Overall Market View
The broader commodity market landscape continues to favor energy assets, while precious metals face headwinds from persistent inflation pressures, elevated interest-rate expectations, and a resilient US Dollar. As investors navigate a complex macroeconomic backdrop, attention remains focused on upcoming US economic data, Federal Reserve guidance, and geopolitical developments that could drive the next major market moves.
Outlook
Gold (XAU/USD): Bearish to Neutral
Silver (XAG/USD): Bearish
Crude Oil (WTI): Bullish
For now, crude oil appears best positioned to benefit from supply-side risks and tightening market conditions, whereas gold and silver may continue to struggle unless inflation eases or the US Dollar loses momentum. Market participants should remain alert to fresh economic signals and geopolitical headlines, as these factors are likely to shape sentiment across commodity markets in the near term.
Gold prices fell toward $4,235 during early Asian trading on Wednesday as renewed US-Iran tensions boosted market uncertainty. Fresh US strikes on Iran, following the downing of a helicopter, intensified fears of a prolonged conflict. Meanwhile, investors are closely watching the US May CPI inflation report due later Wednesday for further market direction.
Gold prices extended losses to around $4,235, the lowest level since March 23, during Wednesday’s early Asian session. The decline in XAU/USD comes amid renewed Middle East tensions and growing expectations that the Federal Reserve could raise interest rates later this year. Investors are now awaiting the release of the US May CPI inflation report for fresh market direction.
According to Reuters, the US launched strikes on Iran after US President Donald Trump claimed that Tehran had shot down a US Apache helicopter in the Strait of Hormuz. Earlier on Tuesday, Trump said the US and Iran were close to reaching an agreement, although little concrete progress has emerged since a fragile ceasefire began in early April.
Ongoing uncertainty surrounding a potential peace deal between Washington and Tehran continues to fuel inflation concerns and support expectations for higher interest rates. While Gold is traditionally viewed as a safe-haven asset during geopolitical instability, elevated interest rates reduce the appeal of the non-yielding metal.
Meanwhile, stronger-than-expected US May employment data have reinforced market expectations of a possible Fed rate hike this year. Traders are now focused on the upcoming US CPI report. Headline inflation is forecast to rise 4.2% year-over-year in May, up from 3.8% previously, while core CPI is expected to increase 2.9% YoY compared with 2.8% in April.
Any signs of stronger-than-expected inflation could strengthen the US Dollar and add further downside pressure on Gold prices in the near term.
“The prevailing inflation fears, data strength, Fed hike probability increasing, and break of 200-day moving average have led to a heavy skew negative,” said Ryan McKay, senior commodity strategist at TD Securities.