Gold prices ticked higher during Tuesday’s Asian trading session. A memorandum of understanding aimed at ending the conflict was signed by Trump, JD Vance, and the speaker of Iran’s parliament. Meanwhile, swap markets reduced the probability of a Federal Reserve rate hike by December, providing additional support for the precious metal.
Gold prices extended their gains during Tuesday’s Asian session as investors reacted positively to a framework agreement between the United States and Iran aimed at ending hostilities, reducing concerns about energy-driven inflation. The rally was further supported after Bloomberg reported that President Donald Trump and Vice President JD Vance signed a memorandum of understanding with Iran, with Trump stating that the Strait of Hormuz is already partially reopened and is expected to be fully operational by Friday.
According to Phillip Streible, chief market strategist at Blue Line Futures, markets have begun to price out the geopolitical conflict, with the peace agreement weighing on Treasury yields, the US dollar, and oil prices—key drivers of inflation expectations. Nevertheless, uncertainty remains as Washington and Tehran continue to disagree on important details, including Iran’s plans to charge fees for passage through the Strait of Hormuz. Trump also warned that military action could resume if a final nuclear agreement is not reached.
Meanwhile, expectations for additional Federal Reserve tightening eased following the diplomatic breakthrough, benefiting non-yielding assets such as gold. CME FedWatch data showed traders lowered the probability of a December rate hike to 58%, down from nearly 70% a week earlier. Investors are now focused on Wednesday’s Fed policy decision, where the central bank is widely expected to leave interest rates unchanged at 3.50%–3.75% while assessing the economic impact of recent energy-market developments.
Gold Daily Chart
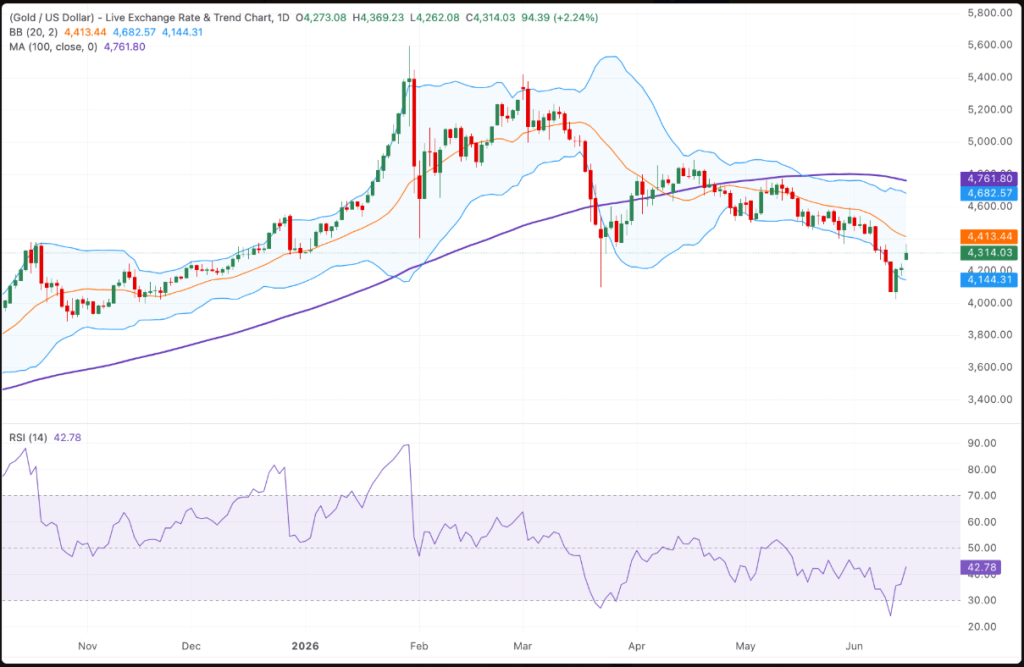
Gold remains under bearish pressure in the near term as prices continue to trade below the key 100-day Simple Moving Average (SMA). On the daily chart, XAU/USD is holding beneath the Bollinger Band midpoint, suggesting that the broader recovery remains constrained. Meanwhile, the Relative Strength Index (RSI) is hovering around 43, below the neutral 50 level, indicating that downside momentum still dominates despite recent stabilization efforts.
On the upside, the first resistance level is located at the June 9 high near $4,363. A move above that could target the Bollinger Band midpoint around $4,415, followed by stronger resistance at the upper Bollinger Band near $4,685 and the 100-day SMA around $4,762, which together form a significant supply zone.
On the downside, immediate support is seen at the lower Bollinger Band near $4,145. A sustained break below this level could reinforce bearish sentiment and open the door for a deeper decline toward previous swing lows.

Leave a comment