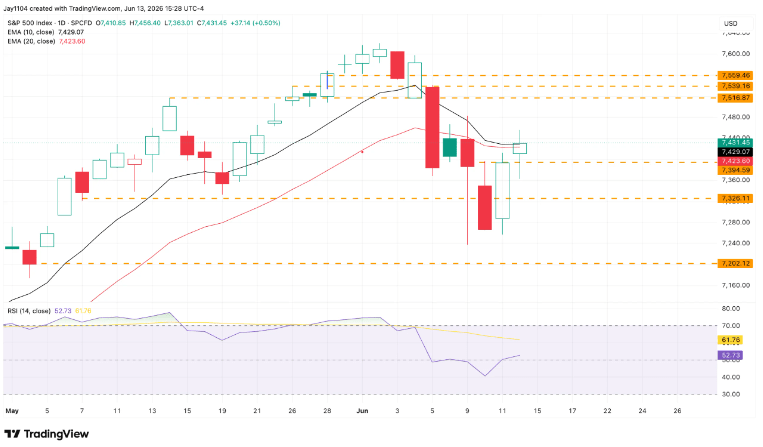
The market had a shaky start to the week but managed to stage a respectable recovery following last week’s sharp selloff. Most of the rebound came on Thursday after reports suggested that the US and Iran could be moving closer to another agreement, a development that has resurfaced repeatedly since March. Whether a deal is ultimately finalized or not, investors continue to react positively whenever such headlines emerge, and that response itself remains significant. By Friday’s close, the S&P 500 had edged slightly above where it finished the previous week.
However, the index remains capped by its 10-day and 20-day exponential moving averages, both of which are currently acting as resistance. Additional technical barriers sit just above these levels, suggesting that the market still faces challenges before a more convincing upside breakout can occur.
From a positioning perspective, the market has drifted back into slightly positive gamma, meaning dealer hedging is once again acting as a stabilizer rather than a source of amplification. However, the signal is still relatively weak. If we see another pullback next week, that setup could quickly shift back into negative gamma, where hedging flows would start to reinforce price moves and potentially accelerate downside — a dynamic that helped fuel Thursday’s rebound.
In a positive gamma environment, price action tends to gravitate toward “pinning” rather than trending. With monthly options expiring on Thursday the 18th (and markets closed on Friday the 19th for the holiday), and a meaningful amount of gamma set to roll off into expiry, conditions point toward a potentially quieter, more range-bound week ahead.

The key event next week is the Fed meeting on Wednesday, and there’s a risk the market may be caught leaning the wrong way if the tone comes in more hawkish than expected.
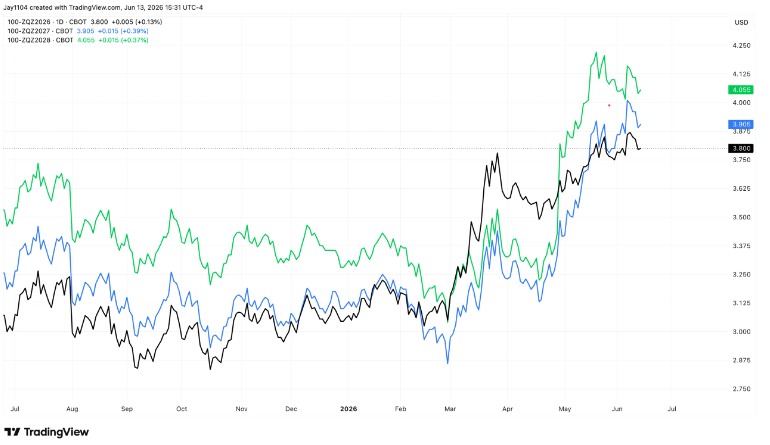
It helps to put the starting point in context. At the March meeting under Chair Powell, the FOMC’s dot plot showed a median policy rate of about 3.4% for 2026, with the easing cycle flattening out near 3.1% into early 2027.
Since then, markets have moved meaningfully higher in their rate expectations. Fed funds futures are now pricing roughly 3.80% for 2026, 3.90% for 2027, and about 4.05% for 2028. In effect, that shift has largely erased the earlier assumption of continued rate cuts and instead leans toward a more restrictive long-run stance, even introducing a subtle tilt toward the possibility of hikes.
Against that backdrop, the focus will be on whether the Fed updates its messaging to match this repricing. A key risk is a removal of any remaining easing bias, along with a rhetorical shift away from emphasizing labor market softness and back toward inflation persistence.
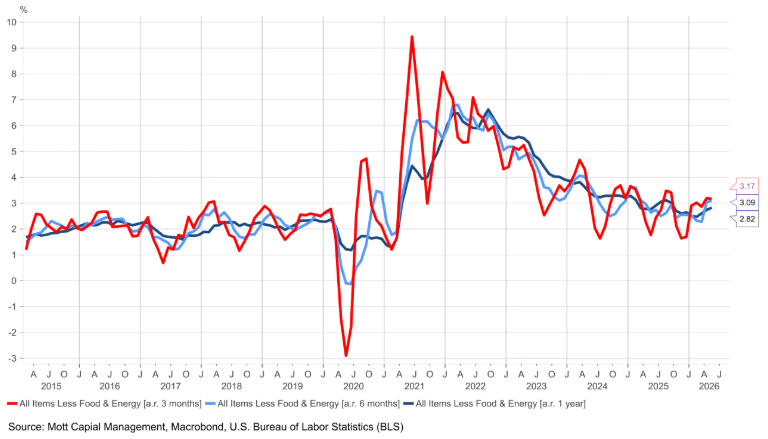
Inflation has also become more interesting lately because it’s no longer just an energy-driven story.
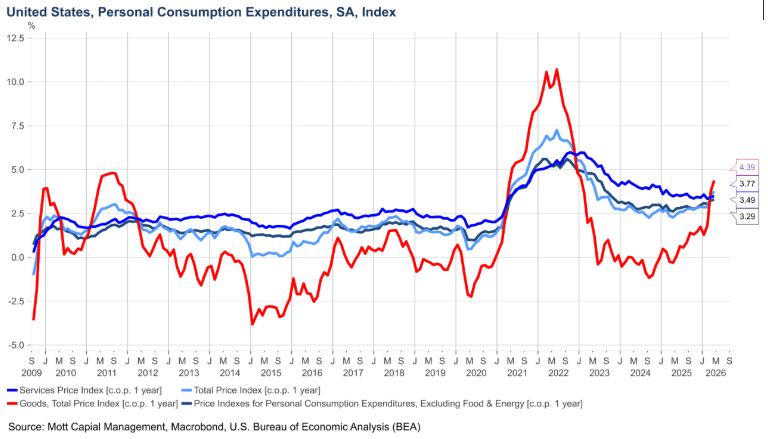
Core CPI, which strips out food and energy, is running at roughly 3.1%–3.2% on a three- and six-month annualized basis, and about 2.8% year over year. That implies the headline annual figure may continue edging higher unless monthly momentum clearly cools in the near term.
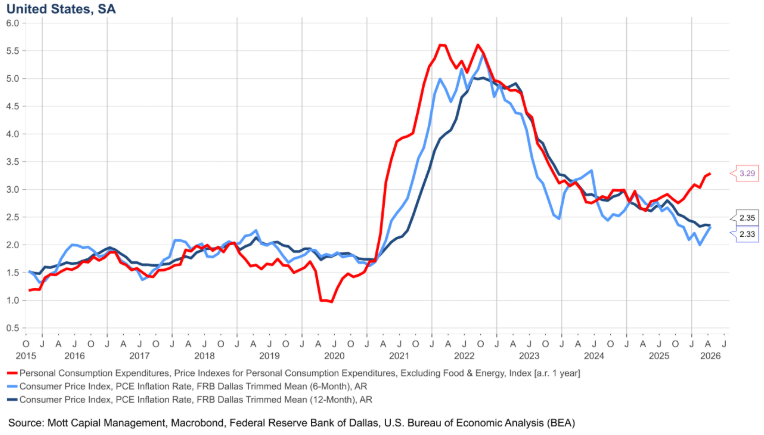
Core PCE — the Fed’s preferred inflation measure — is showing a similar pattern. It’s tracking around 3.8% on a three- and six-month basis and about 3.3% year over year, reinforcing the idea that underlying inflation remains sticky even without the volatility from energy prices.
Even measures designed to strip out outliers are now pointing in the same direction. Trimmed mean PCE — an alternative inflation gauge that excludes the most extreme monthly price moves and has been highlighted by figures such as Kevin Warsh — is running around 2.3%. Meanwhile, the Cleveland Fed’s trimmed mean CPI sits closer to 2.9%.
The historical context matters here. In 2021, trimmed-mean measures lagged the acceleration in inflation, while core PCE moved higher earlier and ultimately peaked first. In contrast, during 2019–2020, relying on trimmed-mean data alone would not have justified the rate cuts that eventually came.
The current setup suggests this is not purely an energy-driven story. If inflation were mainly about oil, it would be harder to explain why core measures are still elevated on both three- and six-month annualized bases, especially given that oil’s move only really began in March.
A key contributor appears to be goods inflation. After previously running negative, goods prices have swung back to roughly 4.4% year over year, and that reversal is now feeding through into broader inflation readings.
At the same time, the labor market is starting to show signs of turning. The ratio of job openings to unemployed workers has moved back above one and has been trending with higher highs and higher lows since December. Broader indicators — including payroll data, ADP figures, and Revelio Labs — are broadly aligned, suggesting the labor market likely bottomed out in late autumn and is now gradually firming.
That shift gives the Fed more flexibility to pivot its attention away from employment concerns and back toward inflation. Against that backdrop, it wouldn’t be surprising if the updated dot plot on Wednesday reflects a slightly lower unemployment path alongside higher inflation projections for both this year and next.
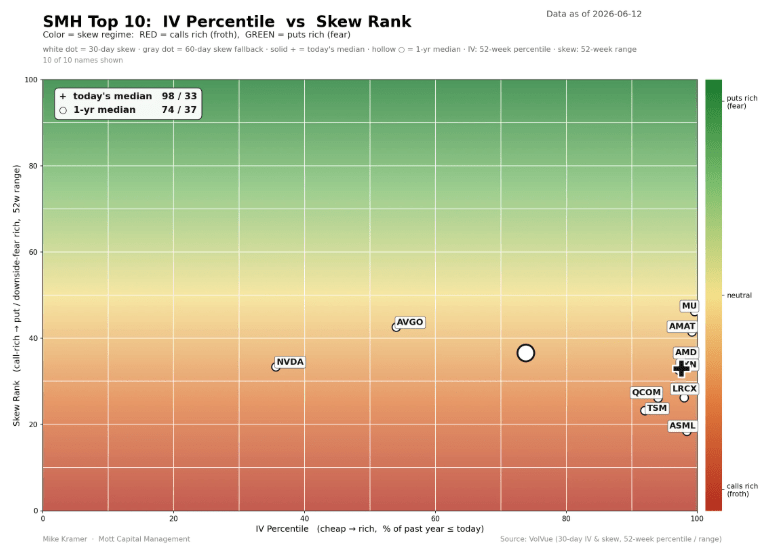
On equities, the semiconductor complex still hasn’t fully reset. Implied volatility across the group remains near the upper end of its one-year range, and positioning in options is still skewed toward calls. Even after Broadcom and NVIDIA pulled back following Broadcom’s results, names like Micron have kept overall volatility elevated.
At the same time, dispersion remains wide — the gap between single-stock volatility and index-level volatility is still pronounced — and implied correlations are still low. In other words, single-stock volatility is elevated while index volatility remains relatively contained, and that relationship hasn’t fully normalized despite the sharp selloff over the past couple of weeks.

Leave a comment