Western retail gold investors often fear rising interest rates because they mistakenly view the Federal Reserve as the ultimate force behind bond market movements. In reality, long-term interest rates are largely shaped by market dynamics, and the Fed’s influence may be far less significant than many assume.
From a broader perspective, extremely high interest rates coupled with persistent inflation could become one of the strongest catalysts for a major rally in gold prices. Investors should at least consider the possibility of a future environment where market-driven forces push yields dramatically higher, potentially coinciding with a substantial rise in gold.
Historical examples show that governments often react to inflation rather than control it. In countries that experienced severe inflationary pressures, interest rates were forced sharply higher as policymakers struggled to restore stability. Some analysts argue that similar risks, although on a much smaller scale today, are not being fully reflected in U.S. financial markets.
A key concern is the growing burden of government debt. If Treasury yields were to rise significantly, interest expenses could consume an increasingly large share of federal revenues, placing additional strain on public finances. Critics argue that markets may be underestimating this risk.
Quantitative easing (QE) proved effective during periods of disinflation and financial stress, largely supporting asset prices and market liquidity. However, in an environment where inflation remains elevated, renewed large-scale monetary stimulus could have very different consequences, potentially intensifying inflationary pressures felt by households.
Throughout history, societies have often focused on entertainment and short-term distractions during periods of economic uncertainty rather than preparing for potential financial upheaval. Advocates of gold believe the current environment presents a similar lesson: maintaining exposure to hard assets may offer protection against the long-term risks associated with inflation, debt accumulation, and currency debasement.
The long-running battle between gold and fiat currencies can be viewed as a contest between financial discipline and governments burdened by chronic overspending, rising debt levels, and an increasing reliance on monetary expansion.
Gold Spot ($GOLD – Daily Chart)
Gold’s recent price action has produced a notable technical breakout, a development that many market participants see as an important bullish signal.
Investors have been encouraged to pay close attention to gold’s retreat toward the psychologically significant $4,000 level. From recent highs, this represents roughly a 30% correction, creating what some analysts consider a rare long-term accumulation opportunity.
The broader $3,900–$4,100 range is increasingly being viewed as a high-conviction buying zone for investors seeking strategic exposure to the precious metal.
From a technical perspective, gold has broken above a key downward trendline, suggesting that bearish momentum may be fading. If the breakout is sustained, the next major target could be the higher resistance trendline near $4,400, implying further upside potential in the weeks ahead.
Gold and Silver Outlook
Looking at the weekly gold chart, several outcomes remain possible, and a scenario involving substantially higher prices cannot be ruled out. Some analysts argue that gold reaching $9,000 is conceivable even in an environment where interest rates rise toward 9%, particularly if inflation remains elevated or accelerates further.
Historical examples such as Venezuela and Zimbabwe demonstrate that governments can continue operating despite extremely high interest rates, largely because inflation was even higher. In such environments, nominal rates rise in response to inflationary pressures rather than acting as a constraint on them.
Silver Spot ($SILVER – Daily Chart)
Silver’s technical picture also appears increasingly constructive. Investors who accumulated the metal during the recent pullback—particularly as gold traded within the $3,900–$4,100 accumulation zone—are now seeing the market move in their favor.
The latest breakout signals strengthening bullish momentum, with silver appearing poised for a rapid advance. If current trends continue, the metal could target the $80 level, while an extension of the rally may open the door to prices approaching $90 over the longer term.
Overall, both precious metals continue to attract attention as investors seek potential protection against inflation, currency debasement, and mounting sovereign debt concerns.
Mining stocks are also beginning to show renewed strength. A review of the CDNX Index suggests that momentum is building across the junior resource sector, with technical indicators increasingly aligning in favor of the bulls.
From a chart perspective, the index appears to have entered a more constructive phase, as key signals—including trend direction, price structure, and momentum measures—have turned positive. In other words, the technical backdrop has improved significantly, leading some analysts to conclude that all major technical indicators are now flashing green for the CDNX.
If precious metals continue their advance, the improving technical outlook could position junior mining shares to benefit from increased investor interest and capital flows into the sector.
Gold mining stocks are presenting an increasingly attractive technical setup, according to some market analysts. The latest chart of the GDX Gold Miners ETF highlights several key accumulation zones that have historically offered favorable risk-reward opportunities for investors.
With gold, silver, and mining equities having already completed what appears to be a three-wave corrective decline, the sector may now be positioned for a much larger advance. Supporters of the bullish case argue that investors who accumulated positions during gold’s pullback into the $3,900–$4,100 range have already secured attractive entry points, while momentum-focused investors may now be receiving confirmation as prices begin to trend higher.
If the rally in precious metals continues to strengthen, GDX could potentially challenge—and in an especially bullish scenario, surpass—its previous all-time highs. Such a move would likely be supported by rising gold prices, improving sentiment, and increased capital flows into mining shares.
The broader investment thesis remains centered on concerns over expanding government debt, persistent inflation risks, and currency debasement. From this perspective, advocates of precious metals view gold as a long-term store of value and a potential hedge against fiscal and monetary instability, making it an important component of a diversified portfolio.
Bitcoin Reclaims Key Resistance as ETF Demand Returns
Bitcoin surged back above a critical resistance level that has defined trading over the past month, climbing to around $65,800, up 2.55% over the previous 24 hours after briefly topping $66,000. Trading volume exceeded $31 billion, helping extend its seven-day gain to 5% and pushing its 30-day return into positive territory at 2.44%. This marks Bitcoin’s first positive monthly performance since plunging to a 21-month low near $57,800 in late June.
The recovery above $65,000 is significant because the level has acted as a major technical barrier throughout the month. Bitcoin spent weeks trading below its 50-month EMA around $65,150, with repeated rebound attempts failing to break through. Moving above this resistance and maintaining gains on stronger volume suggests that the intense selling pressure that drove prices lower may be fading. As a result, Bitcoin’s market capitalization has rebounded to approximately $1.3 trillion.
The rally was not driven by a single event but rather a combination of supportive factors. Spot Bitcoin ETFs recorded five consecutive sessions of net inflows, geopolitical tensions between the United States and Iran showed signs of easing, and exchange balances continued to decline as large holders reduced selling activity. Together, these developments created Bitcoin’s strongest 24-hour performance in more than a month.
A key theme behind the rebound is the return of demand through spot Bitcoin ETFs. Throughout much of 2026, weak ETF inflows limited Bitcoin’s ability to sustain rallies. The recent five-day buying streak has effectively reversed part of June’s sharp decline and could pave the way for a move toward $68,000, provided support levels hold.
However, risks remain. The Federal Reserve’s July 28–29 meeting could introduce fresh volatility, and Bitcoin is still down roughly 25% year-to-date. Earlier ETF inflow recoveries this year were often followed by renewed outflows after major macroeconomic events. While the breakout above $65,000 is encouraging, the next several trading sessions will determine whether it becomes a solid foundation for further gains or merely another temporary recovery.
ETF Inflows Provide the Fuel
The main catalyst behind Bitcoin’s rebound has been the return of institutional demand through spot Bitcoin ETFs. The sector has now recorded its first five-day inflow streak since April, signaling renewed accumulation after months of persistent redemptions. For many market participants, the lack of ETF demand was the primary reason Bitcoin struggled to gain momentum throughout 2026.
On Monday alone, US spot Bitcoin ETFs attracted approximately $227 million in net inflows. These inflows directly impact the spot market because ETF issuers must purchase physical Bitcoin to back newly created shares. As a result, ETF flow trends have become one of the most important drivers of Bitcoin’s price action.
The latest inflow streak also represents an important psychological shift. Earlier in July, a brief three-day inflow period totaling $510 million interrupted a damaging 10-day outflow streak of $2.73 billion. While that provided initial stabilization, the current five-day run has delivered enough buying pressure to push Bitcoin decisively above the key $65,000 resistance level.
Assets held across US spot Bitcoin ETFs have recovered toward $79 billion, while cumulative net inflows since their launch in January 2024 have risen to $51.63 billion. These figures highlight a recovery in investor confidence rather than a continuation of the previous downturn.
Since their introduction, spot Bitcoin ETFs have become one of the most influential sources of demand for the cryptocurrency, offering regulated access for institutional investors such as pension funds, wealth managers, and financial advisors. When ETF inflows are strong, Bitcoin benefits from a consistent source of buying pressure. When flows weaken, prices often struggle to find support. The recent five-day inflow streak has restored that demand, helping Bitcoin reclaim a level that had repeatedly capped previous rallies. The market’s focus now shifts to whether this momentum can survive upcoming macroeconomic events, particularly the Federal Reserve meeting.
IBIT Takes the Lead, Signaling Institutional Demand Is Back
Among all spot Bitcoin ETF flow metrics, the most closely watched indicator is which fund attracts the most capital. On Monday, the answer was clear: BlackRock’s IBIT led the market with $116 million in net inflows, a development widely viewed as a sign of renewed institutional participation rather than short-term speculative buying.
The distinction is important. IBIT is considered the strongest proxy for institutional positioning within the spot Bitcoin ETF market. Given its massive asset base, each dollar flowing into the fund typically translates into larger underlying Bitcoin purchases compared with smaller ETF competitors. When IBIT leads inflows, it suggests that long-term investors are accumulating exposure rather than traders simply buying a temporary dip.
The broader ETF picture also reflected widespread buying interest. IBIT attracted $116.5 million, while ARK 21Shares added $72.7 million, Fidelity brought in $24.1 million, Bitwise gained $8.8 million, Morgan Stanley’s offering received $6.9 million, and VanEck collected $1.8 million. Meanwhile, the two Grayscale products moved in opposite directions, with the legacy trust losing $45.4 million while the lower-fee version gained $41.4 million. Combined, these flows produced approximately $227 million in net inflows, helping Bitcoin break above the crucial $65,000 level.
The composition of the inflows matters as much as the total. Earlier in July, sessions led by Fidelity or ARK while IBIT continued to experience outflows were viewed as tactical positioning or retail-driven activity. In contrast, when IBIT became the leading recipient of inflows—such as the $209.4 million inflow on July 6 and the $116 million gain on Monday—the market interpreted it as a much stronger signal of institutional accumulation.
IBIT itself posted a 1.55% increase in net asset value during Monday’s session, reflecting Bitcoin’s rise in the spot market. Its influence on the ETF ecosystem is substantial. The fund accounted for nearly 79% of June’s record ETF outflows, making its return to positive flows particularly meaningful. Because of its size, IBIT has the ability to drive sentiment and liquidity across the entire ETF complex. For now, that influence is working in Bitcoin’s favor, although investors remain focused on whether the trend can continue through the upcoming Federal Reserve meeting.
June’s Selloff Created the Foundation for the Recovery
To appreciate why a $227 million inflow day is attracting so much attention, it is important to understand the scale of June’s decline. June 2026 became the worst month ever for spot Bitcoin ETFs, with approximately $4.5 billion leaving the sector, surpassing the previous record outflow of $3.56 billion recorded in February 2025. IBIT alone accounted for nearly 79% of those redemptions.
The asset decline was dramatic. Total assets held by spot Bitcoin ETFs fell from more than $104 billion in mid-May to roughly $77 billion at the height of the June selloff. At the same time, Bitcoin dropped from above $93,000 at the start of 2026 to around $60,000 by the end of June, briefly touching a 21-month low near $57,800.
Unlike previous crypto bear markets, this downturn was not triggered by failures within the digital asset industry. There were no major exchange collapses, stablecoin de-peggings, or systemic credit crises. Instead, the decline was largely driven by macroeconomic pressures, including a hawkish Federal Reserve and heavy institutional ETF outflows.
This difference is crucial because recoveries from macro-driven selloffs tend to be faster than recoveries from structural crises. The underlying infrastructure remained intact throughout the downturn; only investor positioning changed. As a result, the return of ETF inflows has the potential to reverse the damage more quickly than in previous cycles.
That is why the recent five-day inflow streak is viewed as more than just a short-term rebound. It suggests that capital which exited due to macroeconomic concerns may now be returning as those concerns begin to ease. Compared with a backdrop of record outflows and a 21-month price low, Bitcoin’s move back above $65,000 appears to be the early stages of a mechanical recovery driven by the same flows that fueled the selloff.
Bulls and Bears Remain Divided
The institutional outlook for Bitcoin remains sharply split. One camp has become increasingly cautious, with at least one major financial institution cutting its 12-month Bitcoin target from $112,000 to $82,000 on July 1. The bank also projected zero net ETF inflows over the next year, citing stalled cryptocurrency legislation in Washington and concerns about weak institutional demand.
This bearish view argues that the ETF demand engine that powered Bitcoin’s rise in 2024 and 2025 has fundamentally weakened. If that assessment is correct, then every inflow streak seen this year—including the current one—would represent a temporary bounce rather than the start of a sustained bull market.
The opposing camp believes the June correction effectively flushed out weak holders and that the return of IBIT-led inflows marks the beginning of a more durable recovery. Supporters of this view argue that the recent inflow streak has already halted the systematic selling pressure that drove Bitcoin to its lows.
A more moderate perspective compares Bitcoin ETF adoption to the historical development of gold ETFs. Under this framework, periods of strong gains are naturally followed by significant corrections before long-term growth resumes. From this viewpoint, Bitcoin’s recent volatility may simply be part of a broader maturation process rather than a sign of structural weakness.
Ultimately, the debate will be decided by ETF flows. If inflows continue beyond the Federal Reserve meeting and develop into a sustained multi-week trend, confidence in a stronger recovery could grow and higher price targets may return. If flows weaken again, the bearish argument that institutional demand remains fragile will gain credibility. For now, however, the recent five-day inflow streak has shifted momentum back toward the bullish side of the market.
Exchange Outflows and Whale Activity Strengthen the Bullish Narrative
Beyond ETF inflows, on-chain data is also providing evidence that Bitcoin’s recovery may have stronger foundations. In a single day, roughly $686 million worth of Bitcoin was withdrawn from Binance, Coinbase, and Bybit, a substantial exchange outflow that is typically interpreted as investors moving coins into long-term storage rather than keeping them on exchanges for potential sale. When exchange balances decline, the amount of Bitcoin readily available for selling decreases, creating a more supportive supply environment.
Another encouraging signal comes from whale activity. The Momentum Whale Inflow Ratio, which measures the amount of Bitcoin large holders transfer to exchanges, turned negative for the first time in 2026 after remaining positive for five consecutive months. A positive reading generally suggests whales are preparing to sell by moving coins onto exchanges, while a negative reading indicates reduced selling intent and fewer coins entering the market.
The shift is particularly notable because it breaks a pattern that persisted throughout most of the 2026 downturn. During the decline, large holders consistently supplied Bitcoin to exchanges, creating selling pressure that repeatedly capped recovery attempts. The recent negative reading suggests that major investors have become less active sellers, removing a key source of overhead supply.
When viewed together, ETF inflows and exchange outflows create a favorable supply-demand dynamic. ETF issuers continue purchasing Bitcoin in response to investor demand, while fewer coins remain available on exchanges for sale. This combination often creates conditions for stronger price advances, as reduced supply meets increasing demand. Such an environment likely contributed to Bitcoin’s ability to break above $65,000 and briefly test $66,000.
While these indicators remain constructive, they are not permanent. Whale behavior can change quickly, and exchange balances can rise again if investors decide to take profits. Nevertheless, current on-chain data points toward accumulation rather than distribution, supporting the possibility of a continued move toward $68,000 in the near term.
Improving Macro Conditions Helped Fuel the Rally
The broader macroeconomic environment also played an important role in Bitcoin’s recent rebound. Reports suggesting that diplomatic discussions between the United States and Iran could resume helped ease geopolitical concerns that had previously driven investors toward defensive assets. As tensions appeared to soften, capital flowed back into risk-sensitive markets, including equities, commodities, and cryptocurrencies.
The relationship between Bitcoin and traditional financial markets was evident during the rally. On the same day Bitcoin reclaimed $65,000, US equities also moved higher, supported by strong corporate earnings and renewed optimism in the technology sector. In risk-on environments, Bitcoin tends to behave similarly to high-growth assets, benefiting from improved investor sentiment.
The significance of this shift becomes clearer when compared with earlier periods of heightened geopolitical uncertainty. During previous escalations in US-Iran tensions, Bitcoin ETFs experienced substantial outflows, including a single-day withdrawal of approximately $424.7 million, highlighting how sensitive institutional flows have become to macro developments. As geopolitical risks eased, investor appetite returned and ETF inflows resumed.
This improvement in sentiment directly challenges one of the key bearish arguments for Bitcoin. Critics have maintained that institutional demand remains weak and that ETF inflows are unlikely to recover meaningfully. However, a sustained risk-on environment—supported by easing geopolitical tensions and resilient corporate earnings—could encourage institutions to reallocate capital toward risk assets, including Bitcoin.
At the same time, the geopolitical backdrop remains fragile. Any renewed escalation could quickly reverse the current trend, driving investors back toward traditional safe-haven assets and weakening demand for cryptocurrencies. As a result, the same macro conditions that have supported Bitcoin’s rebound also represent one of its greatest risks.
The Federal Reserve Remains the Biggest Near-Term Risk
Despite improving flows and sentiment, attention is increasingly turning to the Federal Reserve’s July 28–29 policy meeting, which many investors view as the most important event for Bitcoin’s near-term outlook.
Current market expectations suggest roughly a 70% probability that the Fed leaves interest rates unchanged, with only a small chance of a surprise policy move. While a rate cut appears unlikely, even a neutral decision could influence risk assets depending on the tone of the Fed’s communication.
The Fed has been a major factor behind Bitcoin’s weakness this year. June’s sharp decline occurred amid a combination of persistent ETF outflows and a central bank that showed little willingness to ease monetary policy. Higher interest rates generally reduce the appeal of speculative and growth-oriented assets, including cryptocurrencies.
The primary concern for investors is asymmetrical risk. A rate hold is largely priced into markets and may have a limited impact on its own. However, a more hawkish-than-expected message—or an unexpected rate increase—could trigger a sharp reaction across risk assets. Given Bitcoin’s high sensitivity to changes in investor sentiment, it would likely experience outsized volatility under such a scenario.
On the other hand, a more dovish tone could provide significant support. If the Fed acknowledges signs of moderating inflation and hints at a more accommodative policy outlook later in the year, the current risk-on momentum could accelerate. In that case, Bitcoin may have a clearer path toward $68,000 and potentially higher levels.
The period leading up to the Fed meeting is therefore critical. Bitcoin has already regained the important $65,000 threshold and briefly touched $66,000, supported by ETF inflows, improving macro sentiment, and favorable on-chain data. Whether those gains can be consolidated into a sustainable uptrend will likely depend on how markets position themselves ahead of the Fed decision and how policymakers ultimately shape expectations for the remainder of the year.
For now, ETF demand, declining exchange balances, and improving risk appetite provide support for the bullish case. However, the Federal Reserve remains the single most important variable that could either extend the rally or abruptly halt it.
Many investors focus heavily on domestic markets, particularly in the United States, where stocks account for roughly 65% of global equity market capitalization. However, this still leaves about 35% of the world’s investable equity opportunities outside the U.S. A portfolio concentrated solely in one country may miss significant growth potential and expose investors to unnecessary concentration risk.
The Myth of Automatic Global Diversification
Some investors believe they already have international exposure because large U.S. companies generate a substantial portion of their revenue overseas. However, owning multinational U.S. corporations is not the same as investing directly in foreign markets. International investments provide exposure to different economies, regulatory systems, currencies, and political environments that domestic stocks cannot fully replicate.
Another concern is concentration risk within major U.S. indices. The largest companies now account for an increasingly large share of benchmark indexes, meaning investors may be more exposed to a handful of mega-cap stocks than they realize.
Four Ways to Improve Global Diversification
1. Gain Growth Exposure Through Emerging Markets
Emerging economies such as India, Brazil, Indonesia, and China offer access to expanding populations, rising consumer demand, and faster economic growth. Exchange-traded funds (ETFs) focused on these regions can enhance portfolio growth potential while adding geographic and currency diversification.
2. Add Stability with Developed International Markets
Countries including Japan, Canada, Australia, and those in Western Europe host many established companies with strong balance sheets and dividend-paying histories. Developed-market equities often behave differently from U.S. stocks, helping reduce portfolio volatility during periods of market stress.
3. Diversify Income Through International Bonds
International fixed-income investments can provide exposure to different interest-rate cycles and monetary policies. They also introduce foreign-currency exposure, helping reduce reliance on the U.S. dollar while potentially offering attractive yields.
4. Invest in Global Real Estate and Infrastructure
Global infrastructure assets such as utilities, transportation networks, and renewable energy projects can provide stable, defensive returns. International real estate investments further diversify a portfolio by accessing property markets whose cycles may differ from those in the United States.
Bottom Line
A well-diversified portfolio extends beyond national borders. While the U.S. remains one of the world’s most important investment destinations, relying exclusively on domestic assets can create concentration risks and limit long-term opportunities. By incorporating emerging markets, developed international equities, global bonds, and overseas real assets, investors can build a more balanced portfolio positioned to benefit from growth across the global economy.
EUR/USD edges higher to around 1.1405 during Wednesday’s Asian trading session. Elevated energy prices are raising concerns about renewed inflationary pressures, reinforcing expectations that the European Central Bank may maintain a tighter policy stance. Meanwhile, geopolitical tensions remain in focus after President Donald Trump downplayed the chances of near-term negotiations with Iran, as US military operations against the country entered an eleventh consecutive night.
EUR/USD posts modest gains near 1.1405 during Wednesday’s early Asian trading hours, supported by the European Central Bank’s increasingly hawkish outlook. The Euro finds demand against the US Dollar as investors position ahead of the ECB’s policy announcement scheduled for Thursday.
European sovereign bonds advanced earlier this week as persistent geopolitical risks in energy markets and concerns over renewed inflation pressures led traders to anticipate a less accommodative ECB policy trajectory.
Although the ECB is broadly expected to keep its deposit rate unchanged at 2.25% at the July meeting, market pricing suggests rates could climb to 2.66% by December and 2.73% by February 2027. According to Reuters, investors have also fully priced in a rate hike for September.
On the geopolitical front, US President Donald Trump downplayed the likelihood of near-term talks with Iran as hostilities continued and Yemen’s Iran-backed Houthi forces renewed threats against shipping in the Red Sea. Trump warned on Tuesday that Washington would retaliate if maritime routes were disrupted, though he provided no details on the potential response.
Meanwhile, Iran’s senior military leadership stated that Tehran would broaden its military operations and target US and allied interests throughout the region should Washington strike Iranian nuclear facilities, according to Xinhua. The escalating Middle East conflict could strengthen demand for traditional safe-haven assets, including the US Dollar, potentially limiting further upside in EUR/USD.
President Trump warned that any Houthi attempts to disrupt critical Saudi oil export routes would be met with retaliatory military action.
An attack on a Kuwaiti oil tanker has underscored the persistent security risks facing key shipping lanes in the Persian Gulf.
Strikes targeting Black Sea export terminals threaten the main corridor responsible for transporting most of Kazakhstan’s crude oil exports.
WTI crude oil extended its rally for a second straight session, trading near $84.60 per barrel during Wednesday’s Asian session as growing supply concerns across several major export routes supported prices. The latest gains reflect rising geopolitical risks that now extend beyond the Middle East, raising fears of potential disruptions to global energy flows.
In the United States, President Donald Trump downplayed the prospects of near-term negotiations with Iran and warned that further military action remains possible. He also pledged a swift response if Iran-backed Houthi forces follow through on threats to target commercial vessels operating in the Red Sea.
The Red Sea has become an increasingly important export route for Saudi Arabia during the regional conflict. By diverting part of its crude shipments through pipelines to Red Sea ports, the kingdom has reduced its dependence on the strategically sensitive Strait of Hormuz. Nevertheless, maritime security concerns remain elevated, highlighted by a recent attack on a Kuwaiti tanker transporting oil products through the Gulf region.
Meanwhile, supply risks are not limited to the Middle East. Market participants are also watching repeated drone strikes targeting the Caspian Pipeline Consortium terminal on Russia’s Black Sea coast. The facility serves as a crucial export gateway for Kazakhstan, handling most of the country’s crude oil shipments to international markets, making any disruption a potential threat to global supply.
Gold surged to a two-week high above the $4,100 mark during Wednesday’s Asian trading session. The precious metal found support from optimism that diplomatic initiatives could help ease geopolitical tensions. However, persistent concerns over energy-related inflation continue to strengthen expectations that the Federal Reserve may maintain a hawkish stance on interest rates. Higher rate-hike expectations, coupled with escalating US-Iran tensions, could provide support for the US Dollar and potentially limit further gains in gold prices.
Fundamental Analysis
The US Dollar (USD) traded with a stronger tone on Tuesday, but Gold also advanced, an unusual combination that highlighted rising market uncertainty. The precious metal moved further away from the key $4,000 level and hovered near an intraday high of $4,084, reflecting strong demand for safe-haven assets. Notably, Gold appeared to be outperforming the USD, a rare occurrence during periods of heightened risk aversion.
Investor concerns intensified after US President Donald Trump threatened to impose sweeping 50% tariffs on a range of Canadian goods, accusing Ottawa of maintaining unfair trade practices against American products. Although some market participants viewed the threat as a negotiating tactic, the announcement reinforced worries that trade tensions could contribute to longer-lasting inflationary pressures.
As the US trading session progressed, Gold, the US Dollar, and Wall Street equities all moved higher simultaneously—an uncommon market dynamic. The gains came despite fresh comments from President Trump indicating a willingness to escalate military action against Iran while signaling that negotiations with Tehran were no longer a priority, adding another layer of geopolitical uncertainty to global markets.
Technical Analysis
While recent price action has improved, it may be premature to confirm a sustained bullish breakout in XAU/USD. On the four-hour chart, gold maintains a constructive tone, trading above both the 100-period SMA at $4,067.46 and the 20-period SMA at $4,017.34. However, the 200-period SMA at $4,133.13 continues to act as a significant resistance barrier. Supporting the near-term bullish outlook, the RSI is trending higher around 61, while the Momentum indicator remains firmly positive, signaling strengthening upside pressure.
The broader daily chart presents a more cautious picture. Gold remains well below the 100-day and 200-day SMAs, located at $4,510.85 and $4,495.98 respectively, indicating that the longer-term trend remains under pressure. The metal is holding just above the 20-day SMA at $4,062.64, which provides immediate support and suggests consolidation rather than a confirmed trend reversal. Momentum indicators remain mixed, with the RSI near 46 and the 14-day Momentum indicator still below its midpoint, reflecting only a modest improvement in underlying sentiment.
From a technical perspective, initial support is found around the confluence of the 100-period SMA at $4,067.46 and the 20-day SMA at $4,062.64. A deeper pullback could target the 20-period SMA near $4,017.34. On the upside, the primary resistance remains the 200-period SMA at $4,133.13. A decisive break above this level would strengthen the bullish case and could pave the way for a move toward the $4,200 region.
Gold attracts renewed buying interest during Tuesday’s Asian session, although its upside remains limited. Persistent inflation concerns continue to reinforce expectations that the Federal Reserve will keep interest rates elevated, providing support for the US Dollar and reducing the appeal of the non-yielding precious metal. At the same time, lingering geopolitical tensions between the United States and Iran are underpinning demand for the greenback, prompting traders to remain cautious about chasing further gains in gold.
Gold (XAU/USD) extends its rebound during Tuesday’s European session, climbing to its highest level in four days around the $4,075 area as the US Dollar eases amid renewed hopes for diplomacy between Washington and Tehran.
The precious metal draws support after US Secretary of State Marco Rubio stated on Sunday that the United States remains willing to engage in negotiations with Iran despite the recent exchange of military strikes. The remarks have tempered demand for the US Dollar by encouraging optimism that the conflict could eventually be resolved through diplomatic channels.
However, Gold’s upside remains constrained as investors continue to price in the inflationary risks stemming from rising energy costs. Disruptions to oil shipments through the Strait of Hormuz, combined with Yemen’s Iran-backed Houthi movement announcing a maritime blockade targeting Saudi Arabia, have reinforced expectations of tighter global crude supplies. Higher oil prices could fuel inflation and strengthen the case for the Federal Reserve to maintain restrictive monetary policy for longer.
Market expectations continue to reflect that view. According to the CME FedWatch Tool, traders see roughly an 83% chance that the Fed will raise interest rates before the end of the year. The prospect of higher US borrowing costs supports the US Dollar and limits demand for non-yielding assets such as Gold.
Meanwhile, geopolitical tensions remain elevated despite the diplomatic signals. The United States has reportedly carried out a tenth consecutive night of strikes on Iranian targets, with the White House indicating that military operations will continue until President Donald Trump decides otherwise. Iran has responded with retaliatory attacks against US military facilities and allied infrastructure across the Gulf, keeping concerns over a broader regional conflict firmly in focus.
With geopolitical risks continuing to underpin the US Dollar’s safe-haven appeal and expectations for prolonged Fed tightening remaining intact, traders may prefer to wait for stronger confirmation before concluding that Gold has established a near-term bottom, particularly in the absence of major US economic data releases on Tuesday.
Gold H4 Chart
Gold continues to trade with a positive intraday tone after breaking above the 23.6% Fibonacci retracement of the decline from the July peak and pushing through a short-term descending trendline. This technical breakout strengthens the bullish outlook, while momentum indicators also show improving conditions. Both the Moving Average Convergence Divergence (MACD) and the Relative Strength Index (RSI) are pointing higher, indicating that selling pressure is gradually easing.
Even so, the broader near-term outlook remains cautious as long as XAU/USD stays below the 100-period Simple Moving Average (SMA) on the 4-hour chart and several key Fibonacci resistance levels. Any continued advance is therefore likely to encounter resistance first near the 38.2% Fibonacci retracement at $4,052.78, followed by the 100-period SMA at $4,067.29 and the 50.0% retracement at $4,081.40.
If bullish momentum extends beyond those levels, the 61.8% Fibonacci retracement at $4,110.01 could provide a more formidable resistance zone. On the downside, initial support is located around $4,017, where the 23.6% Fibonacci level aligns with the recently broken trendline. A stronger support base sits near $3,960.14, the key Fibonacci anchor, where buyers may step back in should the current pullback deepen.
Major currency pairs traded within familiar ranges early Tuesday as investors avoided making aggressive moves while monitoring developments in the Middle East. Attention now turns to Germany and the Eurozone’s ZEW Economic Sentiment surveys, while the US economic calendar remains light for the remainder of the day.
After Monday’s volatile session, crude oil prices eased modestly, with West Texas Intermediate (WTI) slipping around 0.5% to trade near $82 per barrel. Oil initially retreated after reports suggested mediators had proposed a 10-day ceasefire between the United States and Iran to revive diplomatic negotiations. However, hostilities continued to escalate.
US President Donald Trump warned that Iran would face consequences following the deaths of American service members, while US forces carried out strikes for a tenth consecutive day, targeting areas near Sirik, Bandar Abbas, Qeshm Island, Chabahar, and Konarak. Iran responded with attacks on US assets across the Gulf, keeping geopolitical tensions elevated.
Oil Supported by Ongoing Geopolitical Risks
Despite signs of diplomatic engagement, analysts remain cautious. Deutsche Bank noted that Iran acknowledged receiving proposals from international mediators, but escalating rhetoric from both Yemen’s Houthi movement and President Trump helped push Brent crude to settle 1.27% higher at $89.22 per barrel.
OCBC warned that any broader escalation could revive concerns over a prolonged disruption to global oil supplies, potentially lifting crude prices back above $100 per barrel. Such a scenario could increase market volatility, weaken demand for carry trades, and reinforce demand for the US Dollar as investors seek safe-haven assets.
Fed Faces Fresh Inflation Concerns
The US Dollar Index (DXY) extended Monday’s gains by more than 0.2%, although it traded sideways just below the 101.00 level during Tuesday’s European session.
According to Commerzbank’s Volkmar Baur, persistently high energy prices could make it increasingly difficult for the Federal Reserve to avoid raising interest rates. While policymakers typically focus on core inflation, sustained increases in oil prices risk feeding into broader inflation through second-round effects, complicating the Fed’s policy outlook.
Sterling Softens Despite Stable Labor Market
UK labor market data showed the ILO unemployment rate remained unchanged at 4.9% in the three months to May. Meanwhile, average earnings excluding bonuses increased 4.3% year-over-year, below expectations of 4.5%.
The softer wage growth limited Sterling’s recovery, although GBP/USD edged slightly higher to around 1.3450 after three consecutive daily declines. Investors now await Wednesday’s UK inflation report.
New Zealand Dollar Outperforms After Inflation Surprise
New Zealand’s second-quarter inflation accelerated more than expected, with the annual Consumer Price Index (CPI) rising to 4.1%, up from 3.1% in the previous quarter and exceeding forecasts of 4.0%.
The stronger inflation reading boosted expectations that the Reserve Bank of New Zealand could maintain a restrictive policy stance, lifting NZD/USD above 0.5850, its strongest level since early June.
Euro, Canadian Dollar and Yen Hold Steady
EUR/USD traded quietly around 1.1420 after posting modest losses on Monday.
USD/CAD remained above 1.4050 despite Canadian inflation slowing to 2.8% in June from 3.2% previously. The Canadian Dollar also faced pressure after the White House announced that President Trump would impose 50% tariffs on most Canadian imports, citing what Washington described as discriminatory treatment of US automobiles, alcohol, and dairy products.
Meanwhile, USD/JPY held near 162.50. Japanese Prime Minister Sanae Takaichi stated that the government would continue balancing economic support with fiscal sustainability while working to preserve market confidence.
USD/JPY may face downside pressure as the US Dollar loses momentum amid improving risk sentiment sparked by fresh diplomatic developments.
Iran has reportedly received mediation proposals aimed at easing tensions with the United States, including the possibility of a 10-day ceasefire.
Meanwhile, Japanese Prime Minister Sanae Takaichi reaffirmed her commitment to preserving market confidence and ensuring fiscal discipline in Japan’s economic strategy.
USD/JPY advanced for a fourth consecutive session, trading near 162.60 during Tuesday’s European session, though activity remained subdued with Japanese banks closed for the Marine Day holiday.
The pair’s upside may remain limited as the US Dollar struggles to build momentum amid improving market sentiment. Hopes for a reduction in geopolitical tensions emerged after Iranian officials confirmed receiving mediation proposals from international intermediaries aimed at easing the standoff with the United States, including discussions of a possible 10-day ceasefire.
According to Axios, President Donald Trump is considering two contrasting approaches: supporting a temporary ceasefire to allow the reopening of the strategically important Strait of Hormuz or joining Israel in a broader military campaign. The deliberations come as US military assets continue to be deployed across the region while diplomatic efforts remain underway.
Meanwhile, Japanese Prime Minister Sanae Takaichi reiterated the government’s commitment to preserving market confidence and maintaining fiscal discipline. She also highlighted plans to accelerate economic growth, targeting real GDP expansion above 1% and nominal growth exceeding 3% in the near term, while pursuing stronger long-term economic performance.
Investors are now looking ahead to Japan’s June National Consumer Price Index (CPI), due on Friday, for fresh clues on the Bank of Japan’s policy trajectory. Economists expect core inflation, which excludes fresh food, to increase 1.6% year-over-year, compared with 1.4% in May, reinforcing speculation over the central bank’s next policy move.
Oil Still Matters: Ranking the World’s Top 10 Producers
Oil has been pronounced obsolete countless times, yet global consumption still exceeds 100 million barrels per day.
Beyond fueling airplanes, trucks, and cargo ships, petroleum serves as a key ingredient in plastics, fertilizers, chemicals, pharmaceuticals, and thousands of everyday products that consumers rarely connect to crude oil.
According to OPEC projections, worldwide oil demand is expected to rise to 113.3 million barrels per day by 2030 and 124.1 million by 2050, with non-OECD nations driving most of the increase. Despite the global push toward alternative energy, oil is set to remain a cornerstone of the world economy for decades.
Below is a ranking of the world’s 10 largest oil-producing nations based on the latest data from the U.S. Energy Information Administration (EIA), reflecting 2025 production levels.
10. Kuwait | 2.6 Million Barrels Per Day
Although Kuwait ranks last on this list, it remains one of the richest countries in terms of oil reserves. The nation holds an estimated 101.5 billion barrels of crude, enough to sustain current production levels for roughly 100 years, while also benefiting from some of the lowest extraction costs globally.
Production, however, has fallen below its traditional pace of around 3 million barrels per day. Through the state-owned Kuwait Petroleum Corporation, the oil sector remains the backbone of the economy, generating approximately 90% of government revenues and export earnings.
Kuwait highlights an important reality: possessing vast reserves is not the same as maximizing their economic value.
9. Brazil | 3.8 Million Barrels Per Day
Brazil has emerged as one of the most compelling offshore oil success stories in recent decades. Its massive pre-salt reserves, buried beneath deep Atlantic waters and thick salt formations, require advanced technology and significant capital investment to develop.
Those investments are yielding results. Petrobras recently reported record output of 1.1 million barrels per day from the Búzios field alone, which now accounts for roughly one-third of the company’s Brazilian production.
As production expands, Brazil has become a major crude exporter and continues to offer investors exposure to highly productive fields with substantial growth potential.
8. United Arab Emirates | 3.8 Million Barrels Per Day
The UAE matched Brazil’s output at roughly 3.8 million barrels per day in 2025 but entered 2026 with a more aggressive production strategy.
Following its departure from OPEC in May, the country boosted output to a record 4.1 million barrels per day by June, signaling a desire to prioritize national production goals over cartel quotas.
Serving key Asian markets such as China, India, and Japan, the UAE has also invested heavily in refining, storage, port infrastructure, and pipeline networks. In periods of supply disruption, especially around the Strait of Hormuz, that logistical flexibility becomes a major strategic advantage.
7. Iran | 4.1 Million Barrels Per Day
Iran’s energy sector has long been shaped by geopolitics. Despite holding the world’s fourth-largest proven oil reserves and second-largest natural gas reserves, sanctions, conflict, and limited foreign investment have prevented the country from reaching its full production potential.
Output once exceeded 6 million barrels per day during the 1970s. Today, much of Iran’s oil trade relies on Chinese demand and a complex network of intermediaries designed to navigate sanctions.
Iran remains a critical player because any disruption to its exports can have an outsized effect on oil prices, particularly when tensions threaten traffic through the Strait of Hormuz, one of the world’s most important energy chokepoints.
6. China | 4.3 Million Barrels Per Day
While China is widely recognized as the world’s largest crude importer, it is also a significant producer.
Driven by energy-security concerns, Beijing has encouraged state-owned producers to boost domestic output. As a result, production climbed from approximately 3.8 million barrels per day in 2020 to a record 4.3 million in 2025.
PetroChina remains the country’s largest producer, while offshore specialist CNOOC has delivered notable growth. Increased exploration spending and new discoveries have also expanded reserve estimates.
Even so, China still imported roughly 11.55 million barrels per day in 2025. Aging fields and rising development costs suggest domestic production may be approaching practical limits, leaving imports as a crucial component of the nation’s energy strategy.
5. Iraq | 4.4 Million Barrels Per Day
Iraq possesses around 145 billion barrels of proven reserves, ranking among the largest resource holders globally.
Its oil fields are both extensive and relatively inexpensive to operate, giving the country the potential to produce far more crude than current levels suggest.
The challenge lies in infrastructure and export reliability. Roughly 93% of Iraqi crude exports pass through terminals near Basra on the Persian Gulf. Any disruption in the Strait of Hormuz can quickly create bottlenecks, forcing storage facilities to fill and production to slow.
Despite enormous geological advantages, logistical constraints and political challenges continue to limit Iraq’s full potential.
4. Canada | 5 Million Barrels Per Day
Canada stands as the only non-U.S. nation in the top five located entirely within North America, a valuable advantage amid growing geopolitical uncertainty.
Most Canadian production comes from Alberta’s oil sands, where heavy bitumen is either mined or extracted using steam-assisted recovery techniques.
Although oil sands projects require substantial upfront investment, they offer exceptionally long production lives and relatively low decline rates compared with shale wells.
Canada set another production record in 2025, with crude and equivalent output averaging 5.35 million barrels per day under broader regulatory measurements. Alberta alone contributed nearly 84% of national production.
3. Saudi Arabia | 9.6 Million Barrels Per Day
Saudi Arabia remains the most influential nation in the global oil market despite no longer holding the top production spot.
Output rose to approximately 9.6 million barrels per day in 2025 as OPEC+ gradually relaxed voluntary supply cuts.
Saudi Aramco oversees more than 260 billion barrels of proven reserves and operates some of the largest and lowest-cost oil fields ever discovered. More importantly, Saudi Arabia maintains significant spare production capacity that can be activated relatively quickly.
While most producers pump at maximum capacity, Saudi Arabia often has the ability to increase or decrease output strategically, giving it extraordinary influence over global oil prices.
2. Russia | 9.9 Million Barrels Per Day
Despite sanctions, production restraints, and the ongoing conflict in Ukraine, Russia remained the world’s second-largest oil producer in 2025 with roughly 9.9 million barrels per day.
The country has successfully redirected much of its crude exports toward Asia, with China and India becoming its dominant buyers.
However, the long-term outlook is more uncertain. Mature fields require increasing investment, while sanctions continue to limit access to advanced Western technology and financing.
Russia remains an energy giant, but sustaining current production levels could become increasingly challenging over time.
1. United States | 13.6 Million Barrels Per Day
The United States did more than lead the rankings in 2025—it achieved the highest crude oil production ever recorded by any country.
U.S. crude and condensate output averaged a record 13.6 million barrels per day, roughly 40% higher than production from either Russia or Saudi Arabia. Monthly production reached an all-time high of 13.93 million barrels per day in April.
At the center of this achievement is the Permian Basin in Texas and New Mexico, which produced approximately 6.6 million barrels per day and accounted for nearly half of total U.S. output.
Technological advances in horizontal drilling and hydraulic fracturing, combined with private mineral ownership, deep capital markets, and a competitive oil-services industry, transformed the United States into a global energy powerhouse.
Today, the country is also a major exporter of crude oil, gasoline, diesel, and refined petroleum products, strengthening both its trade position and domestic economy.
Why Oil Still Matters
Across much of the world, oil production is dominated by governments and state-owned enterprises. In contrast, private investment and publicly traded companies play a far greater role in North America.
Understanding where global oil supplies originate—and the economics behind bringing those barrels to market—can help investors better navigate future commodity cycles. Despite rapid growth in renewable energy, oil remains one of the most important resources underpinning modern civilization and the global economy.
Among the hundreds of candlestick formations available to traders, patterns such as dojis, hammers, morning stars, haramis, and engulfing candles are often promoted as signals of future market direction.
But which candlestick pattern truly stands out from the rest?
Many patterns are typically illustrated using handpicked charts where the setup appears obvious only after the price move has already occurred. While these examples can look persuasive, visual appeal alone does not guarantee consistent performance across a large sample of trades.
To address this question objectively, two extensive data-driven studies examined the effectiveness of candlestick patterns. Both identified the Bearish Engulfing pattern as the top performer.
Research from Quantified Strategies ranked the bearish engulfing pattern first out of 75 candlestick formations tested on the S&P 500. Similarly, market analyst Thomas Bulkowski concluded that it was the most effective bearish reversal pattern after analyzing more than 4.7 million price bars.
What makes these results particularly compelling is that, although both studies highlighted the same pattern, they arrived at different conclusions regarding the most effective way to trade it.
What Is the Bearish Engulfing Candlestick Pattern?
What Is a Bearish Engulfing Pattern?
A bearish engulfing pattern is a two-candle candlestick formation that typically emerges after an upward price move.
The pattern begins with a bullish candle, followed by a bearish candle that opens above the previous close but then reverses sharply and closes below the opening price of the first candle. As a result, the body of the second candle completely engulfs the body of the first. The wicks do not need to be covered for the pattern to qualify.
Visually, the setup reflects a sudden shift in market control. Buyers initially drive prices higher, but sellers overwhelm that momentum, erase the prior session’s gains, and push the market decisively lower.
While the pattern is easy to recognize, its effectiveness depends on more than appearance. Location within the trend, confirmation signals, and overall market conditions are critical factors in determining whether it offers a valid trading opportunity.
Evidence From Encyclopedia of Candlestick Charts
In Encyclopedia of Candlestick Charts, Thomas Bulkowski conducted one of the largest statistical studies of candlestick formations. His research examined more than 4.7 million price bars, tracking 103 candlestick patterns across 500 stocks over a 10-year period.
To evaluate each pattern, Bulkowski focused on three key criteria:
How often the pattern occurred
How frequently it led to a reversal or continuation
The magnitude of the price move over the following 10 trading days
The objective was not only to identify accurate patterns but also those that appeared frequently enough and generated meaningful price movements.
Among all bearish reversal formations, the bearish engulfing pattern ranked first.
When it formed during an uptrend and price later closed below the low of the entire two-candle structure, it signaled a bearish reversal 79% of the time.
The average decline over the subsequent 10 days was:
3.56% in bull markets
5.92% in bear markets
Importantly, Bulkowski did not view the engulfing candle itself as an automatic short signal. Confirmation occurred only when price closed below the pattern’s low, indicating that sellers had maintained control after the initial reversal setup.
Although bearish and bullish engulfing patterns are mirror images, their historical performance differs significantly.
Bulkowski found that bearish engulfing patterns correctly identified bearish reversals 79% of the time, while bullish engulfing patterns achieved a 63% success rate for bullish reversals. Out of 103 patterns studied, bearish engulfing ranked fifth for reversal accuracy, whereas bullish engulfing ranked twenty-second.
One reason may be that downside moves often develop with greater force. Falling markets can be accelerated by stop-loss triggers, margin calls, forced liquidations, and traders rushing to reduce risk. Once key support levels break, additional selling pressure can drive prices lower at a faster pace.
Bullish reversals generally do not benefit from the same urgency. A bullish engulfing candle may trigger a short-term bounce, but sellers can quickly regain control if the broader trend remains bearish.
Bulkowski’s data reflects this dynamic. The average decline following a confirmed bearish engulfing pattern increased from 3.56% during bull markets to 5.92% during bear markets, suggesting the setup becomes more effective when aligned with an already negative market environment.
However, a bearish engulfing pattern does not guarantee the start of a major downtrend. Bulkowski also observed that many post-breakout moves were relatively brief. The pattern may successfully identify an initial reversal without leading to an extended decline.
The Quantified Strategies Backtest
Quantified Strategies tested 75 candlestick patterns using fully mechanical rules on the S&P 500.
Surprisingly, the bearish engulfing pattern ranked first overall. Its win rate improved from roughly 55.31% after one trading day to more than 70% after 17 trading days.
The key difference was in how the pattern was used.
Rather than treating bearish engulfing as a short-selling signal, the study tested it as a buy signal. In this framework, a large bearish candle often represented a mean-reversion opportunity, with prices tending to recover after a period of short-term panic or exhaustion.
This result makes sense in the context of stock indices, which have historically exhibited a long-term upward bias. A sharp bearish engulfing candle may reflect temporary fear or forced selling rather than the beginning of a sustained bear market.
The contrast between the two studies highlights an important lesson. Bulkowski evaluated bearish engulfing as a confirmed downside reversal following an uptrend, while Quantified Strategies examined whether markets tended to rebound after the pattern appeared. The same formation produced different outcomes because the testing framework and market context differed.
How Prop Traders Can Use Bearish Engulfing
For traders seeking a bearish reversal, the pattern is most valuable after a well-established advance, particularly near resistance zones, previous highs, or other significant technical levels.
Instead of entering a short position immediately, many traders wait for a close below the pattern’s low to confirm downside momentum. The high of the engulfing candle can serve as a logical stop-loss or invalidation point.
In contrast, equity index traders may use the same pattern as a bullish mean-reversion signal when the broader trend remains positive and price is approaching support. In these situations, the bearish engulfing candle can indicate that short-term selling pressure has become excessive.
The key takeaway is that a bearish engulfing pattern is a setup rather than a complete trading strategy.
Although it achieved top rankings in major statistical studies, its effectiveness ultimately depends on context. Traders are most likely to gain an edge when they combine the pattern with trend analysis, support and resistance levels, confirmation signals, risk management rules, and clearly defined exit criteria.
Bitcoin slides below $63,000 as escalating Middle East tensions continue to pressure risk assets.
Ethereum retreats but finds near-term support at its 50-day EMA, despite persistent ETF outflows.
XRP remains technically fragile, leaving the door open for a break below $1.10 even as modest capital inflows provide limited support.
Cryptocurrencies trade broadly lower on Friday as investors continue to evaluate the fallout from ongoing military exchanges between the United States and Iran. Bitcoin (BTC) has fallen more than 1% on the day, slipping below $63,000 and extending its pullback from the weekly peak near $65,600.
Ethereum (ETH) and XRP are also under pressure, with ETH drifting toward key short-term support around $1,800, while XRP remains pinned below the crucial $1.10 threshold.
US-Iran conflict dampens risk appetite
Military operations involving the US and Iran entered a sixth consecutive night, intensifying geopolitical uncertainty across global markets. According to reports, strikes in southern Iran have targeted civilian infrastructure, including power facilities and a railway station in Bandar Abbas.
Adding to market concerns, Reuters reported that Iran has directed Yemen’s Houthi forces to prepare for a potential closure of the Red Sea oil shipping route should attacks on Iranian energy assets escalate further, raising fears of disruption to global energy supplies.
Despite the heightened tensions, overall crypto market sentiment has remained relatively stable, though firmly cautious. The Fear & Greed Index stood at 27 on Friday, up slightly from 25 a day earlier, but still within the Fear zone. The modest improvement reflects lingering optimism following softer US inflation data earlier this week, which briefly supported a rebound in risk assets such as Bitcoin, Ethereum, and XRP before geopolitical concerns regained prominence.
Meanwhile, spot Bitcoin ETF inflows remained positive on Thursday, totaling approximately $79 million. However, the figure represented a slowdown from the $108 million recorded on Wednesday and the $181 million seen on Tuesday. Should institutional demand remain resilient in the weeks ahead, it could help offset geopolitical headwinds, supporting a period of consolidation before Bitcoin potentially makes another push above the $65,000 level.
Ethereum spot ETFs shifted back into risk-off territory on Thursday, recording net outflows of $28 million. The reversal snapped a two-day streak of inflows that brought in $54 million on Wednesday and $58 million on Tuesday. The renewed selling pressure coincided with Ethereum’s rejection from its weekly peak near $1,947, highlighting growing investor caution and reinforcing the broader risk-averse mood across financial markets.
For XRP, spot ETF demand showed signs of improvement on Thursday, drawing nearly $7 million in net inflows, according to SoSoValue data. The uptick followed several sessions of subdued activity and suggests a modest return of investor interest. As a result, cumulative net inflows rose to approximately $1.49 billion, while total net assets stood near $997 million. Nevertheless, continued inflows into US-listed XRP ETFs will be crucial to counterbalance selling pressure in the spot market and provide a foundation for a more sustained recovery.
Bitcoin Price Outlook: Technical Weakness Keeps BTC Under Pressure
Bitcoin continues to exhibit a bearish near-term bias, trading below its 50-day, 100-day, and 200-day Exponential Moving Averages (EMAs), signaling that sellers remain in control. Additional overhead pressure comes from the Parabolic SAR indicator positioned around $65,600, reinforcing a key resistance zone. Meanwhile, the Relative Strength Index (RSI) sits at 47, slightly below the neutral 50 mark, reflecting subdued buying momentum despite a mildly positive reading from the Moving Average Convergence Divergence (MACD) histogram.
On the upside, Bitcoin faces immediate resistance at the 50-day EMA near $65,007, followed by the Parabolic SAR around $65,600. Together, these levels form a significant near-term barrier ahead of the 100-day EMA at $68,323 and the longer-term 200-day EMA at $74,367.
On the downside, support is located around $61,106, where a previously broken descending trendline now serves as a key structural floor. A daily close below this level could accelerate selling pressure and trigger a deeper correction. For sentiment to improve meaningfully, Bitcoin will need to reclaim and hold above the dense resistance zone around $65,000, which currently caps recovery attempts and preserves the prevailing bearish outlook.
Altcoin Outlook: Ethereum and XRP Drift Toward Key Support Levels
Ethereum (ETH) trades around $1,830, remaining above its short-term support cluster formed by the 50-day EMA at $1,811 and the Parabolic SAR at $1,801. These levels provide a modest cushion against further declines, although the broader trend remains constrained. ETH continues to trade below the 100-day EMA at $1,942 and the 200-day EMA at $2,185, keeping the medium- and long-term outlook cautious. Momentum indicators offer mixed signals, with the RSI near 55 suggesting moderate buying interest, while a still-positive but weakening MACD points to fading bullish momentum.
On the downside, the $1,830–$1,800 region represents a critical support zone. A break below this area could expose Ethereum to a deeper correction. On the upside, initial resistance is located at the 100-day EMA near $1,942, followed by the more significant 200-day EMA around $2,185. A decisive move above these barriers would be required to restore a stronger bullish outlook.
XRP Remains Under Pressure Below Key Resistance
XRP continues to trade below the important $1.10 resistance zone, maintaining a bearish technical bias. The token remains firmly below its 50-day, 100-day, and 200-day EMAs, indicating that sellers retain control of the broader trend. Additional resistance is provided by the middle Bollinger Band near $1.10 and a previously broken descending trendline around $1.12, suggesting that recovery attempts are being met with persistent selling pressure.
Momentum indicators remain relatively weak but not deeply oversold. The MACD retains a slightly positive reading, while the RSI near 44 reflects limited buying conviction and mild downside pressure.
On the upside, resistance begins at $1.10, followed by $1.12 and the 50-day EMA near $1.15. Beyond that, the upper Bollinger Band around $1.16 precedes stronger resistance levels at the 100-day EMA near $1.25 and the 200-day EMA around $1.45.
On the downside, immediate support is located near the lower Bollinger Band at $1.03. A sustained move below this level could trigger further weakness and expose XRP to lower psychological support zones, leaving the overall technical outlook negative while the token remains beneath its key moving averages.
DXY bulls remain cautious, avoiding aggressive positioning as they await greater clarity on evolving geopolitical risks.
Higher oil prices are stoking inflation concerns and reinforcing expectations of additional Federal Reserve rate hikes, providing support for the US Dollar.
The favorable fundamental environment indicates that any near-term pullbacks are likely to attract fresh buying interest.
The US Dollar Index (DXY), which measures the Greenback against a basket of major currencies, is struggling to build on a modest uptick during Monday’s Asian session and is hovering near the 100.80–100.75 area, little changed on the day. Despite the subdued price action, the broader outlook remains supportive for the US Dollar as escalating US-Iran tensions and expectations of a more hawkish Federal Reserve continue to underpin sentiment.
The Middle East conflict intensified over the weekend after the United States carried out a ninth consecutive night of strikes against Iran, following reports of another American service member being killed in Iraq. President Donald Trump stated that the operation was conducted in response to recent US military casualties. Iran retaliated by launching ballistic missiles and attack drones at targets in Bahrain, Jordan, Kuwait, and Iraq, heightening fears of a wider regional conflict. The growing geopolitical uncertainty is encouraging investors to maintain a risk premium in markets, boosting demand for the US Dollar as a traditional safe-haven asset.
At the same time, crude oil prices have surged to their highest levels since June 12, driven by concerns over supply disruptions linked to the closure of the Strait of Hormuz and a US naval blockade of Iranian ports. The sharp rise in energy costs is reviving inflation worries and increasing expectations that major central banks, including the Fed, may need to keep monetary policy tighter for longer. Market pricing reflected in the CME FedWatch Tool continues to indicate the possibility of at least one Fed rate hike in 2026, reinforcing the constructive outlook for the Greenback and limiting downside risks for the DXY.
Looking ahead, the US economic calendar is relatively quiet on Monday, leaving the Dollar largely influenced by remarks from Federal Open Market Committee (FOMC) officials and developments in the Middle East. While geopolitical headlines are likely to remain a key source of volatility, the overall fundamental backdrop continues to favor the bulls, suggesting that any notable pullbacks in the DXY are likely to attract fresh buying interest.
Silver remains under pressure as escalating US-Iran tensions drive oil prices higher, stoking inflation concerns and reinforcing expectations of further Fed tightening.
Overnight US military strikes on Iran led Tehran to declare the ceasefire void, raising the risk of significant disruptions to global energy supply routes.
Cleveland Fed President Beth Hammack reiterated on Friday that inflationary pressures continue to persist.
Silver prices (XAG/USD) extended their advance for a second straight session, trading near $56.80 per troy ounce during Monday’s Asian session. Despite the recent rebound, the precious metal may encounter headwinds as escalating tensions between the United States and Iran continue to push crude oil prices higher, reviving inflation concerns and strengthening expectations that the Federal Reserve could tighten monetary policy further.
The US has carried out a ninth consecutive night of strikes against Iranian-linked targets. In response, Tehran announced that the ceasefire arrangement between the two countries is effectively over, raising concerns about potential disruptions to key energy transit routes across the Middle East.
Regional tensions intensified further after Iran launched a new barrage of ballistic missiles and one-way attack drones targeting locations in Bahrain, Jordan, Kuwait, and Iraq, triggering air raid warnings across parts of the Gulf. At the same time, the US military confirmed the death of another service member, bringing the total to three casualties within two days.
The conflict has increasingly affected civilian infrastructure, with reports of damage to bridges, utility networks, and port facilities. Adding to concerns over energy security, Kuwait Petroleum Corp. stated that one of its oil installations was struck by an Iranian attack over the weekend.
Although investors largely expect the Federal Reserve to leave interest rates unchanged at its next policy meeting, market expectations for tighter monetary policy have increased. According to CME FedWatch data, traders are now pricing in a 61.4% chance of a rate hike in September, reflecting growing concerns that higher energy prices could reignite inflationary pressures.
Hammack highlights widespread inflation risks, supporting a hawkish Fed outlook
Cleveland Fed President Beth Hammack delivered a notably hawkish message, earning a 7.2/10 FXS SpeechTracker score, comfortably above the historical average of 6.6/10. Her remarks reflected growing concern that inflationary pressures remain entrenched across the economy. By stressing calls from businesses for stronger measures to contain rising prices and noting that many households continue to struggle financially despite solid economic growth and resilient consumer spending, Hammack underscored the disconnect between healthy economic activity and increasing cost-of-living challenges.
She also pointed to several sources of inflation pressure, including elevated energy costs, supply-chain constraints, rising insurance expenses, and growing demand linked to AI infrastructure and data-center investments. By identifying persistent inflation as the primary risk facing policymakers, Hammack’s comments reinforced expectations that the Federal Reserve may maintain a restrictive policy stance for longer, providing underlying support for the US Dollar.
Meanwhile, the FXS Fed Sentiment Index climbed 2.06 points to 128.64, signaling that overall Fed communication remains firmly tilted toward tightening and well above the neutral threshold of 100. Combined with Hammack’s above-average hawkish score, the increase suggests that policymakers continue to prioritize inflation control over concerns about economic growth, a backdrop that generally favors the Dollar against lower-yielding currencies.
Light Sweet Crude posted strong gains over the past week, a move largely driven by persistent geopolitical tensions in the Middle East that continue to fuel concerns over potential supply disruptions.
The market appears firmly positioned to challenge the $85 per barrel mark. Any near-term weakness or corrective pullbacks are likely to attract fresh buying interest, particularly from short-term traders looking to capitalize on the prevailing bullish momentum.
Gold
Gold retreated below the $4,000 threshold once again during the week, remaining under pressure as investors continue to assess the interest rate outlook. Persistent concerns that elevated borrowing costs could reduce the appeal of non-yielding assets such as gold have weighed on market sentiment.
The $4,000 level remains a key technical support zone. A sustained hold above this area could help stabilize prices, while a decisive break lower may open the door to additional downside pressure.
Silver
Silver came under heavy selling pressure during the week, dropping to a fresh low before attempting a modest recovery heading into Friday’s session. Despite the rebound, the broader technical outlook remains weak, with rallies likely to encounter renewed selling interest as bearish sentiment continues to dominate the market.
The $50 level remains a significant support zone that has influenced price action on several occasions in the past. Given the current downward momentum, a move toward this area cannot be ruled out. Rising interest rates continue to undermine the appeal of non-yielding assets, leaving silver vulnerable to further declines and offering little incentive for bullish positioning at this stage.
CAC 40
The CAC 40 experienced volatile and range-bound trading throughout the week. However, following the sharp decline seen in the previous week, the recent consolidation can be viewed as a constructive sign that the market may be stabilizing. A decisive break above the 8,400 level could pave the way for further gains toward 8,500.
A sustained move beyond 8,500 would strengthen the bullish outlook and potentially trigger a broader upward advance. On the downside, the 8,000 area continues to provide significant support, and as long as the index remains above this level, the longer-term uptrend is likely to stay intact.
Natural Gas
Natural gas prices edged lower over the past week, extending the prevailing bearish trend. The weakness is largely consistent with seasonal demand patterns, as this period of the year typically experiences softer consumption. Under these conditions, short-term rebounds are likely to be viewed as selling opportunities rather than the start of a sustained recovery.
Market sentiment remains tilted to the downside, with traders likely to sell into rallies that show signs of losing momentum. A break below this week’s low could accelerate selling pressure and expose the $2.50 level as the next significant downside target. Given that the market is currently focused on the August contract, a substantial upward move appears unlikely unless an intense and widespread heatwave significantly boosts energy demand across the United States.
USD/CAD
The US dollar came under significant pressure against the Canadian dollar during the week, with the 1.40 level providing a measure of support heading into the weekend. Strength in crude oil prices has contributed to the Canadian dollar’s resilience, as rising energy prices generally benefit Canada’s commodity-linked currency.
The 1.40 area is likely to remain a closely watched support zone, making next week’s price action particularly important for determining the pair’s near-term direction. Recent movements have been influenced by a combination of factors, including ongoing geopolitical tensions in the Middle East, softer-than-expected US CPI and PPI data, and stronger-than-forecast Canadian employment figures released the previous week. Together, these developments have increased pressure on the US dollar while providing support for the Canadian currency.
NASDAQ 100
The Nasdaq 100 declined during the week, revisiting the 28,500 level, a region that has repeatedly acted as an important support zone. The market’s ability to hold above this area is likely to attract attention from investors looking for value opportunities and could help sustain the broader consolidation pattern.
If buyers successfully defend the 28,500 support level, the index may stage a rebound and continue trading within its established range. Under current conditions, the broader outlook still favors a move back toward the 30,000 mark over time. However, a significant deterioration in geopolitical conditions, particularly in the Middle East, could undermine risk sentiment and challenge the bullish scenario.
EUR/USD
The EUR/USD pair continued to hover around the key 1.14 level throughout the week. This area, which previously served as a major support zone, remains an important reference point for traders. Although the euro managed to recover modestly earlier in the week, higher US interest rates have continued to limit upside momentum and provide underlying support for the US dollar.
The broader bias remains cautious, with rallies likely to face resistance if buying momentum begins to fade. Given the current interest rate dynamics and ongoing demand for the dollar, traders may prefer a short-term trading approach, looking to capitalize on brief upward corrections while remaining alert to signs of renewed weakness in the pair.
The global oil market is losing many of its key shock absorbers as inventories remain tight, shipments through the Strait of Hormuz face ongoing disruptions, and spare supply continues to shrink, increasing the likelihood of stronger oil prices.
One factor that has kept prices from climbing further is China’s sharp decline in crude oil imports. However, analysts believe that support may soon disappear, with the world’s largest oil importer expected to return to the market after drawing down its existing stockpiles.
Should disruptions in the Strait of Hormuz continue while Chinese buying accelerates, market analysts warn that global oil supplies could tighten considerably. The resulting imbalance between supply and demand may place the greatest upward pressure on crude prices in the latter part of the year.
The oil market could soon lose the key supply and demand buffers that have prevented crude prices from surging despite the massive disruption to shipments through the Strait of Hormuz.
A temporary U.S.-Iran memorandum of understanding had allowed Middle Eastern producers to accelerate exports of crude that had accumulated in Gulf storage over the previous four months. That opportunity has now effectively ended as hostilities resumed and the ceasefire collapsed.
At the same time, crude and refined fuel inventories across major consuming regions, including the United States, have fallen to critically low levels. Much of the oil released through the largest coordinated strategic stock drawdown in history has already reached refiners, leaving few reserves available to cushion further supply shocks.
Another important stabilizing factor may also be fading. China, whose reduced crude imports have helped moderate global demand in recent months, is expected to return to the market soon. If that happens, one of the largest forces restraining oil prices during the March-to-June period could disappear.
China’s Demand May Be Reawakening
China cut crude imports to their lowest level in a decade during June, extending three months of unusually weak buying as elevated prices and constrained Middle Eastern supplies discouraged purchases. Compared with its 2025 average, imports are estimated to have declined by roughly 4.4 million barrels per day.
Official customs figures showed June crude imports totaled 29.27 million metric tons, or about 7.12 million barrels per day—down 41.3% from the same month a year earlier and marking the weakest monthly import level since October 2016.
The country’s large commercial and strategic reserves, accumulated before the conflict with Iran intensified, allowed Beijing to sharply reduce imports while still meeting domestic demand. Those stockpiles have acted as a major buffer for the global market, helping prevent prices from soaring despite the disruption of more than 10 million barrels per day of oil flows through the Strait of Hormuz.
As the world’s largest crude importer, China entered the supply crisis better prepared than any other major consumer. Analysts estimate it built reserves of between 1.2 billion and 1.3 billion barrels before the conflict began, although the true size of those inventories remains uncertain because official data are limited.
Recent estimates suggest China began drawing on those reserves in May and continued doing so through June. According to the International Energy Agency (IEA), inventories declined by roughly 41 million barrels last month.
While Goldman Sachs believes China still holds ample reserves and faces no immediate pressure to increase purchases, analysts expect the turning point may be approaching. Lower official selling prices from Gulf producers for July and August could encourage Chinese refiners to step up imports in the coming months.
Since the Middle East conflict escalated in February, China’s restrained buying has effectively acted as the global oil market’s swing demand factor. If imports recover, that important demand buffer could disappear.
Shrinking Inventories Raise Risks
A rebound in Chinese demand could coincide with continuing uncertainty surrounding the Strait of Hormuz, where shipping activity remains well below the pace seen during the brief period following the U.S.-Iran agreement.
Any renewed disruption to tanker traffic would further delay the recovery of Middle Eastern exports and tighten global supplies of both crude oil and refined fuels.
According to Energy Aspects founder Amrita Sen, slower vessel movements through the Strait, combined with renewed U.S. restrictions on Iranian oil exports and rapidly declining inventories, are laying the groundwork for higher oil prices if current conditions persist.
Sen estimates that global oil inventories have fallen by roughly 600–700 million barrels since the crisis began. She warned that if the current situation extends into the end of this month or early next month, the market may face its greatest pressure later in the third quarter or early in the fourth quarter.
Speaking separately to the Financial Times, Sen said that nearly all excess commercial inventories have now been exhausted, leaving only government-held strategic reserves as a meaningful emergency backstop. As a result, confidence that oil flows through the Strait of Hormuz will remain uninterrupted is increasingly being tested.
Gold’s $4,000 Test Signals Interest Rates Are Overriding Safe-Haven Demand
Gold futures dropped to $4,008.80, down $43.00 (1.06%), after opening at $4,068.90, slightly above Wednesday’s close. Spot gold weakened even further, falling to $4,010.33 by 11:03 EDT, a daily loss of $57.22. After trading near $4,041 early in the session, bullion came under steady selling pressure throughout the day.
Gold’s recent performance reflects a sharp reversal in momentum. Prices have declined 5.25% over the past month, although they remain 20.89% higher than a year ago. Since reaching $4,121.05 on July 10, the metal has steadily retreated, ending that week around $4,100 before sliding to $4,013.64 on July 13 as it tested the $4,000 level. Today’s move marks yet another return to that critical support, with the June low resting at $4,002.
The repeated tests of $4,000 suggest the market’s focus has shifted. Rather than responding primarily to geopolitical uncertainty, gold is increasingly trading in line with interest rate expectations. Rising tensions between the United States and Iran have lifted oil prices, reinforcing inflation concerns and increasing expectations that the Federal Reserve could keep monetary policy tighter for longer. Higher real yields raise the opportunity cost of holding non-yielding assets such as gold, limiting the metal’s appeal despite heightened geopolitical risks.
The broader precious metals market reflects the same trend. Silver fell to $56.90, while August Comex silver futures declined more than 3% to $57.095. Platinum slipped to $1,656.30, and palladium dropped to $1,295.75, highlighting broad-based selling across the sector as markets reassessed the outlook for inflation and interest rates.
Although softer-than-expected U.S. inflation data briefly supported gold by reducing expectations of an imminent Fed rate hike, the relief proved short-lived. As oil prices surged on renewed Middle East tensions, inflation concerns quickly resurfaced, sending gold back toward $4,000. The swift reversal from a CPI-driven rally to an oil-driven selloff illustrates the dominant theme shaping the 2026 gold market: interest rate expectations now carry more weight than traditional safe-haven demand.
War Is Hurting Gold Through Oil, Not Supporting It as a Safe Haven
The current weakness in gold reflects a market driven more by interest rate expectations than traditional safe-haven demand. The transmission mechanism is straightforward: military escalation raises concerns over crude oil supply, pushing energy prices higher. More expensive oil feeds into headline inflation, strengthening the case for the Federal Reserve to keep interest rates elevated—or tighten further. Higher real yields increase the opportunity cost of holding non-yielding assets like gold, encouraging institutional investors to reduce exposure.
Rather than acting as a catalyst for safe-haven buying, geopolitical tensions are being interpreted primarily through their impact on inflation and monetary policy.
That dynamic explains why gold has continued to decline despite intensifying conflict in the Gulf. Investors are viewing the risk surrounding the Strait of Hormuz as an interest-rate story: higher oil prices support higher bond yields and a firmer U.S. dollar, reducing gold’s appeal. The conflict itself remains significant, but the market is responding through the inflation channel instead of the traditional flight-to-safety narrative.
Oil prices continue to reinforce that view. Brent crude trades around $84.63, up 6.39% over the past month and 21.74% from a year ago, while WTI crude remains above $80 after rallying more than 11% in three sessions. Recent U.S. strikes on Iranian targets and Iran’s retaliation against American military bases across the Gulf have heightened concerns over energy supplies.
The sequence of events also helps explain the sharp swings in sentiment. A Memorandum of Understanding signed by Iran and the United States on June 17 had raised hopes for improved relations, including the easing of sanctions on Iranian oil exports and reduced disruption around the Strait of Hormuz. Those expectations unraveled on July 6, when attacks on commercial shipping prompted military retaliation, placing the agreement under severe strain.
The contrast with earlier in the year is notable. Gold rallied during the February escalation but has fallen during the July conflict because the macro backdrop has changed. Earlier, geopolitical risks boosted demand for defensive assets. Today, the same risks are reinforcing expectations of tighter monetary policy, fundamentally altering the market’s response.
A reversal remains possible but would likely require either a prolonged disruption to shipping through the Strait of Hormuz that sparks a genuine flight to safety or a deterioration in global growth severe enough to drive bond yields lower. Reports that Tehran remains open to renewed negotiations reduce the likelihood of either scenario in the near term, leaving interest rate expectations as the dominant force weighing on bullion.
Gold Has Fallen 28% From Its Record High
Gold has retreated dramatically from its January 29 record of $5,589 per ounce to approximately $4,008.80, a decline of 28.3%, or $1,580, in less than six months.
The rally earlier this year was extraordinary. Gold surged above $5,000 for the first time, briefly touched $5,595 intraday, and established multiple all-time highs before suffering a historic reversal. After peaking in late January, prices traded sideways through much of the first quarter before breaking sharply lower in March. A modest rebound in April eventually gave way to another steady decline toward the $4,000 area, with June’s low at $4,002.
Despite the correction, the longer-term picture remains relatively resilient. Gold is down roughly 7% year-to-date but still trades nearly 21% above year-ago levels and remains about $578 above its 2025 year-end close of $3,431. In that context, the decline represents a significant retracement of an exceptionally rapid rally rather than the complete breakdown of the longer-term bullish trend.
However, the technical landscape has changed. Analysts previously viewed the $4,550 region—formed by late-December highs and early-2026 support—as a major floor. That level failed during March’s selloff and now sits roughly $460 above current prices, removing an important layer of technical support.
Heavy Liquidation Intensified the Selloff
The decline was amplified by two major liquidation waves rather than a gradual reassessment of gold’s long-term value.
The first came immediately after January’s record highs, when gold plunged nearly $1,200 in just two trading sessions, marking its steepest two-day decline since 1983. The second occurred in March, when prices fell roughly 13%, producing the worst monthly decline since 2009. In both cases, rising interest-rate expectations linked to higher energy prices overshadowed gold’s traditional role as a defensive asset.
Despite the sharp correction, Wall Street remains broadly constructive. A Reuters survey of analysts projects a 2026 median gold price of $4,746.50 per ounce, the highest consensus forecast since the poll began in 2012. With gold currently near $4,009, prices remain roughly 15.6% below that consensus estimate.
Liquidity dynamics also played an important role. During periods of market stress, institutional investors often sell their most liquid holdings to meet margin calls or raise cash quickly. Gold’s liquidity makes it a frequent source of funding, creating a paradox in which a traditional safe-haven asset can come under heavy selling pressure precisely when uncertainty rises.
That behavior was evident on March 4, when the SPDR Gold Shares (GLD) experienced approximately $2.91 billion in net outflows in a single session—the largest daily withdrawal in more than a decade. Combined with profit-taking from investors who benefited from gold’s rapid rise earlier in the year, those outflows accelerated the correction. As momentum traders exited, ownership shifted toward longer-term investors whose buying tends to be steadier but less aggressive, leaving the market without the speculative demand that previously fueled the rally.
Rising Real Yields Continue to Undermine Gold
The surge in U.S. Treasury yields has become one of the primary headwinds for gold. The 10-year Treasury yield climbed to 4.60% on Thursday, approaching the two-month high of 4.62% reached on July 13, as investors increasingly positioned for another Federal Reserve rate hike.
The key driver is real yields—bond yields adjusted for inflation expectations—rather than nominal interest rates alone. As expectations for tighter monetary policy increase, real yields rise, making income-generating assets more attractive relative to gold, which offers no yield. Conversely, when markets anticipate fewer rate hikes or eventual easing, real yields typically decline, improving gold’s relative appeal.
That dynamic briefly supported bullion after June’s softer inflation data. Consumer prices fell 0.4% month over month, the largest monthly decline since April 2020, while annual CPI eased to 3.5% and core inflation held at 2.6%. Producer prices also slipped 0.3%, marking their first monthly decline in nearly a year as energy costs retreated. Gold initially benefited from the weaker inflation readings.
However, the rally proved short-lived as stronger economic data quickly shifted attention back to the Fed. Retail sales remained resilient despite lower fuel prices, while initial jobless claims fell to 208,000, a two-month low, reinforcing confidence in the labor market. Those developments strengthened expectations that the Federal Reserve could still tighten policy later this year. Interest-rate futures currently imply roughly a 44% probability of a September rate hike, down from 50% a day earlier but still keeping additional tightening firmly on the table.
A stronger U.S. dollar has added further pressure. Supported by higher Treasury yields and a resilient U.S. economy, the Dollar Index remains near 100.49. Earlier in 2026, a weaker dollar helped propel gold to its record high of $5,589, but the recent rebound in the greenback has reversed that tailwind.
History, however, offers a note of caution. Gold has often performed well after Federal Reserve rate increases, averaging gains in the month following a 25-basis-point hike during several previous tightening cycles. The decisive factor is not the hike itself but whether tighter policy ultimately slows economic growth enough to push yields lower.
A More Hawkish Federal Reserve Has Increased Uncertainty
Since taking office as Federal Reserve Chair in May 2026, Kevin Warsh has adopted a notably less predictable communication strategy. During congressional testimony in mid-July, he followed a June Federal Open Market Committee meeting that left rates unchanged but shifted the policy outlook in a more hawkish direction.
One notable feature of the June meeting was Warsh’s decision not to publish his own interest-rate projection in the Fed’s dot plot. Combined with the removal of explicit forward guidance, the move increased uncertainty around future monetary policy and made it more difficult for markets to anticipate the Fed’s reaction function.
Markets currently expect the July 28–29 FOMC meeting to end with rates unchanged, assigning roughly a 90% probability to a hold. Nevertheless, investors continue to see September as a realistic opportunity for another rate increase.
The broader policy backdrop also remains restrictive. The World Gold Council (WGC) expects at least one Federal Reserve rate hike in 2026 while anticipating additional tightening by the Bank of England, Bank of Japan, and European Central Bank. Simultaneous tightening across several major central banks reduces the currency-diversification advantages that previously supported gold.
The macroeconomic outlook remains relatively stable, with global growth projected around 2.9%, U.S. growth near 2.1%, U.S. inflation peaking around 3.9%, and global inflation averaging 4.3% during 2026. Under those conditions, elevated real yields continue to reduce the incentive to hold gold.
The primary upside risk for bullion would be a sharper-than-expected economic slowdown. According to Bank of America’s June fund manager survey, 58% of respondents expect stagflation. Should tighter monetary policy significantly weaken growth, declining yields could eventually restore support for gold.
The World Gold Council Sees Gold Near Fair Value
The World Gold Council’sMid-Year Outlook 2026, titled Point Break, values gold using a framework based on real yields, inflation expectations, the U.S. dollar, and central-bank demand. Under its baseline macroeconomic scenario, the model estimates fair value near $4,100 per ounce, with a tolerance range of roughly ±5%, implying a second-half trading band between $3,895 and $4,305.
With gold trading around $4,008.80, prices remain comfortably within that projected range. The implication is that current valuations broadly reflect consensus expectations of one additional Fed rate hike and inflation peaking near 3.9%, suggesting the market is neither significantly overvalued nor deeply undervalued.
That assessment limits both bullish and bearish arguments. It weakens expectations of a sharp collapse because the WGC’s framework identifies fundamental support near $3,895, but it also challenges forecasts of a rapid return to $5,200–6,000 unless the macroeconomic outlook changes substantially.
Future price direction will largely depend on shifts in economic growth, geopolitical developments, and the U.S. dollar. The WGC notes that while geopolitical tensions drove much of gold’s volatility during the first half of the year, currency movements could become an equally important variable in the months ahead.
Central-Bank Buying Provides Support—but Not Momentum
Central banks continue to accumulate gold despite the recent correction. The People’s Bank of China (PBoC) purchased 15 tonnes in June—its largest monthly acquisition since October 2023—marking the 20th consecutive month of reserve accumulation. China’s official gold holdings have now reached 2,346 tonnes, representing roughly 9% of its total foreign-exchange reserves.
Worldwide, central banks acquired an estimated 244 tonnes during the first quarter of 2026, with countries such as Poland also continuing to expand their holdings.
While these purchases provide an important source of structural demand, they have not prevented prices from falling. Central banks typically allocate reserves based on long-term diversification strategies rather than short-term market movements. As a result, they tend to absorb supply steadily instead of aggressively chasing prices higher.
The scale of recent buying also illustrates its limitations. China’s 15-tonne purchase represents roughly 482,000 ounces, equivalent to approximately $1.9 billion at current prices. By comparison, the SPDR Gold Shares (GLD) experienced $2.91 billion in outflows in a single trading session during March. One day of ETF liquidation outweighed an entire month of China’s purchases.
Many longer-term bullish forecasts assume central-bank buying will remain robust, with total official-sector purchases exceeding 800 tonnes in 2026. Even if that pace is achieved, however, official demand is more likely to establish a long-term price floor than trigger another powerful rally.
The broader structural arguments for gold—including reserve diversification, fiscal expansion, de-dollarization, and limited mine-supply growth—remain intact. What has weakened is private investment demand. Because marginal private buyers typically determine short-term price movements, their retreat has had a much larger impact on prices than continued sovereign accumulation.
Bitcoin slipped to $64,195.94, down 1.40% on the day, after failing to break above $65,500 for the second time in just over a week. Its market capitalization stood at $1.29 trillion, supported by a circulating supply of 20 million BTC, while 24-hour trading volume reached $32.35 billion. Although Bitcoin remains up 2.2% over the past week, repeated rejections near the same resistance level suggest buying momentum is fading.
The rally gained traction on Wednesday when Bitcoin climbed above $65,000, reaching a three-week high of $65,529.09 after opening at $65,009.12. The cryptocurrency posted a 3.5% daily gain, with weekly performance improving to 4.03%, as trading volume totaled $23.73 billion. During the week, prices fluctuated between $62,194.46 and $64,805.30, peaking at $65,471.67.
However, the advance quickly lost steam on Thursday. Bitcoin retreated toward $64,000, falling 1.1% from the start of the UTC trading day, while Ether declined 1.7%. The pullback reflected another round of profit-taking near resistance, compounded by renewed geopolitical tensions after Iran launched attacks on U.S. military bases in Gulf states as U.S. airstrikes continued.
Current market dynamics suggest Bitcoin’s strength is being driven more by leveraged positioning than by genuine spot demand. ETF inflows, largely concentrated in a single fund, continue to influence price action, but inconsistent inflow patterns have made rallies toward $65,000 difficult to sustain. Analysts argue that Bitcoin’s estimated average holder cost basis near $53,700 remains a more meaningful reference point than bullish options positioning targeting $72,000, which has yet to receive support from underlying market flows.
Bitcoin has endured a challenging year, falling 26.1% since the start of 2026 after beginning the year above $93,000. It has declined 45.5% over the past twelve months and now trades 54.3% below its all-time high of $126,080, recorded on October 6, 2025. Among major asset classes, Bitcoin has been one of the weakest performers this year, trailing U.S. Treasuries, silver, and the Swiss franc.
Elsewhere in the crypto market, Ether traded at $1,883.01, down 2.18%, XRP eased 0.92% to $1.11, and Solana fell 2.55% to $76.20. The broader digital asset market continues to move largely in response to the same macro and liquidity-driven factors influencing Bitcoin.
Bitcoin’s 54.3% Decline Has Lasted 268 Days, Suggesting the Correction May Not Be Over
Bitcoin has now spent 268 days in a drawdown, falling 54.3% from its record high. Those figures alone challenge the view that the market has already established a definitive bottom.
History offers an important perspective. The previous two major Bitcoin bear markets lasted 363 and 376 days, with peak-to-trough losses of 84.3% and 77.6%, respectively. Compared with those cycles, the current downturn has covered only about three-quarters of the historical duration and remains significantly shallower than even the mildest of the last two declines. That suggests the correction could still be unfolding rather than reaching its conclusion.
The familiar four-year Bitcoin cycle has once again become a focus for market participants. While the current decline has not mirrored the bear markets of 2014, 2018, or 2022 exactly, its timing and overall structure share notable similarities. If Bitcoin were to experience a 70% decline from its $126,080 peak—consistent with the trend of progressively less severe bear markets—the price would fall into the $38,000–$39,000 range by early October, roughly four years after the previous cycle low. However, this represents one possible scenario rather than the most likely outcome.
There is also an important argument against an overly bearish outlook. Bitcoin recorded its lowest realized volatility on record in 2025, and historically, periods of reduced volatility have often been followed by less severe drawdowns. As a result, applying a simple 70% decline based on past cycles may overstate the downside under today’s different market conditions.
Price action throughout the year highlights the key technical levels. Bitcoin dropped from above $80,000 in late January to around $60,000 in February before staging a rebound. It finished June near $60,000 after posting a fresh 21-month low during the final week of the month. On July 1, BTC briefly touched $57,800, marking a maximum drawdown of roughly 54%, before recovering to $64,195.94.
One technical development has received relatively little attention. In late June, Bitcoin recorded its first weekly close below the 200-week moving average since 2023 after remaining under the $60,000 level for an entire week. Historically, BTC has only traded beneath this long-term trend indicator during the most severe phases of previous bear markets. Although the subsequent recovery above $60,000 is encouraging, the earlier breakdown remains a significant technical event that continues to shape the broader market outlook.
IBIT Continues to Dominate Bitcoin ETF Flows
On July 15, US spot Bitcoin ETFs attracted $107.7 million in net inflows, with BlackRock’s iShares Bitcoin Trust (IBIT) accounting for $80.8 million, or roughly three-quarters of the total. Fidelity’s FBTC contributed $16.9 million, while Grayscale’s lower-fee BTC ETF added $10 million. All remaining Bitcoin ETF products—including BITB, ARKB, BTCO, EZBC, BRRR, HODL, BTCW, MSBT, and GBTC—recorded no meaningful net activity.
The pattern has become increasingly consistent. On July 14, Bitcoin ETFs collectively attracted $181.1 million, with IBIT contributing $138.9 million and FBTC adding $21 million. No Bitcoin ETF experienced net outflows that day, lifting total Bitcoin ETF assets back to approximately $78 billion, while US spot Ether ETFs surpassed $10 billion in assets under management.
Earlier in the month, the concentration was equally apparent. On July 6, Bitcoin ETFs received $265.69 million, of which $209.4 million flowed into IBIT. The following day, overall inflows slowed sharply to $21.09 million, yet IBIT still attracted $54.45 million, implying competing funds collectively experienced net redemptions. Over the July 6–10 period, IBIT accumulated $291.9 million, exceeding the sector’s total net inflow of $197.4 million as outflows from other funds offset much of BlackRock’s gains. During the same week, GBTC lost $108.2 million, FBTC shed $93.4 million, and ARKB recorded $15.3 million in redemptions.
IBIT’s influence is just as significant during periods of outflows. Between June 22 and June 26, US spot Bitcoin ETFs experienced roughly $1.79 billion in net withdrawals, with IBIT accounting for around 73% of those redemptions. Given that the Bitcoin ETF market now manages roughly $78.5 billion in assets and holds more than 1.21 million BTC, flows into and out of IBIT increasingly shape the direction of the broader ETF market.
The impact extends beyond investor sentiment. When ETF shares are redeemed, authorized participants return those shares to the issuer, prompting custodians to sell Bitcoin in the spot market to meet cash withdrawals. Industry research cited throughout 2026 suggests ETF-related transactions now explain nearly 45% of weekly Bitcoin price movements, making fund flows a major driver of market action rather than simply a reflection of investor confidence.
As a result, Bitcoin’s near-term performance increasingly depends on a single question: how are BlackRock’s ETF investors positioning themselves?
Recovery in ETF Flows Remains Small Relative to Earlier Outflows
Although Bitcoin and Ether ETFs recently ended a prolonged redemption streak, the recovery remains modest compared with the scale of previous withdrawals.
Across eight consecutive weeks, US spot Bitcoin and Ether ETFs recorded approximately $9.46 billion in cumulative outflows, surpassing the previous record of five straight weeks of redemptions. Selling intensified through June amid broader risk-off sentiment across financial markets.
June alone generated approximately $4.51 billion in ETF withdrawals, bringing estimated net outflows for 2026 to around $5.8 billion by mid-July. May contributed another $2.30 billion, while a single trading session on June 25 saw roughly $700 million leave the sector. By the beginning of July, year-to-date net outflows had already reached $5.4 billion.
Against that backdrop, the rebound has been relatively limited. During the week of July 6–10, Bitcoin ETFs attracted $197.4 million, while Ether ETFs added $84.42 million, producing combined inflows of $281.8 million—the first positive weekly reading for both asset classes since early May.
Even so, the recovery represents only about 3% of the previous $9.46 billion withdrawn, highlighting how little of the earlier selling has been reversed.
Relative to assets under management, Ether also showed stronger momentum than Bitcoin. With approximately $9.59 billion in ETF assets, Ether’s weekly inflows equaled about 0.88% of total AUM—more than three times Bitcoin’s relative inflow intensity. Despite this stronger rebound, Ether ETFs have still experienced roughly $1.2 billion in cumulative outflows since early May.
The daily flow pattern during that positive week also reflected fragile demand. Bitcoin ETFs recorded $265.69 million in inflows on Monday, followed by just $21.44 million on Tuesday. Redemptions then returned on Wednesday (-$84.86 million) and Thursday (-$95.30 million) before Friday’s $90.44 million inflow preserved a positive weekly total. Two of the five trading sessions still ended in net outflows, underscoring that the recovery relied heavily on a handful of strong inflow days.
Before that reversal, Bitcoin ETFs had endured a 10-session outflow streak that drained approximately $2.73 billion. The streak ended on July 2 with a $221.72 million inflow led by Fidelity. Those sustained redemptions translated into billions of dollars in systematic Bitcoin selling through ETF redemption mechanisms, creating persistent market pressure regardless of broader investor views on Bitcoin’s long-term outlook.
July’s ETF Flows Highlight a Market Driven by Short-Term Swings
Bitcoin ETF activity throughout July has been characterized by sharp reversals rather than a sustained trend, with trading between July 13 and July 15 providing a clear example of the market’s recent volatility.
On July 13, US spot Bitcoin ETFs recorded a $425 million net outflow, marking the largest single-day redemption during the current period. IBIT’s net asset value declined 2.89%, with BlackRock’s redemption equating to roughly 2,990 BTC, worth approximately $185.5 million. Fidelity also experienced substantial withdrawals totaling around $245.6 million. Meanwhile, US spot Ether ETFs posted $15.41 million in net redemptions.
The following day, sentiment shifted sharply. On July 14, Bitcoin ETFs attracted $181.1 million in net inflows, led by IBIT’s $138.9 million contribution. No Bitcoin ETF reported net outflows during the session, while Bitcoin ETF prices climbed nearly 4% and Ether ETFs gained about 6%, representing their strongest daily performance in several weeks.
Momentum continued on July 15, with Bitcoin ETFs adding another $107.7 million, including $80.8 million flowing into IBIT.
Taken together, the market experienced a $425 million withdrawal followed by $288.8 million in combined inflows over the next two sessions. Throughout July, ETF flows have frequently alternated between inflows and outflows every few trading days, with neither buying nor selling pressure maintaining control for an extended period. The largest redemption of the month and one of its strongest inflow sessions occurred just 24 hours apart, highlighting the lack of a sustained directional trend.
This pattern is significant because of its influence on Bitcoin’s price discovery. If ETF flows now account for an estimated 45% of weekly Bitcoin price movements, frequent reversals in those flows can introduce considerable short-term volatility. That leaves the remaining portion of market activity—including spot trading and derivatives positioning—to absorb rapid shifts in buying and selling pressure.
One area has shown greater consistency. While spot Bitcoin ETF flows have fluctuated, leveraged Bitcoin strategy ETFs have attracted steadier inflows over the past seven weeks. That demand has helped support Strategy (MSTR) shares and prevented the stock from trading below its net asset value. At the same time, Bitcoin futures markets have continued to record positive flows, a trend often associated with stronger institutional participation.
The contrast between stable demand for leveraged products and inconsistent flows into spot Bitcoin ETFs suggests that investors using leverage have displayed greater conviction than buyers of the underlying asset. Such a divergence is unusual and may indicate that speculative positioning is currently stronger than demand in the spot market.
Leverage Continues to Drive Bitcoin as Futures Activity Outpaces Spot Buying
Bitcoin’s futures open interest has climbed to $48.90 billion, increasing 3.52%—or roughly $1.66 billion—over the past two days. The data suggests that recent price gains have been fueled primarily by leveraged positions rather than genuine spot-market demand.
The contrast between derivatives and spot flows is striking. During the period in which Bitcoin rallied from $62,194.46 to $65,529.09, US spot Bitcoin ETFs attracted $288.8 million in net inflows. Over the same timeframe, futures open interest expanded by $1.66 billion, nearly six times larger than ETF demand. This indicates that the rally was driven largely by traders increasing leveraged exposure instead of investors purchasing Bitcoin outright.
Although the increase in open interest has been described as orderly rather than excessively speculative, the size of the derivatives market remains significant. With nearly $49 billion in outstanding futures positions, relatively modest price swings can still trigger substantial forced liquidations. For comparison, the largest liquidation event over the past month totaled $363.41 million on June 25.
Recent price action, however, has not been characterized by widespread liquidations. Bitcoin’s pullback from $65,529.09 to $64,195.94 occurred without meaningful forced selling from either long or short positions, suggesting the decline reflected genuine spot-market selling rather than a cascade of leveraged liquidations.
While this orderly behavior reduces immediate systemic stress, it also implies that speculative positioning remains largely intact. Unlike liquidation-driven declines, which often reset positioning and establish stronger support levels, gradual spot-led selling leaves leveraged exposure largely untouched, creating the potential for continued volatility.
This dynamic reflects a broader imbalance in market participation. Long-term value investors may still be waiting for deeper discounts following Bitcoin’s 54.3% decline from its peak, while momentum investors appear reluctant to return until ETF inflows strengthen and broader catalysts emerge. With both groups remaining cautious, leveraged traders have become the primary force influencing short-term price action.
Perpetual futures funding rates remain positive at approximately 0.0043% every four hours, equivalent to an annualized rate of about 9.35%. Throughout Bitcoin’s advance toward $65,529.09, funding stayed positive but relatively moderate, averaging around 0.0060% every four hours.
Positive funding means traders holding long positions pay those holding shorts. However, current funding levels remain well below the elevated readings typically associated with overheated markets, indicating that leveraged bullish positioning has not yet reached extreme levels.
Liquidation data supports that interpretation. During the latest 24-hour period, total liquidations reached $37.32 million, with short positions accounting for $31.66 million, or roughly 85% of the total. Similar figures from another observation period showed shorts representing more than 82% of all liquidations.
This suggests that Bitcoin’s move from roughly $62,200 toward $65,500 was driven largely by a moderate short squeeze rather than sustained spot buying. Yet the scale of the squeeze was relatively small. The $31.66 million in liquidated short positions represents only around 0.06% of the nearly $49 billion in total futures open interest, implying that only a small portion of bearish positioning was forced out.
Compared with previous market extremes, the recent activity appears relatively subdued. During a major derivatives event in late February, perpetual funding briefly turned sharply negative while more than $500 million in crypto positions were liquidated within a single day, primarily long positions. Current conditions remain far from that level of market stress.
As a result, Bitcoin’s inability to break decisively above $65,500 is understandable. Funding rates remain moderate, short positioning has not been fully exhausted, and bearish traders retain room to re-enter the market without facing prohibitively expensive funding costs.
The combination of neutral funding, stable open interest, and only modest short-covering has produced a rally that lacked sustained follow-through, leaving Bitcoin unable to overcome a key technical resistance level.
Technical Indicators Show Improving Short-Term Momentum but Weak Long-Term Structure
From a technical perspective, Bitcoin continues to trade below its 50-day exponential moving average (EMA), currently located in the $65,100–$65,700 range. The recent high at $65,529.09 tested this resistance zone before reversing lower, reinforcing the importance of the 50-day EMA as a key trend indicator.
Momentum indicators paint a mixed picture. Daily Relative Strength Index (RSI) readings remain around 48–49, suggesting momentum has improved from oversold conditions but has yet to establish a clearly bullish trend. On the weekly timeframe, RSI remains below the critical 50 level, indicating that the broader market trend has not yet shifted in favor of buyers.
Meanwhile, the MACD shows bearish momentum gradually weakening, although it has yet to generate a confirmed bullish reversal signal.
Short-term price action remains relatively constructive. Bitcoin has maintained higher lows after its advance toward $65,500, with chart patterns resembling a pennant or symmetrical triangle that typically reflects consolidation rather than an immediate reversal. On the weekly chart, however, these higher lows continue to develop within a broader descending channel, a structure commonly associated with bear-market rallies.
The key technical levels remain well defined. A sustained move above $65,000 would strengthen the case for additional upside in the near term, while a decline below $64,500 could return Bitcoin to a broader consolidation range. Initial support lies near the 20-day moving average around $62,500, with $63,800 serving as another important support area after previously acting as resistance. On the upside, reclaiming the 50-day EMA would represent the first meaningful improvement in trend strength, opening the possibility of testing resistance between $66,600 and $67,600.
The broader technical picture remains less encouraging. In late June, Bitcoin recorded its first weekly close below the 200-week moving average since 2023—a level that has historically only been broken during the deepest phases of previous bear markets. Although the current price has recovered above that long-term average, a single rebound is insufficient to restore the long-term bullish structure. Sustained trading above the 200-week moving average over multiple weeks would be required to confirm a more durable trend reversal.
Taken together, both market flows and technical indicators point to the same conclusion: Bitcoin’s recent strength is primarily a short-term development occurring within a longer-term structure that has yet to fully recover.
GBP/USD slips toward 1.3470 during Friday’s Asian session.
The US carried out a sixth consecutive day of strikes against Iran, fueling geopolitical tensions.
Markets continue to increase expectations for additional Bank of England rate hikes this year.
The GBP/USD pair remains under modest pressure, slipping to around 1.3470 during Friday’s Asian session as heightened geopolitical tensions in the Middle East dampen investor risk appetite and lend support to the US Dollar. Market participants are also awaiting the preliminary University of Michigan Consumer Sentiment Index for July, due later in the day.
Risk aversion intensified after the United States launched a sixth consecutive day of military strikes against Iran. Authorities in Bandar Abbas reported damage to civilian infrastructure, including electricity facilities and a railway station, adding to concerns over a widening regional conflict.
The US Central Command (CENTCOM) stated that the latest operations were aimed at further weakening Iran’s military capabilities and confirmed that naval forces had boarded a vessel as part of efforts to enforce the blockade around the strategic waterway. Earlier this week, President Donald Trump warned that Iranian bridges and power infrastructure could become targets unless Tehran returned to negotiations. The escalating conflict has increased demand for traditional safe-haven assets, providing additional support for the US Dollar against Sterling.
Meanwhile, recent US inflation figures have offered mixed signals. Consumer price inflation eased in June, while producer prices also declined, reinforcing expectations that inflationary pressures are moderating. Even so, traders continue to assign roughly a 55% probability to a Federal Reserve interest rate hike in September, according to the CME FedWatch Tool.
In the UK, Bank of England Governor Andrew Bailey acknowledged concerns over the renewed hostilities between the US and Iran but said the conflict has not materially altered the country’s inflation outlook. Markets continue to expect the BoE to raise interest rates at its November meeting, with another increase largely priced in by April 2027, according to Reuters.
WTI edges higher during the Asian session, although buying interest remains limited. Escalating tensions between the US and Iran continue to underpin geopolitical risk premiums, while fears of supply disruptions across key shipping routes lend further support to crude prices.
West Texas Intermediate (WTI), the US benchmark for crude oil, trades modestly higher during Friday’s Asian session but continues to move within a well-established multi-day trading range. The commodity is hovering near $79.35, up roughly 0.5% on the day and close to Tuesday’s one-month peak, leaving it on course for a second consecutive weekly gain as investors remain focused on the possibility of further escalation between the United States and Iran.
Market sentiment remains supported after the US military conducted a sixth straight night of airstrikes against Iran on Thursday, including a strike on an empty oil tanker bound for Kharg Island as part of its renewed naval blockade of Iranian ports. In response, Iran launched attacks on US military positions across the region, intensifying concerns that the conflict could evolve into a broader confrontation. These developments have kept geopolitical risk premiums elevated and continue to provide underlying support for crude prices.
Additional concerns emerged after authorities in Bandar Abbas reported damage to civilian infrastructure, including electricity facilities and a railway station. Iran’s Islamic Revolutionary Guard Corps has also warned of expanding military operations by targeting more regional energy transport routes. Adding to supply concerns, Reuters reported that Tehran has instructed Yemen’s Houthi movement to prepare for the possible closure of the Red Sea oil corridor, creating another potential threat to global energy flows.
At the same time, declining shipping activity through the Strait of Hormuz has reinforced fears of tighter oil supplies, strengthening the case for further upside in crude prices. Even so, traders may prefer to wait for a decisive breakout above the current consolidation range before committing to fresh bullish positions. Nevertheless, the broader fundamental backdrop continues to favor buyers, suggesting that any near-term pullback is likely to attract renewed demand and remain relatively limited.
Gold prices fell to around $3,975 during Friday’s early Asian trading session. The decline came after Iran reportedly urged the Houthis to block the Red Sea gateway if the US targeted its power network, intensifying Middle East tensions. The escalating geopolitical conflict strengthened expectations that the Federal Reserve could raise interest rates later this year, putting additional pressure on the precious metal.
Gold prices remained under pressure, slipping toward an eight-month low near $3,975 in early Asian trading on Friday. The precious metal continued to weaken as escalating tensions in the Middle East fueled inflation concerns and strengthened expectations that US interest rates could remain higher for longer.
According to Reuters, Iran has instructed Yemen’s Houthi movement to prepare to block the Red Sea shipping route if the United States targets Iranian power infrastructure. The warning followed US President Donald Trump’s threat earlier this week to strike Iran’s power network.
Any disruption to the Red Sea would significantly worsen the global energy crisis already intensified by Iran’s closure of the Strait of Hormuz. Such a scenario could drive crude oil prices even higher, increasing inflationary pressures and encouraging major central banks to keep monetary policy restrictive. Higher interest rates typically reduce the attractiveness of non-yielding assets such as gold.
The renewed geopolitical tensions have overshadowed recent signs of easing US inflation. Data released earlier this week showed that both the Consumer Price Index (CPI) and Producer Price Index (PPI) cooled in June, suggesting inflationary pressures had moderated.
Despite the softer inflation readings, market participants now see roughly a 55% probability that the Federal Reserve will raise interest rates at its September meeting, according to the CME FedWatch Tool, adding further downside pressure to gold.
Gold attracts fresh selling pressure on Thursday as energy-led inflation concerns revive expectations of additional Fed rate hikes.
Escalating tensions between the US and Iran underpin demand for the safe-haven US Dollar, weighing on the precious metal.
The technical outlook remains bearish, suggesting the path of least resistance is tilted toward further downside.
Gold (XAU/USD) came under renewed selling pressure during Thursday’s Asian session, retreating toward the $4,025 area near the previous day’s swing low. Although recent US inflation data pointed to easing price pressures, elevated crude oil prices continue to fuel expectations that the Federal Reserve could still raise interest rates later this year. The prospect of tighter monetary policy lends support to the US Dollar (USD) and weighs on non-yielding Gold.
Data released by the US Bureau of Labor Statistics showed that the Producer Price Index (PPI) unexpectedly fell 0.3% in June following a revised 0.6% increase in May, while annual producer inflation slowed to 5.5% from 6.0%. The report followed a sharp decline in the Consumer Price Index (CPI), reinforcing signs that inflation pressures are moderating. As a result, traders reduced expectations for an imminent Fed rate hike, sending the USD to its weakest level since June 18 and helping Gold recover on Wednesday.
However, persistent energy-driven inflation risks continue to cloud the outlook. Crude oil prices remain near one-month highs as escalating US-Iran tensions and ongoing disruptions in the Strait of Hormuz raise concerns about global energy supplies. The US launched another wave of airstrikes against Iranian military targets on Wednesday, prompting retaliatory drone and missile attacks by Iran on US-linked facilities across the region. President Donald Trump also warned that additional Iranian infrastructure could be targeted if hostilities intensify.
Meanwhile, Iran’s Islamic Revolutionary Guard Corps threatened to broaden the conflict by targeting key regional energy routes, including shipping lanes near the Bab el-Mandeb Strait through its Houthi allies in Yemen. These developments continue to support oil prices, rekindling inflation concerns and strengthening the argument for at least one 25-basis-point Fed rate hike in 2026. Consequently, USD weakness may remain limited, while the broader outlook for Gold continues to favor further downside.
Gold Daily Chart
Gold remains under bearish pressure as XAU/USD continues to trade below its 200-day Simple Moving Average (SMA) and within a well-defined descending channel. While momentum indicators show signs of stabilization, they have yet to signal a meaningful bullish reversal. The Moving Average Convergence Divergence (MACD) remains slightly positive at 9.43, while the Relative Strength Index (RSI) hovers near 40.77, suggesting weak buying interest rather than a sustained recovery.
A confirmed break and daily close below the key psychological support at $4,000 could trigger a fresh wave of selling. Such a move would bring the June year-to-date low around $3,943–$3,942 into focus. Further downside pressure could then drive Gold toward the channel’s lower boundary near $3,675.71, a major structural support level. A decisive violation of this zone would strengthen the broader bearish outlook and open the door to deeper losses.
On the upside, immediate resistance is located near $4,093.63, corresponding to the upper boundary of the descending channel. Any recovery attempt is likely to encounter renewed selling interest in this region. A sustained breakout above this barrier would improve the technical picture and pave the way for a move toward the 200-day SMA around $4,495.94, which remains the next major resistance level.
Silver remains under pressure as escalating US-Iran tensions in the Strait of Hormuz drive oil prices higher, raising concerns that the Federal Reserve may keep interest rates elevated for longer. Softer-than-expected June CPI and PPI data have helped ease near-term rate-hike concerns. Meanwhile, markets have reduced the probability of a September Fed rate increase to 44%, although the impact of recent military developments has yet to be fully reflected in asset prices.
Silver (XAG/USD) extends its decline for a second consecutive session, trading near $57.00 per troy ounce during Thursday’s Asian session. The precious metal remains under pressure as escalating tensions between the United States and Iran drive oil prices higher, raising inflation risks and reinforcing expectations that the Federal Reserve could maintain elevated interest rates for longer.
According to reports, the US Central Command (CENTCOM) launched additional operations aimed at keeping the Strait of Hormuz open, a critical route for global energy supplies. In a significant escalation, US forces reportedly targeted an oil tanker in the strategic waterway, heightening concerns over further disruptions to oil markets. Meanwhile, President Donald Trump declined to provide a timeline for potential future actions against Iranian infrastructure, adding to geopolitical uncertainty.
Despite these developments, investors are also weighing softer US inflation data. Consumer inflation eased to 3.5% year-over-year in June from 4.2% in May, coming in below the consensus forecast of 3.8%. The weaker CPI reading initially reduced expectations of an imminent Fed rate increase.
Producer inflation data reinforced the disinflationary trend. The annual PPI rate slowed to 5.5% in June from 6.0% previously, missing expectations of 6.2%, while monthly PPI fell 0.3% after a 0.6% rise in May, outperforming forecasts for a flat reading.
As a result, market expectations for a September Fed rate hike eased, with implied odds declining to roughly 44% from 50% a day earlier. However, analysts note that June inflation figures do not yet reflect the economic consequences of the renewed US-Iran conflict, leaving markets cautious about the potential inflationary effects of the latest military escalation.
The U.S. Dollar Index remains under pressure as cooling inflation signals reduce expectations of additional Fed rate hikes. However, concerns over energy-driven price pressures and rising tensions between the United States and Iran help cushion the Greenback’s downside. Market participants now await upcoming U.S. economic releases for fresh direction amid mixed fundamental signals.
The US Dollar Index (DXY), which measures the Greenback against a basket of major currencies, traded in a narrow range near 100.50 during Thursday’s Asian session, hovering close to the almost four-week low reached the previous day. While declining expectations of further Federal Reserve rate hikes continue to weigh on the dollar, concerns over energy-driven inflation and rising geopolitical tensions between the United States and Iran are helping to limit downside pressure.
Fresh economic data released on Wednesday showed that the US Producer Price Index (PPI) fell 0.3% in June, following a revised 0.6% increase in the previous month. The weaker PPI reading came after Tuesday’s softer-than-expected Consumer Price Index (CPI) report, reinforcing expectations that inflationary pressures are easing. As a result, investors have become less concerned that the Federal Reserve will need to maintain higher interest rates for an extended period, creating a bearish backdrop for the US dollar in the near term.
Geopolitical developments, however, continue to provide some support for the Greenback. Tensions between the United States and Iran have intensified significantly this week, with both countries carrying out additional military operations. On Wednesday, US forces conducted airstrikes targeting Iranian missile and drone facilities, while Tehran responded with retaliatory attacks against US-linked military assets across the region, signaling a worsening conflict.
US President Donald Trump further heightened tensions by warning that key Iranian infrastructure, including power stations and bridges, could become targets if hostilities escalate further. In addition, a US aircraft reportedly engaged an empty oil tanker attempting to breach the naval blockade around Iranian ports. At the same time, Iran has effectively restricted access through the Strait of Hormuz and threatened to disrupt shipping in the Bab el-Mandeb Strait.
These developments raise concerns about global trade flows and energy supplies, helping to keep oil prices elevated and maintaining a geopolitical risk premium in financial markets. Furthermore, market expectations for at least one additional 25-basis-point Federal Reserve rate hike remain intact, discouraging traders from aggressively selling the dollar. Investors are now awaiting upcoming US economic data releases for clearer direction on monetary policy and the next move in the currency markets.
U.S. stocks ended Tuesday in positive territory, with the S&P 500 gaining 0.38%. The advance, however, appeared to stem largely from a sharp drop in implied volatility rather than a meaningful shift in market fundamentals. The one-day VIX slid four points to finish at 10.5 after climbing to nearly 15 on July 13.
The earlier spike in volatility was fueled by investor uncertainty ahead of the latest Consumer Price Index (CPI) data and Kevin Warsh’s testimony before the House. Once those events passed and the one-day VIX retreated rapidly following the opening bell, equities lost momentum and spent most of the session moving sideways. With implied volatility now back near subdued levels, the boost it provided to stocks appears to have largely run its course.
Treasury yields declined after the latest CPI report showed softer-than-expected inflation in both the headline and core readings, easing concerns over immediate price pressures. The move was most pronounced at the short end of the curve, with the 2-year Treasury yield dropping eight basis points to close near 4.20%.
Despite the encouraging inflation data, Fed Chair Kevin Warsh struck a more hawkish tone during his testimony before the House on Tuesday. He emphasized that inflation remains above the Federal Reserve’s target and suggested that additional policy tightening may still be necessary. His remarks raised doubts about whether financial markets have fully accounted for the possibility of further interest rate increases.
Although the 2-year yield retreated to 4.20%, it continues to hold above a key support level after breaking through previous resistance. From a technical standpoint, the yield could still climb toward the 4.35%–4.40% range. If inflation proves more persistent than expected, the Federal Reserve may ultimately need to resume rate hikes to complete its inflation-fighting efforts.
Despite the softer-than-expected CPI data, the Japanese yen showed little sign of gaining meaningful traction. The currency strengthened by only 0.12% on the day, leaving USD/JPY to settle near 162.25.
The broader outlook for the yen remains fragile, with few developments so far convincing investors to reverse their bearish stance. As a result, the prevailing trend continues to favor further weakness in the Japanese currency.
From a technical perspective, USD/JPY has been trading closely along its 10-day and 20-day simple moving averages, indicating that bullish momentum remains intact. A decisive break above the 162.50 level could pave the way for a move toward 166, a price not seen since the mid-1980s.
Nvidia’s nearly 4% gain on Tuesday stood in sharp contrast to signals coming from the credit market. The company’s five-year credit default swap (CDS) spread widened to 60.6 basis points, up from roughly 42 basis points on June 22 and above 60 basis points by July 14. Over the same period, Nvidia’s shares rebounded from a June 26 low near $192 to approximately $211.
Under normal market conditions, rising CDS spreads—which reflect increasing perceived credit risk—tend to coincide with weaker equity performance. The divergence between Nvidia’s strengthening share price and widening CDS spreads suggests a disconnect that may not persist. Either the CDS spread will narrow as credit concerns fade, or the stock could eventually adjust lower to reflect the caution being signaled by the credit market.
One possible explanation is that credit investors are pricing in risks that equity investors have yet to fully acknowledge. If that assessment proves accurate, Nvidia’s recent rally may struggle to sustain its momentum as broader market concerns begin to filter into the stock price.
For the first time in the current market cycle, a silver producer has disclosed concrete figures showing a forced reduction in output, with the decline stemming from China’s mine-safety crackdown rather than changes in silver prices.
Silver is currently trading around $58 an ounce after falling below its early-July low. The metal has dropped about 18% from its year-end 2025 close near $71 and remains roughly 52% below the record high of $121.62 reached on January 29. Even so, silver is still more than 50% higher than it was a year ago. With gold hovering near $4,000 an ounce, the gold-to-silver ratio stands at approximately 69. The recent two-month pullback has largely been driven by macroeconomic forces, including a stronger US dollar and the Federal Reserve’s hawkish stance, while renewed US-Iran tensions have fueled oil prices and inflation concerns, rather than any major shift in silver market fundamentals.
Beneath the recent price weakness, however, the long-term supply outlook remains largely intact. According to Metals Focus and the Silver Institute, the global silver market is expected to record its sixth consecutive annual supply deficit in 2026, with demand projected to exceed production by 46.3 million ounces. A key pillar of the bullish outlook has been the limited ability of silver supply to respond to higher prices. Around three-quarters of global silver production comes as a byproduct of mining for copper, lead, zinc, and gold, making it difficult to significantly increase output simply because silver prices rise. This week provided one of the clearest real-world examples of that constraint, as China’s safety-related mining restrictions forced measurable production cuts despite elevated silver prices.
Silvercorp’s Production Cuts
On June 29, Canadian-listed Silvercorp Metals announced that a tightening mine-safety campaign in China would significantly reduce its production during the July-to-September quarter. Output from its Ying mining district is expected to decline by 40% to 50%, while production at the GC mine is projected to fall by around 50%. Overall, the company estimates a quarterly production decline of 10% to 15%. Based on Silvercorp’s latest annual production of approximately 6.3 million ounces from Ying and 0.5 million ounces from GC, the reductions could remove an estimated 0.9 million to 1.1 million ounces of silver from supply during the affected period.
The significance lies less in the company itself than in the cause of the disruption. The production cuts were not driven by weaker prices or operational decisions but by stricter government safety regulations. Following a fatal coal mine accident in Shanxi Province in late May, Chinese authorities expanded the country’s long-established “Six Major Safety Systems” requirements to cover all underground non-coal mines. The new rules are supported by a nationwide real-time monitoring network overseeing more than one million safety sensors.
For Silvercorp, meeting the updated standards will require roughly $5.5 million in certified safety-system installations over about 50 days, along with an additional $6 million for facility and equipment upgrades. The nearly $11.5 million investment is aimed solely at maintaining regulatory compliance and keeping mines operational, rather than increasing production capacity, effectively raising the cost of every ounce of silver the company continues to produce.
While Silvercorp is only one mining company, the regulations affecting its operations apply to every underground metal mine in China. As a result, the same safety enforcement that forced Silvercorp to scale back production could eventually reduce China’s overall silver output by several million additional ounces, although no confirmed figures beyond Silvercorp’s estimates are available yet. Given China’s position as one of the world’s largest silver producers and an even more significant refining hub, the broader regulatory trend carries greater importance than the impact on any single miner.
What It Means for Silver Investors
The immediate impact should be viewed in perspective. Silvercorp’s estimated production loss of 0.9 million to 1.1 million ounces is relatively modest compared with the roughly 846.6 million ounces of silver mined globally in 2025, representing only slightly more than one-tenth of one percent of annual supply. On its own, the reduction is far too small to meaningfully alter the global supply-demand balance. As such, portraying it as the catalyst for an immediate supply shortage would overstate its significance.
What makes this development significant is not the scale of the production cut but the underlying mechanism. One of the strongest arguments supporting silver’s long-term outlook is that mine supply cannot quickly respond to higher prices. That theory faced a real-world test as silver surged to record highs in early 2026. Instead of increasing, however, production moved in the opposite direction. Supply contracted for reasons unrelated to market prices, as regulatory safety measures forced mines to reduce output. In this case, even substantially higher silver prices could neither prevent the shutdowns nor restore the lost production. If supply continues to tighten under regulatory pressure while remaining largely unresponsive to stronger prices, the industry’s ability to offset the market’s projected sixth consecutive annual deficit becomes even more limited.
The broader significance, therefore, lies in what this episode demonstrates rather than in the number of ounces affected. In Issue #19, I highlighted the growing divergence between a replenished silver inventory in New York and persistently elevated physical premiums in Shanghai, suggesting that Western markets appear well supplied while buyers in Asia continue paying a premium for physical metal. Silvercorp’s production cut adds to that narrative, reinforcing the view that underlying physical tightness may be greater than paper prices imply. While this development does not point to any specific price target, it strengthens the long-term investment case for silver by providing tangible evidence that global mine supply remains structurally constrained and cannot be expanded quickly, even during periods of elevated prices.
The US Dollar Index trades lower against its major counterparts as markets scale back expectations for a more hawkish Federal Reserve.
US inflation softened in June, with both headline and core CPI easing to 3.5% and 2.6% year-over-year, respectively.
Fed Chair Kevin Warsh reiterated that the central bank remains firmly committed to bringing inflation under control, emphasizing zero tolerance for persistently elevated price pressures.
The US Dollar (USD) weakens against its major peers as investors scale back expectations for further Federal Reserve (Fed) rate hikes this year after softer-than-anticipated US inflation data for June. The US Dollar Index (DXY), which tracks the Greenback against a basket of six major currencies, is trading around 100.80, down roughly 0.12% on the day.
Data released by the US Bureau of Labor Statistics (BLS) on Tuesday showed headline Consumer Price Index (CPI) inflation eased to 3.5% year-over-year in June from 4.2% in May, coming in below the market forecast of 3.8%. Meanwhile, core CPI, which strips out food and energy prices, rose 2.6% annually, undershooting both the 2.8% consensus estimate and May’s 2.9% reading.
Following the inflation report, market expectations for another Fed rate increase this month dropped sharply. According to the CME FedWatch Tool, the probability of a rate hike has fallen to 16.6%, down from 41.7% a day earlier.
Despite the softer inflation figures, Fed Chair Kevin Warsh maintained a firm stance on price stability during his congressional testimony on Tuesday, stressing that policymakers have “no tolerance for persistently elevated inflation.” He added that if monetary policy remains on the right path, the inflation surge seen over the past five years will eventually become a thing of the past.
Market participants now await the release of June’s US Producer Price Index (PPI), scheduled for 12:30 GMT, for additional insight into wholesale inflation trends and the Fed’s policy outlook.
Meanwhile, rising tensions between the United States and Iran could continue to support demand for the Greenback, as investors seek the safety of the world’s reserve currency amid growing geopolitical uncertainty.
Gold drifts lower as the market’s initial response to Tuesday’s softer-than-expected US inflation data loses momentum. Persistently high oil prices continue to fuel expectations of at least one additional Federal Reserve rate hike, weighing on the non-yielding metal. Meanwhile, escalating tensions between the US and Iran could boost demand for the safe-haven US Dollar, adding further downside pressure to XAU/USD.
Gold (XAU/USD) comes under renewed selling pressure after failing to sustain gains above the $4,100 level in the previous session, though it continues to hold above the key $4,000 psychological support during Wednesday’s Asian trading hours. While softer-than-expected US Consumer Price Index (CPI) data initially weighed on the US Dollar (USD), persistent concerns over energy-driven inflation continue to dominate sentiment. Escalating tensions between the US and Iran, along with the closure of the Strait of Hormuz, have kept crude oil prices elevated, reinforcing inflation fears. Meanwhile, Federal Reserve (Fed) Chair Kevin Warsh reaffirmed the central bank’s commitment to restoring price stability during his first congressional testimony, signaling that another rate hike remains possible before year-end. The hawkish tone largely offsets the impact of a weaker USD and limits demand for the non-yielding precious metal.
Data released by the US Bureau of Labor Statistics showed headline CPI fell by 0.4% in June, marking the steepest monthly decline since April 2020 and falling short of expectations for a 0.1% decrease. Core CPI, which excludes food and energy prices, was unchanged during the month, well below the expected 0.3% increase. On an annual basis, headline inflation eased to 3.5%, while core inflation slowed to 2.6%, both undershooting market forecasts. The softer inflation figures briefly dragged the USD to its weakest level in nearly four weeks as traders pared back expectations for additional Fed tightening. However, the Greenback quickly recovered after Warsh emphasized that the Fed remains firmly committed to combating inflation and highlighted the resilience of the US economy.
At the same time, crude oil prices have climbed to their highest level in nearly a month, increasing concerns that higher energy costs could reignite inflationary pressures and justify further monetary tightening. Reflecting this outlook, the CME FedWatch Tool indicates that markets continue to price in the possibility of one additional Fed rate hike, potentially in September or December. Geopolitical tensions also continue to underpin the USD’s safe-haven appeal. The US carried out another wave of airstrikes on Iranian targets, while Tehran responded by attacking US military facilities across Gulf nations. In addition, President Donald Trump warned that Washington could target Iranian bridges and power infrastructure if Tehran refuses to resume nuclear negotiations.
Overall, the prevailing fundamental backdrop remains supportive of the US Dollar and suggests that downside risks for Gold persist. Investors now await the release of the US Producer Price Index (PPI) and the second day of Fed Chair Kevin Warsh’s congressional testimony for fresh clues on the interest rate outlook. Meanwhile, any new developments in the Middle East conflict are likely to remain a key driver of market sentiment and could trigger heightened volatility across financial markets, particularly in Gold.
Technical Analysis
From a technical perspective, Gold continues to trade within a descending parallel channel and remains firmly below the 200-day Simple Moving Average (SMA), indicating that the broader trend remains tilted to the downside despite the recent recovery. The Moving Average Convergence Divergence (MACD) has crossed into positive territory and continues to improve, signaling a modest pickup in bullish momentum, while the Relative Strength Index (RSI) hovers near the neutral 40.80 mark, suggesting limited buying conviction.
The upper boundary of the descending channel, located around $4,140.69, represents the first significant resistance level. A sustained break above this barrier would be required to weaken the prevailing bearish outlook and open the door for additional gains. On the downside, immediate support is seen near the channel’s lower boundary at $3,718.03. A decisive rebound from this level would be needed to indicate that bearish momentum is fading and that sellers are beginning to lose control of the short-term trend.
Bitcoin approaches its 50-day Exponential Moving Average (EMA) at $65,142, with a decisive close above the level signaling potential for further upside.
Ethereum finishes above the $1,800 resistance mark, reinforcing expectations for a sustained recovery.
XRP trades around $1.15 after rebounding by more than 4% in the previous session, indicating improving bullish momentum.
Bitcoin, Ethereum, and XRP edge higher as recovery momentum builds
Bitcoin (BTC), Ethereum (ETH), and Ripple (XRP) trade with modest gains on Wednesday as risk appetite returns to the cryptocurrency market. BTC is approaching its 50-day Exponential Moving Average (EMA), ETH has reclaimed the $1,800 resistance level, and XRP is holding firmly above an important support zone. If these technical levels remain intact, the three leading cryptocurrencies could extend their recovery in the sessions ahead.
Bitcoin eyes further upside if it breaks above the 50-day EMA
Bitcoin is trading around $64,510 on Wednesday after rallying more than 4% and closing above the $64,000 resistance level in the previous session. Although the rebound has improved short-term sentiment, BTC continues to trade below its 50-day, 100-day, and 200-day EMAs, located at $65,142, $68,524, and $74,562, respectively. Remaining beneath these key moving averages indicates that the broader trend still favors the downside, despite signs of stabilizing momentum. The Relative Strength Index (RSI) has climbed to 54, reflecting modest bullish momentum, while the Moving Average Convergence Divergence (MACD) remains in positive territory, suggesting selling pressure may continue to ease even if a stronger bullish reversal has yet to emerge.
On the downside, $64,004 serves as the first support level, where buyers could step in to protect the recent recovery.
To the upside, Bitcoin faces immediate resistance at its 50-day EMA near $65,142, followed by the 100-day EMA at $68,524 and the 200-day EMA around $74,562. A sustained move above these key dynamic resistance levels would improve the medium-term outlook and weaken the prevailing bearish trend. Beyond them, the next major obstacle lies at the previous horizontal resistance near $84,410.
Ethereum holds above key resistance at $1,800
Ethereum (ETH) trades around $1,866 on Wednesday after closing above its 50-day Exponential Moving Average (EMA) at $1,805 in the previous session, reinforcing the near-term bullish outlook. However, the second-largest cryptocurrency remains below its 100-day EMA at $1,945 and 200-day EMA at $2,193, indicating that the broader trend has yet to turn decisively positive.
The 50-day EMA is now acting as immediate support, suggesting buyers are defending the recent breakout. Meanwhile, the Relative Strength Index (RSI) hovers near 61, reflecting healthy bullish momentum without entering overbought territory. The Moving Average Convergence Divergence (MACD) also remains constructive, with the MACD line above its signal line and a positive histogram, pointing to strengthening upside momentum despite the presence of key overhead resistance.
On the upside, Ethereum’s next resistance is located at the 100-day EMA near $1,945, followed by the psychologically important $2,000 level. Beyond that, the 200-day EMA around $2,193 represents a major hurdle that bulls must overcome to confirm a broader trend reversal.
On the downside, initial support is seen at the 50-day EMA around $1,805, while a stronger long-term support level lies near $1,385, where buyers could re-emerge if the current recovery loses momentum.
XRP rebounds from channel support but faces strong overhead resistance
XRP trades around $1.099 on Wednesday after bouncing 4% in the previous session from support at the upper boundary of its descending channel. While the rebound has improved short-term sentiment, the token remains below its key moving averages, keeping the broader outlook tilted to the downside.
XRP continues to trade beneath the 50-day Exponential Moving Average (EMA) at $1.157, the 100-day EMA at $1.254, and the 200-day EMA at $1.461. Remaining below these major trend indicators suggests that bearish pressure is still in control despite the recent recovery.
Momentum indicators paint a mixed picture. The Relative Strength Index (RSI) stands at 47, just below the neutral 50 level, indicating that bullish momentum is beginning to improve but has yet to gain conviction. Meanwhile, the Moving Average Convergence Divergence (MACD) remains slightly positive, signaling stabilizing momentum without confirming a sustained bullish reversal.
On the downside, immediate support is located near $1.040, where the lower boundary of the descending parallel channel may attract renewed buying interest and help preserve the recent recovery.
To the upside, XRP faces its first resistance at the 50-day EMA around $1.157, followed by the 100-day EMA near $1.254 and the $1.300 horizontal resistance level. Beyond these, the 200-day EMA at $1.461 and the longer-term resistance around $1.900 represent significant barriers. Until XRP reclaims the 50-day EMA, any near-term gains are likely to be viewed as corrective moves within the prevailing bearish trend.
GBP/USD gathers strength to near 1.3360 in Tuesday’s Asian session.
Renewed US strikes on Iran and fears over Strait of Hormuz shipping might cap the upside for the pair.
BoE’s Pill said interest rates are likely to rise to keep inflation in check.
The GBP/USD pair remains on the front foot, trading near 1.3360 during Tuesday’s Asian session. Even so, gains in the pair may be restrained as investors monitor mounting geopolitical tensions between the United States and Iran. Market participants are also turning their attention to the release of the US June Consumer Price Index (CPI) later in the day.
According to Reuters, US President Donald Trump announced on Monday that Washington had reinstated a naval blockade on Iran and would keep the Strait of Hormuz open through a fee-based arrangement following renewed missile and drone exchanges. The US military also confirmed fresh strikes against Iranian military facilities, noting that more than 50,000 US troops are currently stationed across the Middle East.
On Tuesday, Iran’s Islamic Revolutionary Guards Corps (IRGC) warned that any cooperation with what it described as the “aggressor enemy” in the Strait of Hormuz would postpone the waterway’s reopening and could trigger a global energy crisis. Heightened fears of a broader US-Iran conflict may continue to support demand for the safe-haven US Dollar (USD), limiting further upside in GBP/USD.
Meanwhile, expectations have grown that the Bank of England (BoE) may need to raise interest rates later this year to contain persistent inflation. BoE Chief Economist Huw Pill stated that tighter monetary policy is likely to be required to prevent inflationary pressures from becoming deeply embedded.
Silver prices declined as escalating tensions in the Middle East drove oil prices higher, fueling inflation concerns and reinforcing expectations that the Federal Reserve will keep interest rates elevated for longer.
According to the CME FedWatch Tool, markets now assign a 51% probability to a Fed rate hike in September, compared with a 23% chance that policymakers leave rates unchanged.
Meanwhile, U.S. President Donald Trump reinstated a blockade targeting Iranian vessels and introduced a 20% transit fee on non-Iranian ships using the Strait of Hormuz under U.S. protection.
Silver prices (XAG/USD) extended their decline for a third straight session, trading near $57.60 per troy ounce during Tuesday’s Asian session. The non-yielding precious metal remained under pressure as intensifying tensions in the Middle East pushed crude oil prices higher, raising concerns that stronger energy-driven inflation could keep the Federal Reserve on a restrictive policy path for longer.
Rate expectations have turned increasingly hawkish. According to the CME FedWatch Tool, traders now see a 51% chance of a Fed rate increase in September, while the probability of policymakers leaving rates unchanged has dropped to 23%.
Geopolitical risks escalated after US President Donald Trump reinstated a naval blockade targeting Iranian vessels and ships linked to Iran passing through the Strait of Hormuz. He also announced a 20% transit fee on all other commercial cargo vessels using the strategic shipping route.
Investors are now focused on two key US events scheduled for Tuesday. The June Consumer Price Index (CPI) report is expected to show headline inflation falling 0.1% month-over-month, while core CPI is forecast to remain firm with a 0.3% monthly increase, highlighting persistent underlying price pressures.
Attention will also turn to Federal Reserve Chair Kevin Warsh, who is set to testify before Congress. Market participants will closely scrutinize his remarks for clues on whether Fed officials share the market’s increasingly hawkish outlook and are prepared to keep monetary policy tighter for longer.
Gold prices fell to around $3,995 during Tuesday’s early Asian trading session.
The decline followed President Trump’s decision to reinstate the Iran port blockade and his pledge to impose a 20% levy on cargo transiting the Strait of Hormuz.
Investors are now awaiting the release of the US June Consumer Price Index (CPI), which is expected to be the key market catalyst later on Tuesday.
Gold prices (XAU/USD) continued to trade under pressure, hovering around $3,995 during Tuesday’s early Asian session. The precious metal remained on the defensive as escalating tensions between the United States and Iran reinforced concerns over persistent inflation. Investors are now focused on the release of the US June Consumer Price Index (CPI) and testimony from Federal Reserve Chair Kevin Warsh, both scheduled for later on Tuesday.
According to Bloomberg, US President Donald Trump reinstated the blockade on Iranian vessels passing through the Strait of Hormuz and announced a 20% fee on all other cargo transiting the strategic waterway. Trump also pledged to intensify military action against Iran, stating that the US would continue launching heavy strikes over the coming days.
The renewed blockade raises the risk of retaliation from Tehran, potentially increasing attacks on commercial shipping in the Strait of Hormuz. Such disruptions could fuel higher energy prices, adding to inflationary pressures and reinforcing expectations that the Federal Reserve will keep interest rates elevated for longer. Although gold typically benefits from heightened geopolitical uncertainty, its appeal is often limited in a high-interest-rate environment because it does not generate yield.
Market participants are also awaiting the latest US inflation figures for further policy clues. Economists expect the headline CPI to decline 0.1% month-over-month in June, while core CPI is forecast to increase 0.3% over the same period. If inflation comes in below expectations, the US Dollar could weaken, providing short-term support for dollar-denominated gold prices.
In our previous report, we outlined the $5.5 trillion AI capex supercycle and highlighted three critical bottlenecks that could ultimately determine how much value the ecosystem captures.
The capital is already flowing. The key question now is which supply constraint becomes the limiting factor first. As the industry shifts from training large models to deploying autonomous AI agents, all three bottlenecks are being fundamentally reshaped.
Memory is emerging as the first major pressure point, and Micron’s latest earnings delivered a clear signal of just how rapidly demand is accelerating.
This Week’s TechEdge
CPUs: the most overlooked growth inflection
Memory: the new battleground and what Micron’s results reveal
Networking: our highest-conviction opportunity
The Bottom Line: key implications for investors
The traditional hardware equation is changing. AI training was primarily a GPU-driven story, with large clusters of GPUs supported by relatively few CPUs.
Agentic AI introduces a different dynamic. Like human workers, AI agents require dedicated compute resources, their own memory footprint, and continuous communication with other systems. This reverses the hardware ratios that defined the training era and channels significantly greater demand toward infrastructure categories that were previously secondary considerations.
We believe the agentic AI era could generate roughly three times the hardware spending of the training era over the next two to three years.
CPUs: The Most Overlooked Inflection Point
As AI agents become more prevalent, infrastructure requirements move closer to a one-to-one CPU-to-GPU ratio, since each agent requires orchestration, task management, and system coordination.
We project the CPU market could expand from approximately $35–40 billion today to more than $200 billion by 2030. That outlook exceeds AMD’s estimate of roughly $120 billion and is well above the current Wall Street consensus of around $170 billion.
To put the scale into perspective, Cloudflare estimates that supporting 100 million knowledge workers in the United States would require roughly 10 million CPUs, with global demand potentially approaching one billion CPUs. AMD, Arm, and Intel have all pointed to this emerging trend, and 2025 appears to mark the beginning of the transition. While related stocks have already responded, we believe current valuations reflect only the early stages of a much larger growth cycle.
Memory: The Battleground — What Micron’s Results Revealed
This quarter, the memory story moved beyond theory and into reality.
Micron delivered strong results across every major segment, with the upside driven primarily by pricing rather than volume growth. The most striking figure was adjusted gross margin, which surged to nearly 80%—an extraordinary level for a business that has historically generated margins of 30–50% during favorable cycles and often slipped into negative cash flow during downturns.
Memory pricing has climbed roughly sevenfold from the cycle trough, creating a powerful earnings tailwind for Micron. Those higher prices are flowing directly into the company’s profits while simultaneously increasing infrastructure costs for hyperscalers and AI leaders such as NVIDIA, Alphabet, and Microsoft.
The takeaway is clear: memory is no longer just a supporting component in the AI stack. It is becoming one of the most critical constraints in the industry, with pricing power increasingly concentrated among the companies capable of supplying it.
The forces driving this trend are structural rather than cyclical.
Agentic AI is creating a second, distinct source of memory demand alongside high-bandwidth memory (HBM). While AI training workloads require HBM, autonomous agents also rely heavily on conventional DRAM and NAND—the same memory technologies found in everyday PCs and enterprise systems.
At the same time, manufacturing capacity is becoming increasingly constrained. Producing HBM consumes significantly more resources, with each HBM wafer requiring the equivalent of three to four conventional DRAM wafers. As memory manufacturers shift capacity toward HBM production, the supply available for traditional memory products tightens just as demand for those products is accelerating.
The result is a convergence of two demand streams that historically moved independently, now competing for the same limited supply base. According to Micron’s management, there is still no clear timeline for when supply—particularly in HBM—will fully catch up with demand. We believe these constraints could persist through 2028, extending the favorable pricing environment for memory suppliers and reinforcing memory’s position as one of the most critical bottlenecks in the AI infrastructure stack.
Perhaps the most significant development is not technological, but contractual.
Micron announced 16 strategic customer agreements with fixed-price structures, each spanning roughly three years and representing a combined minimum value of approximately $100 billion through 2030.
Historically, memory has been sold largely on the spot market, a key reason the sector has long traded at a valuation discount due to its cyclical nature. The emergence of multi-year, fixed-price agreements has the potential to reduce earnings volatility, soften future downturns, and support the case for a structural re-rating of memory companies.
That said, we are not prepared to fully underwrite that thesis yet. The real test will come when these businesses generate strong cash flows through an entire down cycle—something that remains unproven. These agreements also carry execution risk. If AI infrastructure investment slows, customers could scale back commitments, while increasing competition from Chinese memory producers remains a meaningful long-term consideration.
For that reason, we continue to favor the picks-and-shovels approach. Companies such as KLA, Lam Research, and Applied Materials supply the critical tools required to expand manufacturing capacity, allowing them to benefit from industry growth without taking direct exposure to memory price cycles.
One emerging catalyst deserves close attention. Micron has highlighted humanoid robotics as a potential second wave of demand growth. These systems could require roughly ten times the memory capacity of today’s AI deployments, creating an additional demand engine that may extend the current cycle well into the next decade.
Networking: Our Highest-Conviction Opportunity
As AI agents become more prevalent, the volume of machine-to-machine communication is set to increase dramatically. Every interaction, task delegation, and data exchange generates network traffic that must be moved efficiently across increasingly complex infrastructure.
The debate is often framed as a choice between copper and optical connectivity, but we believe that view is overly simplistic. Both technologies will play important roles at different performance, distance, and cost thresholds. Rather than betting on a single transmission medium, we prefer technology-agnostic infrastructure providers such as Astera Labs and Credo Technology Group, whose products enable faster and more efficient data movement regardless of the underlying architecture.
Signs of strain are already emerging across the ecosystem. Lead times for certain optical networking products have reportedly extended to as much as 12 months, while fiber pricing has risen approximately 50% since the start of the year. These pressures reflect a market struggling to keep pace with accelerating AI infrastructure demand.
Industry forecasts suggest the optical networking market could ultimately exceed $150 billion in value—roughly nine times its current size. While networking has already outperformed both memory suppliers and hyperscale cloud providers during this cycle, we continue to see the greatest potential for upward earnings revisions in this segment, alongside semiconductor capital-equipment companies.
As AI workloads evolve from model training to large-scale deployment of autonomous agents, networking is increasingly becoming a mission-critical layer of the infrastructure stack. In our view, this remains one of the most compelling opportunities across the AI value chain.
The Bottom Line: What This Means for Investors
The AI opportunity is no longer defined by who has the most capital to deploy—it is increasingly determined by who controls the most constrained resources.
CPUs are entering a major growth inflection and, in our view, remain underappreciated by the market. As AI agents proliferate, demand for orchestration, coordination, and general-purpose compute is set to rise sharply, creating a powerful tailwind for the CPU ecosystem.
Memory has moved from a future thesis to a present reality. Pricing power is already reshaping industry economics, and the market has begun to reflect that shift. However, much of the near-term optimism is now embedded in valuations. Whether memory suppliers deserve a sustained re-rating will ultimately depend on their ability to generate durable cash flows through the next downturn. Until that is proven, we prefer exposure through semiconductor equipment providers rather than the memory manufacturers themselves.
Networking remains our highest-conviction investment theme. As AI systems become increasingly agent-driven, the volume of data moving between machines will grow exponentially, making connectivity infrastructure one of the most critical—and scarce—components of the AI stack. We continue to see the strongest potential for earnings upside in this segment.
The broader takeaway is straightforward: in the agentic era, value accrues to the owners of scarcity. For years, GPUs were the primary bottleneck. Today, the constraints are shifting toward compute orchestration, memory capacity, and network infrastructure. Investors who identify these emerging choke points early will be best positioned to capture the next phase of AI-driven growth.
Bitcoin staged a modest recovery into Friday, trading near the $64,000 mark while continuing to find support around its 200-week Simple Moving Average (SMA).
Spot Bitcoin ETF flows have remained mixed throughout the week, reflecting a cautious market sentiment as investors assess the impact of Strategy’s latest Bitcoin sale.
Although geopolitical tensions have eased slightly, lingering uncertainty continues to weigh on risk appetite, limiting the cryptocurrency’s potential for stronger gains.
Bitcoin Weekly Outlook: Resilient Above $64,000 Despite Strategy Sale and Geopolitical Headwinds
Bitcoin (BTC) climbed back above $64,000 on Friday, extending a modest recovery while maintaining support above a key technical zone throughout the week. Mixed spot Bitcoin ETF flows through Thursday reflected cautious institutional sentiment, while the market largely absorbed the impact of Strategy’s recent BTC sale, underscoring Bitcoin’s strong liquidity and resilience. Although easing tensions between the US and Iran helped improve risk appetite late in the week, ongoing uncertainty in the Middle East continued to limit the cryptocurrency’s upside potential.
Geopolitical Uncertainty Continues to Influence Market Sentiment
Investor sentiment remained fragile throughout the week as developments in the Middle East shaped broader risk appetite. Concerns initially rose after Iran announced plans to impose new service charges on vessels transiting a strategically important shipping route, arguing that the fees were intended to cover security, monitoring, and environmental protection costs rather than serve as transit tolls.
Market anxiety intensified after an oil tanker was struck while moving through the Strait of Hormuz, prompting a fresh round of US military strikes against Iranian targets. Iran responded with attacks on US military assets in Bahrain and Kuwait, while comments from US President Donald Trump suggesting that a ceasefire agreement with Iran had effectively ended added to uncertainty across financial markets.
Sentiment improved later in the week after Trump indicated that Iran had reached out seeking negotiations, raising hopes for a potential easing of tensions. The improvement helped Bitcoin erase earlier losses and advance toward the $64,000 level by Friday. Nevertheless, the geopolitical backdrop remains fragile, and any renewed escalation between the US and Iran could trigger fresh selling pressure across risk-sensitive assets, including cryptocurrencies.
Strategy’s Bitcoin Sale Highlights Market Depth
On Monday, Strategy disclosed the sale of 3,588 BTC worth approximately $216 million to fund dividend payments related to its Digital Credit program. While the announcement initially contributed to a roughly 4% decline in Bitcoin, the cryptocurrency quickly recovered and ended the session with modest gains, suggesting the market absorbed the selling pressure effectively.
According to Crypto Finance, transactions of this scale are typically conducted through over-the-counter (OTC) channels and are often hedged well before becoming public knowledge. As a result, much of the market impact is generally priced in before official disclosure.
The report also emphasized that Bitcoin’s growing liquidity enables it to handle large transactions without causing prolonged price disruptions, helping explain the brief nature of the selloff.
Dean Chen, an analyst at Bitunix Exchange, noted that Strategy’s sale demonstrated the maturity of the Bitcoin treasury model rather than undermining it. In his view, selling a small portion of holdings showed that Bitcoin can increasingly function as a liquid corporate treasury asset.
Outlook Remains Cautiously Bearish
Despite Bitcoin’s resilience, Chen remains cautiously bearish in the near term. He points to elevated US Treasury yields, stronger return opportunities in equities, continued investor interest in AI-related ventures and IPOs, and still-modest institutional inflows despite some improvement in spot Bitcoin ETF demand.
Looking ahead, Chen believes Bitcoin’s direction will depend more on whether global investors increase allocations to risk assets than on Strategy’s transaction itself. He expects BTC to remain range-bound with a slight downside bias as competition for global liquidity remains intense and new capital inflows remain limited.
For the near term, Chen identifies $68,500 as a key resistance level and $62,000 as major support. Unless macroeconomic conditions improve meaningfully, he expects Bitcoin to end the month slightly below current levels.
Institutional Investors Remain Undecided
Institutional interest showed tentative signs of recovery early this week after several consecutive weeks of net outflows. However, momentum faded later in the week as spot Bitcoin ETFs recorded two sessions of withdrawals. According to SoSoValue data, net inflows still stood at $106.96 million through Thursday, reflecting a modest improvement in overall demand.
If Friday’s ETF flows finish in positive territory, Bitcoin could end an eight-week streak of persistent outflows, potentially signaling a shift in institutional sentiment. While the data suggests investors are becoming more willing to re-enter the market, the mixed flow pattern highlights ongoing caution. Nevertheless, a sustained return of institutional capital could provide additional support for Bitcoin prices in the weeks ahead.
Total Bitcoin spot ETF net inflow daily chart. Source: SoSoValue
Total Bitcoin spot ETF net inflow weekly chart. Source: SoSoValue
Cautious Fed Outlook Keeps Bitcoin Range-Bound
On the macroeconomic front, attention centered on the release of the minutes from the Federal Open Market Committee (FOMC) meeting held on June 16–17. The report showed that Federal Reserve policymakers remain divided on the future path of interest rates, with concerns about inflation persisting even as worries surrounding the labor market have eased somewhat.
Following the release of the minutes, market expectations shifted slightly, with CME FedWatch data indicating that traders are pricing in approximately a 21.9% probability of a rate hike at the Fed’s July meeting. The prospect of interest rates remaining elevated for longer has encouraged a cautious stance among investors.
As a result, demand for risk-sensitive assets has remained subdued, with many market participants opting to stay on the sidelines until there is greater clarity on the Fed’s policy direction. This cautious macroeconomic backdrop has contributed to Bitcoin’s largely sideways price action throughout the week.
Technical Outlook: Premature to Confirm a Market Bottom
Bitcoin continued its gradual recovery on Friday, reclaiming the $64,000 level after posting a 6.84% gain the previous week. The cryptocurrency is currently finding support near its 200-week Simple Moving Average (SMA) at $62,874, having successfully rebounded from a long-term ascending trendline that has connected major lows since January 2023.
Should the 200-week SMA continue to hold as a support level, Bitcoin could build on its recent strength and target the 78.6% Fibonacci retracement level at $65,520, measured from the August 2024 low of $49,000 to the October 2025 all-time high of $126,199.
Technical indicators on the weekly chart point to improving, though still fragile, momentum. The Relative Strength Index (RSI) remains subdued near 39 but is stabilizing, while the Moving Average Convergence Divergence (MACD) remains slightly negative yet continues to recover, indicating that bearish momentum is gradually fading.
Despite these encouraging signs, it remains too early to declare that Bitcoin has established a definitive bottom. A decisive break below the 200-week SMA at $62,874 would weaken the bullish recovery scenario and could open the door for a deeper pullback toward the long-term ascending trendline support near $58,000.
On the daily timeframe, Bitcoin continues to trade with a cautious bias, remaining below its 50-day, 100-day, and 200-day Exponential Moving Averages (EMAs). These key moving averages remain well above current prices and continue to reinforce the broader medium-term downtrend.
BTC is currently hovering just above an important horizontal support area near $64,004. While momentum indicators have improved, they have yet to signal a decisive bullish breakout. The Relative Strength Index (RSI) is holding around 53, indicating modest buying strength, while the MACD remains above the zero line, reflecting recovering bullish momentum.
On the upside, the first significant obstacle lies at the 50-day EMA around $65,413. Additional resistance levels are located near the 100-day EMA at $69,000 and the 200-day EMA at $75,029. Beyond these levels, a major horizontal resistance zone around $84,410 could further limit advances.
On the downside, immediate support remains at $64,004. A sustained move below this level would increase bearish pressure and could pave the way for a decline toward the $60,000 psychological support zone, which may attract renewed buying interest.
Gold extends its losses, falling more than 1% toward the $4,050 level during Monday’s Asian session as escalating tensions between the United States and Iran boost demand for the safe-haven US Dollar. At the same time, concerns that higher Crude Oil prices could fuel inflation are reinforcing expectations of a Federal Reserve rate hike in 2026, strengthening the Greenback further and adding pressure on the non-yielding precious metal.
Fundamental Analysis
Gold remains under heavy selling pressure at the beginning of the week as the US Dollar strengthens, supported by a sharp rebound in Oil prices and renewed inflation concerns that reinforce expectations of a hawkish stance from the Federal Reserve.
The move follows a fresh escalation of tensions in the Middle East after the United States launched additional strikes against Iran on Sunday. In response, Iran reportedly targeted US facilities across Gulf states and reiterated the closure of the strategically important Strait of Hormuz.
Rising inflation worries have also contributed to Gold’s weakness after the Fed highlighted increasing price pressures in its semi-annual Monetary Policy Report released on Friday. The central bank noted that inflation accelerated further this spring, driven by the combined effects of tariffs, higher energy costs linked to the conflict, and continued investment in artificial intelligence infrastructure.
Market participants remain cautious ahead of Tuesday’s release of the US Consumer Price Index (CPI) report and Federal Reserve Chair Kevin Warsh’s first semi-annual testimony before Congress.
For now, traders are expected to keep a close eye on developments surrounding the US-Iran conflict and fluctuations in Oil prices for fresh market direction. From a technical perspective, the bearish outlook for Gold remains intact, with downside risks continuing to dominate the near-term picture.
Technical Analysis
On the daily timeframe, Gold (XAU/USD) is trading near $4,069, maintaining a bearish short-term bias as it remains below both the 21-day SMA at $4,128 and the 50-day SMA at $4,344. The longer-term technical outlook also continues to favor sellers, with the 200-day SMA at $4,495 and the 100-day SMA at $4,583 positioned well above current market levels. Meanwhile, the RSI near 41 suggests bearish momentum is still present, although selling pressure appears to be moderating rather than reaching oversold territory.
On the upside, the first resistance zone is located around the 21-day SMA at $4,128. A sustained move higher could then target the 50-day SMA near $4,344, followed by the 200-day SMA around $4,495 and the 100-day SMA near $4,583. With no significant moving-average support levels immediately beneath the current price, any rebound attempt remains fragile while Gold continues to trade below this cluster of resistance levels. Unless buyers can regain control above the 21-day SMA, the broader risk profile remains tilted toward further downside pressure.
The US Dollar Index (DXY) moved higher as investors sought the safety of the US dollar amid escalating geopolitical tensions in the Middle East. Tehran has rejected further negotiations, insisting that Washington first fulfill earlier commitments regarding transit security and Iranian oil exports. Meanwhile, market participants continue to anticipate one final interest-rate hike from the Federal Reserve before the end of the year, providing additional support for the greenback.
The US Dollar Index (DXY), which tracks the US Dollar against a basket of six major currencies, extended its gains for a second consecutive session, hovering around 101.10 during Monday’s Asian trading hours.
The Greenback continued to attract safe-haven flows as geopolitical tensions in the Middle East intensified. According to Bloomberg, the US Central Command (CENTCOM) carried out additional strikes on Sunday aimed at reducing Iran’s ability to threaten civilian vessels transiting the strategic waterway.
Reuters reported that US forces have struck more than 300 Iranian targets over the past three days, including approximately 140 targets on Saturday alone, while Washington and Tehran offered conflicting assessments regarding the status of maritime traffic through the strait. The latest escalation has further diminished prospects for diplomatic progress, with Tehran insisting that the US must first honor previous commitments related to shipping security and the normalization of Iranian oil exports before negotiations can move forward.
The US Dollar also found support from rising concerns that the intensifying US-Iran conflict could drive energy prices higher, fueling inflationary pressures and potentially keeping Federal Reserve policy restrictive for longer. Investors are now focused on Tuesday’s release of the US Consumer Price Index (CPI) report for fresh signals on the Fed’s policy path. Economists expect headline CPI to decline by 0.1% month-over-month in June, while core CPI is forecast to increase by 0.3%.
Market participants continue to price in one additional Federal Reserve rate hike before year-end. Attention will also turn to Fed Chair Kevin Warsh, who is scheduled to make his first official appearance before Congress on Tuesday, with traders looking for further guidance on the outlook for monetary policy.
Gold tumbles toward $4,070 during Monday’s Asian session after fresh US missile strikes on Iran, while investors await Tuesday’s US CPI data.
Gold (XAU/USD) came under renewed selling pressure during Monday’s early Asian session, slipping toward the $4,070 level as escalating tensions between the United States and Iran weighed on market sentiment. Investors are now turning their attention to Tuesday’s release of the US June Consumer Price Index (CPI), which could provide fresh direction for both the US dollar and precious metals.
According to reports, the US military carried out additional strikes against Iran on Sunday, targeting capabilities believed to be linked to attacks on civilian vessels passing through the Strait of Hormuz. The US Central Command (CENTCOM) stated that the operation was intended to reduce Iran’s ability to threaten commercial shipping in the strategically important waterway.
The ongoing exchange of missile strikes between Washington and Tehran has fueled concerns over higher energy prices and a potential resurgence in inflationary pressures. As a result, expectations have strengthened that the Federal Reserve may keep interest rates elevated for longer. While gold is traditionally viewed as a safe-haven asset during periods of geopolitical uncertainty, its appeal can diminish when interest rates remain high because the metal does not generate yield.
Market participants are also closely monitoring the upcoming US CPI report. Economists expect headline inflation to fall by 0.1% month-over-month in June, while core CPI is forecast to increase by 0.3%. A weaker-than-expected inflation reading could undermine the US dollar and provide support for gold prices in the short term.
Natural gas came under strong selling pressure during the week, with prices breaking below the key $3.00 level on Friday. While this move points to continued bearish momentum in the near term, the scope for further declines may be relatively limited.
Seasonal patterns typically keep the natural gas market confined within a broad trading range during this period of the year. Although the overall bias tends to remain slightly negative, any upward moves should still be approached cautiously due to soft demand conditions. Unless unusually high temperatures trigger a surge in electricity consumption, demand for natural gas is unlikely to strengthen significantly.
As the primary heating season remains several months away in the United States, the market lacks a major catalyst for sustained gains. Consequently, natural gas prices are likely to remain range-bound for the time being, with traders awaiting stronger seasonal demand later in the year.
WTI Crude Oil
WTI crude oil posted a modest gain over the week, although much of the earlier strength was driven by market reactions to U.S. strikes on Iran. Since then, a large portion of those gains has been erased, indicating that the market remains uncertain about its next directional move.
At present, crude oil appears to be settling into a typical summer trading range as traders assess geopolitical developments alongside broader supply and demand dynamics. The $68 level may emerge as an important support zone, potentially providing a floor for prices if selling pressure persists.
For now, the market seems more likely to consolidate than trend decisively in either direction. A period of sideways trading over the next week or two could help establish a clearer range before the next significant move develops.
Gold
Gold prices spent much of the week under pressure, but the key development was the market’s successful defense of the $4,000 level. The strong rebound from this area reinforces its importance as a major support zone and suggests that buyers remain active on dips.
While the recovery is encouraging for bullish sentiment, it remains uncertain whether the upward momentum can be sustained in the near term. Traders will likely continue to monitor broader macroeconomic factors, particularly movements in the U.S. dollar, for clues about gold’s next direction.
A weaker dollar could provide additional support for the precious metal by improving its appeal to international investors. Conversely, renewed strength in the greenback may limit further gains and keep gold trading within its recent range.
EUR/USD
The euro ended the week lower but managed to hold above the important 1.1400 support area, suggesting that buyers are still defending this level despite recent weakness. While the overall tone remains somewhat bearish, the next few trading sessions should provide greater clarity regarding the pair’s near-term direction.
Market participants will be closely watching price action around current levels to determine whether support can continue to hold. A sustained move below 1.1400 would likely reinforce downside pressure and shift attention toward lower technical targets.
Should the pair break decisively beneath support, the 1.1200 region could become the next key area of interest. This level aligns with the projected target from a bearish flag formation on the daily chart and is further supported by the presence of the 200-week Exponential Moving Average, making it a potentially significant zone for buyers to re-enter the market.
USD/CAD
The U.S. dollar traded in a relatively choppy manner against the Canadian dollar throughout the week, reflecting ongoing uncertainty surrounding Canada’s economic outlook and broader market sentiment. Price action remains confined within a historically significant area that previously served as the starting point of a major breakdown in early 2025, which helps explain the market’s current lack of directional conviction.
Given the technical backdrop, a near-term pullback would not be surprising. Even if prices retreat, demand could emerge on dips, particularly as the pair approaches lower support levels where buyers have previously shown interest.
The 1.4000 region remains a key support zone and may continue to act as a solid floor due to the substantial amount of historical trading activity associated with it. On the upside, a move toward 1.4500 remains possible, although the market will likely require a stronger fundamental or macroeconomic catalyst before such a rally can gain momentum.
USD/MXN
USD/MXN spent much of the week moving sideways, with the pair continuing to hover around the 17.50 level. This area is particularly noteworthy from a technical perspective, as it previously acted as a significant resistance zone and may now play an important role in determining the market’s next directional move.
Traders will be watching closely to see whether the pair can establish momentum above current levels. A breakout beyond this week’s high could open the door for a move toward the 18.00 mark, which represents the next major psychological resistance level.
Despite this potential upside scenario, the broader fundamental backdrop continues to favor the Mexican peso due to the interest rate differential between the two countries. As a result, the longer-term bias may still lean toward USD/MXN weakness. However, clearer bearish price signals would likely be needed before a convincing short-selling opportunity emerges.
Silver
Silver experienced a sharp decline during the week, briefly falling below the critical $60 level before recovering and attracting renewed buying interest. Despite the rebound, the metal remains in a vulnerable position, with the $60 area continuing to serve as a key battleground between buyers and sellers.
While silver has managed to stabilize for the moment, the broader outlook remains cautious. Sustained upside momentum may prove difficult unless supported by a more favorable macroeconomic environment, particularly through lower U.S. interest rates or a weakening U.S. dollar.
From a technical standpoint, the $57 level represents an important support zone. A decisive break below this area could trigger additional selling pressure and pave the way for a deeper decline toward the $50 mark. Until stronger bullish catalysts emerge, traders are likely to remain focused on downside risks and broader market conditions.
GBP/USD
The British pound advanced over the course of the week, although gains remained capped near the 1.3450 region. This area continues to act as a significant resistance zone, with selling pressure likely extending toward the psychologically important 1.3500 level.
While the broader trend has shown signs of resilience, the pair has yet to generate enough momentum to break convincingly above resistance. As a result, traders may remain cautious until a clearer directional signal emerges.
For the time being, GBP/USD appears likely to remain within a broader trading range. In this environment, short-term rallies that begin to lose momentum could present opportunities for sellers, particularly if resistance levels continue to hold and market conditions fail to support a sustained breakout.
Gold prices drew renewed attention as geopolitical tensions in the Middle East intensified. On Thursday, the United States carried out a new round of airstrikes against Iran, prompting Tehran to retaliate with attacks on targets across the Persian Gulf. The latest exchange of military action has raised concerns over the stability of the already fragile ceasefire agreement between the two nations.
Since the framework truce was signed in June, periodic flare-ups followed by temporary pauses in fighting have become a familiar pattern, casting doubt on the durability of the accord. Washington and Tehran have repeatedly accused one another of breaching the agreement.
Earlier in the week, gold futures came under heavy pressure after President Donald Trump declared that the ceasefire was effectively “over” and stated that he no longer wished to engage with Iran. Speaking to reporters following a NATO summit in Türkiye on Wednesday, Trump’s remarks contributed to a sharp sell-off that drove gold futures down to an intraday low of $4,032.56, narrowly holding above key support at $4,030.51. The metal later recovered some losses and settled at $4,082.24.
Gold also found support from the minutes of the Federal Reserve’s June policy meeting. The report revealed a divide among policymakers regarding the need for further interest-rate increases, fueling market expectations that borrowing costs could be reduced later in the year. Such a scenario is generally favorable for gold, as lower rates reduce the opportunity cost of holding non-yielding assets.
At the same time, the Fed minutes highlighted ongoing concerns about stubborn inflationary pressures. Inflation has remained elevated since the outbreak of the U.S.-Iran conflict in late February and continues to run well above the central bank’s 2% target. As a result, policymakers may be reluctant to move aggressively toward rate cuts despite growing expectations for monetary easing.
Key Technical Levels to Monitor
On Thursday, gold futures opened at $4,085.90 and advanced to an intraday high of $4,145.40, briefly surpassing the resistance level that capped gains the previous day. After retreating to a low of $4,063.40, prices rebounded and were trading around $4,138 at the time of writing. Despite the recovery, questions remain about the sustainability of the move, given the broader bearish factors that continue to weigh on the market.
Daily Chart Outlook
On the daily timeframe, gold futures are attempting to remain above the important support level at $4,125.61. However, the metal continues to encounter strong selling pressure beneath the immediate resistance at $4,144.72. Concerns over energy-driven inflation remain a key headwind, while U.S. Treasury yields have stayed close to multi-week highs and eurozone bond yields are hovering near one-month peaks. These elevated yields have been supported by heightened geopolitical tensions in the Middle East, limiting gold’s upside potential.
1-Hour Chart Outlook
From an intraday perspective, gold has managed to hold above the 200-period Exponential Moving Average (EMA) at $4,117.92 for the past several hours, indicating that near-term support remains intact. Nevertheless, the metal has struggled to establish a foothold above the key resistance level at $4,144.72.
The emergence of a bearish hourly candle has pushed prices back toward $4,137, suggesting that selling interest has increased during the past six hours. Adding to the cautious outlook, the 100-period EMA remains below the 200-period EMA, maintaining a bearish crossover on the hourly chart. This technical setup indicates that downside risks persist unless buyers can secure a sustained break above resistance in the sessions ahead.
Escalating tensions between the US and Iran drove oil prices higher, reigniting inflation worries and dampening investor sentiment.
A stronger US Dollar continues to weigh on EUR/USD, with geopolitical uncertainty taking precedence over economic fundamentals.
Investors are looking ahead to the Fed minutes for policy clues, although developments in the Middle East remain the primary catalyst for market direction.
After a turbulent first half of the year marked by the US-Israel conflict with Iran and President Trump’s frequent policy reversals, investors were hoping for a quieter period as the summer holiday season approached. Instead, geopolitical tensions appear to be resurfacing.
Oil prices have climbed sharply over the past few sessions, recovering to levels last seen before the conflict. While Trump may later attempt to ease market concerns with softer rhetoric, the immediate reaction has been a renewed focus on geopolitical risks.
My view is that Trump is unlikely to favor a major escalation, which could limit the magnitude of any oil rally compared with the dramatic price swings witnessed during the peak of the conflict earlier this year. However, his recent remarks have undeniably heightened concerns over potential supply disruptions from Iran and the broader Middle East. In particular, markets are once again watching the possibility of Tehran restricting traffic through the Strait of Hormuz, a critical global energy chokepoint.
The coming days should provide greater clarity on how the situation develops, but for now, there is a growing risk that markets could find themselves facing a familiar geopolitical backdrop once again.
Fed Minutes Likely to Take a Back Seat as Geopolitical Risks Return
Markets initially appeared to shrug off the renewed tensions between the US and Iran earlier this week, but sentiment has shifted noticeably. As geopolitical concerns intensify, investors are likely to pay less attention to incoming macroeconomic data. While the minutes from the Federal Reserve’s June meeting are due later today and are expected to reaffirm a hawkish policy stance, supporting the US Dollar, the market’s primary focus has returned to oil prices and their implications for inflation and interest-rate expectations.
Investor sentiment deteriorated after President Trump’s remarks at the NATO summit unsettled financial markets, prompting a broad risk-off move that weighed on European equities and US stock futures. Addressing reporters, Trump stated that the memorandum of understanding with Iran was no longer valid and referred to Iranian leaders in highly critical terms, signaling a tougher stance toward Tehran.
The change in rhetoric has significantly reduced hopes for renewed diplomatic engagement. Only a few days ago, expectations were growing that both Washington and Tehran would maintain restraint ahead of another round of negotiations. Instead, concerns over renewed confrontation have resurfaced, placing geopolitical risks back at the forefront of market attention.
Euro Lacks Clear Catalysts Amid Mixed Fundamental Signals
The euro continues to face a challenging outlook as conflicting economic and geopolitical factors shape market sentiment. On the positive side, Germany’s industrial production data surprised to the upside, with output increasing by 0.9% in May, supported by stronger activity in the automotive and construction sectors.
The data suggests that Europe’s industrial economy has remained relatively resilient despite recent geopolitical uncertainty. However, the renewed escalation of tensions in the Middle East threatens to push energy costs higher once again, potentially weighing on economic growth across the region. At the same time, investors remain divided over the European Central Bank’s policy path, with expectations for a September rate hike no longer representing the market’s base-case scenario.
Nevertheless, ECB policymakers are unlikely to signal an end to the inflation fight while geopolitical risks remain elevated. Underlying price pressures continue to run above desired levels, prompting officials to maintain a cautious and data-dependent stance. Comments from senior ECB members this week may reinforce that message, providing intermittent support for the euro. Even so, such support could prove limited as the US Dollar continues to benefit from safe-haven demand and expectations that US interest rates will remain elevated for longer.
EUR/USD Technical Analysis
From a technical standpoint, EUR/USD remains trapped in a consolidation phase, although the near-term bias appears to favor the downside. The pair is currently hovering around the key 1.1400 support zone. A sustained break below this level could open the door for a deeper pullback toward the 1.1300 region.
On the upside, resistance is initially seen near 1.1450. If buyers manage to push the pair above this barrier, attention would shift to the psychological 1.1500 level, followed by the next major resistance around 1.1575.
At present, a stronger bullish move in EUR/USD would likely require a meaningful change in expectations surrounding Federal Reserve policy or a notable weakening in US economic conditions. With neither scenario appearing likely in the near term, investors continue to favor the US Dollar, supported by its yield advantage and renewed geopolitical concerns stemming from rising US-Iran tensions, which have also helped sustain higher oil prices.
Most self-directed traders and investors begin with a simple belief: if they learn how to navigate the markets themselves, they can achieve lasting success without relying on others.
It’s an understandable mindset. Independence, control, and the pride that comes from mastering a skill on your own are powerful motivations.
This thinking has fueled the growth of the trading education industry. Aspiring market participants invest in courses, books, webinars, technical indicators, charting techniques, and expert commentary. They immerse themselves in learning, convinced that gaining enough knowledge will eventually make the markets easier to understand and predict.
Education certainly has value.
I strongly support continuous learning. Over the years, I have dedicated countless hours to studying financial markets, developing and testing strategies, and helping traders and investors better understand price behavior, trends, momentum, sentiment, and risk management. Greater knowledge can undoubtedly improve a person’s ability to navigate market conditions.
However, there is a reality that many only discover after years of experience: knowledge by itself is often insufficient.
Someone may recognize chart formations yet still enter poor trades. They may understand the importance of discipline but abandon their strategy during a losing streak. They can design a detailed trading plan and still hesitate when it is time to execute. Even after consuming extensive educational material, many struggle once real capital and genuine emotions are involved.
This does not diminish the importance of education. It simply highlights that understanding and execution are two very different things.
Why Knowledge Alone Often Falls Short
Financial markets have a unique way of testing people when conditions are most challenging.
Reviewing a chart after the fact and identifying the ideal decision is relatively easy. Making that decision in real time—while money is on the line, headlines are creating uncertainty, and emotions are running high—is far more difficult.
That is where many investors encounter problems.
The issue is rarely intelligence. More often, success in investing and trading depends on maintaining discipline and consistency under pressure. And pressure has a way of changing behavior.
When markets are stable, most people are confident they will stick to their strategy. Yet when a position moves sharply against them, a rally unfolds without their participation, or an unexpected market event sparks fear, following the plan becomes significantly more difficult.
This is where education can reach its limits. It teaches investors what to watch for, but it does not necessarily provide the emotional resilience required to act decisively during uncomfortable situations. Knowledge can improve understanding, but it does not automatically eliminate fear, hesitation, impatience, FOMO, or the tendency to second-guess decisions.
I learned this firsthand.
After spending many years day trading, I understand the demands involved. The endless screen time, rapid decision-making, constant concentration, and emotional intensity can quickly make trading feel like a full-time job. If the process is not properly structured, the cost extends beyond financial losses. It can consume time, energy, focus, and overall peace of mind.
This is the aspect many people underestimate when they decide to pursue the journey entirely on their own. They assume the main obstacle is acquiring information. In reality, the greater challenge is often applying that knowledge consistently when it matters most.
When Learning Turns Into a Never-Ending Cycle
Over the years, I have noticed a recurring pattern.
Many traders begin their journey with genuine enthusiasm and commitment. They enroll in courses, study market examples, create a trading plan, and feel as though they are finally gaining control of their financial future. Then reality intervenes. A trade goes wrong. A drawdown occurs. A setup feels uncertain. A strong rally unfolds without them. Gradually, the confidence they felt during the learning phase begins to erode.
At that point, many start modifying their approach. They add new indicators, experiment with different systems, or search for another source of information that promises to eliminate uncertainty.
Soon, the pursuit of knowledge becomes a cycle with no clear end. There is always another course to buy, another strategy to test, another market expert to follow, or another explanation for why the previous method failed.
In many cases, the issue is not a lack of information. The real challenge is the absence of a process that can be trusted when emotions begin to influence decision-making.
That distinction is critical.
Acquiring more knowledge often feels productive because it creates a sense of progress. However, if that knowledge does not translate into improved execution, stronger risk management, and greater emotional discipline, it may do little to address the underlying problem.
This becomes particularly significant for investors nearing retirement or already living in retirement. At that stage of life, the consequences of repeated mistakes can be far more severe. A losing trade is no longer just a temporary setback. A substantial loss can affect confidence, influence spending and income decisions, reduce financial flexibility, and impact long-term security. In many cases, the time required to recover from a major mistake can be as costly as the loss itself.
For that reason, the discussion needs to evolve.
Rather than asking, “How much more do I need to learn?” investors may benefit from asking a different question:
“What process can I consistently follow when real money, real emotions, and real market uncertainty are involved?”
The Difference Between Knowing and Executing
I often compare investing to home renovation.
There is tremendous value in understanding how a house is constructed. The more you know about foundations, electrical systems, plumbing, roofing, and structural design, the better equipped you are to ask informed questions, evaluate workmanship, identify potential issues, and appreciate why certain decisions matter.
However, understanding how a house is built does not mean most people want to spend their retirement serving as the contractor for every project.
Eventually, priorities change. The objective is no longer proving that you can do every task yourself. Instead, it becomes ensuring the structure is reliable, the plan is well designed, and the end result supports the lifestyle you want to enjoy within that home.
Investing works much the same way.
Learning how markets function is undeniably valuable. A solid understanding of trends, momentum, sentiment, price behavior, and risk management can help investors make more informed decisions. Yet when that knowledge leads to constant monitoring, endless analysis, and the burden of managing every detail alone, education can become a source of stress rather than a tool for clarity.
For many investors—particularly those approaching retirement or already retired—the goal is not to become a full-time market analyst. The goal is to gain enough knowledge to understand the process, enough structure to avoid emotionally driven decisions, and enough freedom to focus on the life their investments are intended to support.
Moving From More Information to Better Structure
At some stage, many investors realize that what they need is not necessarily additional information, but a more reliable framework.
They need a process that helps reduce emotional reactions. They need guidance on when market conditions favor participation and when caution is warranted. They need a system that provides consistency rather than relying on intuition, impulse, or constant interpretation of every market fluctuation.
This does not mean education loses its importance. Learning should remain a lifelong pursuit. Market knowledge can add value at every stage of an investor’s journey. However, education delivers the greatest benefit when it strengthens a process rather than replacing one.
An effective process does not need to be exciting every day. It does not require continuous activity or constant engagement. What matters is that it is clear, repeatable, and aligned with the purpose of the capital being managed.
For many investors, particularly later in life, that purpose extends beyond simply growing wealth. It includes preserving the capital and time that will support future goals and financial security.
Significant losses affect more than account balances. They can create lengthy recovery periods, delay important plans, and force investors to spend years rebuilding wealth that had already been accumulated.
No investment approach can eliminate risk entirely. Every strategy involves uncertainty. What a structured process can provide, however, is consistency and discipline.
That distinction is important because many investors are not seeking a second career as active traders. They want a framework that helps protect what they have built, allows them to participate when opportunities are favorable, and reduces the emotional strain that often accompanies market volatility.
One experienced investor captured this idea particularly well. After more than three decades of trading individual stocks, he explained that following a structured signal-based approach allowed him to avoid a significant market decline and, more importantly, gave him back the freedom of retirement. Rather than spending hours each day monitoring stocks, he was able to focus on other aspects of life.
Feedback like that is meaningful because it reflects something deeper than returns alone.
It highlights the overall investing experience—the ability to pursue financial goals without allowing the markets to dominate daily life.
The Goal Isn’t to Become a Full-Time Trader
I remain a strong advocate for education. Investors benefit greatly from understanding how markets function, how trends develop, how risk accumulates, and how emotions can influence decision-making.
At the same time, many people eventually realize that they do not want their retirement years dominated by chart analysis, technical indicators, alerts, and the constant burden of questioning every investment decision. They do not necessarily want to build every component themselves. Instead, they want enough understanding to feel confident that the foundation supporting their financial future is solid.
That objective is fundamentally different from becoming a full-time trader.
For many investors, the true goal is not to demonstrate complete self-sufficiency. It is to safeguard the lifestyle their wealth was intended to support. That lifestyle may include spending time with family, traveling, maintaining good health, enjoying personal freedom, or simply living without being emotionally tied to every market fluctuation.
When viewed from this perspective, the role of education changes.
Education is not the final destination—it is a tool. The ultimate objective is a more effective and sustainable investing experience, one grounded in a disciplined process, sound risk management, capital preservation, and the confidence to stay focused on long-term goals.
This is what many investors are ultimately seeking. Not more information overload, not greater stress, and not another cycle of learning, experimenting, abandoning strategies, and starting over. What they often want is clarity, structure, and a framework that reduces the burden of facing every market decision alone.
That is the reality of market education. While knowledge can provide valuable insights and understanding, it is only the starting point. Lasting success comes when that knowledge is transformed into a consistent, repeatable process.
For investors who value not only their capital but also their time, peace of mind, and future opportunities, that process is where meaningful progress truly begins.
EUR/USD posts modest gains, hovering around the 1.1430 level during Friday’s early Asian trading session.
ECB meeting accounts revealed that policymakers expect inflationary pressures to remain elevated despite markets pricing in nearly three additional rate hikes.
A US official reaffirmed that Washington remains committed to pursuing a diplomatic resolution with Iran.
The EUR/USD pair edges higher to around 1.1430 during Friday’s early Asian session, supported by a weaker US Dollar (USD). The Euro finds support as investors increase expectations for further European Central Bank (ECB) tightening amid persistent inflation concerns and uncertainty surrounding the Middle East conflict.
Minutes from the ECB’s latest meeting released on Thursday showed that policymakers were presented with forecasts indicating inflation could remain above the central bank’s target through next year, even with nearly three additional rate increases. After raising interest rates in June, the ECB is widely expected to deliver two more hikes over the coming year as it seeks to contain inflationary pressures, including those stemming from higher energy costs linked to the Iran conflict.
Market participants have recently strengthened their bets on additional ECB rate hikes amid growing doubts over the prospects for a lasting agreement between the United States and Iran to end the war. These expectations continue to lend support to the common currency.
Investors will remain focused on developments in the US-Iran conflict, as any escalation in tensions could increase demand for safe-haven assets and weigh on EUR/USD. Nevertheless, a US official stated on Thursday that Washington remains committed to the memorandum of understanding with Iran, despite President Donald Trump’s remarks earlier this week that the framework agreement aimed at ending the conflict was “over.”
WTI is trading within a narrow range as investors remain cautious amid conflicting signals from the US and Iran.
Ongoing exchanges of fire between the US and Iran continue to fuel geopolitical concerns, providing underlying support for crude oil prices.
However, market anxiety has eased after US President Donald Trump stated that Iran is willing to negotiate a deal, limiting further gains in WTI.
West Texas Intermediate (WTI), the US benchmark for crude oil, remains stable during Friday’s Asian trading session after recovering from the previous day’s decline. Mixed signals from Washington and Tehran have encouraged traders to stay on the sidelines, with prices hovering near $71.75 and showing little change on the day as markets await fresh developments in the Middle East.
Geopolitical concerns returned to the forefront this week after the US launched a new round of military strikes against Iran in response to attacks on commercial vessels transiting the Strait of Hormuz. Tehran retaliated by targeting regional US allies and striking American military facilities in Bahrain and Kuwait. Adding to the tensions, US President Donald Trump announced on Wednesday that the ceasefire was effectively over, helping drive crude prices higher earlier in the week.
However, sentiment improved on Thursday after Trump stated that Iran had reached out seeking negotiations to prevent further escalation. A White House official also reaffirmed Washington’s commitment to the existing memorandum of understanding with Tehran. These developments, combined with OPEC+’s decision to raise production targets once again, may limit upside momentum in oil prices and prompt traders to remain cautious about initiating new bullish positions.
Meanwhile, the latest report from the US Energy Information Administration (EIA) showed an unexpected increase in crude inventories for the week ending July 3, marking the first stockpile build in eleven weeks. Commercial crude inventories climbed by 2.998 million barrels, well above market expectations. The larger-than-forecast increase could continue to weigh on prices, although WTI remains on track to post a modest weekly gain and potentially end a four-week losing streak.
Gold prices edge higher toward the $4,120 mark during Friday’s early Asian trading session. The precious metal finds support after US officials indicated that Washington remains committed to its memorandum of understanding (MOU) with Iran, despite President Trump’s statement that the agreement is “over.” However, expectations that the Federal Reserve will maintain a hawkish policy stance could limit further gains in Gold.
Gold prices rebounded to around $4,120 during Friday’s early Asian session as investors assessed the risk of renewed conflict in the Middle East. Demand for the safe-haven metal strengthened amid persistent geopolitical uncertainty surrounding the US-Iran situation.
The White House indicated that it remains committed to the memorandum of understanding (MOU) with Iran, despite President Donald Trump’s recent statement that the framework agreement aimed at ending the conflict was “over” following Iranian attacks on vessels in the Strait of Hormuz and neighboring countries.
Nevertheless, tensions remain elevated. Trump warned that military action would intensify if Iran launched further attacks on shipping in the strait. On Thursday, Iran reportedly targeted US military bases in Bahrain, Kuwait, and Qatar, while Jordan intercepted eight missiles fired by Tehran, according to Axios.
Rising hostilities between the US and Iran have fueled concerns over potential disruptions to global oil supplies. Higher crude oil prices could increase inflationary pressures, potentially prompting the Federal Reserve to keep interest rates elevated for a longer period, which may limit Gold’s upside.
Meanwhile, minutes from the Fed’s June policy meeting—the first chaired by Kevin Warsh—revealed significant disagreement among policymakers regarding the future path of interest rates. While many officials suggested that the federal funds rate could end the year within or slightly below its current range, others argued that rates may need to remain above current levels, reflecting continued uncertainty over the inflation outlook.
WTI crude oil prices drift lower on Thursday, ending a two-session advance that had lifted the commodity to its highest level in more than two weeks. Technical signals remain mixed, suggesting traders should exercise caution before committing to strong directional positions. Meanwhile, a decisive break above the 200-day Exponential Moving Average (EMA) is required to challenge the prevailing near-term bearish outlook.
West Texas Intermediate (WTI), the US benchmark crude oil, struggles to build on its recent two-day advance that pushed prices to their highest level in more than two weeks on Wednesday. During Thursday’s Asian session, the commodity trades modestly lower, though selling pressure remains limited, with prices hovering just above $74.00 and down roughly 0.65% on the day.
From a broader technical perspective, the latest rebound from the late-February low has lost momentum near the 23.6% Fibonacci retracement of the May-to-July decline. WTI also remains below its 200-day Exponential Moving Average (EMA), preserving a bearish near-term outlook. Furthermore, mixed momentum indicators suggest that recent gains are more likely corrective in nature rather than signaling a meaningful trend reversal.
The MACD has crossed into positive territory and remains above the zero line, indicating improving bullish momentum. However, the RSI is still near 44, highlighting relatively subdued buying interest. As a result, even if prices break above the immediate Fibonacci barrier at $75.69, upside progress could be constrained by resistance around the 200-day EMA at $77.27. A decisive move above that level would strengthen the case for a broader recovery.
Beyond the 200-day EMA, additional resistance levels emerge at the 38.2% retracement near $81.23 and the 50% Fibonacci level around $85.71. Further bullish extension could target the 61.8% retracement at $90.19, followed by higher retracement zones at $96.56 and $104.69. On the downside, key support remains at the recent cycle low of $66.73, where selling pressure may ease should the broader bearish trend regain control.
The US Dollar Index remains under pressure after the FOMC Minutes failed to deliver a more hawkish signal. Still, expectations for a Fed rate hike later this year and renewed tensions between the US and Iran are helping to limit downside momentum.
The US Dollar Index (DXY), which measures the Greenback against a basket of major currencies, remains under mild selling pressure for a second consecutive day. However, the decline has been limited, with the index trading within Wednesday’s range during Thursday’s Asian session and hovering just below the 101.00 level, down roughly 0.1% on the day.
Demand for the US Dollar has softened following the release of the latest FOMC Minutes, which failed to deliver a significantly more hawkish policy signal. The minutes from the June 16–17 meeting showed policymakers remained divided on the future path of interest rates, with many officials suggesting the federal funds rate could finish the year at or slightly below its current level.
Despite this, Federal Reserve officials continued to highlight persistent upside inflation risks, indicating that additional policy tightening may still be necessary to bring inflation back toward the 2% target. Markets continue to price in approximately a 70% probability of a 25-basis-point rate increase in September. At the same time, renewed geopolitical tensions between the US and Iran have provided support for the Greenback by reinforcing safe-haven demand and fueling expectations of higher inflation.
The latest escalation in the Middle East followed fresh US military strikes against Iran in response to attacks on commercial shipping in the Strait of Hormuz. Tehran retaliated with ongoing attacks targeting US military facilities and assets in Bahrain and Kuwait. Further adding to uncertainty, US President Donald Trump stated on Wednesday that the memorandum of understanding intended to ease regional tensions had effectively collapsed. Against this backdrop, traders are reluctant to initiate aggressive bearish positions on the Dollar ahead of the release of US Weekly Jobless Claims data, which could offer fresh direction for the market.
Gold remains under pressure as buyers stay cautious despite a weaker US Dollar. Escalating US-Iran tensions, persistent inflation concerns, and expectations of further Fed tightening continue to support the greenback, while the technical outlook suggests bullion could face additional downside.
Gold (XAU/USD) extends its decline for a fourth consecutive session on Thursday, hovering near the one-week low around $4,020 reached the previous day. Renewed conflict between the United States and Iran has reignited inflation concerns and strengthened expectations that the Federal Reserve could resume tightening policy in 2026, weighing on the non-yielding precious metal during Asian trading. However, a softer US Dollar, pressured by the absence of a strongly hawkish signal in the latest FOMC Minutes, is helping to cushion gold’s losses.
The minutes from the Federal Reserve’s June 16–17 meeting, released Wednesday, showed policymakers remain divided on the future path of interest rates. Several officials suggested that the federal funds rate could end the year at or slightly below its current level. Combined with last week’s weaker-than-expected US Nonfarm Payrolls report, the minutes did little to significantly shift market expectations. Nonetheless, Fed officials emphasized that inflation risks remain skewed to the upside and acknowledged that further policy tightening may be necessary to bring inflation back toward the 2% target.
Market participants continue to assign roughly a 70% probability to a Fed rate hike in September. That outlook, together with escalating tensions in the Middle East, is preventing a deeper decline in the US Dollar. The latest developments saw US forces launch additional strikes against Iran following attacks on commercial vessels in the Strait of Hormuz. Tehran responded with continued strikes on US military assets in Bahrain and Kuwait, while President Donald Trump declared on Wednesday that the ceasefire with Iran had effectively ended.
Against this backdrop, the broader fundamental picture remains supportive of the US Dollar and suggests that any rebound in gold could face selling pressure. Investors are now awaiting US Weekly Initial Jobless Claims data and remarks from key Federal Reserve officials for fresh policy clues. Even so, market attention is likely to remain focused on developments in the Middle East, which could continue to drive volatility across global markets and create significant trading opportunities in gold.
Gold Daily Chart
Gold may continue to struggle in attracting significant buying interest as the technical outlook remains tilted to the downside.
From a chart perspective, XAU/USD retains a bearish near-term structure, trading below its 200-day Simple Moving Average (SMA) and remaining confined within a descending channel. Although the Moving Average Convergence Divergence (MACD) indicator has crossed into positive territory and the Relative Strength Index (RSI) has improved to 40.26 from previously oversold levels, momentum remains relatively weak. As a result, any recovery attempt could encounter stiff resistance near the upper boundary of the channel around $4,247.94.
For sentiment to improve meaningfully, gold would need to break decisively above the channel resistance, with the next major hurdle located at the 200-day SMA near $4,492.08. On the downside, immediate support is seen at the lower edge of the descending channel around $3,811.93. A move toward that area could attract renewed buying interest from longer-term bulls seeking to preserve the broader upward trend if the current corrective phase deepens further.
Regardless of any assistance the US team received, the outcome against Belgium remained unchanged: elimination from the tournament.
Clearly, no matter what support governments provide to their fiat currencies in the battle against gold, the outcome remains the same: a knockout victory for gold.
A glance at the weekly chart highlights the strength of the technical setup, particularly the impressive positioning of the 14,5,5 Stochastics oscillator.
I recently recommended accumulating gold, silver, and mining stocks in the $4,100–$3,900 range while maintaining ample cash reserves to take advantage of any deeper pullback toward the $3,500–$3,200 area.
With those purchases now completed, investors can reasonably look forward to a recovery phase, with prices potentially advancing toward the initial profit-taking zone between $4,800 and $5,000.
What are the main obstacles facing gold? The conflicts in Iran and Ukraine have prompted some central banks to tap into their gold reserves, using bullion accumulated for difficult times. That selling has partially offset continued purchases by other central banks.
Meanwhile, the Indian government has taken a different approach. Rather than liquidating its own gold holdings, it has imposed tariffs and taxes that discourage gold ownership and purchases, potentially reducing demand by an estimated 50–75 tonnes per month.
In the West, many analysts continue to focus almost exclusively on gold’s lack of yield. Despite the metal’s remarkable advance from roughly $1,800 to $5,600 while interest rates remained around 4.5%–5%, they persist in arguing that higher rates are inherently bearish for gold.
This narrative overlooks a key contradiction: governments face growing challenges servicing massive debt burdens as interest costs rise, yet investors are often told to abandon gold and funnel capital into that same debt.
The issue is further complicated by official inflation measures such as CPI, PPI, and PCE, which many critics argue fail to fully reflect the inflation experienced by households. As a result, reported real interest rates may appear stronger than they are in practice.
Overall, the balance of probabilities now favors a move toward the $4,800–$5,000 range rather than a decline to $3,500–$3,200. However, central bank sales, weaker Indian demand, and persistent skepticism from Western analysts could keep gold’s advance gradual and uneven.
Many Western analysts also encourage investors to rotate out of gold, silver, and mining shares and into what they view as an increasingly expensive U.S. equity market—a strategy that carries significant risks.
Major bear markets often begin beneath the surface, with the more speculative stocks and broader secondary indexes weakening first while the Dow Jones Industrial Average continues to advance. That pattern appears to be unfolding today.
Investors holding these speculative names are frequently reassured that the Dow’s strength is evidence of a healthy market. The common belief is that their highly valued stocks will eventually catch up with the stronger-performing, more reasonably valued blue-chip shares and push to fresh highs.
Seasonally, July has historically been a favorable month for equities, while the August-to-October period has earned a reputation as a more volatile stretch and is often associated with major market corrections.
As speculative stocks lose momentum and the Dow continues to climb, rising valuation measures such as the Shiller CAPE ratio may signal growing market risk. In that environment, investors who have chased recent price gains rather than focusing on fundamentals could become increasingly vulnerable to a broader market downturn.
The silver chart continues to look exceptionally strong. In healthy bull markets, prices often find support before reaching widely recognized support zones, reflecting underlying buying pressure. Silver appears to be exhibiting that behavior at present.
The $50 level in silver roughly corresponds to the $4,000 area in gold, making both zones attractive from a value perspective. When markets enter these perceived value ranges, investors may benefit more from gradually building positions than from trying to pinpoint the exact bottom.
Rather than waiting for a perfect entry or a definitive final low, a disciplined approach of modest accumulation at attractive valuations can often prove more effective over the long term.
What about mining stocks? The daily CDNX chart continues to offer an encouraging technical picture. The market has already delivered several strong rebounds from the three accumulation zones established during the current consolidation phase.
The key question now is whether that consolidation has run its course and is setting the stage for a much larger advance. While no outcome is guaranteed, the evidence currently points to that being the higher-probability scenario.
Notably, the decline since mid-April has unfolded as a gradual drift lower rather than a sharp, panic-driven selloff. This type of slow, grinding weakness is often characteristic of consolidations nearing completion, as selling pressure gradually fades and the market prepares for its next directional move.
The GDX chart remains highly impressive from a technical perspective. A large bullish wedge pattern appears to be developing, with the ETF positioned near what many technicians would consider an ideal breakout zone. At the same time, silver is rebounding from the $50 support area, while gold continues to recover from the $4,000 region.
Fundamentally, many major mining companies are also in strong financial condition. Industry leaders such as Barrick Gold and Newmont maintain conservative balance sheets, with debt-to-equity ratios below 0.20, providing a solid financial foundation.
Taken together, the technical and fundamental backdrop remains constructive for both senior and junior gold miners. While risk management remains essential, current conditions suggest an environment that may favor gradual accumulation rather than excessive caution.
Bitcoin Rebounds Above $64,000 as June’s Sell-Off Loses Momentum
Bitcoin entered July 7 on firmer footing, reclaiming territory that appeared out of reach just weeks earlier. The leading cryptocurrency traded at $64,033.85, up 0.76% over the previous 24 hours, extending a recovery that has lifted prices 6.27% over the past week from late-June lows in the upper-$50,000 range. During the session, Bitcoin fluctuated between $63,694.40 and $64,476.62, maintaining its position near the upper end of the range—a sign that buyers continued to support the upward move. The rebound follows one of the harshest periods of the current market cycle, when Bitcoin spent an entire week below $60,000 and briefly slipped under its 200-week moving average for the first time since 2023. Attention now turns to the forces driving the recovery, the key technical levels ahead, and the catalysts that could shape the next major move.
Bitcoin Regains $64,000 Following June’s Market Shakeout
The return above $64,000 signals a measure of stability after a turbulent June. With prices now roughly 6.27% higher week-over-week, Bitcoin has recovered meaningfully from a sharp decline that dragged the asset into the high-$50,000s. The move marks a notable improvement in sentiment following one of the most challenging months of the ongoing cycle.
Bitcoin’s market capitalization stands at approximately $1.284 trillion, accounting for around 54%–55% of the total cryptocurrency market and reinforcing its dominance within the sector. At this scale, even modest percentage gains carry significant weight; the latest 0.76% daily increase added nearly $9.7 billion in market value. Unlike smaller digital assets that can experience outsized swings on limited liquidity, Bitcoin’s weekly advance reflects substantial capital flows and broader market repositioning.
Despite the recovery, the asset remains deep below its historical peak. Bitcoin’s record high of $126,000, reached in October 2025, is still nearly 49% above current levels, underscoring the extent of the retracement. The move back to $64,000 does not reverse the broader correction but suggests an effort to establish a more durable base after the June decline.
From a technical perspective, Bitcoin pushed toward resistance near $64,500 before consolidating close to session highs. Holding near the top of the daily range indicates buyers were willing to defend gains rather than take profits aggressively. Whether that support persists will determine if the $64,000 area evolves into a sustainable foundation or proves to be another temporary rebound within a broader corrective trend.
What’s Driving the Recovery? Short Covering Takes Center Stage
The rally appears to have been fueled largely by forced buying rather than a wave of new bullish conviction. More than $450 million in short liquidations generated automatic buying pressure after Bitcoin climbed above $62,000, creating a self-reinforcing rally. When leveraged bearish positions are liquidated, exchanges close those trades by purchasing the underlying asset, which can accelerate upside momentum.
Liquidation data highlights the extent of the squeeze. Short liquidations totaled approximately $86.6 million, compared with $54.01 million in long liquidations, suggesting bearish traders were caught off guard by the reversal and forced to cover positions. The imbalance reflects a market where many participants had anticipated further declines but instead faced a rapid upside move.
Trading activity also surged during the rebound, with volume rising 104.7% above average levels. While strong volume can indicate genuine demand, a meaningful share of the activity likely came from liquidation-driven buying rather than sustained spot-market accumulation by long-term investors. This distinction is important because rallies driven primarily by short squeezes can lose momentum once forced buying subsides.
The pattern is typical of recoveries following steep selloffs. Much of the excessive leverage that amplified June’s decline had already been flushed from the market, with open interest dropping sharply during the correction. Such leverage resets often lay the groundwork for rebounds by reducing forced-selling pressure. With many bearish positions eliminated, another significant decline may require a fresh negative catalyst rather than simply a continuation of liquidation-driven selling.
The next test for Bitcoin is whether genuine spot demand can replace the mechanical buying that powered the recent advance. Short squeezes can spark impressive rallies, but sustained uptrends generally require consistent participation from long-term buyers. For now, the liquidation-driven surge has helped Bitcoin reclaim the $64,000 mark, but the durability of the recovery will depend on whether real demand emerges to support prices in the sessions ahead.
ETF Inflows Return After June’s Historic Outflow Wave
A key factor supporting Bitcoin’s recent recovery has emerged from the spot ETF market. On July 2, spot Bitcoin ETFs recorded net inflows of $221.72 million, ending a painful 10-session outflow streak that had drained roughly $2.7 billion from the sector. Subsequent data remained positive, with an additional $46.6 million in net inflows, suggesting institutional sentiment may be stabilizing after weeks of persistent selling pressure.
The improvement comes after a difficult June, during which Bitcoin ETFs experienced their largest monthly outflows on record. Investors withdrew approximately $4.5 billion from the funds, intensifying downside pressure and highlighting a broad reduction in institutional crypto exposure. Reflecting the bearish mood, analysts at Citigroup reportedly reduced their 12-month Bitcoin ETF inflow outlook to zero, underscoring the depth of market pessimism at the time.
Against that backdrop, the return of positive ETF flows carries considerable importance. Spot ETF demand has become one of the most closely watched indicators of institutional appetite for Bitcoin. The July 2 inflow suggests that some large investors viewed the late-June decline into the high-$50,000 range as a buying opportunity rather than a reason to exit.
The relationship between ETF flows and Bitcoin prices is straightforward. When investors purchase shares of a spot Bitcoin ETF, fund managers must acquire Bitcoin in the open market to back those holdings, creating direct spot demand. Conversely, redemptions force funds to sell Bitcoin, adding pressure to prices. As a result, the shift from significant outflows to net inflows effectively turns a major headwind into a potential tailwind for the market.
The challenge now is determining whether the trend can persist. One strong inflow day alone does not confirm a durable turnaround. Markets will likely need to see several consecutive sessions of positive ETF demand before investors gain confidence that institutional buying has genuinely returned. Historically, sustained inflows tend to emerge when broader macro conditions improve, particularly if the U.S. dollar weakens and Treasury yields ease. For now, the renewed inflows provide an encouraging signal, but confirmation will require continued participation.
Bitcoin Recovery Gains Traction Despite Persistent Extreme Fear
One of the more remarkable aspects of Bitcoin’s rebound is that sentiment has remained deeply negative even as prices recover. The Crypto Fear & Greed Index currently stands at 23, firmly within Extreme Fear territory, despite Bitcoin’s weekly gain of more than 6%. While the index has improved from recent lows, investor psychology remains notably cautious.
Sentiment reached particularly depressed levels in late June. The seven-day average for the index fell to 19, while the indicator briefly touched 10 when Bitcoin traded near $58,411. Such readings typically reflect widespread capitulation, uncertainty, and risk aversion among market participants—conditions that have historically appeared near major market bottoms.
This divergence between price action and sentiment is often viewed as a bullish contrarian signal. When fear dominates market psychology, much of the selling pressure may already have been exhausted. As bearish positioning unwinds and sellers become scarce, markets can recover even before investor confidence returns. In that sense, Bitcoin’s rise alongside continued pessimism resembles the early stages of previous recovery phases.
However, the current rally differs from the highly speculative advances seen during stronger bull-market periods. Much of the recent move appears to have been driven by short-covering activity and cautious repositioning rather than aggressive risk-taking. There are few signs of the exuberance or leverage expansion typically associated with mature uptrends.
That dynamic presents both opportunities and risks. The absence of widespread optimism means the market is far from overheated, leaving room for additional gains if fundamentals continue to improve. At the same time, lingering fear reflects ongoing uncertainty about whether the broader correction has truly run its course.
For now, the combination of improving ETF flows and deeply bearish sentiment creates a constructive backdrop for Bitcoin. While Extreme Fear alone is not enough to confirm a lasting bottom, its coexistence with strengthening institutional demand suggests that downside pressure may be fading and that the market could be laying the groundwork for a more sustainable recovery.
While daily price movements continue to dominate headlines, on-chain data reveals a more subtle but potentially important trend: large Bitcoin holders have been steadily increasing their exposure. Over the past two weeks, whale wallets accumulated more than 270,000 BTC, indicating that long-term investors have been using the recent market weakness as an opportunity to add positions.
This accumulation stands in sharp contrast to the cautious sentiment reflected across retail markets. While the Crypto Fear & Greed Index remains in Extreme Fear territory, major holders appear to be positioning for a longer-term recovery rather than preparing for further downside.
Whale activity often attracts attention because these investors typically operate with greater capital, longer investment horizons, and less sensitivity to short-term volatility. When large holders buy aggressively during periods of market stress, it can signal that they view prevailing prices as undervalued relative to future expectations. The acquisition of more than 270,000 BTC during the aftermath of June’s sell-off represents a significant transfer of supply into stronger hands.
Supporting this narrative is the continued decline in Bitcoin balances held on exchanges. As coins move from trading platforms into private wallets, the available supply for immediate sale decreases. Such outflows are commonly interpreted as a sign that investors intend to hold rather than liquidate their positions. Reduced exchange reserves can strengthen future rallies by limiting the amount of Bitcoin readily available when demand increases.
Taken together, whale accumulation and declining exchange balances suggest a market undergoing quiet accumulation beneath an atmosphere of widespread caution. While retail participants largely retreated during the June downturn, larger investors appear to have used the weakness to build positions. This divergence often emerges during transitional periods when markets begin shifting from distribution and capitulation toward stabilization and recovery.
The trend also complements the broader deleveraging process that unfolded during June’s correction. Open interest fell sharply as leveraged positions were liquidated, removing much of the excess speculation that had built up during earlier stages of the cycle. With leverage significantly reduced, exchange balances falling, and whales actively accumulating, the overall market structure appears healthier than it did during the height of the sell-off.
Although no single indicator guarantees a sustained advance, the combination of stronger hands accumulating, lower exchange supply, and a cleaner leverage profile provides a constructive foundation for Bitcoin’s recovery. The recent whale activity suggests that patient capital sees value where fearful investors remain hesitant.
Why the 200-Week Moving Average Remains a Critical Level
Bitcoin’s late-June decline carried significant technical implications, particularly because it pushed the cryptocurrency below one of its most closely watched long-term indicators: the 200-week moving average.
The market not only fell beneath the level intraday but also recorded its first weekly close below the 200-week average since 2023. For many long-term investors and technical analysts, this moving average serves as a key measure of Bitcoin’s structural trend and has historically acted as a major support zone during periods of market stress.
The importance of the breakdown stems largely from its rarity. Bitcoin has only traded below the 200-week moving average during the most severe phases of previous bear markets. Each occurrence has coincided with deep capitulation and widespread pessimism, which explains why the June breakdown intensified bearish sentiment across the market.
At the same time, history offers a more balanced perspective. In prior cycles, Bitcoin eventually reclaimed the 200-week moving average after breaking below it, transforming periods of extreme weakness into the foundation for future uptrends. As a result, the indicator has often served as both a warning signal and a long-term recovery marker.
Several factors suggest the recent breakdown may have occurred under conditions of significant market exhaustion. During the sharp sell-off, Bitcoin appeared deeply oversold, while open interest fell to approximately $46.5 billion as leveraged positions were systematically liquidated. The removal of excess leverage reduced forced-selling pressure and helped reset market conditions after months of speculative activity.
The subsequent rebound above $64,000 has further eased immediate concerns. More importantly, Bitcoin has reclaimed the psychologically significant $60,000 level, which previously served as a major support area during the February crash. That zone has once again emerged as a crucial battleground between buyers and sellers.
Maintaining price action above $60,000 is essential if Bitcoin is to repair the technical damage caused by the late-June breakdown. A sustained hold above that threshold would strengthen the case that the move below the 200-week moving average represented a capitulation event rather than the beginning of a deeper bear market.
For now, Bitcoin’s recovery suggests that buyers are attempting to rebuild the market structure that fractured during June’s decline. Whether the effort succeeds will depend on the cryptocurrency’s ability to defend key support levels, attract continued institutional demand, and convert the recent rebound into a broader trend reversal.
Bitcoin Trapped Between Key Support and Resistance Levels
Bitcoin’s near-term outlook is being shaped by a relatively narrow trading range, with support at $63,000 and resistance near $64,500 emerging as the most important levels for traders. How price reacts around these zones will likely determine the cryptocurrency’s next significant move.
During the latest recovery attempt, Bitcoin climbed toward the $64,500 resistance area before encountering selling pressure and consolidating just below that threshold. Despite the rejection, the asset remained near the upper end of its daily range, suggesting buyers continue to absorb supply rather than retreat aggressively. This resilience keeps the bullish case intact for now.
The key level on the downside is $63,000. As long as Bitcoin remains above this support zone, the recovery structure stays intact. A decisive break below it, however, could signal fading momentum and increase the risk of a deeper pullback.
Below $63,000, several support levels come into focus:
$62,000 – first layer of support beneath the current range.
$59,000 – the area that helped stabilize the recent rebound.
$58,115 – June’s monthly low and a major short-term support level.
$55,000 – a critical downside target if bearish pressure intensifies.
A drop below $58,115 would be particularly significant, as it would suggest sellers have regained control and could trigger another wave of downside momentum.
On the upside, a convincing break above $64,500 would strengthen the recovery narrative and shift attention toward higher resistance levels. The next major obstacle lies near $65,600, followed by a broader target zone between $65,600 and $70,000 if bullish momentum continues to build.
The current setup reflects a market still searching for direction. Bitcoin is effectively compressed between support and resistance, and such periods of consolidation often precede larger price swings. At present, the advantage appears to lean slightly toward buyers, given the market’s ability to hold near session highs and repeatedly challenge resistance rather than retreat toward support.
Why the 50-Month EMA Around $65,631 Matters
Despite recent gains, Bitcoin remains below one of its most important long-term technical barriers: the 50-month Exponential Moving Average (EMA), currently located around $65,631–$65,742.
This indicator serves as a widely monitored gauge of medium-term trend strength. Trading below the 50-month EMA suggests that sellers still maintain an advantage on the broader timeframe, even though short-term momentum has improved.
For Bitcoin bulls, reclaiming this level is arguably the most important technical objective in the near term.
A sustained move above the 50-month EMA would signal that the recent recovery is evolving into something more meaningful than a simple relief rally. It would also reduce the bearish bias that has dominated price action since the June decline and could shift the medium-term outlook toward a more neutral or constructive stance.
At current levels, Bitcoin remains only about 2.5% below the indicator. While that distance appears relatively small, overcoming a major long-term resistance zone typically requires consistent buying pressure and strong follow-through. As a result, the upcoming sessions could prove pivotal.
The broader moving-average structure highlights Bitcoin’s transitional position:
50-Month EMA: ~$65,631 (major resistance)
100-Month EMA: ~$40,322 (major long-term support)
The fact that Bitcoin remains comfortably above its 100-month EMA suggests that the long-term bull market structure has not been invalidated. However, remaining below the 50-month EMA indicates that the medium-term trend remains under pressure.
In other words, Bitcoin currently sits between a long-term bullish foundation and a medium-term corrective phase.
Looking further ahead, a move above $74,092 would represent a far more decisive bullish breakout and substantially improve the longer-term outlook. That level aligns closely with the monthly opening range near $73,674, illustrating how much ground Bitcoin must recover following June’s sell-off.
For now, the focus remains squarely on the 50-month EMA near $65,631. Reclaiming that level would provide important confirmation that buyers are regaining control and that the recent rebound has the potential to evolve into a broader recovery. Failure to do so, however, would leave Bitcoin vulnerable to remaining trapped within its corrective structure despite the recent bounce.
Derivatives Data Points to a Healthier Recovery
Bitcoin’s derivatives market is offering a relatively constructive signal as the recent rebound unfolds. Unlike previous rallies that were fueled by aggressive speculation, current positioning suggests traders are adding exposure cautiously rather than chasing price higher.
Open interest currently stands at approximately $47.71 billion, recovering from the sharp decline seen during June’s liquidation-driven selloff. Open interest reflects the total value of active futures and derivatives contracts, making it a useful measure of market participation and leverage.
The recovery in open interest indicates that traders are gradually returning to the market after leverage was largely flushed out during the correction. Importantly, the increase has not yet reached levels associated with excessive speculation, suggesting that the market is rebuilding participation on a more sustainable footing.
Funding rates reinforce this interpretation. Bitcoin’s funding rate remains positive at around 0.0087%, meaning long-position holders are paying a modest premium to short sellers. While positive funding generally reflects bullish sentiment, the current reading remains relatively subdued and far below the levels typically associated with market euphoria.
Historically, sharply elevated funding rates have often preceded corrections because they signal overcrowded bullish positioning. The current environment looks different. Traders appear constructive, but not excessively optimistic, leaving room for further upside without creating immediate vulnerability to a long-side liquidation event.
Recent liquidation data supports that view. During the latest recovery, approximately $86.6 million in short positions were liquidated compared with roughly $54 million in long liquidations. The imbalance highlights that bearish traders were forced to cover as prices moved higher, contributing to the rally’s momentum.
However, the broader derivatives landscape remains balanced. Open interest has recovered without exploding higher, funding rates remain moderate, and positioning does not indicate widespread speculative excess. Compared with conditions preceding June’s decline—when leverage had become stretched—the market now appears significantly healthier.
Taken together, derivatives metrics suggest Bitcoin’s rebound rests on a stronger foundation than a purely sentiment-driven bounce. The recovery may lack the explosive enthusiasm often seen during mature bull runs, but it also lacks the dangerous leverage imbalances that frequently lead to sharp corrections.
Prediction Markets Show Cautious Optimism
Beyond spot and derivatives activity, prediction markets offer another perspective on trader expectations. Recent contracts focused on Bitcoin’s July 7 closing price suggested participants were leaning modestly bullish, though conviction remained relatively limited.
A directional market asking whether Bitcoin would finish the day above its opening level assigned approximately:
59.5% probability to a higher close (YES)
40.5% probability to a lower or unchanged close (NO)
These figures indicate that traders saw a slightly better-than-even chance of continued gains, but not enough confidence to signal a strong consensus.
The probability distribution reflects cautious optimism rather than outright bullish conviction. Participants generally expected Bitcoin to maintain its recovery, yet remained uncertain about whether the move had enough momentum to extend significantly higher.
Momentum indicators paint a similar picture. While Bitcoin had posted a strong 24-hour gain of roughly 8.5% following the July 6 rally, shorter-term measures showed signs of slowing momentum. One-hour performance was essentially flat, while trend indicators remained below levels typically associated with sustained upside acceleration.
In practical terms, the market appears to be transitioning from an impulsive rebound phase into a consolidation phase. The initial surge attracted buyers and forced short-covering, but traders are now waiting for confirmation before committing aggressively to the next directional move.
Liquidity conditions also warrant caution when interpreting prediction-market data. Some contracts attracted relatively modest trading volume and liquidity, meaning probabilities can be influenced by comparatively small transactions. As a result, these markets are often more useful for identifying sentiment trends than for generating precise forecasts.
Across multiple prediction platforms, the broader message remained consistent: traders generally expected Bitcoin to hold its recent gains, but confidence in a sustained breakout remained limited.
That outlook aligns closely with signals from the spot market, ETF flows, sentiment indicators, and derivatives positioning. Bitcoin has clearly improved from its late-June lows, but the market has not yet reached a point where participants are overwhelmingly convinced that a new bullish trend is underway.
For now, the evidence suggests a market that is recovering and stabilizing rather than one experiencing a full-scale bull-market resurgence. The balance of probabilities favors further upside, but confirmation will likely require stronger momentum, continued ETF inflows, and a decisive break above major resistance levels such as $64,500 and the 50-month EMA near $65,631.
Most traders believe the biggest threat is the losing trade itself. In reality, the greater danger often comes in the moments immediately after it.
A losing trade can be perfectly executed: the setup met your rules, position sizing was appropriate, and the stop loss was honored. Yet once the trade closes in the red, something subtle changes. Your focus shifts from finding the next high-quality opportunity to recovering what was just lost.
This is known as trading tilt—an emotional state that can quickly erode discipline. Research suggests the first five minutes after a loss may be the most critical period of any trading session.
How a Strategy Can Unravel in Minutes
According to data cited by JournalPlus from proprietary trading firms, the average retail day trader’s win rate drops from roughly 48% to 32% on trades entered within five minutes of a loss.
At the very moment traders are most vulnerable, they often begin increasing position size, loosening entry standards, and acting more impulsively.
TradeZella’s findings show that tilt-driven trades frequently perform 15–25 percentage points worse than normal trades. Their profit factor often falls below 0.5, meaning traders lose roughly $2 for every $1 earned. Most emotionally driven trades occur within minutes of the triggering loss.
The market itself hasn’t changed. The trader’s decision-making has.
The Hidden Cost of Tilt
Trading expectancy can be expressed as:
Expectancy = (Win Rate × Average Win) − (Loss Rate × Average Loss)
Consider a strategy with:
Win rate: 48%
Average winner: 1.5R
Average loser: 1R
The result:
(0.48 × 1.5R) − (0.52 × 1R) = +0.20R per trade
A profitable edge.
Now assume tilt causes the win rate to fall to 32%:
(0.32 × 1.5R) − (0.68 × 1R) = −0.20R per trade
Nothing changed except trader behavior, yet expectancy swings by 0.40R per trade.
For a trader risking $200 per trade, that’s an $80 difference each time. Over 20 trades, the emotional cost can reach $1,600.
This helps explain why many traders repeatedly fail evaluations despite having viable strategies. The problem is often not the setup—it is trading after the edge has temporarily disappeared.
Why Losing Streaks Accelerate
With a 48% win rate, the probability of losing three consecutive trades is:
0.52 × 0.52 × 0.52 = 14.1%
At a 32% win rate, that probability jumps to:
0.68 × 0.68 × 0.68 = 31.4%
The likelihood of a three-trade losing streak more than doubles. Four straight losses rise from about 7.3% to 21.4%.
The danger becomes even greater when traders increase size after losses. Position sizing stops reflecting trade quality and instead becomes driven by the desire to recover money quickly.
Revenge Trading Is More Common Than Many Think
TradeMedic’s analysis of over 500,000 trading accounts identified measurable revenge-trading behavior in roughly 37% of traders.
Among those affected, revenge trading cost an average of approximately $1,917 per account, accounting for nearly 10% of total trading losses.
The problem is especially common among short-term traders:
47% of scalpers
38% of day traders
9% of swing traders
Longer-term traders naturally benefit from a cooling-off period. Scalpers, by contrast, can jump back into the market within seconds.
TradeMedic also found that performance improved as the waiting period after a loss increased. While recovery times varied, 15 minutes emerged as a reasonable average reset period.
Until personal data proves otherwise, waiting 15 minutes is generally safer than waiting 15 seconds.
Building a Five-Minute Firewall
The goal of the first five minutes after a loss is not to analyze the market. It is to prevent a temporary emotional reaction from causing lasting account damage.
First 30 Seconds
Cancel any impulsive pending orders.
Remove your hand from the mouse.
Minimize or close the order-entry window.
Avoid reversing positions or increasing size.
The objective is to create separation between the loss and your next decision.
Minute One Record the result in R-multiples, not dollars.
Write −1R rather than “I lost $500.”
Thinking in dollars creates emotional attachment. Thinking in R keeps the loss within the framework of planned risk.
Minutes Two and Three Ask yourself:
Would I take this trade if my previous trade had been a winner?
Does it meet every requirement of my trading plan?
Am I trading an opportunity or trying to recover a loss?
If your motivation is “making it back,” you’re seeking emotional relief, not a quality setup.
Minutes Four and Five Step away from the screen.
Get water, stretch, walk around, or move into another room. Set a 15-minute timer.
TradeZella reports that mandatory cooling-off periods after consecutive losses eliminate a large percentage of tilt-driven trades because most occur within the first five minutes.
Why Funded Traders Often Struggle More
Many traders assume the psychological pressure decreases after receiving a funded account. In practice, the opposite often happens.
During an evaluation, a loss feels like a setback.
After funding, losses can feel like a direct threat to future payouts, account retention, and personal validation.
A Hola Prime study analyzing more than 15,000 trades from 96 traders found that performance deterioration after funding was driven primarily by behavior rather than strategy. Revenge trading increased significantly once traders moved to funded accounts.
Data shared with Prop Trader Edge indicated that tilt behavior often emerged within approximately one minute of a losing trade on a funded account.
Ironically, the desire to protect the account can create the emotional reactions that ultimately jeopardize it.
The Trade You Don’t Take
Tilt leaves a clear statistical footprint: lower win rates, collapsing profit factors, larger position sizes, and longer losing streaks. A profitable strategy can quickly become a losing one.
The initial loss may be unavoidable.
What happens in the next five minutes is a choice.
You don’t need to recover the money immediately. You need to preserve your ability to execute the next valid setup with clarity and discipline.
Sometimes, the most valuable trade after a loss is the one you choose not to take.
EUR/USD remains on the defensive, struggling to attract meaningful buying interest as escalating tensions involving Iran continue to fuel demand for the safe-haven US Dollar. Meanwhile, the latest surge in crude oil prices has reignited inflation concerns, prompting markets to price in a greater likelihood of further Fed tightening and providing additional support to the Greenback. Investors now await the release of the June FOMC Minutes for fresh clues on the Federal Reserve’s policy outlook and the pair’s next directional move.
The EUR/USD pair manages to hold above the 1.1400 level during Wednesday’s Asian session, though upside momentum remains limited as renewed tensions between the United States and Iran dampen risk appetite. Market participants also prefer to stay on the sidelines ahead of the release of the FOMC Minutes, seeking additional clarity on the Federal Reserve’s future policy direction before taking fresh positions.
Geopolitical concerns intensified after the US launched a fresh round of strikes against Iran on Tuesday in response to reported attacks on three oil tankers transiting the Strait of Hormuz, raising fears that the fragile ceasefire could unravel. The escalation prompted investors to seek safety in the US Dollar, with the resulting risk premium providing support for the Greenback and weighing on the EUR/USD pair.
Adding to the USD’s strength, Washington reportedly revoked a major exemption that had enabled Iran to continue selling oil on global markets. The move fueled a sharp rise in crude oil prices and reignited concerns over energy-driven inflation. As a result, traders increased expectations that the Fed could deliver at least one additional rate hike before year-end, pushing US Treasury yields higher and offering further support to the US currency.
Despite the favorable backdrop, USD bulls remain cautious ahead of the publication of the Minutes from the Fed’s June 16–17 policy meeting later in the day. Investors will closely examine the document for fresh signals regarding the central bank’s monetary policy outlook, which could shape near-term USD sentiment and determine the next directional move for EUR/USD.
Silver extends its decline for a third straight session on Wednesday.
The prevailing technical structure continues to favor sellers, supporting the prospect of additional downside.
A decisive break below the lower boundary of the channel would strengthen the bearish bias and confirm further losses.
Silver (XAG/USD) remains on the defensive for a third consecutive session on Wednesday, trading around the $59.80 area during Asian hours. Despite the weakness, the metal continues to find support near the lower boundary of a short-term descending channel in the mid-$59.00s, close to Tuesday’s weekly low.
From a broader technical perspective, the descending channel resembles a bearish flag pattern following the recent sharp decline. Repeated rejections near the 100-period Simple Moving Average (SMA) on the 4-hour chart further reinforce the prevailing downside bias, suggesting sellers retain control of the near-term trend.
Momentum indicators also lean bearish. The MACD remains in negative territory at -0.33, while the Relative Strength Index (RSI) hovers near 44.16, indicating room for additional losses. Nevertheless, a decisive breakdown below channel support is still required to confirm a deeper corrective move.
Should sellers gain traction below the mid-$59.00 region, XAG/USD could slide beneath the $59.00 psychological level and target the next support zone around $58.35-$58.30, followed by $58.00. Further weakness may expose the $57.25 area, with the decline potentially extending toward $57.00 and the year-to-date low near $55.70 recorded in June.
On the upside, the first significant barrier is the 100-period SMA at $62.32. A sustained move above this level could trigger a test of the upper boundary of the descending channel near $64.21. Only a clear breakout above these resistance levels would negate the current bearish structure and improve the short-term outlook for silver.
Gold attracts modest buying interest as traders turn cautious on the US Dollar ahead of the release of the FOMC Minutes. However, renewed hostilities between the US and Iran, coupled with expectations that the Federal Reserve will maintain a hawkish stance, could continue to underpin demand for the safe-haven Greenback. At the same time, rising inflation concerns are driving US Treasury yields higher, limiting the appeal of the non-yielding precious metal and potentially capping further upside.
Gold (XAU/USD) edges higher during Wednesday’s Asian session, snapping a two-day losing streak after retreating to weekly lows below $4,100 in the previous session. The precious metal finds support as the US Dollar struggles to extend recent gains, with investors adopting a cautious stance ahead of the release of the June FOMC Minutes. Nevertheless, the broader backdrop suggests caution, as it remains unclear whether the recent pullback from Monday’s two-week high above $4,200 has fully run its course.
Geopolitical tensions remain elevated after the United States launched fresh strikes against Iran in response to reported attacks on oil tankers in the Strait of Hormuz, putting the fragile ceasefire at risk. The escalation has reinforced demand for the US Dollar’s safe-haven and reserve-currency appeal, limiting Gold’s upside potential. Adding to market concerns, Washington revoked a key exemption that had allowed Iran to export oil, fueling a sharp rally in crude prices and reviving fears of energy-driven inflation. These developments strengthen expectations that the Federal Reserve will maintain a restrictive monetary policy stance for longer.
Markets continue to anticipate further Fed tightening, with CME FedWatch data indicating an over 80% probability of at least one additional 25-basis-point rate hike before year-end. Expectations for a hawkish tone in the upcoming FOMC Minutes have also lifted Treasury yields, with the benchmark 10-year yield rising to 4.567% and the two-year yield climbing to 4.189%. Higher yields enhance the appeal of the Dollar while reducing demand for non-yielding assets such as Gold. As a result, despite the current rebound, traders may seek stronger follow-through buying before concluding that a sustainable bullish move in XAU/USD is underway.
Gold Daily Chart
From a technical standpoint, Gold continues to trade within a descending channel and remains below its 200-day Simple Moving Average (SMA), preserving a bearish near-term outlook. Although the Moving Average Convergence Divergence (MACD) has crossed into positive territory, signaling a potential recovery attempt, the Relative Strength Index (RSI) remains subdued at 44.33 and below the neutral 50 level, suggesting that bullish momentum is not yet strong enough to confirm a lasting trend reversal.
As a result, any upside move is likely to encounter significant resistance. Initial selling pressure could emerge near the upper boundary of the descending channel around $4,164.35. To shift the broader technical outlook toward a more constructive stance, Gold would need to break decisively above this level and then clear the key 200-day SMA at $4,491.30, which remains a major resistance barrier.
On the downside, the channel’s lower boundary near $3,713.85 serves as the first important support zone. A failure to sustain the current rebound could expose Gold to renewed downside pressure, with buyers likely to step in around this area in an effort to defend the longer-term trend floor. Until a decisive breakout occurs, the broader technical picture continues to favor selling into strength rather than chasing rallies.
Gold comes under renewed selling pressure as resurging inflation concerns push US Treasury yields higher, reducing the appeal of the non-yielding metal.
However, fading expectations of additional Federal Reserve rate hikes continue to limit upside momentum in the US Dollar, which could help cushion gold’s downside in the near term.
From a technical perspective, price action remains biased to the downside, with chart signals favoring bearish traders and suggesting the potential for further declines.
Gold (XAU/USD) remains under modest selling pressure during Tuesday’s European session, though prices continue to hold above the $4,100 level. Renewed tensions in the Strait of Hormuz have pushed crude oil prices higher, fueling concerns that elevated energy costs could reignite inflationary pressures. As a result, US Treasury yields have moved higher, lending support to the US Dollar and reducing demand for the non-yielding precious metal for a second consecutive day.
Geopolitical risks remain elevated after Iran reaffirmed its intention to impose fees on vessels passing through the Strait of Hormuz, arguing that the charges are linked to security oversight and environmental protection rather than transit tolls. Adding to market concerns, an oil tanker was reportedly hit by an unidentified projectile while navigating the strategic waterway, highlighting the fragility of the current US-Iran ceasefire arrangement and helping keep oil prices supported.
At the same time, softer-than-expected US labor market data has reduced expectations for additional Federal Reserve tightening. Following June’s weaker Nonfarm Payrolls report, markets have scaled back forecasts for future rate increases, with traders now pricing in between zero and one Fed hike in 2026, compared with expectations for up to two hikes previously. The shift has limited the US Dollar’s upside and helped prevent a deeper decline in gold prices.
Additional economic data offered little fresh direction. The US ISM Services PMI slipped to 54.0 in June from 54.5 previously, matching market expectations and failing to provide meaningful support for the Greenback.
Looking ahead, investors are likely to remain cautious ahead of Wednesday’s FOMC Minutes, which could provide further insight into the Federal Reserve’s policy outlook. Until then, geopolitical developments and movements in Treasury yields are expected to remain the primary drivers of both the US Dollar and gold prices. Given the mixed fundamental backdrop, traders may prefer to wait for stronger confirmation before concluding that gold’s recent rebound from last week’s year-to-date low has fully lost momentum.
Gold Daily Chart
Gold remains biased to the downside in the near term, with XAU/USD continuing to trade below its 200-day Simple Moving Average (SMA) at $4,489.97 and within a well-defined descending channel. A decisive break below the $4,100 support zone could trigger an acceleration of intraday selling pressure and expose lower technical levels.
That said, momentum indicators show some signs of stabilization. The MACD has crossed into positive territory, with the MACD line moving above the signal line and the positive histogram widening, indicating improving bullish momentum. However, the signal remains insufficient to negate the broader bearish structure. Meanwhile, the RSI stands at 44.16, below the neutral 50 threshold, suggesting that bearish conditions still prevail despite the recent rebound.
On the downside, the $4,100 level serves as the first line of defense for bulls. A sustained move below this threshold could pave the way for a test of the descending channel support near $3,844.34, where stronger buying interest may emerge.
On the upside, initial resistance is located near the upper boundary of the descending channel around $4,296.64. A break above this level would shift focus toward the 200-day SMA at $4,489.97, followed by a more significant resistance zone near $4,572.41. Until these barriers are cleared, rallies are likely to be viewed as corrective within the broader downtrend.
WTI crude extends its advance as renewed geopolitical tensions in the Strait of Hormuz raise concerns over potential supply disruptions. Iran reportedly launched at least two missiles at commercial vessels passing through the key maritime chokepoint on Monday, bolstering risk premiums in the oil market. However, gains may be tempered after Saudi Aramco reduced the price of its Arab Light crude for Asian customers by $11, bringing it to a $1.50 discount to the regional benchmark.
West Texas Intermediate (WTI) crude oil edged higher to around $69.20 per barrel during Tuesday’s Asian session, recovering part of the previous day’s decline as renewed tensions in the Strait of Hormuz provided short-term support to prices.
Market sentiment improved after a Bloomberg report, citing a US official, indicated that Iran launched at least two missiles at commercial vessels navigating the crucial shipping corridor late Monday. Although two ships suffered significant damage, no fatalities were reported. Meanwhile, the UK Maritime Trade Operations (UKMTO) said a southbound tanker was hit by an unidentified projectile on its port side, triggering a fire onboard.
However, the upside in crude prices remained limited, with WTI hovering near a four-month low amid growing signs of ample global supply. Easing some immediate concerns over disruptions, maritime traffic through the Strait of Hormuz has begun to normalize. Data showed that at least eight Japan-linked vessels, including five supertankers capable of carrying roughly two million barrels of crude each, successfully transited the waterway via routes close to Iran.
Further weighing on the market, Saudi Aramco slashed the official selling price of its benchmark Arab Light crude for Asian customers by $11 per barrel, leaving it at a $1.50 discount to the regional benchmark. The rare and aggressive price cut—previously seen only during the oil market downturns of 2015 and 2020—underscores weakening demand conditions. The move came shortly after OPEC+ agreed over the weekend to increase production quotas for next month, reinforcing expectations of a more oversupplied global oil market and limiting the scope for sustained gains in WTI.
The U.S. Dollar Index remains below 101.00 as easing expectations of Fed rate hikes offset concerns over Hormuz-related risks.
The U.S. Dollar Index (DXY) continues to trade sideways on Tuesday, lacking sufficient momentum to break out of its recent range.
Fresh tensions in the Strait of Hormuz provide support for the safe-haven U.S. dollar, helping limit downside pressure.
However, fading expectations of additional Federal Reserve rate hikes keep bullish sentiment in check and restrict further gains in the greenback.
The U.S. Dollar Index (DXY) remained range-bound below 101.00 on Tuesday, extending its consolidation for a third consecutive session as geopolitical risks and monetary policy expectations pulled the dollar in opposite directions.
Renewed tensions between the U.S. and Iran, particularly in the strategically vital Strait of Hormuz, provided support for the safe-haven greenback. Reports of an oil tanker being struck in the waterway and Iran’s efforts to strengthen its control over the strait have raised concerns over the durability of the 60-day ceasefire agreement. The resulting uptick in crude oil prices has revived inflation worries, lending additional support to the U.S. dollar.
However, upside momentum remains limited as expectations for further Federal Reserve tightening continue to fade. Following June’s softer-than-expected Nonfarm Payrolls report, markets scaled back their outlook for Fed rate increases in 2026 from two hikes to between zero and one, reducing support for the dollar.
Adding to the cautious tone, the U.S. ISM Services PMI eased to 54.0 in June from 54.5 previously, meeting forecasts but offering little incentive for fresh USD buying. As a result, traders remain hesitant to extend the dollar’s rebound from the 97.40–97.45 support zone seen earlier this year.
Attention now turns to Wednesday’s FOMC Minutes, which could provide clearer guidance on the Fed’s policy outlook and determine the DXY’s next directional move.
US Dollar: Investor positioning continues to provide solid support into year-end – NBC
According to analysts Stéfane Marion and Kyle Dahms of National Bank of Canada, the US Dollar remains near its 2026 peak, supported by persistent inflation in the United States and a widening interest-rate advantage over other major economies. While these factors are likely to keep the greenback well supported in the near term, the analysts are increasingly cautious about the sustainability of the rally beyond the third quarter.
The dollar has strengthened against all major currencies over the past month as markets reassessed the outlook for US interest rates, reinforcing the currency’s yield advantage. However, NBC argues that expectations for imminent Federal Reserve tightening may be overdone.
June’s labor-market data painted a softer picture than headline sentiment suggests. Nonfarm payrolls increased by just 57,000, missing market expectations, while previous months’ figures were revised lower by a combined 74,000 jobs. Meanwhile, the household survey showed a decline of 507,000 employed workers and a notable drop in full-time employment, pointing to underlying weakness in the labor market.
NBC notes that speculative positioning has become increasingly skewed toward a stronger dollar, indicating that much of the bullish narrative may already be priced in. As a result, the USD could become more vulnerable to weaker inflation readings, further signs of labor-market cooling, or any scaling back of expectations for future Fed rate hikes.
The bank therefore expects the US Dollar to remain supported in the short term, but warns that slowing job growth and crowded market positioning make it difficult to justify extending the recent rally far beyond Q3. This view aligns with the gap between the Federal Reserve’s projections and private-sector forecasts: while roughly half of FOMC members still anticipate higher rates this year, only a small minority of economists expect additional tightening. NBC shares that skepticism, arguing that although inflation remains elevated enough to discourage rate cuts, labor-market conditions are soft enough to allow policymakers to remain patient before considering further hikes.
NBC’s broad USD index forecast reflects this outlook, with the index expected to gradually ease from 120.8 currently to 115.9 by Q2 2027, signaling a moderation rather than a reversal of dollar strength.
Gold finds it difficult to build on its modest gains during the Asian session and remains below a newly established two-week high reached just above the $4,200 level. The US Dollar draws support from safe-haven demand as investors remain cautious over ongoing uncertainties related to tensions in the Strait of Hormuz, creating pressure on the precious metal. Nevertheless, expectations for fewer interest-rate hikes from the US Federal Reserve continue to limit the Dollar’s upside, preventing buyers from taking more aggressive positions.
Technical Analysis of XAU/USD
Friday’s break above the 100-period Simple Moving Average (SMA) on the four-hour chart, followed by a move through the 23.6% Fibonacci retracement of the April-to-June decline, provided a significant boost for XAU/USD bulls. In addition, the Relative Strength Index (RSI), which remains elevated near 63, together with a positive Moving Average Convergence Divergence (MACD) signal, suggests that bullish momentum is still intact despite Gold consolidating below its recent highs.
As a result, any pullback below the 23.6% Fibonacci level around $4,164 could attract buying interest near the 100-period SMA, which is positioned around $4,147 and may act as an important support zone. A decisive drop beneath this level, however, could pave the way for a deeper decline toward the key structural support area near $3,940.
On the upside, the first resistance is located around the 38.2% Fibonacci retracement at $4,302. Beyond that, the next targets are the 50% retracement level near $4,415 and the 61.8% Fibonacci level around $4,527. A sustained advance could then bring the 78.6% retracement at $4,686 into focus, with the April swing high near $4,889 marking the next major bullish objective.
Fundamental Analysis
Although the interim agreement between the US and Iran remains in place, tensions in the Strait of Hormuz continue to simmer as Tehran moves to strengthen its influence over the vital shipping route. Over the weekend, Iran’s ambassador to China indicated that the country intends to impose new service charges on vessels transiting the strait, a proposal that has already been opposed by the United States. These developments have kept geopolitical concerns elevated, boosting safe-haven demand for the US Dollar and creating some near-term pressure on Gold prices.
At the same time, expectations for further interest-rate hikes by the US Federal Reserve have eased following weaker-than-expected US labor market data released last Thursday, which pointed to moderating employment conditions. Lower inflation concerns, reinforced by the recent decline in Crude Oil prices, could also give the Fed greater flexibility to maintain a cautious policy stance. As a result, prospects for an extended period of restrictive monetary policy have softened, limiting the Dollar’s upside potential and helping to cushion Gold from a deeper pullback.
Supporting the longer-term bullish case for the precious metal, a recent survey by the World Gold Council found that central banks are increasingly viewing Gold as a safeguard against inflation, financial instability, and geopolitical uncertainty. Nearly 90% of surveyed institutions expect global central-bank gold holdings to rise over the coming year. In addition, the European Central Bank recently reported that Gold has surpassed US Treasuries as a reserve asset in global allocations. The People’s Bank of China also continued its accumulation trend, adding 320,000 ounces of Gold in May and extending its buying streak to 19 consecutive months.
Looking ahead, investors will closely monitor the release of the US ISM Services PMI, while remarks from key members of the Federal Open Market Committee (FOMC) could influence US Dollar sentiment during the North American session. Even so, the broader fundamental backdrop remains supportive for Gold. Consequently, any short-term declines are likely to attract fresh buying interest, suggesting that the recent rebound from the year’s low may still have room to extend.
Bitcoin rebounded to around $61,800 on Friday after plunging to a 21-month low of $57,800 earlier in the week. Despite the recovery, sentiment remains cautious as US-listed spot Bitcoin ETFs experienced net outflows totaling $526.64 million through Thursday, marking an eighth straight week of withdrawals. Analysts suggest that quarter-end portfolio rebalancing by institutional investors could offer near-term support and help stabilize Bitcoin prices.
Bitcoin (BTC) has gained more than 3% this week and was trading above $61,800 on Friday, recovering from a drop to a 21-month low earlier in the week. Despite the rebound, institutional selling pressure remained evident, as spot Bitcoin Exchange-Traded Funds (ETFs) registered net outflows exceeding $526 million through Thursday, putting the market on track for an eighth consecutive week of withdrawals. Analysts, however, believe quarter-end portfolio rebalancing could offer temporary support for the leading cryptocurrency.
Institutional outflows remain a headwind
Institutional appetite for Bitcoin continued to weaken throughout the week. According to SoSoValue data, spot BTC ETFs recorded cumulative net outflows of $526.64 million by Thursday. Unless Friday sees a substantial reversal in fund flows, Bitcoin ETFs will log their eighth straight week of net withdrawals. The persistent outflows suggest institutional investors remain cautious, leaving the market with limited support as Bitcoin recently fell to a 21-month low of $57,800.
Meanwhile, a recent report from CryptoQuant pointed to growing signs of heightened volatility ahead. The firm noted that Bitcoin exchange inflows surged to nearly 50,000 BTC in a single day, reaching levels seen only four other times in 2026. On Tuesday alone, approximately 49,000 BTC flowed into exchanges, an unusually large amount that has historically coincided with periods of significant price swings.
CryptoQuant analysts emphasized that the increase in exchange deposits occurred while Bitcoin was testing the key $60,000 support zone. A decisive break below that level could open the door for a decline toward $53,000, which corresponds to Bitcoin’s realized price.
The report added that such elevated inflow activity indicates a substantial volume of Bitcoin is being transferred to exchanges, a pattern that has often preceded major directional moves in the market.
Progress in US-Iran talks supports Bitcoin rebound
Improving sentiment around geopolitical developments helped Bitcoin recover during the second half of the week, with BTC climbing back above $61,000 after plunging to a 21-month low of $57,800 on Wednesday.
On Wednesday, Qatar’s Foreign Ministry reported that the United States and Iran had achieved “positive progress” in indirect negotiations held in Doha, with discussions advancing matters linked to the June ceasefire framework. Officials noted that the talks were building on outcomes from a recent summit in Switzerland, fueling optimism that a more lasting agreement could be reached.
US President Donald Trump also expressed confidence in the negotiations, stating that progress had been made regarding potential restrictions on Iran’s nuclear program and that denuclearization efforts were moving forward. Meanwhile, Vice President JD Vance indicated that nuclear-related issues would likely be addressed in future discussions.
The next round of negotiations is expected after the funeral ceremonies for Ayatollah Ali Khamenei, whose burial is scheduled for July 9.
Despite the improved outlook, uncertainty surrounding the Strait of Hormuz remains a key risk factor. Although shipping traffic through the strategic waterway has recovered significantly, volumes remain below pre-conflict levels. Market participants will continue monitoring developments in the Middle East, as any resurgence in tensions between Washington and Tehran could quickly undermine risk sentiment and trigger renewed selling pressure in assets such as Bitcoin.
Softer US labor data eases pressure from Fed expectations
On the macroeconomic front, weaker-than-expected US employment figures have reduced expectations for further Federal Reserve tightening, creating a more favorable environment for risk assets.
Investor expectations for additional rate hikes declined after Thursday’s labor market report showed the US economy added just 57,000 jobs in June, well below forecasts of 110,000. In addition, the previous month’s payroll figure was revised lower from 172,000 to 129,000, while the unemployment rate edged down to 4.2%.
The softer labor market data, combined with easing inflation concerns driven by lower crude oil prices, prompted traders to scale back expectations for future Fed tightening. Markets shifted from anticipating one or two rate hikes in 2026 to pricing in anywhere between no hikes and a single increase. This reassessment weakened the US dollar and provided additional support for Bitcoin’s recovery.
Could quarter-end rebalancing become Bitcoin’s next catalyst?
A recent report from K33 Research suggests that quarter-end portfolio rebalancing may offer a short-term boost for Bitcoin.
According to the study, ETF flow patterns during the six trading days surrounding month-end—three sessions before and three sessions after—have frequently diverged from prevailing monthly trends. Over the past 18 months, this phenomenon was observed in half of the sample periods.
K33 analysts noted that several months in which Bitcoin underperformed the S&P 500 were followed by stronger ETF inflows around month-end and during the opening days of the following month. This behavior is consistent with portfolio rebalancing, where investors increase Bitcoin allocations after periods of relative weakness to restore target weightings within diversified portfolios.
However, the analysts cautioned that the relationship is not always consistent. Roughly half of the observed periods failed to exhibit the same pattern, suggesting that rebalancing is only one of several factors shaping institutional demand for Bitcoin.
That said, the trend has become increasingly noticeable over the last four quarters. If it persists, quarter-end portfolio adjustments could provide a meaningful tailwind for Bitcoin, potentially supporting a recovery during the opening trading sessions of July.
Market analysts remain divided on whether quarter-end portfolio rebalancing can provide a meaningful boost to Bitcoin’s outlook.
According to Ryan Lee, Chief Analyst at Bitget, quarter-end rebalancing may generate short-term trading activity, but it is unlikely to alter Bitcoin’s broader market direction. He noted that BTC has been trading in a relatively tight range between $58,000 and $62,000 after losing roughly 14% during the second quarter, while continued spot ETF outflows and weakening institutional demand remain significant headwinds.
Lee explained that portfolio adjustments can trigger opportunistic buying when cryptocurrency allocations fall below target levels. However, he emphasized that Bitcoin’s next major move will likely depend more on factors such as ETF flows, macroeconomic developments, and overall investor risk appetite than on routine portfolio rebalancing.
Dean Chen, an analyst at Bitunix, expressed an even more cautious view. In his assessment, quarter-end rebalancing is unlikely to act as a meaningful bullish catalyst for Bitcoin and should instead be viewed primarily as a short-term liquidity redistribution process rather than a source of new capital entering the market.
Chen noted that in a prolonged downtrend, rebalancing flows can work in either direction. While some investors may increase exposure to underweighted risk assets, generating temporary buying pressure, others may choose to cut positions as part of broader risk-reduction and deleveraging strategies.
As a result, he believes quarter-end rebalancing is more likely to increase short-term market volatility than establish a sustained directional trend. In his view, the process merely reallocates existing capital rather than introducing fresh funds into the market.
Consequently, Chen argues that quarter-end portfolio adjustments should be treated as a temporary market influence rather than a structural driver capable of changing Bitcoin’s longer-term trajectory. Instead, the cryptocurrency’s broader outlook will continue to be shaped by institutional demand, ETF flows, macroeconomic conditions, and overall market sentiment.
Technical Outlook: Is Bitcoin Forming a Bottom?
Bitcoin rebounded more than 3% this week, climbing above $61,800 on Friday after finding support near a long-term ascending trendline that has connected major lows since January 2023. Despite the recovery, BTC still recorded a fresh yearly low of $57,800 earlier in the week, marking its weakest level since September 2024.
On the weekly timeframe, maintaining support around the $58,000 trendline remains critical for the bullish case. If buyers continue defending this area, Bitcoin could extend its rebound toward the 200-week Simple Moving Average (SMA) near $62,652. A decisive weekly close above that level would strengthen the recovery outlook and potentially open the door for a move toward the 78.6% Fibonacci retracement level at $65,520, measured from the August 2024 low of $49,000 to the October 2025 record high of $126,199.
However, longer-term momentum indicators continue to flash warning signs. The Relative Strength Index (RSI) on the weekly chart has fallen to around 35 and is approaching oversold territory, reflecting persistent bearish pressure. Meanwhile, the Moving Average Convergence Divergence (MACD) generated a bearish crossover in late June and remains in negative territory, reinforcing the broader downtrend.
Should Bitcoin break below the ascending trendline and close the week under the $58,000 area, selling pressure could intensify, exposing the next major support zone around $55,777.
On the daily chart, BTC has recovered from its recent 21-month low but still trades below its key moving averages, keeping the broader trend tilted to the downside. The cryptocurrency remains beneath the 50-day, 100-day, and 200-day Exponential Moving Averages (EMAs), located at approximately $66,028, $69,826, and $75,782, respectively.
The daily RSI has improved to around 44 but remains below the neutral 50 level, suggesting that buying interest is recovering only gradually. At the same time, the MACD has turned positive, with the MACD line moving above both its signal line and the zero line, indicating improving momentum. Nevertheless, the recovery remains insufficient to fully offset the prevailing bearish structure.
From a resistance perspective, Bitcoin faces its first significant hurdle near $64,000. A successful break above this level would bring the 50-day EMA at $66,028 into focus, followed by the 100-day EMA at $69,826 and the 200-day EMA at $75,782. Beyond those levels, a more substantial resistance zone emerges around $84,410.
Conversely, if Bitcoin fails to regain and sustain trading above the $64,000 region, downside risks could re-emerge. In that scenario, the market may retest lower support levels, with the psychologically important $55,000 area serving as the next major target for bears.
Although Livermore is not always mentioned in the same breath as renowned investors such as Warren Buffett and Peter Lynch, the lessons he left behind remain remarkably valuable. Notably, many of his principles differ significantly from the investment philosophies championed by Buffett and Lynch.
This contrast largely stems from their differing approaches. Buffett and Lynch are known for their focus on fundamental analysis and long-term value investing, whereas Livermore relied heavily on technical analysis and possessed a deep understanding of market psychology, including both his own behavioral tendencies and those of other investors.
While there is much to learn from the great figures of the investment world, it is important to recognize that no single strategy guarantees success. Every investment approach—whether conservative or aggressive—has its limitations. Livermore’s own career illustrates this reality; despite achieving extraordinary trading success, he ultimately died in financial hardship. Nevertheless, his insights into investor behavior and market dynamics remain highly relevant. With that perspective in mind, we now turn to the next 11 lessons.
Rule 1: Never Sell a Stock Simply Because It Appears Expensive
Rule 1 is essentially the opposite of Rule 10: never avoid a stock merely because it has already risen significantly from previous levels. A company that seems overvalued by traditional metrics may continue to appreciate if its business fundamentals remain strong and investor demand persists.
Valuation measures can help estimate long-term return potential, but they are often poor tools for market timing. Investors should evaluate stocks using multiple metrics rather than relying solely on commonly cited ratios such as P/E. Measures like the PEG ratio and forward P/E can provide additional perspective. A stock’s price alone should never be the sole reason for selling.
History offers many examples. Companies such as Amazon and Apple appeared expensive at various points in their growth cycles, yet continued delivering substantial gains. Selling high-quality businesses solely because they have appreciated can be a costly mistake.
Rule 2: Buy When a Stock Breaks Out After a Healthy Consolidation
Livermore believed investors should enter positions when a stock reaches a new high following a normal and orderly pullback. Such consolidations often indicate that selling pressure has been absorbed and buyers are regaining control of the trend.
A healthy correction differs significantly from a breakdown. The former represents a pause within an existing trend, while the latter may signal a genuine reversal. Distinguishing between these two scenarios is one of the most important skills in technical analysis. According to Livermore, a breakout following orderly consolidation often provides one of the lowest-risk opportunities to join a strong uptrend.
Rule 3: Never Average Down on Losing Positions
Averaging down remains one of the most common—and potentially damaging—investing habits. The reasoning often sounds logical: if a stock was attractive at $50, it should be even more attractive at $40.
In reality, a declining stock may be signaling that the original investment thesis is flawed or that the timing was wrong. Adding more capital to a losing position does not fix the problem; it increases exposure to it. Livermore viewed averaging down as one of the most destructive behaviors a trader can adopt because small losses can quickly become major ones.
Rule 4: Human Nature Is the Investor’s Greatest Enemy
Long before behavioral finance became an established discipline, Livermore recognized that investors frequently act irrationally.
Psychological biases influence nearly every investment decision. Loss aversion encourages investors to hold losing positions for too long. Overconfidence can lead to excessive risk-taking. Anchoring causes people to focus on their purchase price rather than a stock’s current value. Recency bias tempts investors to assume recent trends will continue indefinitely.
While these tendencies cannot be completely eliminated, recognizing them allows investors to build processes and disciplines that help reduce their influence.
Rule 5: Eliminate Wishful Thinking
Wishful thinking begins when hope replaces objective analysis. It occurs when investors stop asking what the market is communicating and instead focus on what they want to happen.
A useful exercise is to periodically evaluate every holding by asking: “If I did not already own this stock, would I buy it today based on the current information and price?” If the answer is no, it may be worth reconsidering the position. Successful investing requires evidence-based decisions, not emotional attachment.
Rule 6: Major Market Moves Require Time
The largest gains in financial markets typically come from trends that develop over months or even years. These trends rarely emerge overnight and often take considerable time to reach their full potential.
Impatience is a common reason investors fail to capture the majority of a trend’s returns. Identifying a strong trend is important, but having the discipline to remain invested while the trend unfolds is equally critical. Often, the biggest profits come not from finding opportunities, but from holding them long enough.
Rule 7: Do Not Obsess Over Every Explanation for Price Movements
Financial news outlets provide explanations for virtually every market move. However, many of these narratives are created after the fact to justify what has already occurred.
Markets frequently move for reasons that are impossible to identify with certainty. Constantly searching for explanations can lead investors toward poor conclusions and unnecessary trading decisions. Livermore believed that price action itself often provides more reliable information than the stories constructed around it. Observing what the market is doing can be more valuable than speculating about why it is doing it.
Rule 8: Following a Few Stocks Is Easier Than Following Many
Diversification has benefits, but excessive diversification can dilute both attention and conviction. When investors own dozens of positions, it becomes increasingly difficult to monitor each one effectively.
Livermore preferred focusing on a relatively small number of leading companies within strong sectors. By concentrating on businesses he understood well, he believed investors could make better decisions and respond more effectively to changing market conditions.
There is an important distinction between diversification as a risk-management tool and diversification as a substitute for thorough research. Owning fewer, well-understood investments may often be more effective than spreading capital across a large number of positions without sufficient analysis.
Rule 9: If You Cannot Profit from Market Leaders, You Are Unlikely to Profit from the Market Overall
In every market cycle, a relatively small group of stocks attracts the majority of investor capital. The growing popularity of passive investing has only reinforced this phenomenon.
If investors struggle to identify and benefit from these leading stocks, generating strong returns from secondary or lagging companies becomes increasingly difficult. For example, investors who avoid high-performing sectors such as technology in favor of weaker-performing areas may miss the primary engines of market gains. This principle underscores the importance of understanding sector leadership and monitoring shifts in market momentum.
Rule 10: Today’s Leaders May Not Be Tomorrow’s Leaders
Market leadership is never permanent. Sectors and investment factors rotate over time, often in dramatic fashion.
History provides countless examples. The “Nifty Fifty” stocks that dominated the early 1970s later fell out of favor. Technology stocks led the market during the late 1990s but underperformed for much of the following decade. Likewise, energy stocks struggled between 2014 and 2020 before becoming some of the market’s strongest performers in 2021 and 2022.
Investors who remain attached to yesterday’s winners risk underperforming in future market environments. Rather than focusing solely on what has worked in the past, successful investors continually evaluate which sectors and themes are most likely to benefit from changing economic and market conditions.
Rule 11: Do Not Let One Stock or Event Shape Your Entire Market View
A single data point does not establish a trend.
One company’s disappointing earnings report does not necessarily indicate weakness across an entire industry. Similarly, one stronger-than-expected inflation reading does not automatically signal the end of a broader disinflationary trend. Even a single bank failure does not guarantee a systemic financial crisis.
Markets are complex systems influenced by numerous variables. Investors often make costly mistakes when they draw sweeping conclusions from isolated events. Effective analysis requires examining a broad range of evidence and identifying consistent patterns before forming a strong bullish or bearish outlook.
Rule 12: Be Skeptical of Tips and “Inside Information”
While the sources of investment advice have evolved since Livermore’s time, the underlying principle remains unchanged.
In Livermore’s era, stock tips were commonly exchanged through personal networks and social gatherings. Today, they spread through social media, online forums, financial influencers, and subscription trading services. Yet the reality remains the same: if a truly exceptional investment opportunity were widely known, its advantage would quickly disappear.
People promoting “guaranteed winners” are often either misinformed, motivated by self-interest, or both. More importantly, investors should avoid relying entirely on someone else’s judgment. External research can be valuable, but investment decisions should ultimately be based on an analytical framework that the investor understands and can evaluate independently.
One of the most effective ways to strengthen investment decisions is to actively study viewpoints that challenge your own assumptions.
Summary
Jesse Livermore experienced extraordinary success and devastating setbacks throughout his career, building and losing multiple fortunes. Personal struggles, including depression and the changing regulatory landscape following the establishment of the U.S. Securities and Exchange Commission in 1934, weighed heavily on him. In 1940, he tragically ended his life, leaving behind a note describing himself as a failure. History, however, remembers him very differently.
What makes Livermore’s legacy remarkable is the enduring relevance of his principles. The markets he traded were vastly different from those of today. Technology, communication systems, market structure, and regulations have all undergone profound transformation. Yet the behavioral tendencies and market dynamics he identified remain strikingly familiar.
More than a century later, Livermore’s lessons on discipline, psychology, trend-following, risk management, and independent thinking continue to offer valuable guidance for investors navigating modern financial markets.
Silver prices retreated to around $62 after posting gains for four consecutive sessions. Expectations of additional weakness in crude oil prices could help cap the metal’s downside by supporting its broader market outlook. Meanwhile, investors are turning their attention to the upcoming Federal Open Market Committee (FOMC) minutes for fresh signals on the future direction of US interest rates.
Silver prices (XAG/USD) slipped around 1% to approximately $61.80 during Monday’s Asian session, pulling back after recording gains over the previous four trading days. Despite the correction, the precious metal could regain momentum as analysts increasingly expect oil prices to weaken further, a development that may reduce global inflationary pressures.
In recent months, silver came under significant pressure as crude oil prices surged amid supply concerns linked to geopolitical tensions in the Middle East. Higher energy costs fueled inflation worries, weighing on the outlook for precious metals.
Analysts at Citigroup have projected that Brent crude could decline toward $60 per barrel by the end of the year, citing improving market fundamentals. They noted that concerns over disruptions in the Strait of Hormuz are easing, while shipping activity is gradually returning to normal levels.
During Asian trading hours, Brent crude was down roughly 0.5%, trading near $71.80 per barrel and remaining close to Thursday’s five-month low of $70.26.
At the same time, easing expectations for further interest-rate increases by the Federal Reserve are providing additional support for silver. The shift in sentiment followed the release of the latest US Nonfarm Payrolls report on Thursday.
Data from the CME FedWatch Tool indicates that the probability of the Fed implementing at least one additional rate hike by the end of September has fallen to 53.2%, compared with 59.4% a week earlier.
Looking ahead, market participants will focus on the minutes from the June meeting of the Federal Open Market Committee, scheduled for release on Wednesday, for further insight into the US central bank’s policy outlook.
Technical Analysis
Silver (XAG/USD) is trading lower near $61.94 at the time of writing, coming under renewed selling pressure after a corrective rebound toward its 20-day Exponential Moving Average (EMA), currently positioned around $63.53.
Technical indicators suggest bearish sentiment remains in place, although downside momentum has weakened. The Relative Strength Index (RSI) has recovered from the 20–40 range and is now hovering near 42, indicating that selling pressure has moderated but has not yet shifted the overall trend to bullish.
On the upside, the 20-day EMA at $63.53 serves as the first significant resistance level. A daily close above this barrier would help neutralize the prevailing bearish outlook and could pave the way for a stronger recovery toward the June 22 peak of $67.17, with the psychologically important $70.00 level as the next target.
Conversely, if silver resumes its downward trajectory and breaks below the June 24 low of $55.63, the metal could enter a fresh phase of decline, exposing it to deeper losses in the sessions ahead.
Gold buyers have become more cautious as concerns surrounding the Strait of Hormuz boost safe-haven demand for the US dollar. However, expectations that the Federal Reserve is unlikely to resume rate hikes limit the dollar’s upside, helping to underpin gold prices. In addition, the technical outlook remains constructive, suggesting that any pullback could attract fresh buying interest and keep the broader bullish trend intact.
Gold (XAU/USD) came under renewed selling pressure after climbing above the $4,200 level during the Asian session, reaching its highest point in two weeks. The decline appears to interrupt a three-day rally as investors shift toward the US dollar, which is benefiting from safe-haven demand amid ongoing tensions surrounding the Strait of Hormuz. Nevertheless, expectations that the Federal Reserve is unlikely to raise interest rates further continue to limit the dollar’s upside potential. At the same time, sustained purchases by central banks are providing underlying support for the precious metal.
Although the interim agreement between the United States and Iran remains in place, concerns over the Strait of Hormuz continue to linger. Iran has indicated plans to impose new service charges on vessels transiting the strategically important waterway, a proposal opposed by Washington. These developments have kept geopolitical risks elevated, boosting demand for the US dollar and weighing on gold prices at the start of the week.
On the monetary policy front, market participants have scaled back expectations for additional Fed rate hikes following weaker-than-expected US employment data released last Thursday, which pointed to a moderation in labor market strength. Furthermore, lower inflationary pressures resulting from the recent decline in crude oil prices could give the Fed more flexibility to maintain a patient policy stance. As a result, expectations for prolonged restrictive monetary policy have eased, limiting further gains in the US dollar and helping to cushion gold from deeper losses.
Support for gold also continues to come from central bank demand. A recent survey by the World Gold Council showed that central banks increasingly view gold as a safeguard against financial instability, inflation, and geopolitical uncertainty, with nearly 90% of respondents expecting global gold reserves to grow over the coming year. In addition, data from the European Central Bank revealed that gold has surpassed US Treasury holdings in global reserve allocations. China’s central bank further reinforced this trend by adding 320,000 ounces of gold to its reserves in May, marking the nineteenth consecutive month of accumulation.
Looking ahead, investors will closely monitor the release of the US ISM Services PMI and comments from key Federal Open Market Committee officials. These events could influence demand for the US dollar and provide fresh direction for gold prices. However, the broader fundamental backdrop remains supportive of the precious metal, suggesting that any near-term pullbacks are likely to attract buyers and that the overall bullish outlook remains intact.
Gold H4 Chart
Gold remains close to an important technical support zone around $4,150–$4,145, where the 100-period Simple Moving Average (SMA) on the four-hour chart is currently located. The bullish breakout above this moving average on Friday, followed by a move beyond the 23.6% Fibonacci retracement of the April–June decline, provided a strong signal that buyers were regaining control of the market.
Momentum indicators continue to support a constructive outlook. The Relative Strength Index (RSI) remains elevated near 63, while the Moving Average Convergence Divergence (MACD) stays in positive territory, suggesting that the broader upward momentum remains intact despite the recent period of consolidation below the latest highs.
As a result, any decline below the 23.6% Fibonacci retracement level at approximately $4,164 is likely to attract buying interest around the 100-period SMA near $4,147. This area should serve as an important support floor. However, a decisive break beneath this zone could open the door for a deeper correction toward the major support region around $3,940.
On the upside, immediate resistance is located near the 38.2% Fibonacci retracement level at $4,302. A sustained move above this barrier could target the 50% retracement level around $4,415, followed by the 61.8% retracement near $4,527. Beyond that, the 78.6% Fibonacci level at approximately $4,686 marks the next major bullish objective, ahead of a potential retest of the April peak around $4,889.
Bitcoin showed a modest recovery over the week, finding support around the $60,000 level and signaling a potential stabilization after its recent decline. However, caution remains warranted, as the cryptocurrency has experienced significant downward pressure and market sentiment is still fragile.
Looking ahead, any upward movement is likely to face resistance from sellers until Bitcoin can establish itself firmly above the $65,000 mark. On the downside, a break below the low of the current weekly candle could trigger renewed bearish momentum, increasing the likelihood of a move toward the $50,000 level.
EUR/USD
EUR/USD traded within a relatively narrow range throughout the week, with the 1.14 level continuing to serve as an important support zone for market participants. Sentiment shifted slightly following a weaker-than-expected U.S. Non-Farm Payrolls report, which prompted investors to scale back expectations of further interest rate hikes by the Federal Reserve.
Despite this development, the broader outlook remains uncertain. A break below the previous week’s low could accelerate bearish momentum and pave the way for a decline toward the 1.12 level. On the upside, any recovery attempts should be approached cautiously until the pair can convincingly move above 1.15, ideally supported by a daily close above that threshold.
NZD/USD
NZD/USD posted solid gains for most of the week, although the pair began to lose momentum on Friday, suggesting that bullish sentiment may be fading. If the U.S. dollar strengthens broadly in the coming sessions, the New Zealand dollar could be among the currencies most vulnerable to a reversal.
The pair has remained trapped within a long-standing trading range, while New Zealand’s monetary policy outlook differs from that of several other major economies. The central bank has maintained a relatively less hawkish stance, which could limit the kiwi’s upside potential. Given these factors, bearish opportunities may emerge if further signs of weakness develop. Additionally, Friday’s price action resembles a shooting star candlestick pattern, often viewed as a warning of potential downside pressure, making it a technical signal worth monitoring closely.
USD/CAD
USD/CAD traded largely sideways throughout the week, reflecting a period of consolidation after recent moves. While the pair may appear somewhat stretched in the short term, price action is likely to remain volatile given the close economic relationship between the United States and Canada.
Although the latest U.S. employment data came in weaker than expected, broader fundamentals continue to support the U.S. dollar. At the same time, concerns over the Canadian economy’s performance may limit the Canadian dollar’s strength. As a result, any near-term pullback in USD/CAD could present buying opportunities, particularly if the pair declines toward the key 1.40 support area, where demand may re-emerge.
GBP/USD
GBP/USD delivered a strong performance during the week, advancing above the 1.33 level and testing the 50-week Exponential Moving Average (EMA). A decisive break above this week’s high, near 1.34, could reinforce bullish momentum and pave the way for a move toward the 1.35 area.
The pair has spent an extended period trading within a range, making the recent recovery a relatively natural development. The British pound has also demonstrated greater resilience against the U.S. dollar compared with several other major currencies. Should the U.S. dollar come under renewed selling pressure, sterling could emerge as one of the primary beneficiaries. Conversely, even if the dollar regains strength, the current market structure offers little incentive for a bearish outlook on GBP/USD, as the pair continues to show underlying support and positive momentum.
Silver
Silver experienced considerable volatility throughout the week, with price action remaining choppy and directionless. The $60 level continues to act as a key psychological resistance zone, creating a significant hurdle for any sustained upward movement.
Despite periodic rebounds, the broader technical picture remains cautious following the recent formation of a new swing low. This suggests that rallies may continue to face selling pressure, particularly if bullish momentum begins to fade. From a technical perspective, the 50-week Exponential Moving Average (EMA), currently near $64.36, represents an important resistance area and may serve as the primary upside barrier in the near term. Until silver can break convincingly above this level, the market is likely to remain vulnerable to further downside pressure.
Gold
Gold has shown signs of improvement over the past several weeks, with prices recovering and attempting to build a stronger foundation. The market is now approaching the 50-week Exponential Moving Average (EMA), a key technical level that could determine the next major move. A successful breakout above this resistance may strengthen bullish momentum and open the door for a rally toward the $4,400 level.
On the downside, a decline below the $3,900 support zone would likely weaken the outlook and increase the risk of a deeper correction toward $3,500. Overall, gold appears to be in the process of establishing a long-term bottom, although confirmation is still needed. Traders should continue to monitor the performance of the U.S. dollar, as further dollar weakness could provide additional support for gold prices and enhance the prospects for a sustained recovery.
The Nasdaq 100
The Nasdaq 100 advanced for most of the week, continuing to reflect the market’s underlying strength. However, trading activity was shortened due to the market closure on Friday, which slightly distorts the weekly candlestick. Additionally, Thursday’s session was heavily influenced by the release of the U.S. Non-Farm Payrolls report. While the data came in weaker than expected, the impact does not appear severe enough to significantly alter the broader market outlook.
Looking ahead, the index may enter a period of consolidation following its substantial gains over the past several months. Rather than expecting an immediate continuation of the rally, a sideways trading phase could help absorb recent gains and establish a stronger foundation for future advances. Within this context, short-term pullbacks may present attractive buying opportunities, as the longer-term trend remains constructive and investor sentiment continues to favor equities.
Energy – Brent Forward Curve Signals Improving Supply Conditions
The oil market is heading for a fourth straight weekly decline as traffic through the Strait of Hormuz continues to recover. Rising crude flows are placing increasing pressure on the front end of the ICE Brent forward curve, which has been shifting deeper into contango—a market structure often associated with ample near-term supply. The return of disrupted barrels, combined with ongoing releases from strategic petroleum reserves, has improved supply availability. However, lower outright prices and a contango market structure may begin attracting additional buying interest.
In the ARA hub, data from Insight Global showed total refined product inventories declined by 22,000 tonnes week-on-week to 4.53 million tonnes. The decrease was mainly driven by lighter products, with gasoline and naphtha stocks dropping by 75,000 tonnes and 26,000 tonnes, respectively. Meanwhile, middle distillates posted gains, as jet fuel inventories increased by 66,000 tonnes and gasoil stocks rose by 16,000 tonnes.
Singapore’s refined product inventories also moved lower, falling by 1.73 million barrels to 40.45 million barrels. Although stock levels remain below the five-year average of 45.32 million barrels, they have recovered significantly from early-June lows of 34.41 million barrels. Declines were recorded across all major categories, with light products, middle distillates, and residual fuels decreasing by 665,000 barrels, 420,000 barrels, and 648,000 barrels, respectively.
In the natural gas market, front-month Henry Hub futures came under pressure after U.S. storage data showed a larger-than-expected build. Gas inventories increased by 87 billion cubic feet last week, surpassing both market expectations of 84 bcf and the five-year average increase of 64 bcf. Nevertheless, persistent heatwaves across parts of the United States are expected to support gas demand for electricity generation as cooling requirements remain elevated.
Metals – Aluminium Retreats as Supply Concerns Ease
LME aluminium prices weakened again, with three-month contracts slipping toward $3,000 per tonne as traders continued to remove the geopolitical risk premium that had accumulated during the Middle East conflict.
Market sentiment was dampened by an update from Emirates Global Aluminium (EGA), which announced that approximately 7% of production pots at its Al Taweelah smelter have been restarted. The progress highlights a gradual recovery in output following missile and drone attacks that disrupted operations earlier this year.
The development strengthened expectations that supply interruptions in the Gulf region will be temporary. Earlier fears of production losses and shipping disruptions through the Strait of Hormuz had fueled a strong rally in aluminium prices. However, improving production levels and easing geopolitical tensions have significantly enhanced the supply outlook.
Although a large share of Al Taweelah’s capacity remains offline and a complete recovery is still some distance away, the latest progress indicates that lost supply is steadily returning to the market, helping to alleviate concerns about aluminium availability.
Precious Metals – Gold Advances on Softer U.S. Economic Data
Gold posted strong gains after weaker-than-expected U.S. employment figures reduced concerns that the Federal Reserve might need to tighten monetary policy further this year. The softer labor market data pushed both Treasury yields and the U.S. dollar lower, increasing the attractiveness of non-yielding assets such as gold.
The rally extended gains already supported by less hawkish remarks from Fed Chair Kevin Warsh earlier in the week. Investors are increasingly reassessing the trajectory of U.S. monetary policy, with upcoming economic releases likely to play a crucial role in determining whether labor market weakness persists. Continued moderation in economic activity could lessen pressure on the Fed to raise rates, providing further support for gold prices.
Central banks also remained significant buyers of gold in May, purchasing a net 41 tonnes according to the World Gold Council. Poland led acquisitions with 18 tonnes, bringing its purchases for the year to 64 tonnes. China continued its long-running accumulation strategy, adding 10 tonnes and extending its buying streak to 20 consecutive months. Uzbekistan and Kazakhstan increased their reserves by 9 tonnes and 7 tonnes, respectively.
In contrast, Russia was a net seller, reducing its gold holdings by 6 tonnes during May and bringing year-to-date sales to 34 tonnes. Turkey also trimmed reserves by 3 tonnes, resulting in total sales of 81 tonnes so far this year. Despite these sales, robust demand from central banks continues to provide a strong underlying foundation for the gold market.
Investors constantly face a simple but important choice: follow evidence-based investing principles, or follow emotions that merely feel safer.
That choice becomes especially clear during a major liquidity event. Whether the money comes from a year-end bonus, an inheritance, or the sale of a business or property, the same question always appears: should you invest the full amount immediately, or gradually enter the market through dollar-cost averaging (DCA)?
Historically and mathematically, the evidence strongly favors one approach: invest the money immediately.
Of course, the challenge is psychological. Many investors are naturally uncomfortable with volatility and prefer the emotional comfort of easing into the market over time. Spreading investments out can reduce anxiety, but historically it has also reduced long-term returns.
A perfect example came in early 2020. Imagine receiving a $100,000 inheritance in January and investing the entire amount right away. Just weeks later, the COVID-19 pandemic triggered one of the fastest market crashes in modern history, with the S&P 500 falling roughly 32% in a matter of months.
For many people, watching that decline would have been deeply stressful.
But fast forward to today, with the market dramatically higher than pre-pandemic levels, and the investor who stayed fully invested would likely have significantly outperformed someone who slowly averaged into the market over a year or two.
The reason is simple: more money spent more time compounding in the market. Over long periods, markets have historically trended upward despite short-term volatility.
This conclusion is not based on opinion or investing folklore. It is backed by decades of historical research. One of the most widely cited studies on the subject comes from Vanguard’s paper, Cost Averaging: Invest Now or Temporarily Hold Your Cash. After analyzing long-term market data, the researchers concluded that the opportunity cost of holding cash generally outweighs the emotional benefits of gradual investing.
Even for highly risk-averse investors, Vanguard suggested that if dollar-cost averaging is used, the investment period should remain relatively short—around three months—to reduce missed market exposure.
When investing meaningful long-term capital, the biggest advantage often comes from time in the market rather than timing the market. While gradual investing may feel more comfortable emotionally, history suggests that committing capital early has typically been the more effective strategy.
Bitcoin investors are unlikely to remember June 2026 positively. The world’s largest cryptocurrency ended the month down more than 20%, pressured by persistent inflation, shifting Federal Reserve expectations, and an unprecedented wave of institutional selling through spot Bitcoin exchange-traded funds (ETFs).
By June 25, Bitcoin had fallen to an intraday low of $58,188 — its weakest level since September 2024 and more than 53% below its October all-time high of $126,198.
The wider crypto market suffered alongside it. Total cryptocurrency market capitalization dropped to $2.1 trillion by the end of June, down sharply from the $4.3 trillion peak recorded in October 2025. Bitcoin’s year-to-date decline widened to 34%, while its market dominance rose to roughly 55.6% as altcoins experienced even steeper losses. June’s sharp selloff, however, was not triggered by a crypto-specific event. Instead, it stemmed from a critical U.S. inflation report.
The Inflation Report That Shook Markets
On June 25, investors received a harsh macroeconomic reality check. May’s Personal Consumption Expenditures (PCE) price index — the Federal Reserve’s preferred inflation gauge — came in significantly hotter than expected. Headline inflation climbed to 4.1% year-over-year, its highest level since April 2023 and more than double the Fed’s 2% target. Core PCE, which excludes food and energy, rose to 3.4%, also marking a multi-year high.
Major financial institutions quickly revised their forecasts. Bank of America now expects three consecutive 25-basis-point rate hikes in September, October, and December, potentially lifting the federal funds rate to between 4.25% and 4.50%, up from the current 3.50%–3.75% range. Deutsche Bank projected two rate hikes beginning in September, while Goldman Sachs pushed its expectations for rate cuts back to 2027.
For Bitcoin, the environment became increasingly unfavorable. Higher interest rates tend to attract capital toward safer, yield-generating assets while reducing appetite for speculative investments. Within a day of the inflation release, more than $1.48 billion in crypto positions were liquidated, including approximately $665 million tied to Bitcoin alone.
Adding to the uncertainty, new Federal Reserve Chairman Kevin Warsh abandoned the Fed’s previous practice of forward guidance, leaving markets highly sensitive to every inflation reading. Although the Federal Open Market Committee held rates steady during its June meeting, officials removed any indication that future rate cuts were still on the table.
ETF Outflows Become the Main Story
Beyond macroeconomic pressures, June’s most significant development unfolded inside the spot Bitcoin ETF market.
According to SoSoValue, U.S. spot Bitcoin ETFs recorded $4.06 billion in net outflows during June 2026 — the largest monthly redemption since the products launched in January 2024. The figure surpassed the prior record of $3.56 billion set in February 2025. In the final week of June alone, investors withdrew $1.79 billion. Combined with May’s $2.43 billion in outflows, ETF flows for the year have now turned negative overall.
BlackRock’s NASDAQ:IBIT accounted for the majority of the withdrawals, losing roughly $3.3 billion — about 75% of June’s total outflows. On June 26 alone, the fund saw $444.5 million redeemed in a single trading session, matching the combined outflows from every other spot Bitcoin ETF that day.
Meanwhile, Fidelity Investments’s NYSE:FBTC lost $456 million during the month, while Grayscale Investments’s NYSE:GBTC recorded $303 million in redemptions.
Overall, ETF issuers are estimated to have sold around 51,726 Bitcoin — worth approximately $5 billion — over a 30-day period as authorized participants liquidated holdings to satisfy redemption demand. Just months earlier, the iShares Bitcoin Trust had been the dominant source of inflows into the category. By late June, it had effectively become the market’s primary exit route.
Signs of Stabilization Remain
Despite the heavy losses, not every indicator points toward further downside.
On-chain data suggests long-term holders have continued accumulating Bitcoin near the $58,000 level. Geoff Kendrick of Standard Chartered has argued that the recent ETF outflows appear cyclical rather than structural. In addition, the Crypto Fear and Greed Index fell to 11 — firmly within “Extreme Fear” territory — a level that has historically aligned with market bottoms rather than the beginning of extended downturns.
Strategy, formerly known as MicroStrategy, still holds 847,363 Bitcoin and remains one of the largest corporate Bitcoin owners globally. However, the company’s disclosure that it sold 32 Bitcoin to fund dividend obligations — its first net sale in years — added another layer of uncertainty to an already fragile market environment.
Attention now shifts to July 29, when the Federal Open Market Committee meets again under Chairman Warsh. With CME FedWatch data implying more than a 37% probability of another rate hike by December, the market will likely scrutinize the tone of the meeting as closely as the decision itself.
June ultimately served as a reminder that while the ETF era opened Bitcoin to institutional capital, institutional investors can reverse course just as quickly.
Gold price inches higher toward $4,125 during Friday’s Asian trading session.
Weaker-than-expected US Nonfarm Payrolls, which rose by just 57,000 in June, supported the precious metal.
Meanwhile, geopolitical tensions persisted after the latest round of indirect US-Iran talks ended Wednesday without meaningful progress toward a lasting peace agreement.
Gold price (XAU/USD) advanced to around $4,125 during Friday’s early Asian session, extending its upward momentum after softer-than-expected US Nonfarm Payrolls (NFP) data dampened expectations for further Federal Reserve (Fed) rate hikes this year.
According to data released by the US Bureau of Labor Statistics (BLS) on Thursday, the US economy added just 57,000 jobs in June, well below market forecasts of 110,000. Meanwhile, the Unemployment Rate eased to 4.2% from 4.3% in May. The report followed Wednesday’s weaker US private payrolls figures, which also pointed to slowing labor market momentum.
“The weaker jobs data reduces the likelihood of additional rate hikes later this year. Gold typically performs better in a lower interest rate environment,” said David Meger, director of metals trading at High Ridge Futures. He added that the disappointing employment data triggered a strong rally in the gold market.
At the same time, geopolitical tensions remained elevated after indirect talks between the US and Iran ended on Wednesday without any meaningful progress toward a lasting peace agreement, according to Reuters. Ongoing uncertainty in the Middle East could fuel inflation concerns, potentially reviving expectations for tighter monetary policy and limiting gains in non-yielding assets such as gold.
Silver is poised for a strong rebound amid a softer Fed outlook, easing inflation concerns, and weaker oil prices.
Silver gains momentum as signs of a slowing US labor market prompt investors to reassess the path of interest rates.
According to the CME FedWatch tool, the probability of a September rate hike fell to 52% from 66% following the latest data release.
Silver prices extended gains for a fourth straight session on Friday, with XAG/USD trading near $62.60 per troy ounce during Asian trading hours. A softer inflation outlook, weaker oil prices, and a less aggressive Federal Reserve are providing strong support for the non-yielding metal’s recovery.
Silver is attracting renewed buying interest as signs of a slowing US labor market prompt investors to sharply reassess the outlook for interest rates. The shift in sentiment followed Thursday’s June Nonfarm Payrolls (NFP) report, which showed the US economy added only 57,000 jobs, well below expectations of 110,000. Although the unemployment rate unexpectedly edged down to 4.2% from 4.3% in May, the weak hiring figures reinforced concerns about broader economic cooling.
In response, traders pared back expectations for tighter monetary policy. Data from the CME FedWatch tool showed the probability of a September rate hike falling to 52%, compared with 66% before the jobs report.
Additional support came from recent comments by Federal Reserve Chair Kevin Warsh at the ECB Sintra Conference, where he reiterated the Fed’s commitment to its 2% inflation target while noting that inflation pressures and expectations have eased in recent weeks.
Silver is also benefiting from declining energy prices, which are helping reduce inflationary pressures. Crude oil prices have weakened as shipping activity through the Strait of Hormuz continues to normalize following progress in US-Iran diplomatic negotiations in Doha. The easing geopolitical tensions have reduced the risk premium that had previously supported energy markets.
The US Dollar edged lower toward the 100.80 level as traders slightly scaled back expectations for a hawkish Federal Reserve.
The US economy added 57K new jobs in June, falling short of the 110K forecast.
Investors are now turning their attention to the US ISM Services PMI report, scheduled for release on Monday.
The US Dollar Index (DXY), which measures the Greenback against a basket of six major currencies, edged slightly lower to around 100.80 during Friday’s Asian session. The US Dollar faced renewed pressure after traders scaled back expectations for a hawkish Federal Reserve following the release of June’s United States Nonfarm Payrolls (NFP) report on Thursday.
Data from the CME FedWatch Tool showed that the probability of the Fed delivering at least one interest rate hike at the September meeting fell to 53.2%, down from nearly 64% on Wednesday.
Market participants reduced hawkish Fed expectations after the June NFP figures came in well below forecasts. The US economy added 57K jobs during the month, significantly missing the 110K estimate. In addition, May’s payrolls figure was revised lower to 129K from the previously reported 172K. Despite the weaker hiring data, the Unemployment Rate declined to 4.2%, compared with expectations and the prior reading of 4.3%.
Meanwhile, Average Hourly Earnings — a key indicator of wage growth — increased 3.5% year-over-year, matching market expectations and improving from the previous 3.4% reading.
Looking ahead, investors will closely monitor the US ISM Services PMI report for June, due on Monday. The data is expected to be a key driver for the US Dollar, as the services sector represents roughly two-thirds of the US economy.
WTI crude continues to trade lower below the $68.00 level as investors remain optimistic that diplomatic negotiations will bring an end to the conflict between the United States and Iran. Reports from Qatari mediators indicate that talks held in Doha this week have made meaningful progress, easing concerns over potential supply disruptions. Adding to the bearish pressure, Reuters reported that OPEC+ is considering raising output by 188,000 barrels per day in August, further improving the global supply outlook.
Crude oil prices continued to move lower on Thursday as signs of progress in diplomatic efforts between the United States and Iran reduced concerns about potential supply disruptions. West Texas Intermediate (WTI), the US benchmark crude grade, slipped below the $68.00 mark and was trading around $67.80 at the time of writing, its lowest level since the conflict began in February.
According to Qatar’s Foreign Ministry, indirect negotiations held in Doha earlier this week produced encouraging results. Officials stated that both sides made headway on matters related to the memorandum that ended hostilities in June and were building on discussions initiated during a recent summit in Switzerland.
Uncertainty Remains Despite Diplomatic Progress
While reports suggest the talks are moving in a constructive direction, key details remain limited. US President Donald Trump said the negotiations yielded progress regarding potential restrictions on Iran’s nuclear program, adding that efforts toward denuclearization were advancing positively. However, US Vice President JD Vance indicated that nuclear-related issues would likely be addressed in future discussions.
Meanwhile, Iran’s Deputy Foreign Minister Kazem Gharibabadi stated that both parties had agreed to establish a communication mechanism to monitor and report any violations of the existing memorandum of understanding.
A major source of uncertainty remains the Strait of Hormuz. Although shipping activity through the vital waterway has increased since the ceasefire, traffic levels remain well below pre-conflict norms, suggesting that full normalization has yet to occur.
On the supply side, oil prices also came under pressure after reports that the OPEC+ alliance is considering raising production quotas by 188,000 barrels per day in August. Expectations of additional supply entering the market have further weighed on crude prices, reinforcing the bearish sentiment driven by easing geopolitical risks.
Gold remains supported for a second consecutive session as the US dollar edges lower. However, expectations for further Fed tightening and lingering geopolitical tensions involving Iran may limit losses in the greenback and restrain upside in the precious metal. Traders are also likely to stay cautious ahead of the closely watched US Nonfarm Payrolls report.
Gold prices (XAU/USD) edged higher on Thursday, climbing to a fresh daily high during the European session as a modest pullback in the US dollar provided support. However, gains remained limited as expectations for further Federal Reserve tightening and ongoing geopolitical tensions continued to underpin the greenback, keeping bullion largely within the previous day’s trading range. Investors also appeared cautious ahead of the highly anticipated US Nonfarm Payrolls (NFP) report.
The dollar came under mild pressure after weaker-than-expected US economic data. According to ADP, private-sector employment increased by 98,000 jobs in June, falling short of forecasts for 113,000 and slowing from May’s 122,000 gain. Meanwhile, the ISM Manufacturing PMI slipped to 53.3 from 54.0, signaling a moderation in manufacturing activity. The report also showed a notable decline in the Prices Paid Index to 73.0 from 82.1, suggesting easing cost pressures, while the Employment Index improved slightly to 49.7 from 48.6. Combined with the recent decline in crude oil prices, these developments have helped reduce near-term inflation concerns and weighed on the US dollar, offering support to gold.
Despite the softer data, markets continue to expect further Fed tightening. The CME FedWatch Tool shows traders pricing in roughly a 64% probability of a rate hike in September and nearly an 85% chance that borrowing costs will be increased before year-end. Those expectations were reinforced by comments from Kevin Warsh, who reiterated the Fed’s commitment to its 2% inflation target and dismissed expectations of a shift toward looser monetary policy despite calls from Donald Trump for lower interest rates. Several Fed officials have also suggested that rates may need to remain elevated for longer, a factor that should continue to support the dollar and limit upside potential for non-yielding assets such as gold.
Geopolitical developments are also influencing market sentiment. Indirect negotiations between the United States and Iran in Qatar ended without meaningful progress toward easing tensions surrounding the strategically important Strait of Hormuz. At the same time, Russia launched a new wave of missile and drone attacks on Ukraine, keeping geopolitical risks elevated and maintaining demand for safe-haven assets.
Looking ahead, attention now turns to the US Nonfarm Payrolls report. As one of the Fed’s most closely watched indicators, the employment data could significantly influence expectations for future interest-rate moves, shaping the near-term direction of both the US dollar and gold prices.
XAU/USD Technical Analysis: Recovery Attempts Face Resistance Within Bearish Structure
From a technical standpoint, gold remains vulnerable despite its recent rebound. The latest short-covering rally stalled near the 38.2% Fibonacci retracement of the decline recorded over the past two weeks, suggesting that buyers are struggling to regain control. In addition, XAU/USD continues to trade below its 100-period Simple Moving Average (SMA) on the 4-hour chart, keeping the broader near-term outlook tilted to the downside.
That said, momentum indicators have improved. The MACD remains in positive territory and is trending higher, while the Relative Strength Index (RSI) holds near 54, indicating modest bullish momentum without entering overbought conditions. Gold’s ability to sustain gains above the 23.6% Fibonacci retracement level also supports the possibility of further recovery, although any advance is likely to remain constrained unless key resistance levels are broken.
On the upside, the first hurdle is the 38.2% Fibonacci retracement at $4,112.32. A decisive move above this level could open the door toward the 100-period SMA at $4,145.47, followed by the 50% retracement level at $4,164.62. Beyond that, resistance is seen at the 61.8% Fibonacci level near $4,216.91, then the 78.6% retracement at $4,291.37, with the record high around $4,386.20 representing the ultimate bullish target.
On the downside, immediate support lies at the 23.6% Fibonacci retracement around $4,047.62, a level recently reclaimed by buyers. Failure to hold above this zone would weaken the recovery narrative and expose the key support area near the recent swing low of $3,943.03.
Overall, while improving momentum indicators suggest scope for additional upside corrections, gold remains trapped within a broader bearish technical framework as long as it trades below the 100-period SMA and fails to break above the $4,112–$4,145 resistance zone. A move beyond that area would be needed to shift the near-term outlook toward a more constructive stance.
The US Dollar Index (DXY) edged lower to around 101.20 during Thursday’s early European trading session. Despite the pullback, the near-term outlook remains constructive, supported by bullish momentum signals from the RSI.
From a technical perspective, 101.80 serves as the immediate resistance level. A decisive break above this barrier could reinforce the bullish bias, while initial support is seen at 101.05, the first downside target should selling pressure intensify.
The US Dollar Index (DXY), which measures the value of the US Dollar against a basket of six major currencies, traded around 101.20 during Thursday’s early European session. The greenback softened as investors adopted a cautious stance ahead of the release of the closely watched June US employment report, the key macroeconomic event on Thursday’s calendar.
Economists expect the Nonfarm Payrolls (NFP) report to show that the US economy added 110,000 jobs in June, while the unemployment rate is forecast to remain unchanged at 4.3%. A weaker-than-anticipated labor market reading could weigh on the US Dollar and increase expectations for Federal Reserve policy easing.
However, the downside may be limited if the data surprises to the upside. According to Akihiko Yokoo, Senior Analyst at Mitsubishi UFJ Bank, stronger-than-expected payroll figures could provide fresh support for the greenback and trigger a renewed upward move in the currency. He noted that a positive labor market surprise could encourage a rebound in the US Dollar as market participants reassess the outlook for US interest rates.
Technical Analysis
From a technical standpoint, the US Dollar Index (DXY) maintains a constructive near-term outlook. On the daily chart, the index continues to trade above both its 20-day Bollinger Band midpoint and the 100-day moving average, signaling that the broader bullish trend remains intact. Meanwhile, the 14-day Relative Strength Index (RSI) is hovering around 65, indicating solid upward momentum without yet entering overbought territory.
On the upside, the first key resistance level is the June 24 high at 101.80. A sustained break above this barrier could open the door for a move toward the upper Bollinger Band near 102.00, where bullish momentum may begin to encounter profit-taking pressure.
On the downside, initial support is located at the June 30 low of 101.05. Further weakness could expose the Bollinger Band midpoint around 100.65, followed by stronger support near the lower Bollinger Band at 99.25 and the 100-day moving average at 99.20. A deeper decline toward this support cluster would be required to challenge the current bullish structure and shift the near-term outlook to a more neutral stance.
We expect ECB speakers at Sintra to broadly reinforce market expectations of another rate hike this year, following President Lagarde’s relatively balanced opening remarks. Meanwhile, the US dollar has continued to give back recent gains, with markets now turning their attention to upcoming data releases and Fed-related commentary, particularly Warsh’s speech at Sintra, which is expected to carry a hawkish tone. USD/JPY remains in the intervention zone, keeping Japanese authorities on alert.
USD: Losing Momentum Ahead of Key Data and Warsh
The dollar has softened against most G10 currencies, largely driven by improving risk sentiment as equities recover. Sentiment has also been supported by reports of renewed US–Iran negotiations despite recent geopolitical tensions. However, this risk-positive environment is weighing on traditional commodity-linked currencies such as the AUD, CAD, and NOK, as well as the yen. Even so, the recent decline in oil prices appears overstretched, and we still expect AUD and NOK to perform better into the summer, supported by carry and a more constructive energy outlook.
Attention now shifts to US data. We expect consumer confidence to come in above consensus at 97.5 versus 94.5, consistent with resilient US consumption. JOLTS job openings are forecast to edge lower to 7.25m (consensus 7.3m), which would still be consistent with a broadly healthy labor market given the vacancies-to-unemployment ratio remains above 1.0.
Overall, today’s data should be modestly supportive or neutral for the dollar. However, bullish momentum has clearly faded, and improved risk appetite limits upside potential for now, with markets instead looking to Warsh’s Sintra remarks and upcoming jobs data for clearer direction.
EUR: Sintra Likely to Be Uneventful for the Euro
Lagarde’s opening remarks suggested no meaningful shift in ECB communication strategy, reinforcing the view that Sintra is unlikely to trigger a repricing of policy expectations. She acknowledged a less urgent policy backdrop compared to 2022–2023 while noting continued economic resilience.
Nothing in this messaging is likely to materially alter expectations for another rate hike. We expect other ECB speakers to broadly support this view, even as recent sentiment data points to easing inflation pressures.
Upcoming eurozone CPI releases remain in focus. Spain surprised to the upside at 3.2%, France is expected to moderate to 2.0%, and Germany is forecast to hold steady at 2.6%. Overall, these figures are unlikely to significantly shift EUR direction.
We see downside risks for EUR/USD ahead of US data and Warsh’s speech, but continue to expect stabilization around or slightly above 1.140 rather than a retest of recent lows.
JPY: Approaching Intervention Territory
USD/JPY continues to trend higher, raising the risk of Japanese FX intervention. Authorities previously intervened heavily near 160, spending roughly $70bn when the pair moved above that level. The 162 area is widely viewed as a potential next line in the sand.
However, policymakers may prefer to wait for thinner liquidity conditions or key event risks before acting, including US holidays and upcoming macro catalysts such as Warsh’s speech and the US jobs report.
There is also a possibility that intervention is delayed toward mid-July, following seasonal patterns seen last year. Still, intervention would likely only slow the trend rather than reverse it, unless accompanied by a shift in BoJ policy or a broader turn in the US dollar cycle later in the year.
Bitcoin Breaks Below $60,000 as Bearish Structure Deepens
Bitcoin has slipped below the $60,000 threshold, reinforcing a deterioration in near-term market structure. BTC traded around $60,128 on Monday, briefly touching $59,748—its weakest level since October 2024. The move caps a month-long decline that has fully unwound the spring rally.
June opened near $73,674 and briefly topped at $74,092 before reversing sharply to a monthly low of $58,115, ending the month down ~18.4%. The key issue is not just the break of $60,000, but the loss of trend integrity: short-term moving averages are rolling over, and dip-buying has largely faded.
Despite strength in broader equities—particularly the Nasdaq, driven by AI-related momentum and easing geopolitical concerns—Bitcoin has failed to participate.
This divergence suggests BTC is currently behaving less like a macro hedge and more like a high-beta liquidity-sensitive risk asset competing for speculative flows. Capital rotation appears to be favoring AI infrastructure, large-cap tech, and IPO narratives, draining marginal demand from crypto.
Above 100-month EMA: $40,322 (long-term trend still intact)
Price action confirms sustained downside pressure, with weekly losses near 4.5% and monthly drawdown ~18%, alongside declining trend structure across shorter timeframes.
The market remains technically weak, though still within a cyclical correction rather than a structural breakdown.
Institutional Flows: ETF Demand Reversal Becomes Central Risk
A major shift has emerged in institutional positioning:
~ $5.96B net outflows from US spot Bitcoin ETFs over the past 30 days
Including a peak monthly redemption of ~$2.43B
Multiple large single-day withdrawals ($400–500M+), including a $1.26B outlier
Roughly $3.4B exited in a single week at peak stress
Given ETFs have become a dominant marginal price driver, this reversal materially weakens demand elasticity. Brief inflow days have not yet signaled trend reversal.
Sustained inflows would be required to stabilize price action; continued outflows would reinforce downside momentum.
Corporate Demand Weakens: Strategy Flywheel Under Pressure
The corporate accumulation narrative is also deteriorating.
Strategy, the largest corporate Bitcoin holder (~847,000 BTC), is now under pressure as BTC trades below its average cost basis. Its equity drawdown has reduced its premium-to-NAV, weakening its ability to raise capital for further accumulation.
More importantly, the firm has expanded financial flexibility to include potential Bitcoin sales for liquidity and buybacks—marking a meaningful shift away from its previous purely accumulation-driven stance.
Even if accumulation continues, the reflexive “buy-the-premium” flywheel that previously amplified demand is clearly impaired.
Derivatives markets have undergone a sharp deleveraging:
Open interest down ~19%
Majority of liquidations from long positions
Multi-billion-dollar cascading liquidation events during breakdown
This reset improves structural stability but removes a key source of reflexive upside (forced shorts and leverage expansion). Recovery now depends on genuine spot demand rather than positioning-driven flows.
Technical Structure: Bearish Alignment Across Timeframes
Bitcoin’s technical setup is aligned bearish across multiple horizons.
Price remains below all major short- and medium-term moving averages, including:
20-month EMA: $79,979
50-month EMA: $65,631 (critical level)
A sustained reclaim of $65,631 would materially weaken the bearish structure. Until then, rallies are corrective within a broader downtrend.
Shorter-term indicators reinforce weakness:
50-day MA (~$70,238) trending lower and acting as resistance
200-day MA rolling over
Most intraday averages flattening or declining above price
Price is also compressing between roughly $59,000–$61,000, suggesting volatility expansion risk rather than immediate resolution.
Key Levels: Downside Risk Remains Active
Critical support: $58,115
Break would confirm continuation of downtrend
Downside targets:
$55,000: secondary structural support
$48,000: deeper cycle retracement zone
The rising 100-month EMA (~$40,322) defines the long-term structural floor, consistent with a cyclical correction rather than full regime failure.
As long as $58,115 holds, rebound scenarios remain valid—but fragile.
Upside Structure: Heavy Resistance Cluster
Key resistance levels:
$62,500: initial supply zone
$64,178–$67,180: dense resistance cluster
$65,631: 50-month EMA (key structural pivot)
A reclaim of $65,631 would be the first meaningful signal of structural repair and open a path toward $70,000. Failure to reclaim it keeps rallies within corrective territory.
Momentum & Sentiment: Oversold, Not Reversed
Momentum remains weak across timeframes:
RSI: deeply depressed, near oversold on daily
MACD: negative with no confirmed bullish crossover
Breadth: broadly bearish across indicators
Sentiment sits at “Extreme Fear” (~18 on Fear & Greed Index), historically consistent with late-stage stress but not a timing signal on its own.
The core tension remains unresolved: sentiment is washed out, but price has not confirmed reversal.
Bottom Line
Bitcoin is in a structurally corrective phase driven by three reinforcing forces:






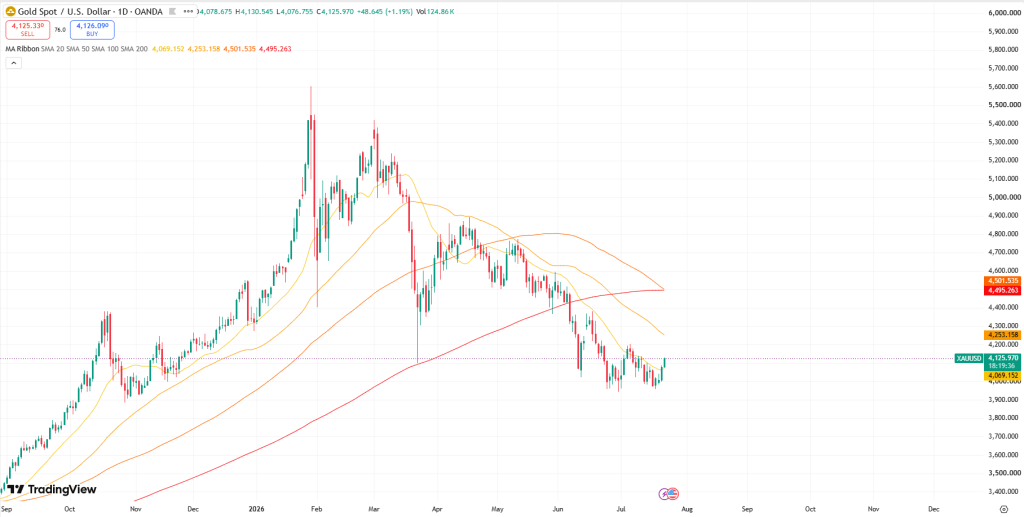

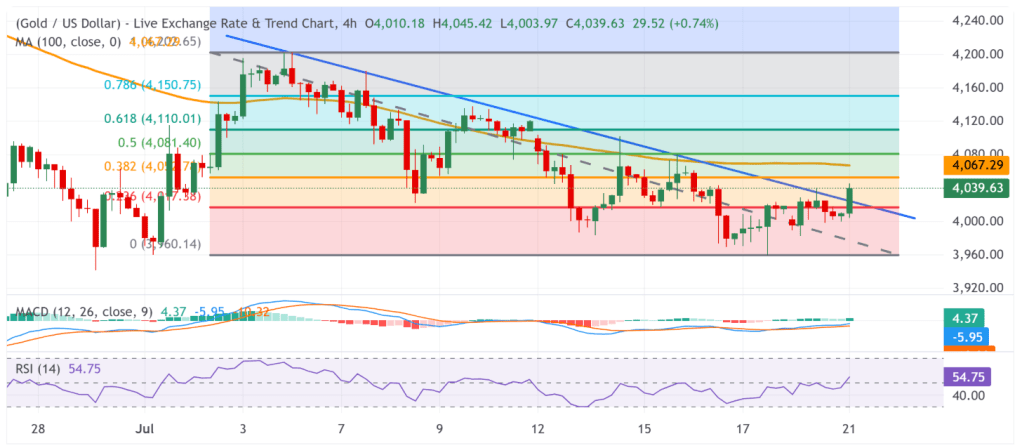
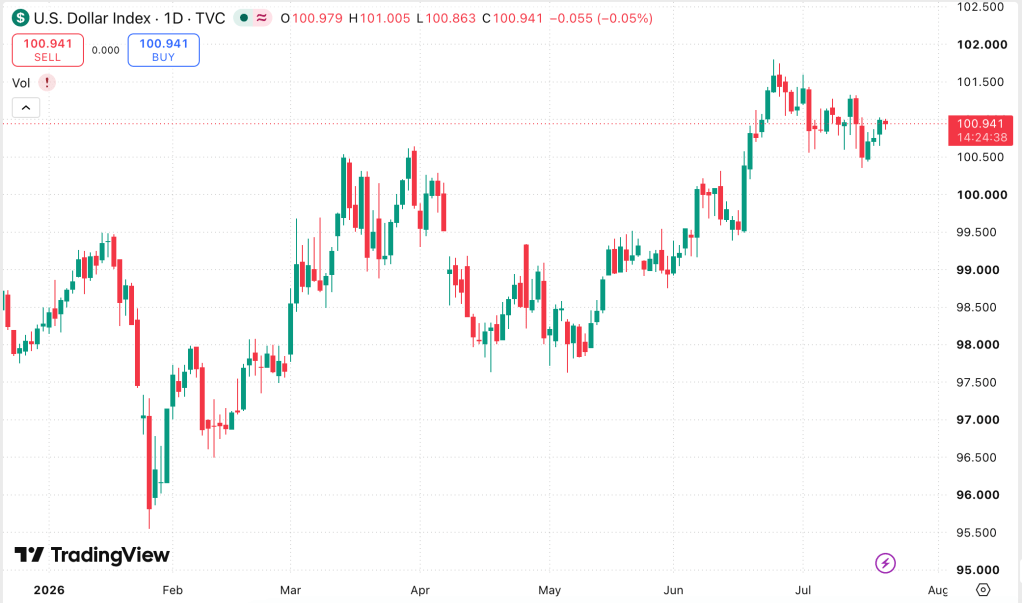
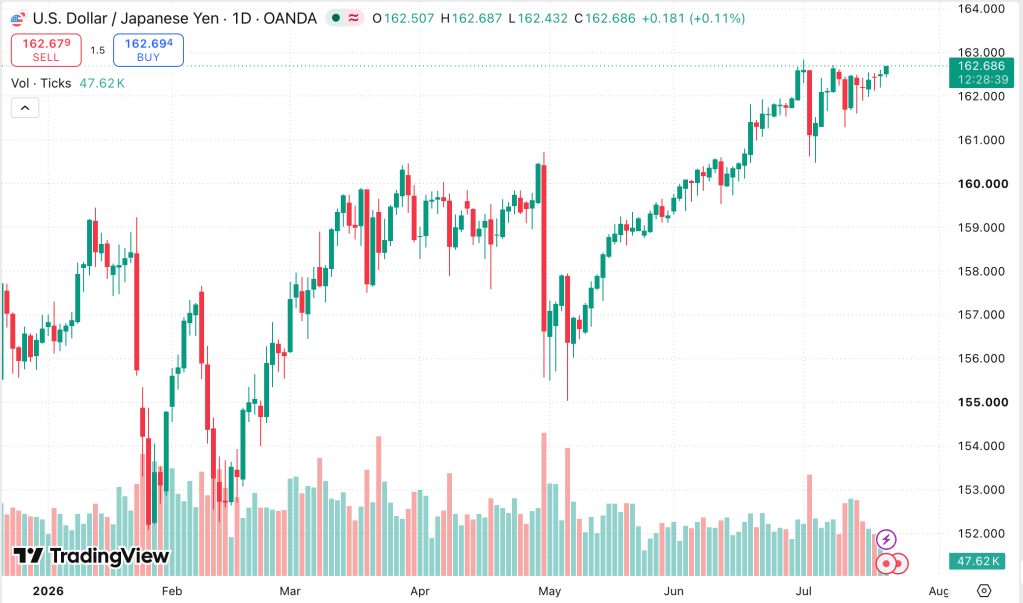


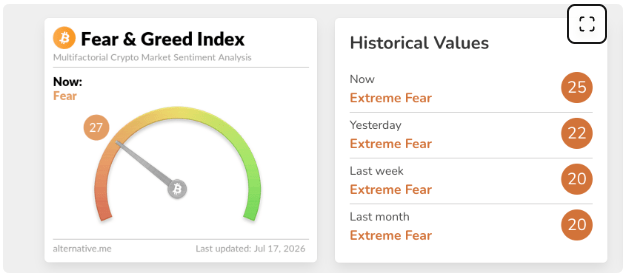
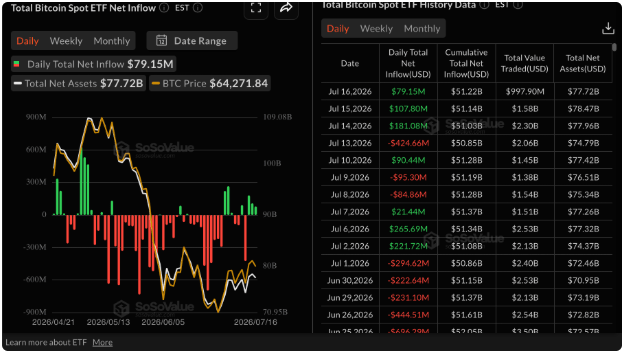
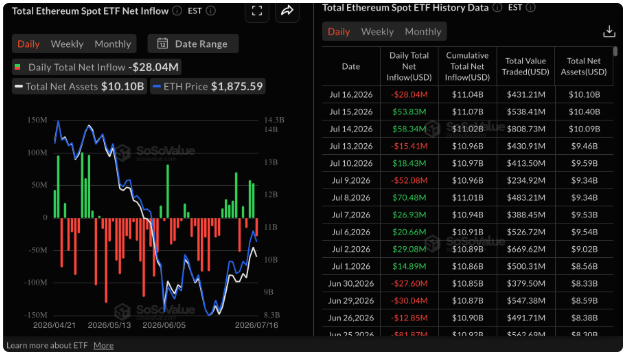
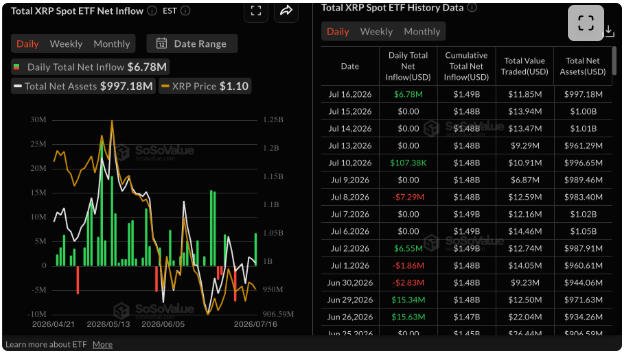
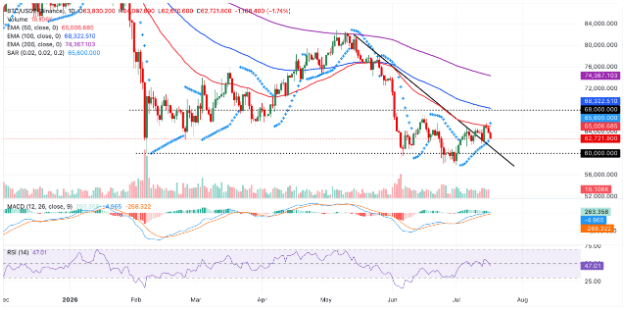
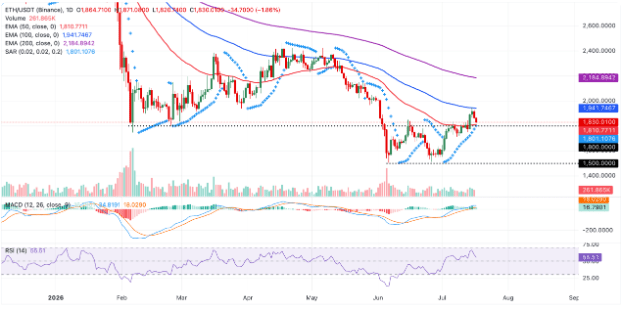
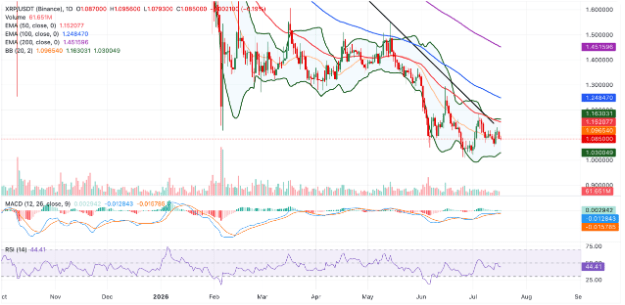
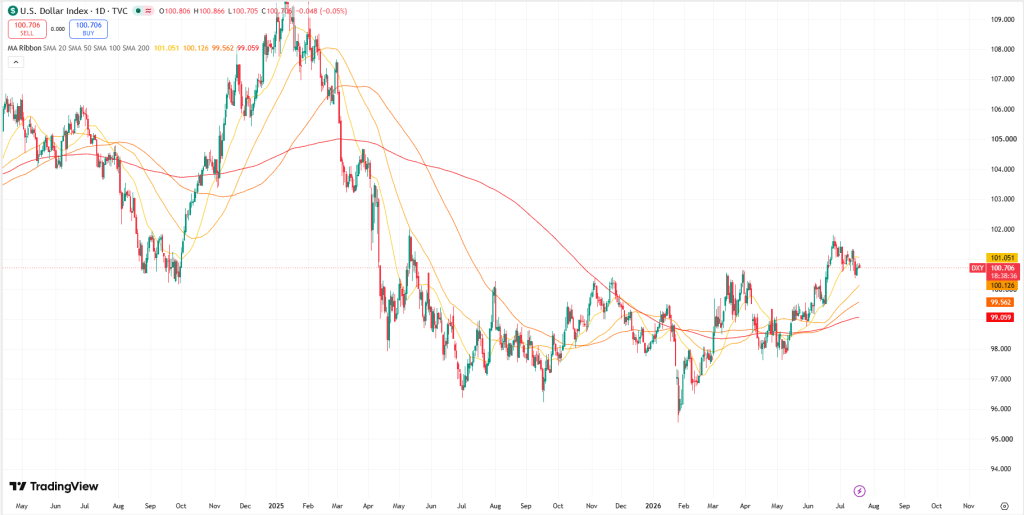
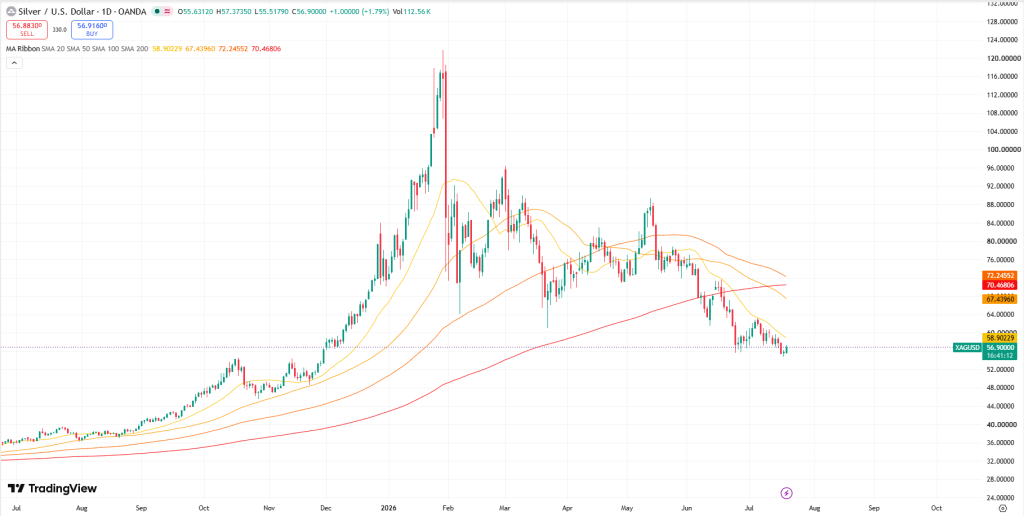
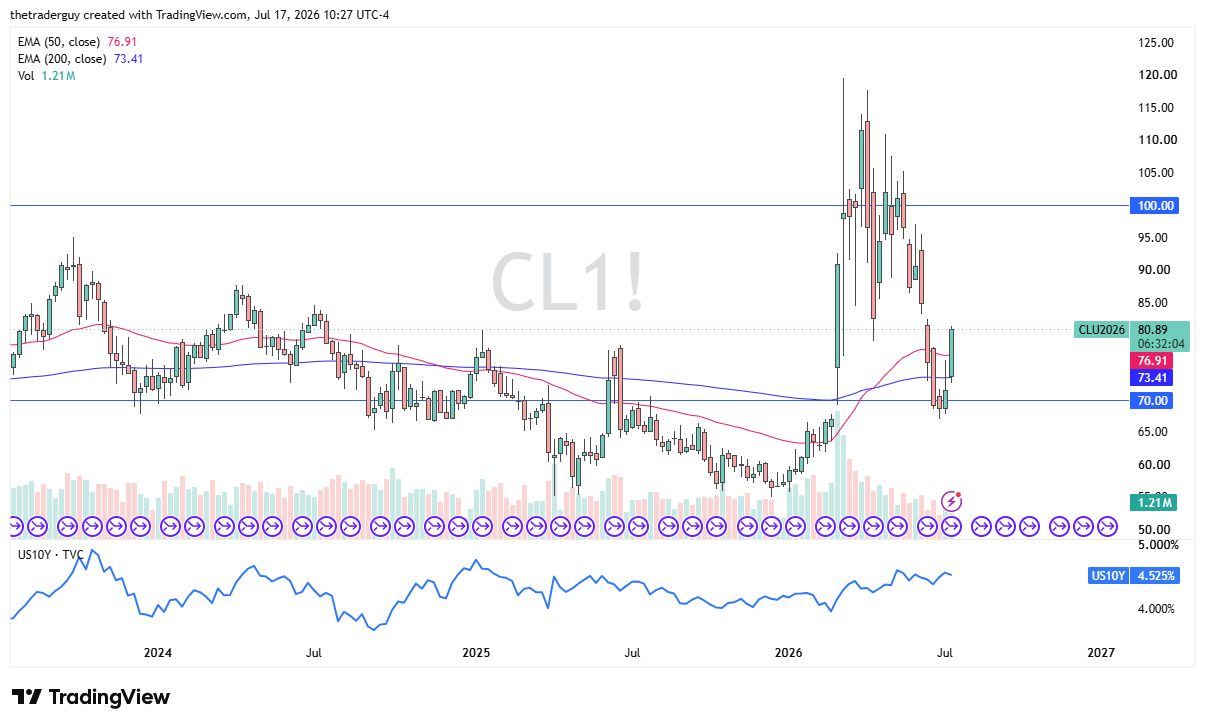
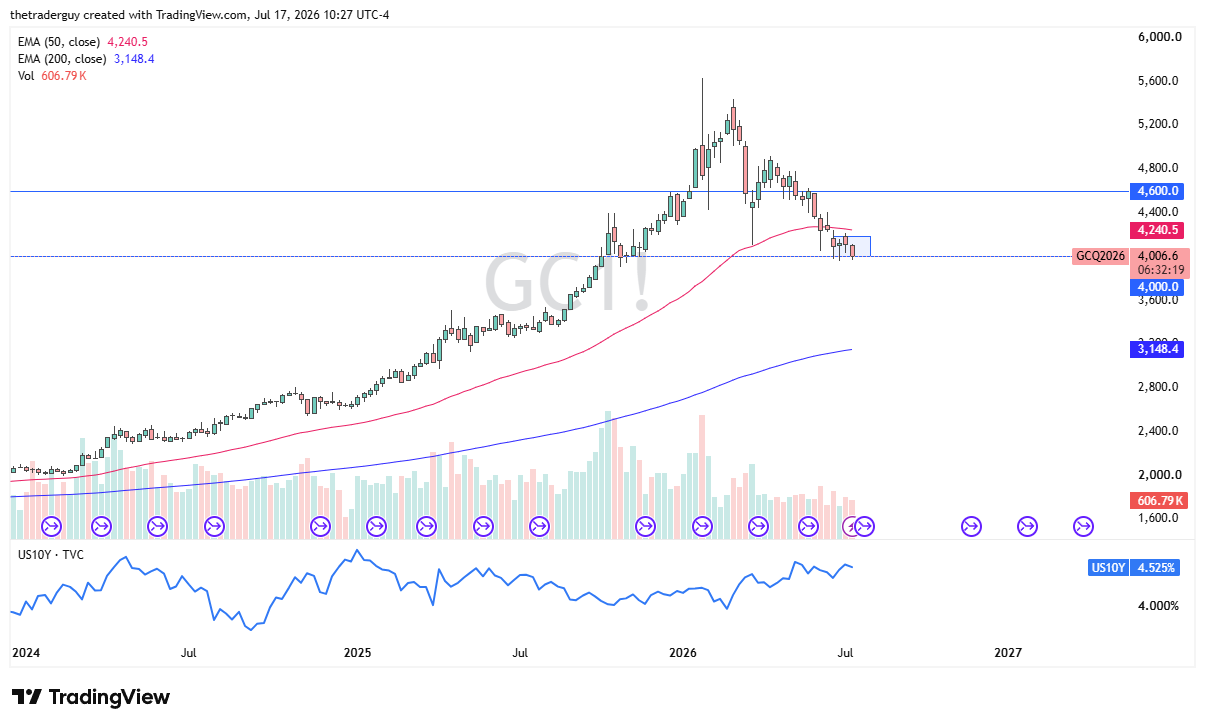
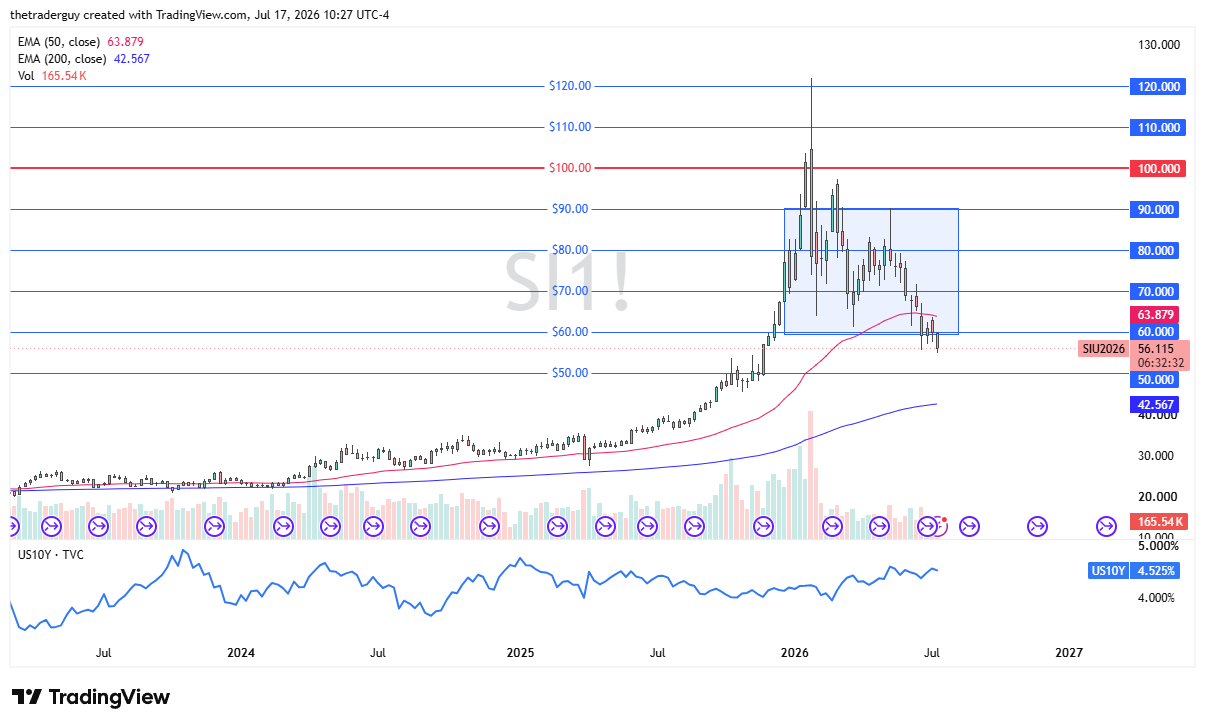
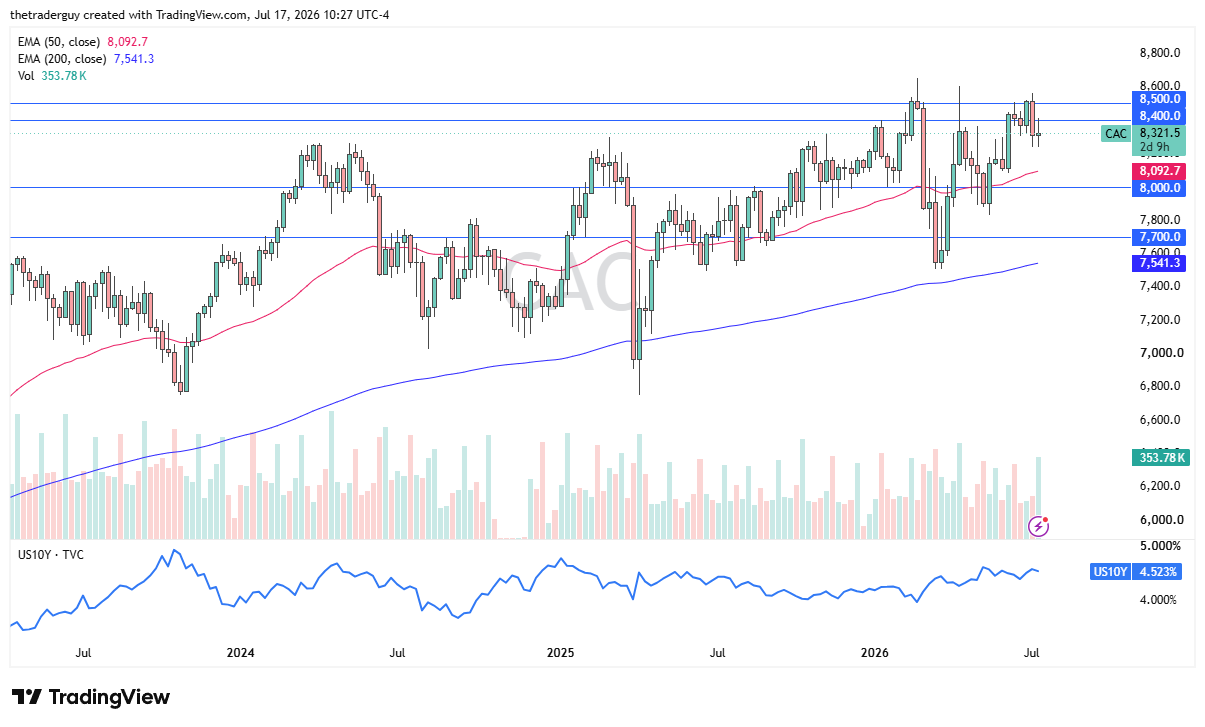
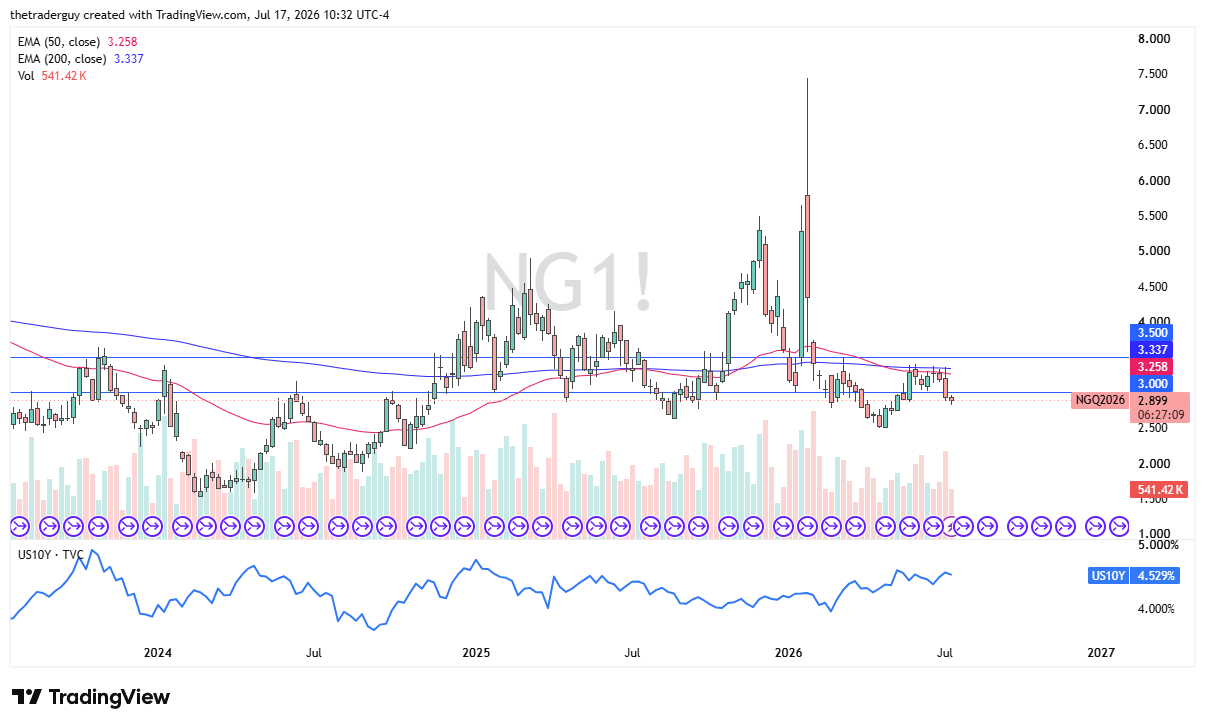
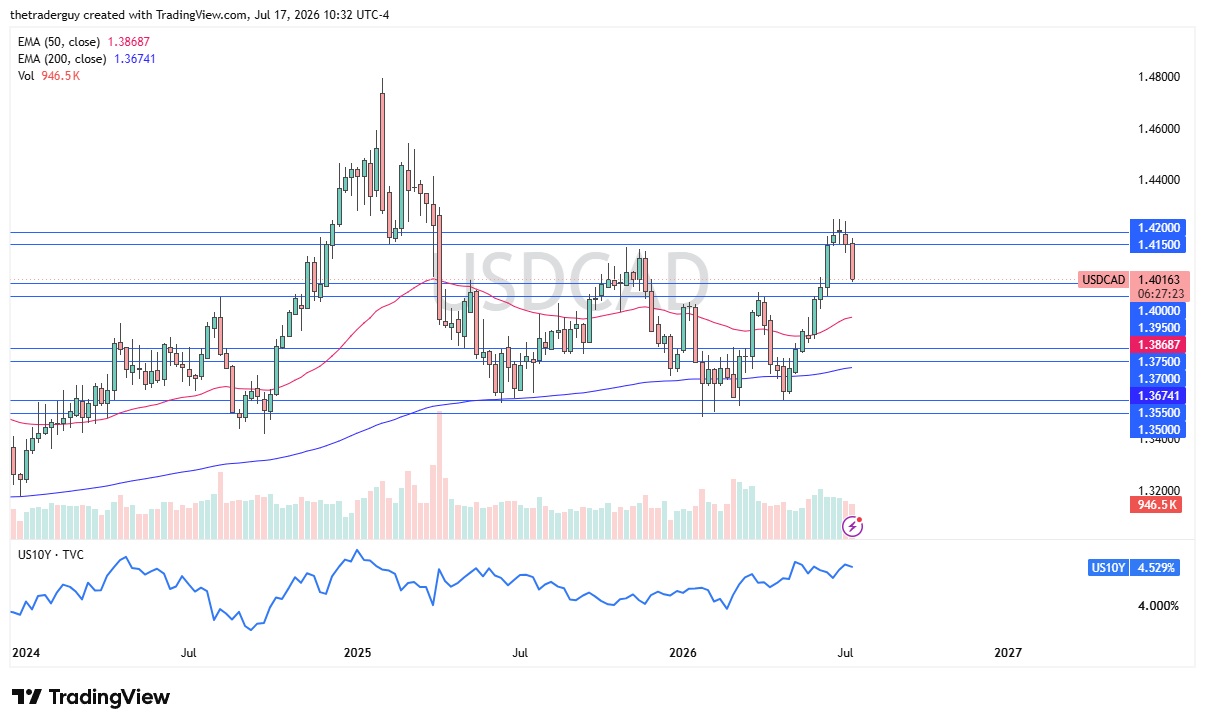
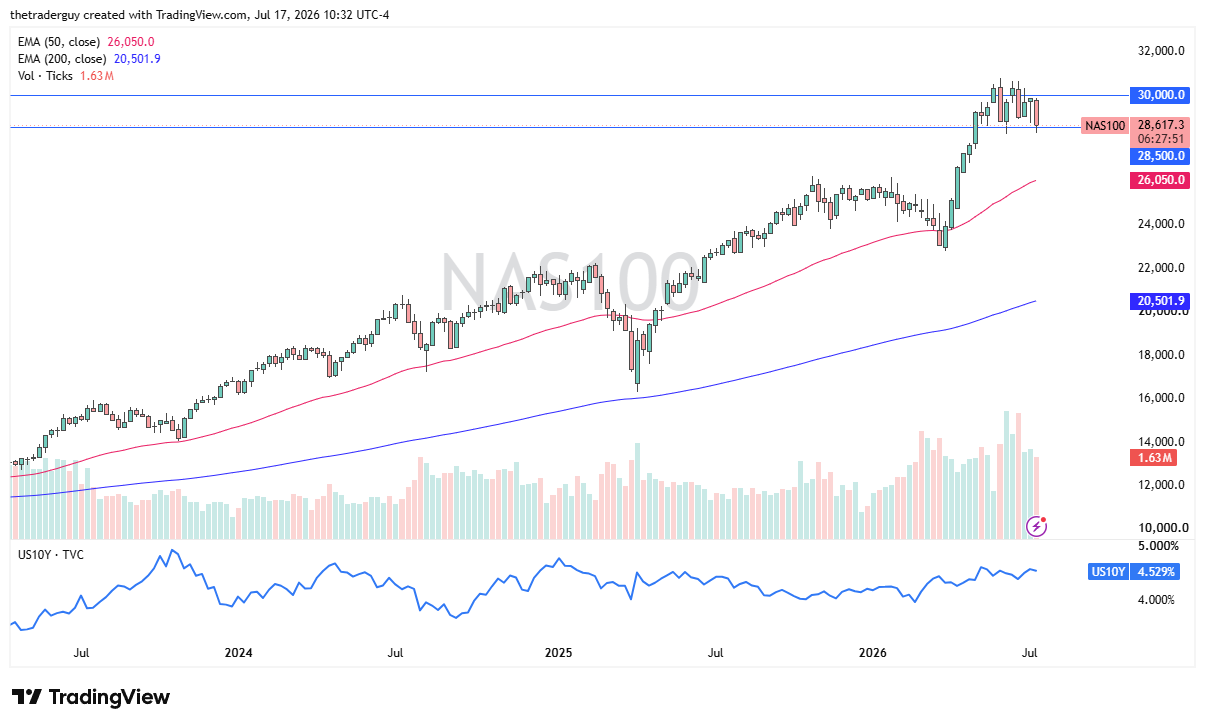
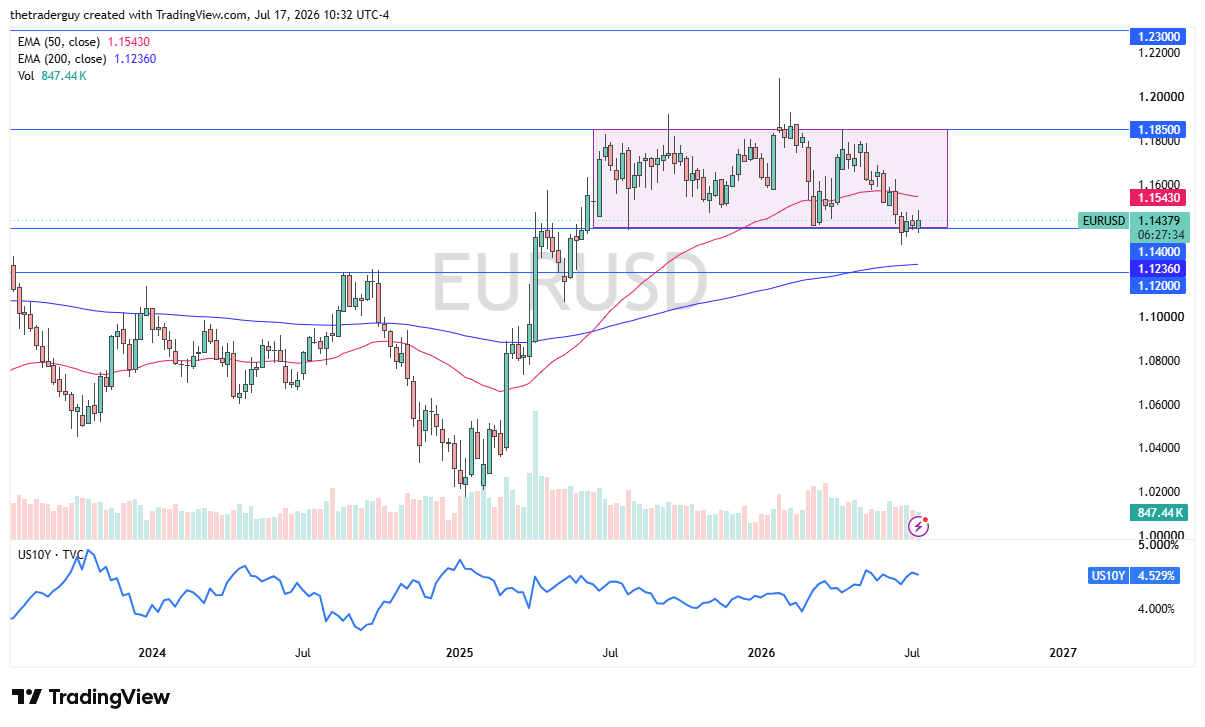








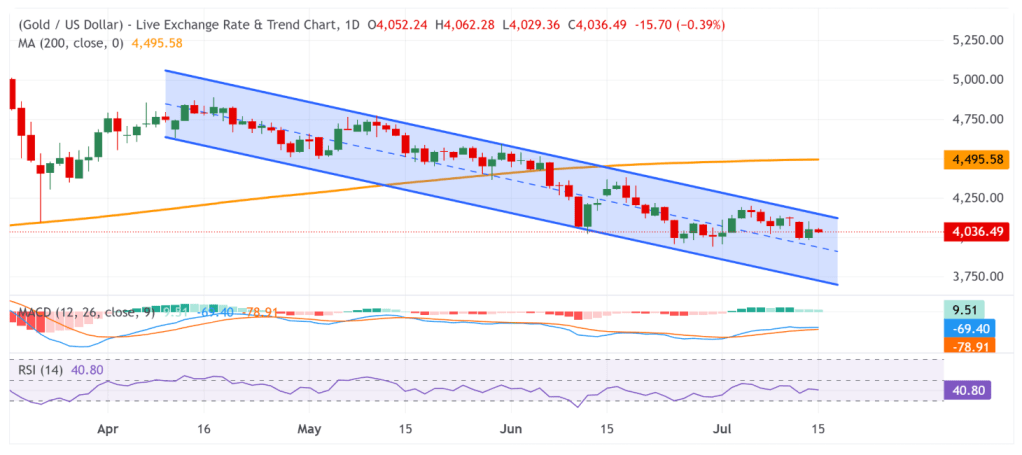
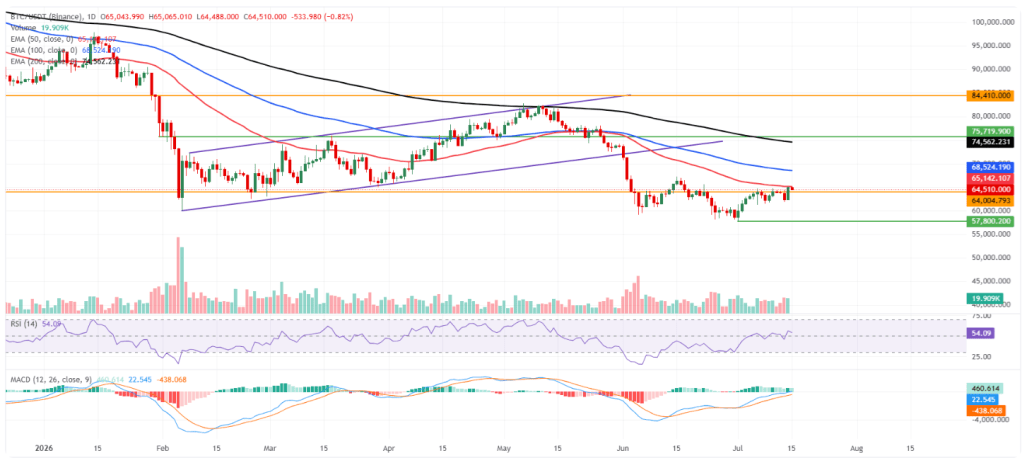
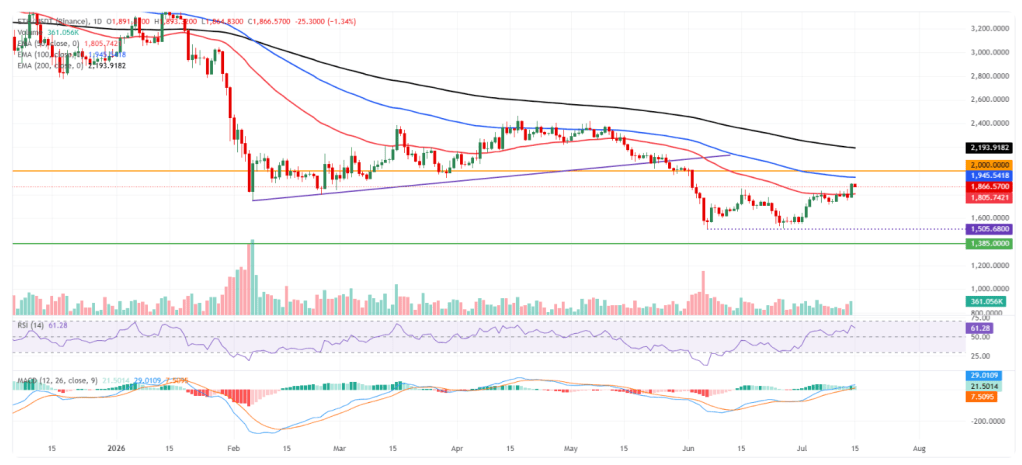
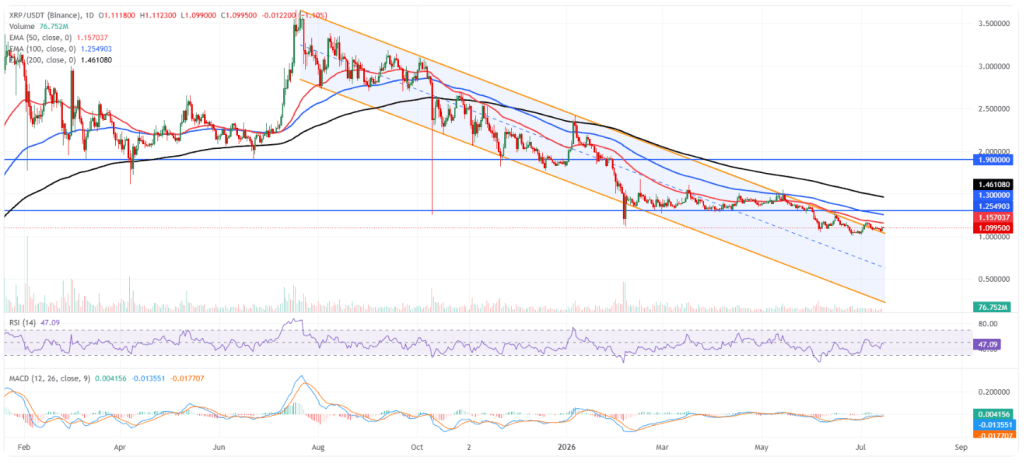




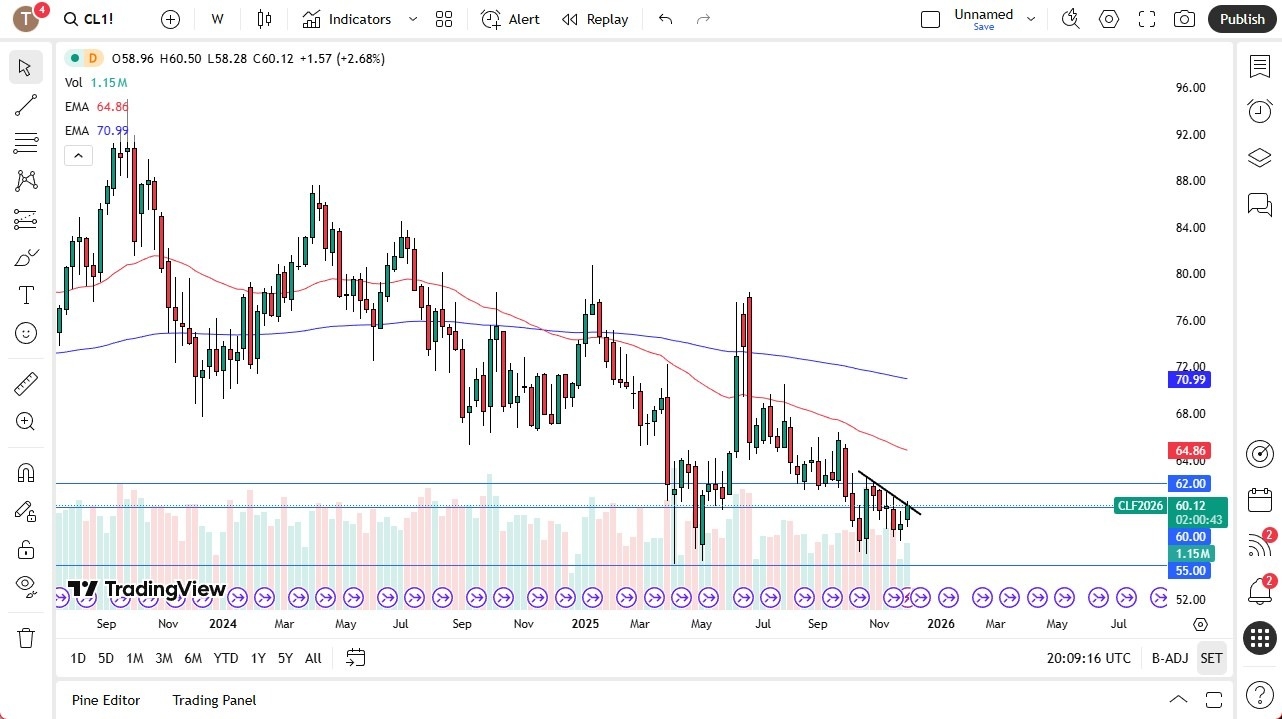
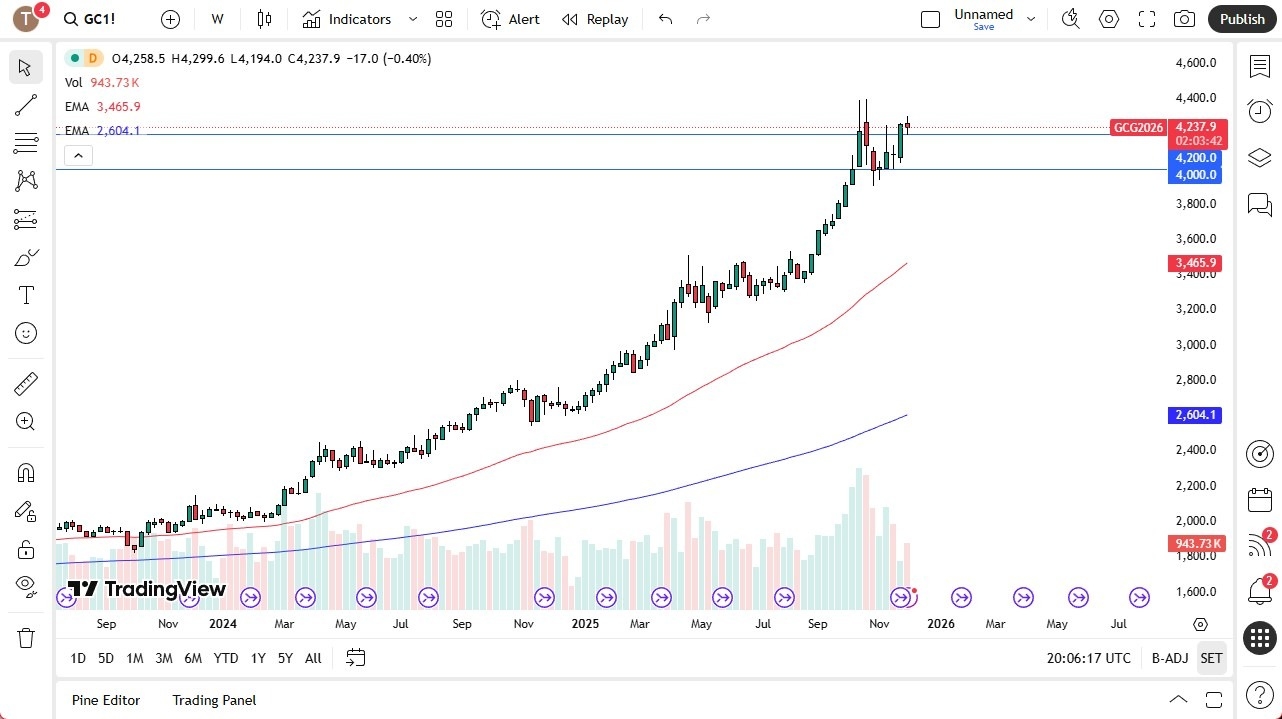
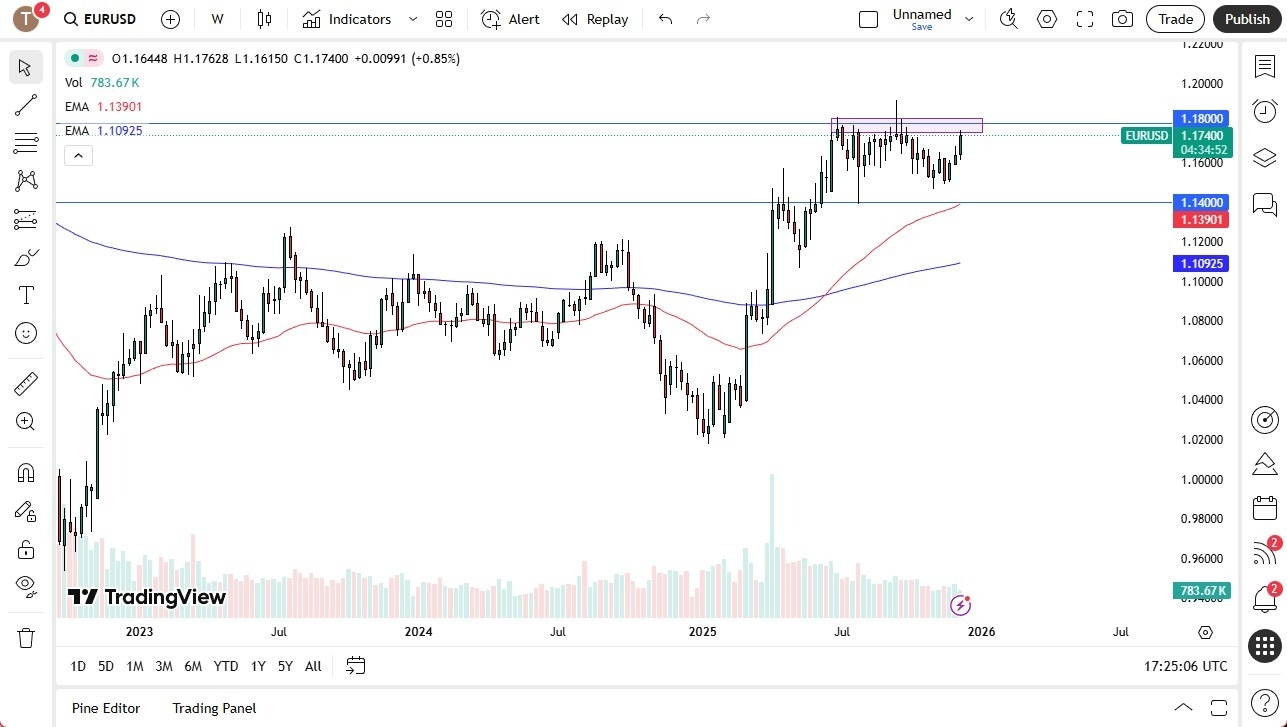
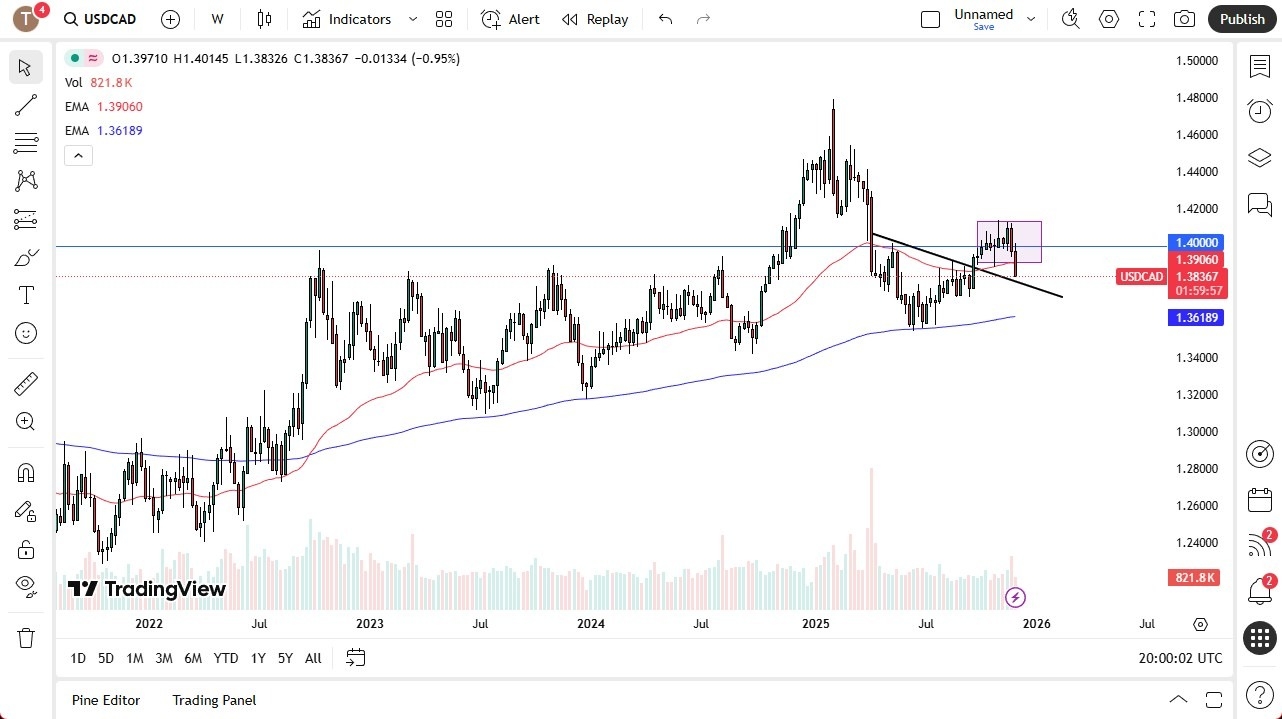
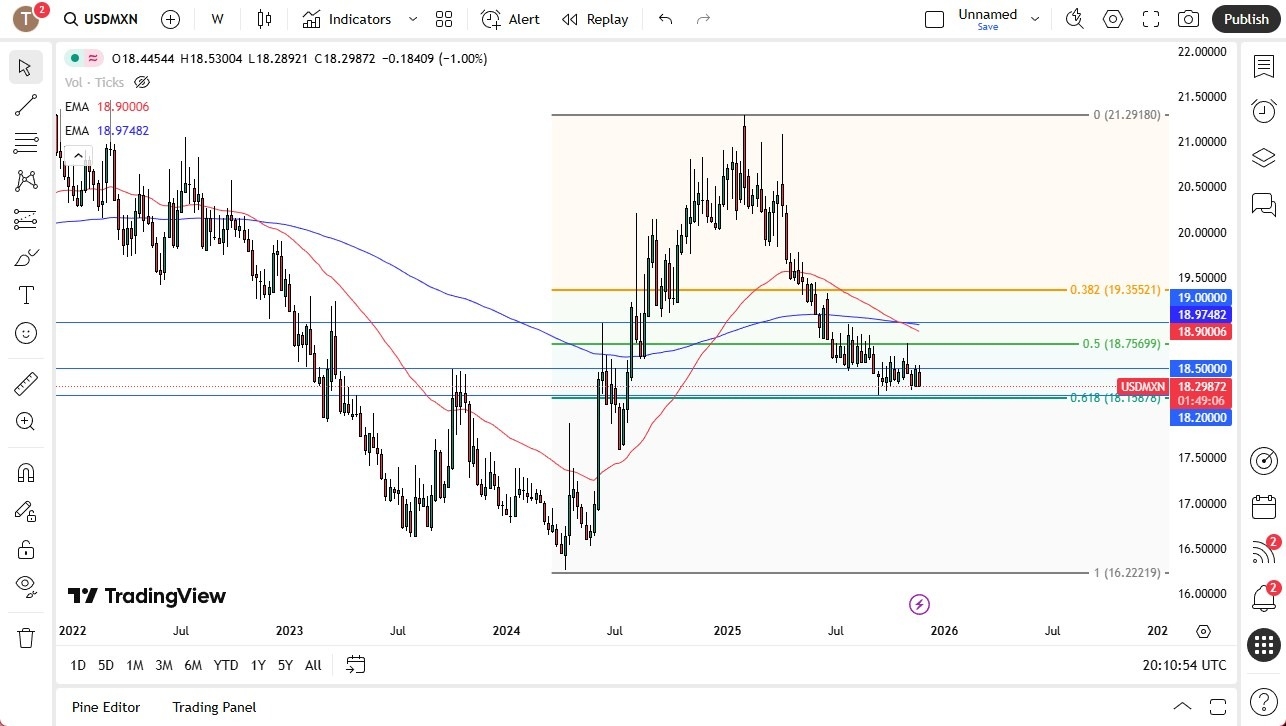
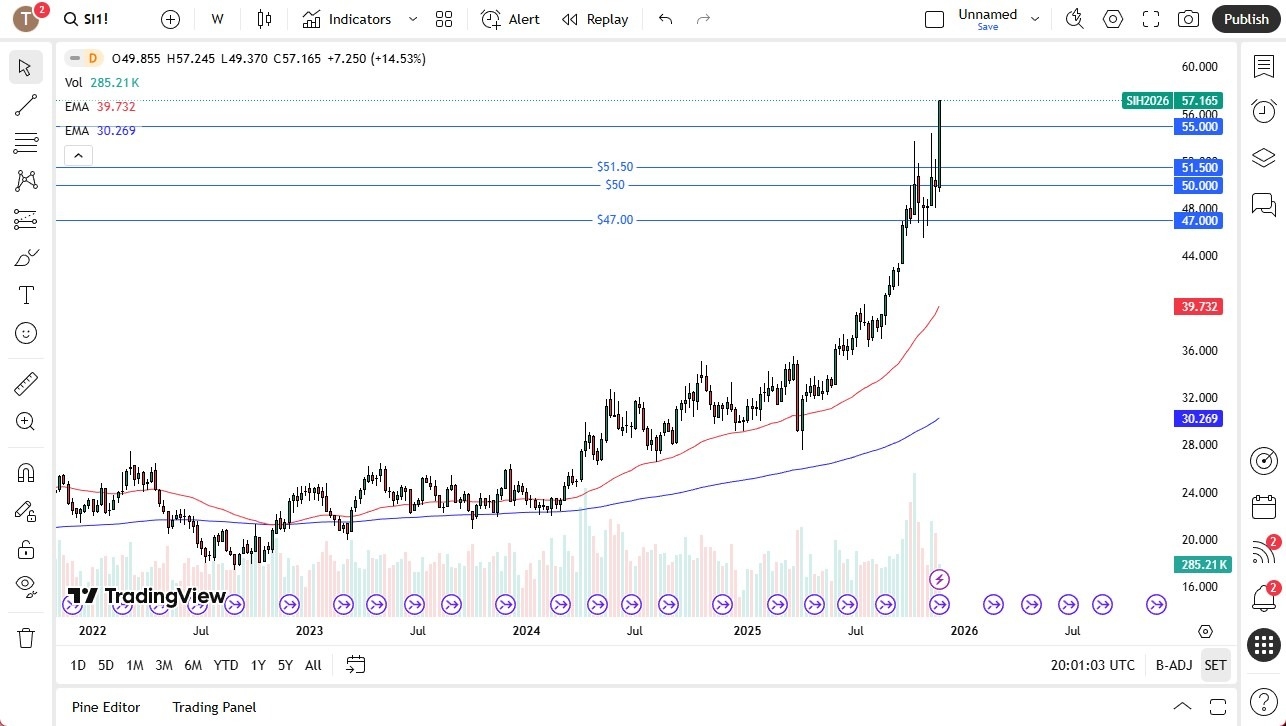
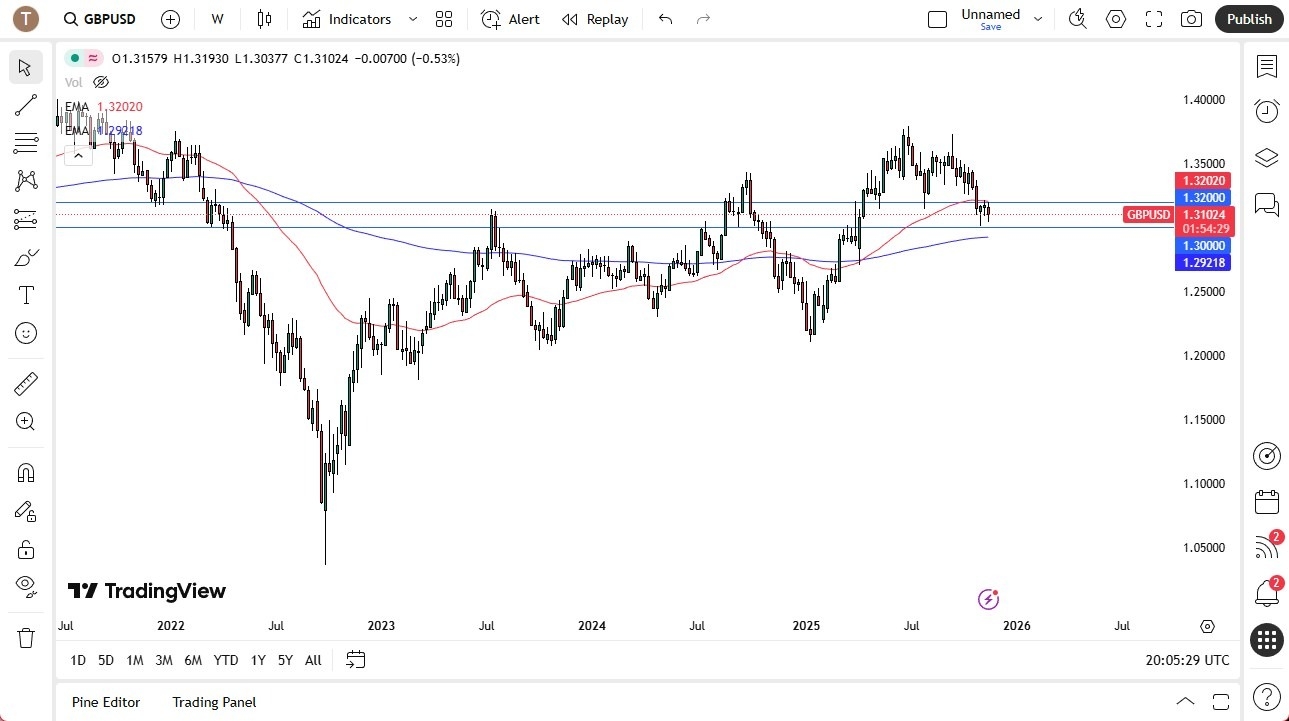




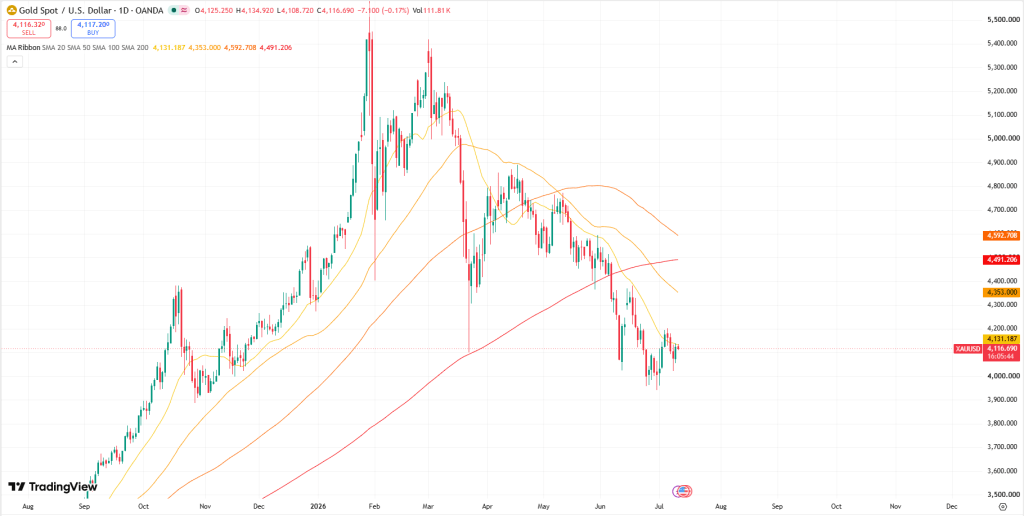
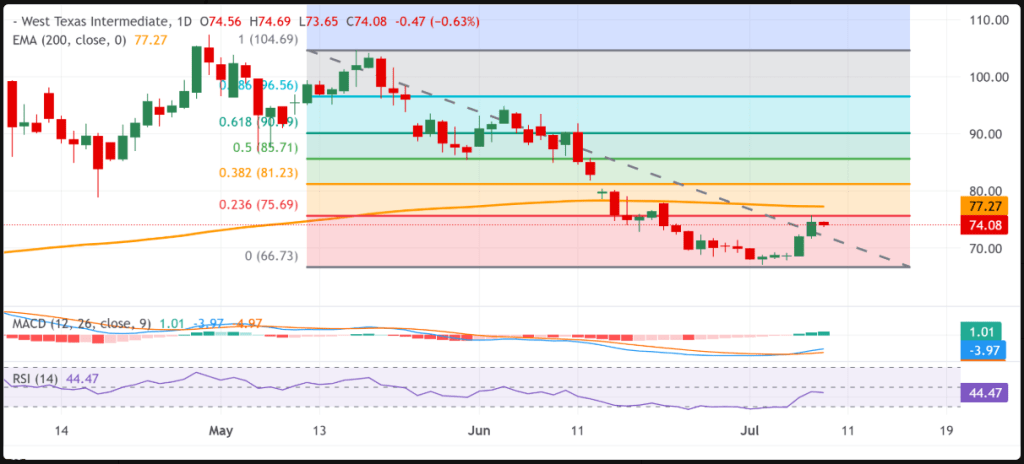
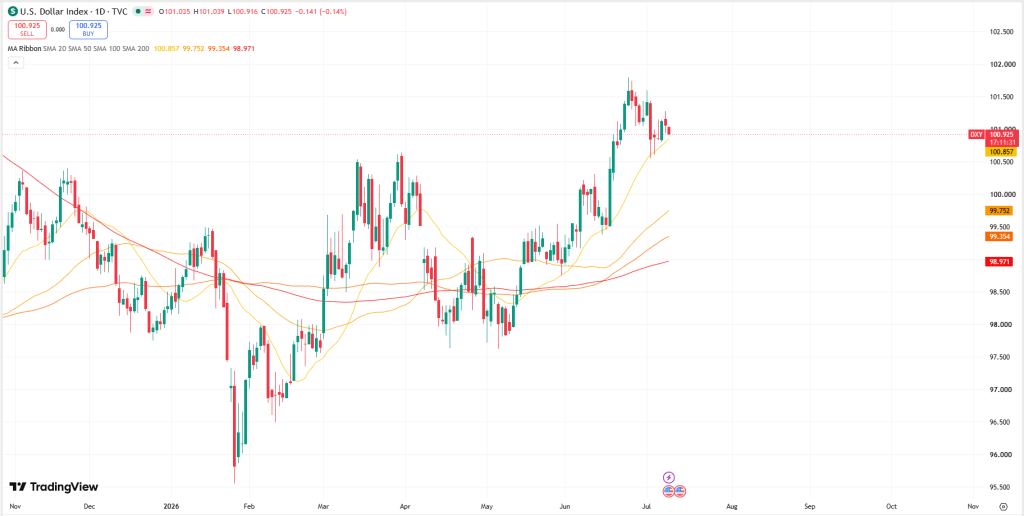






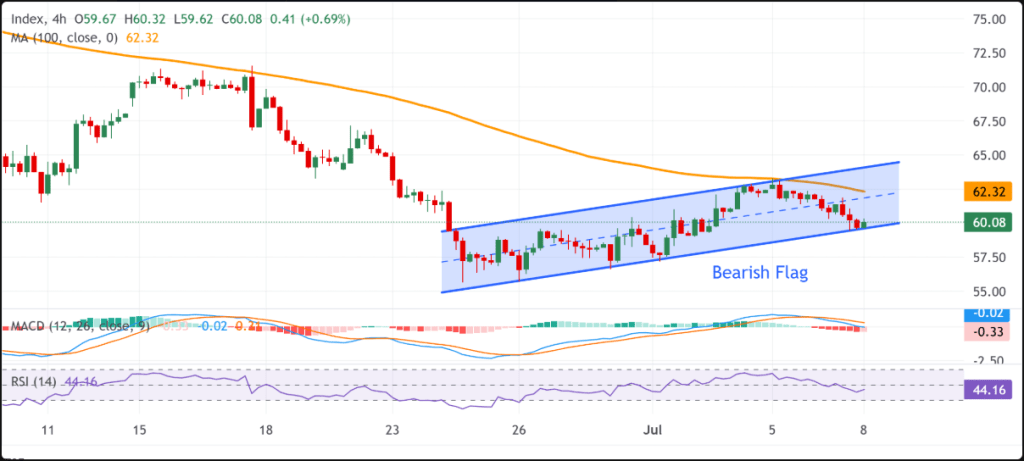
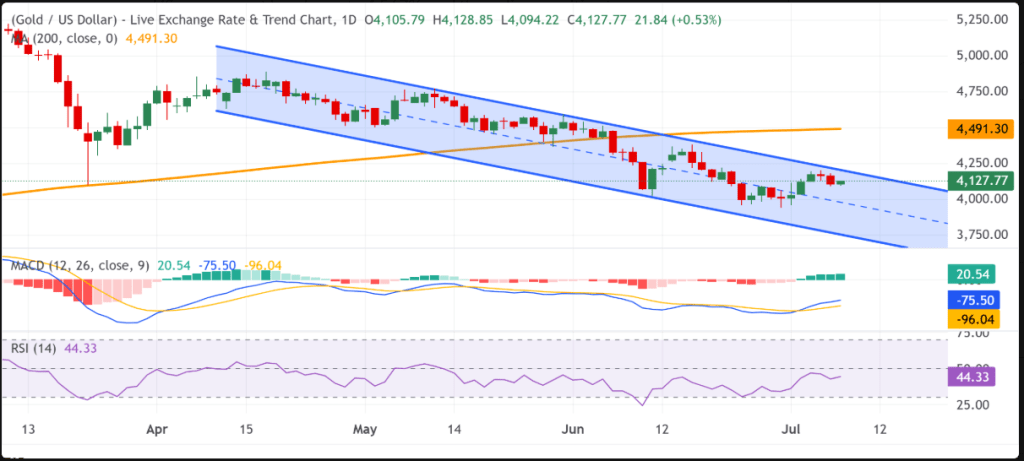
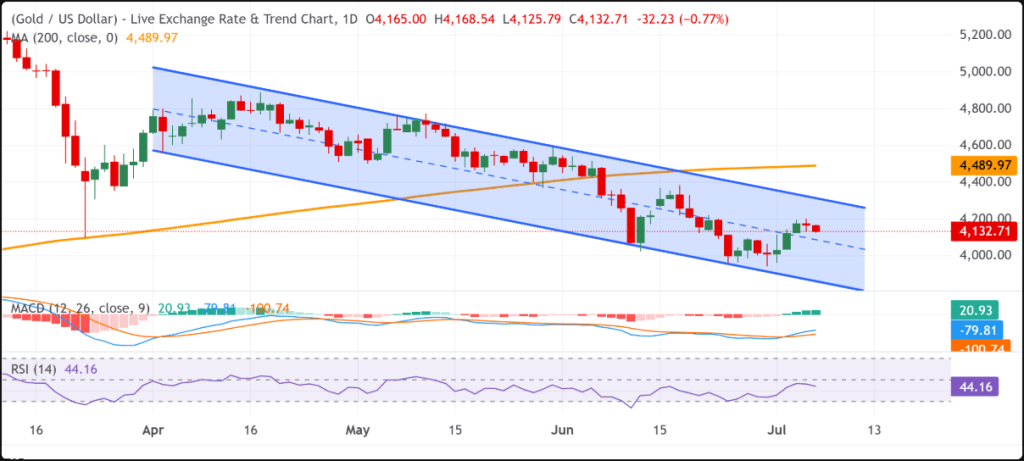
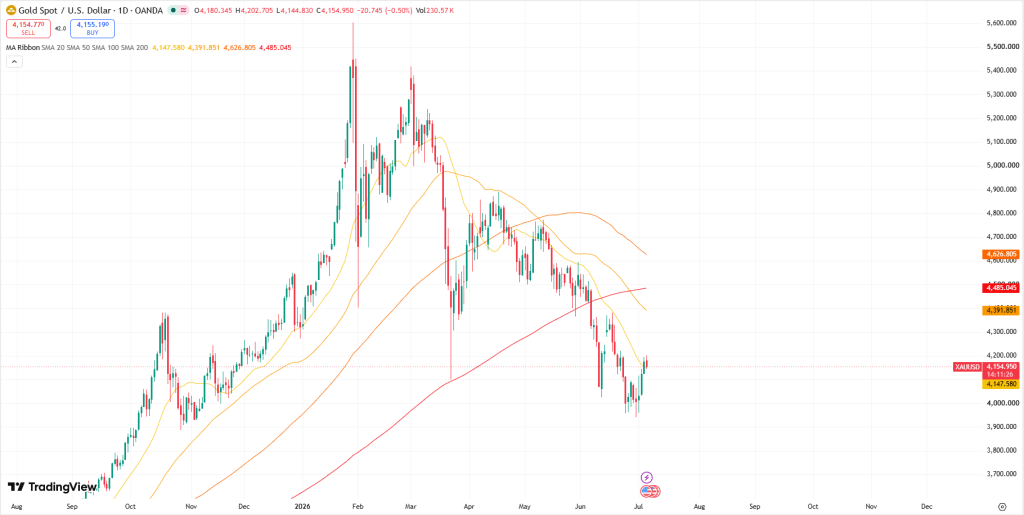
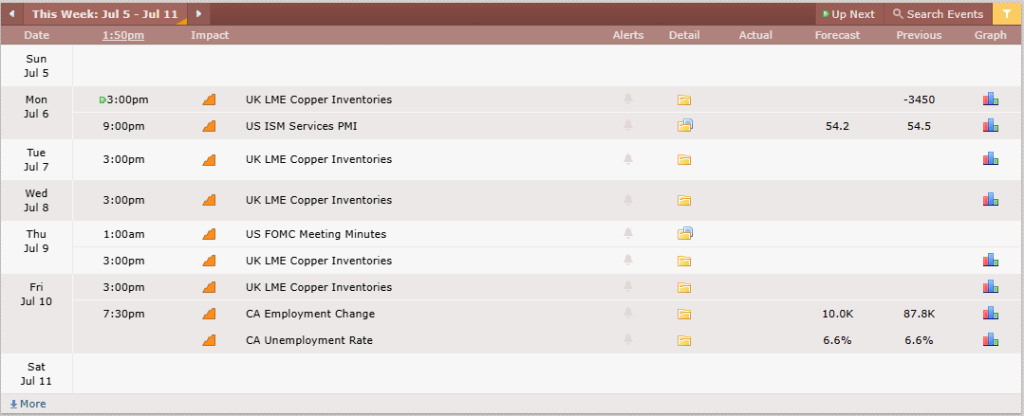
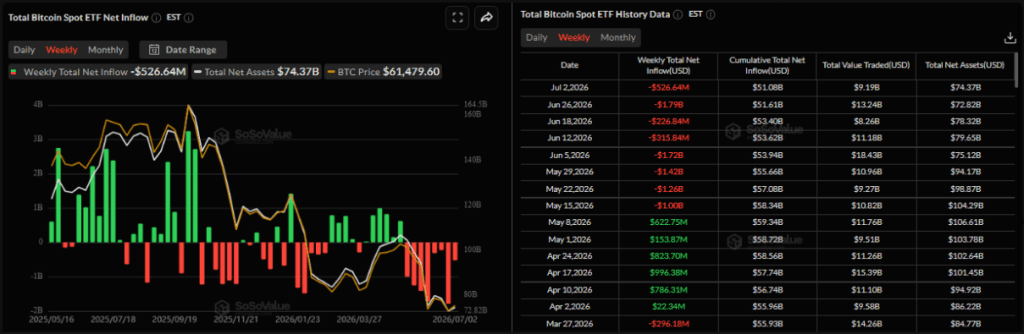

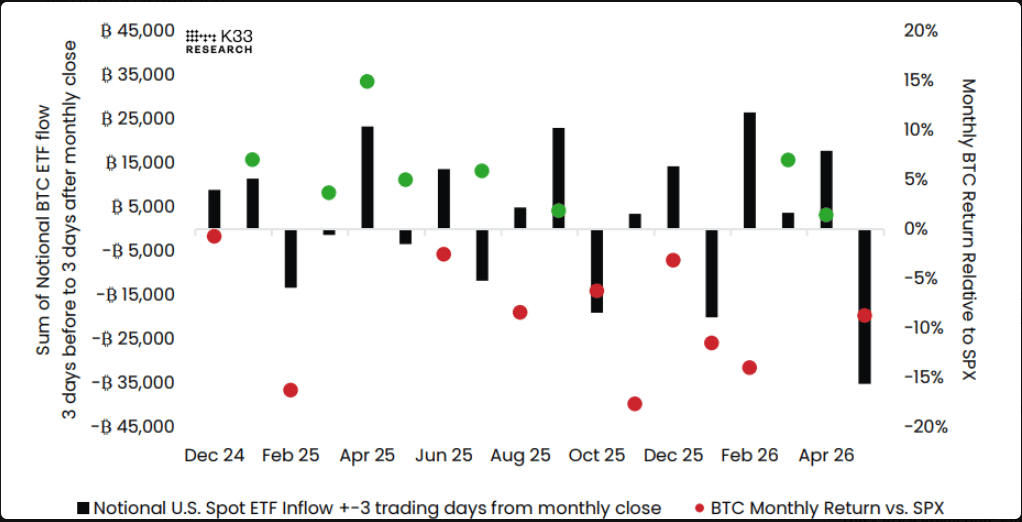
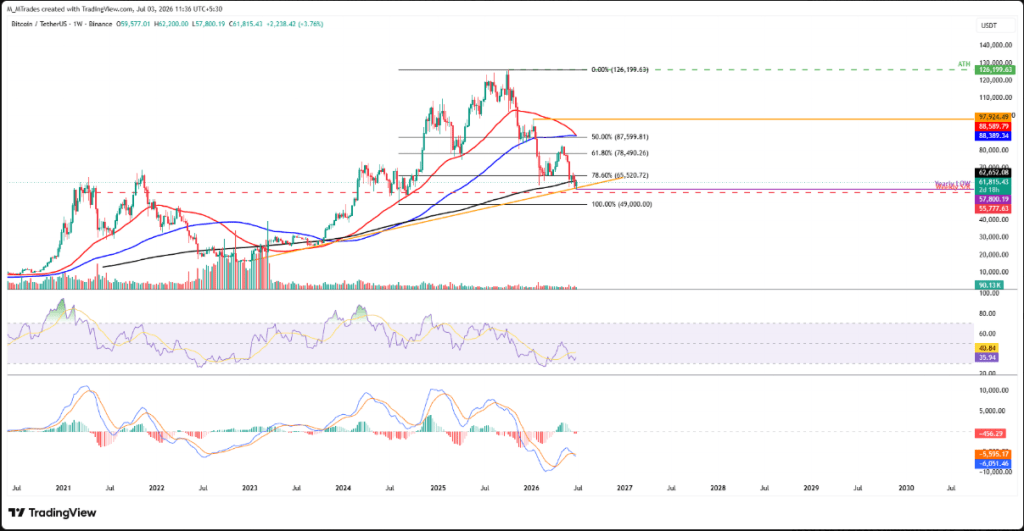
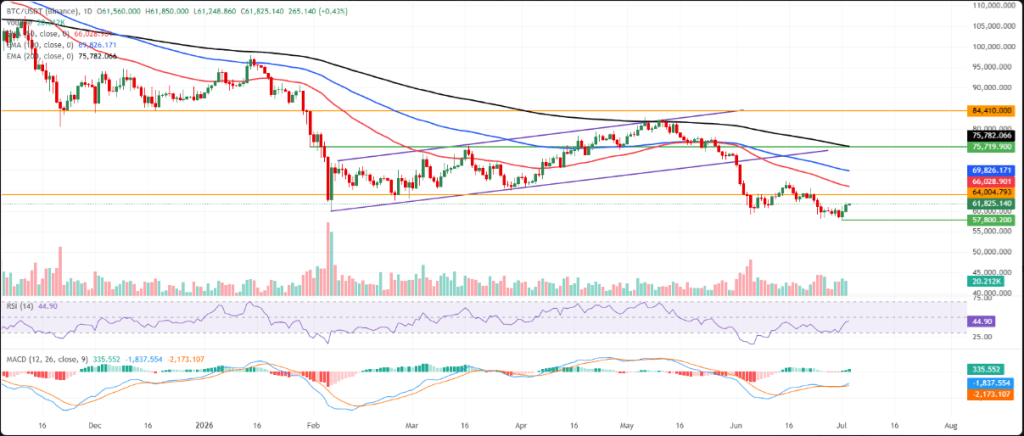


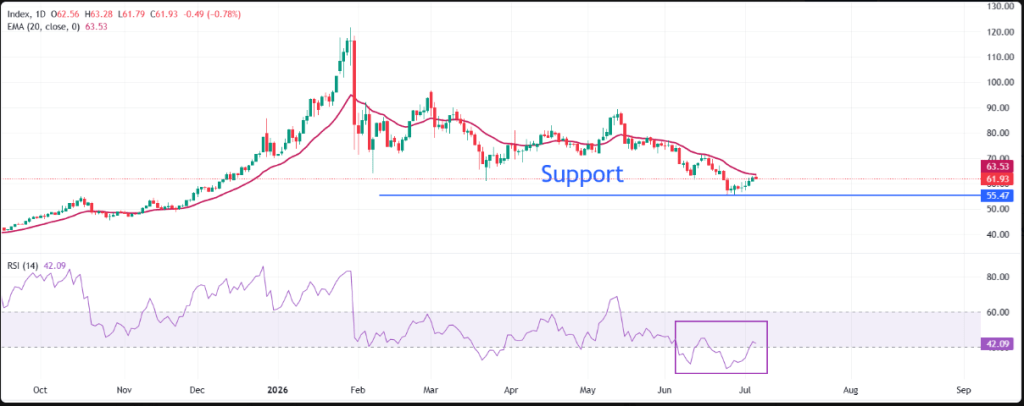
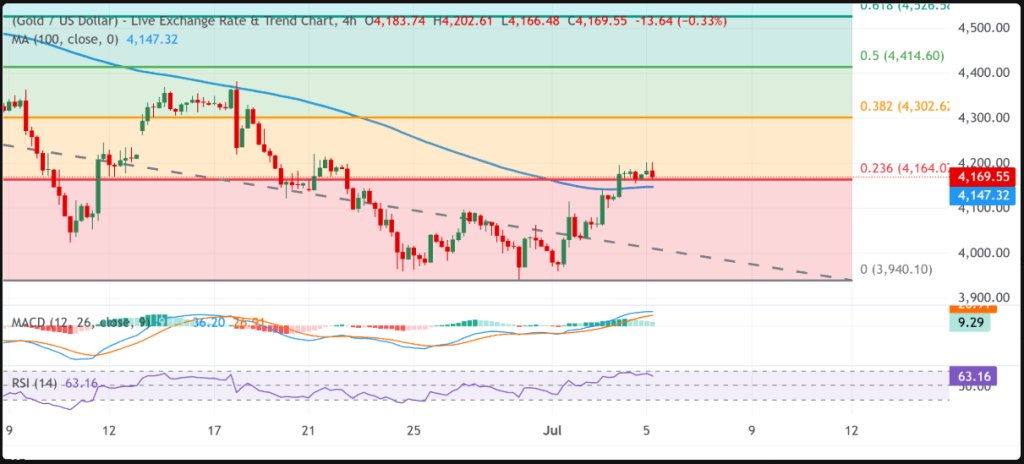
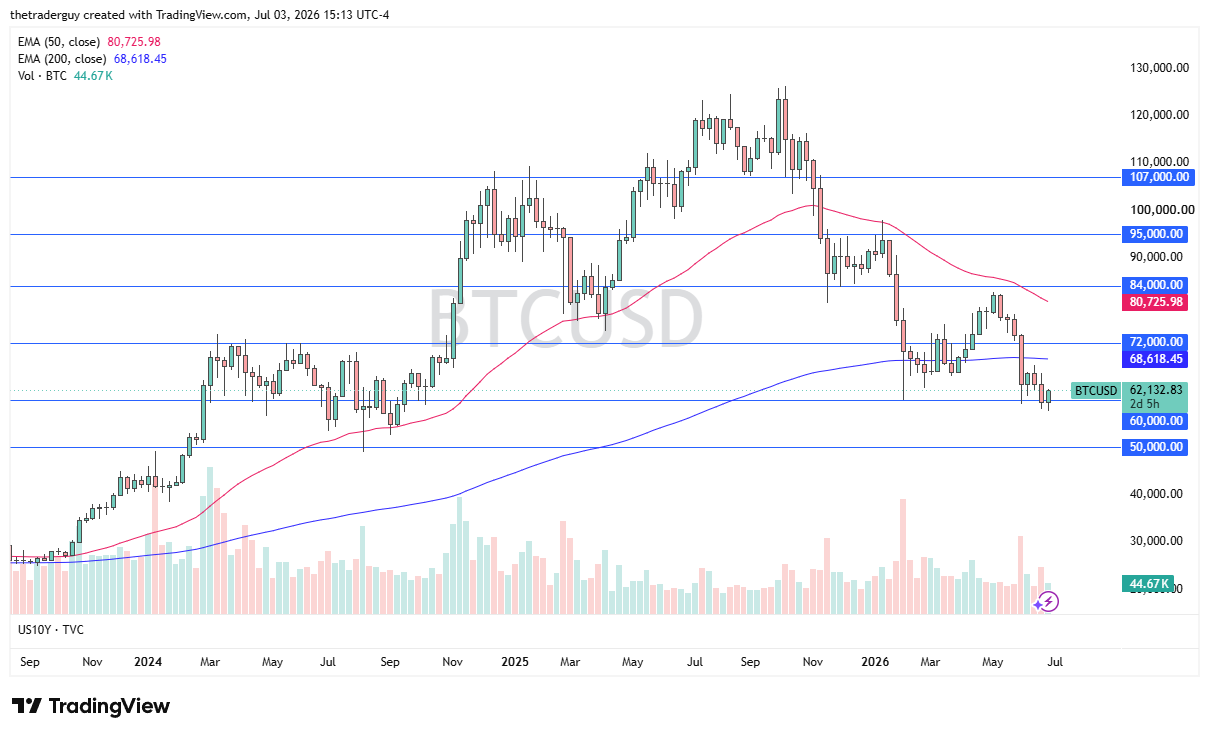
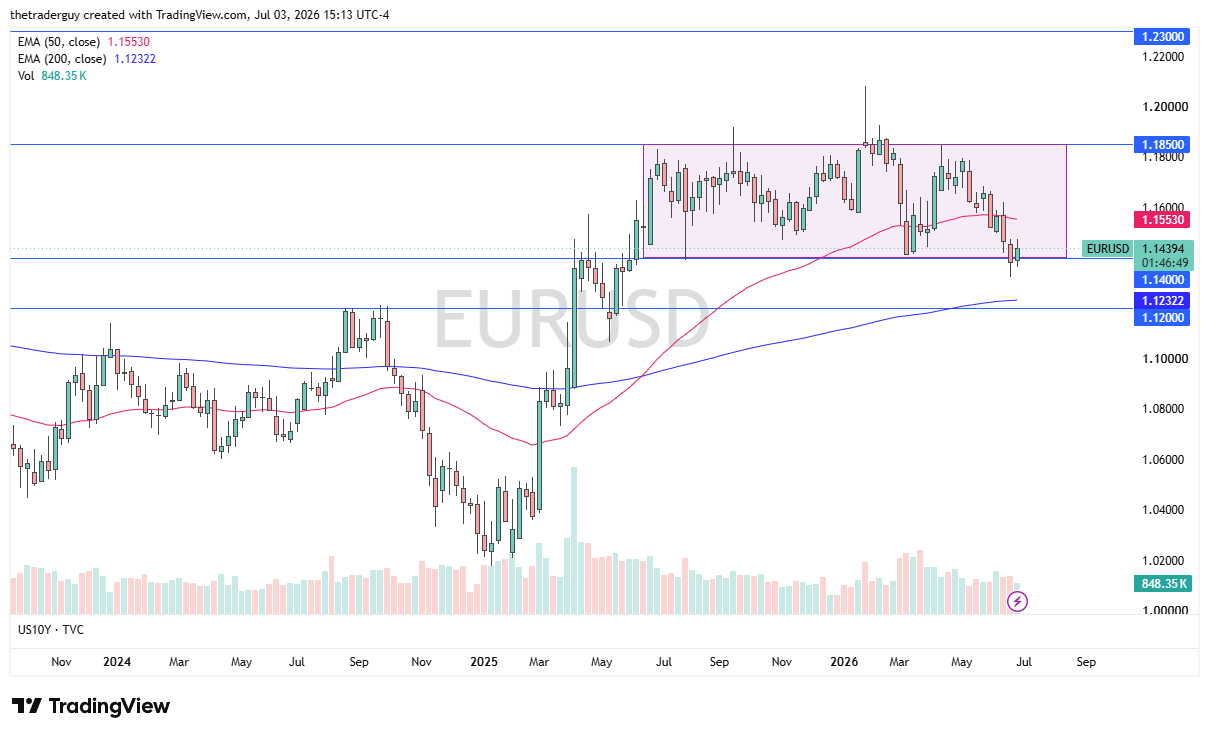
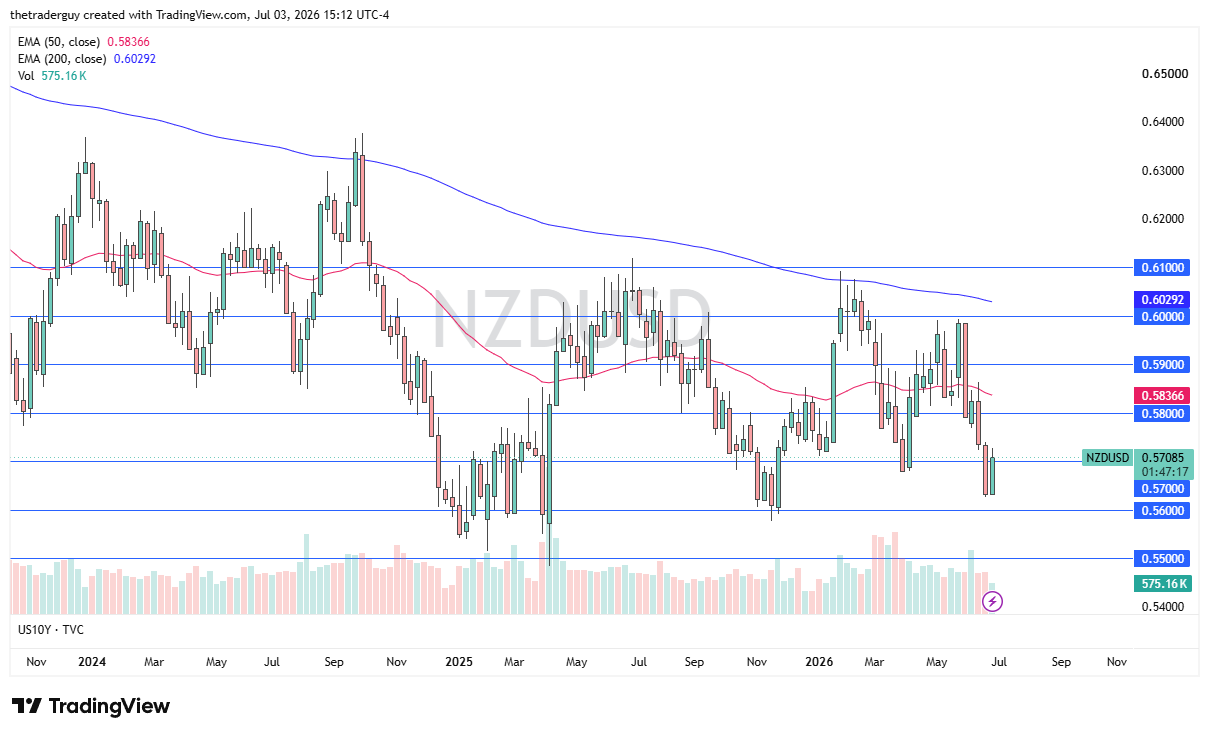
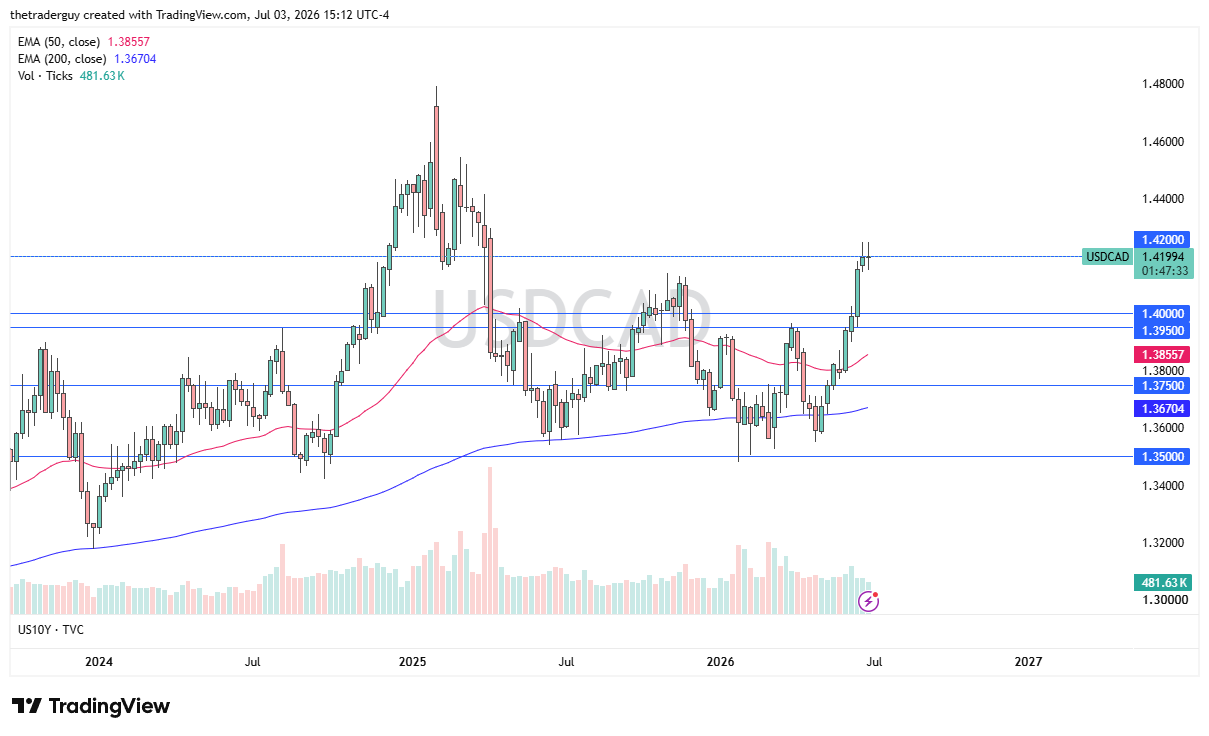
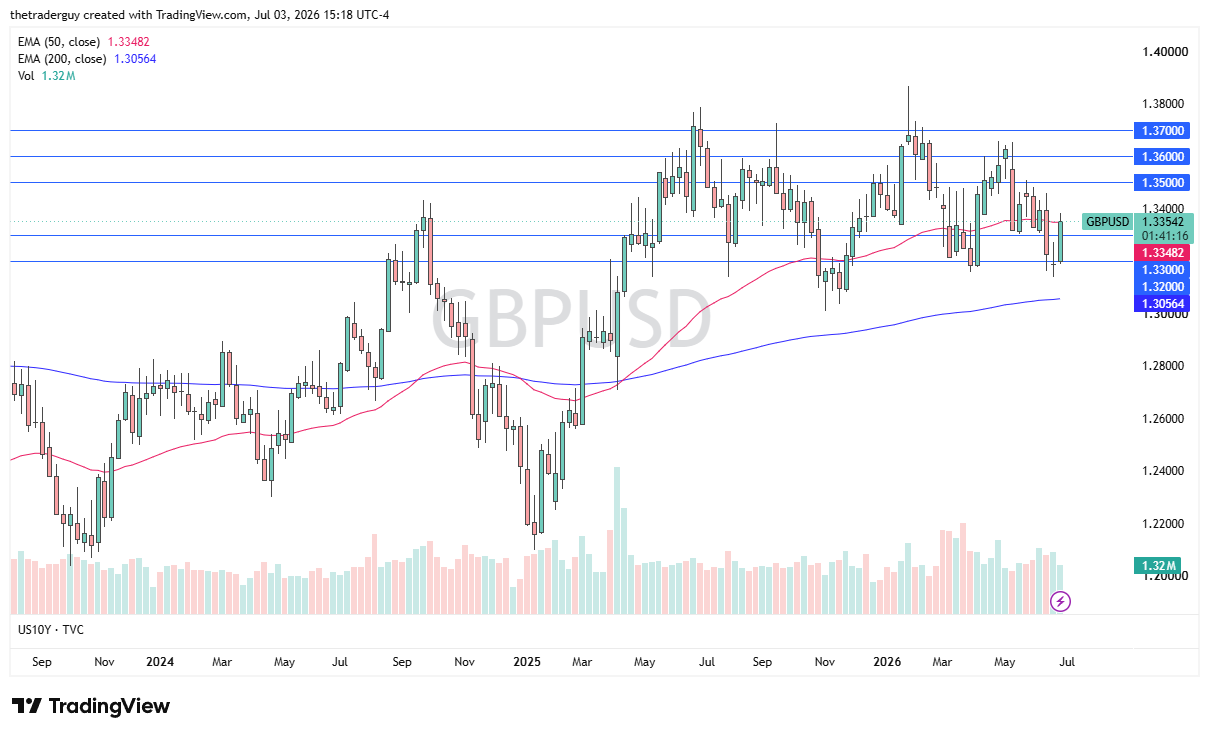
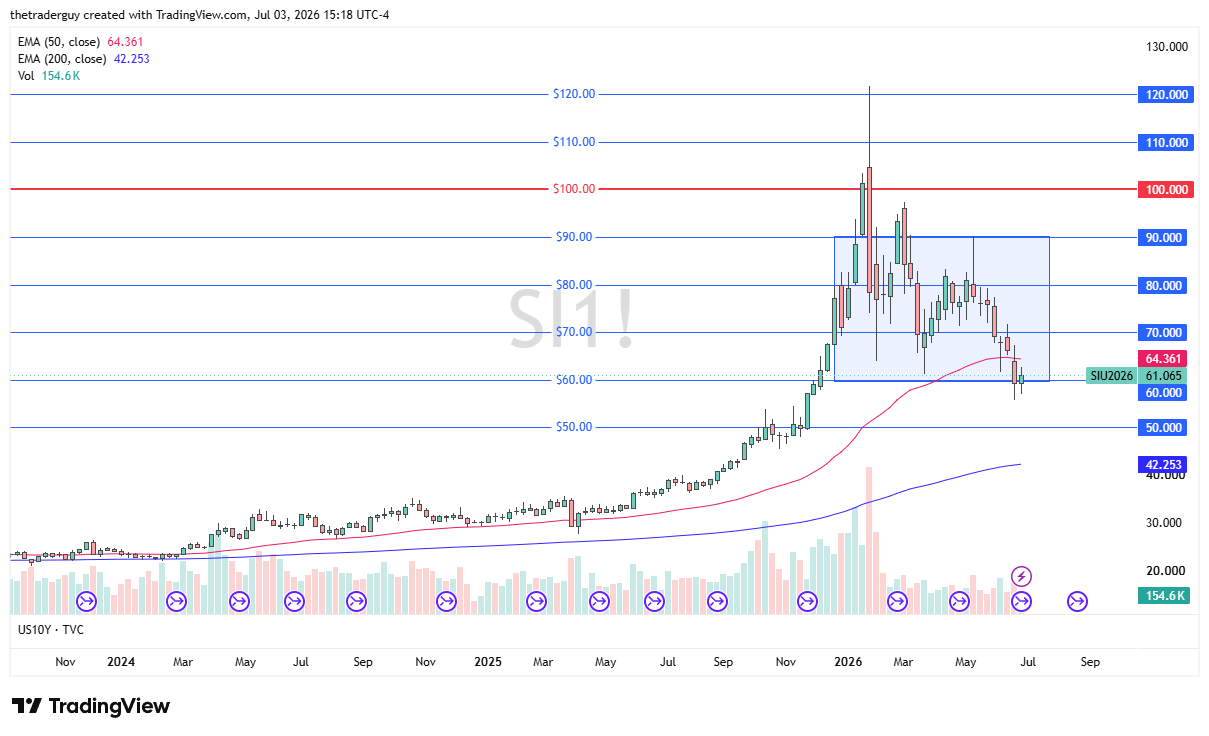
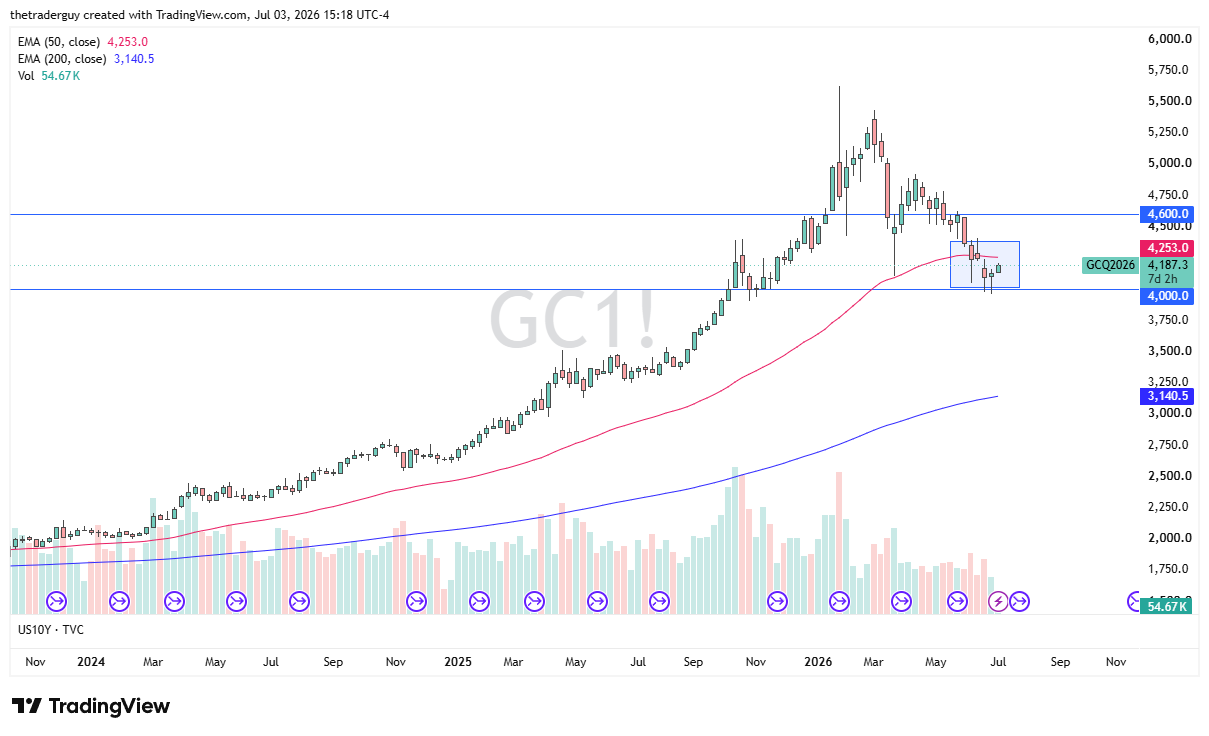
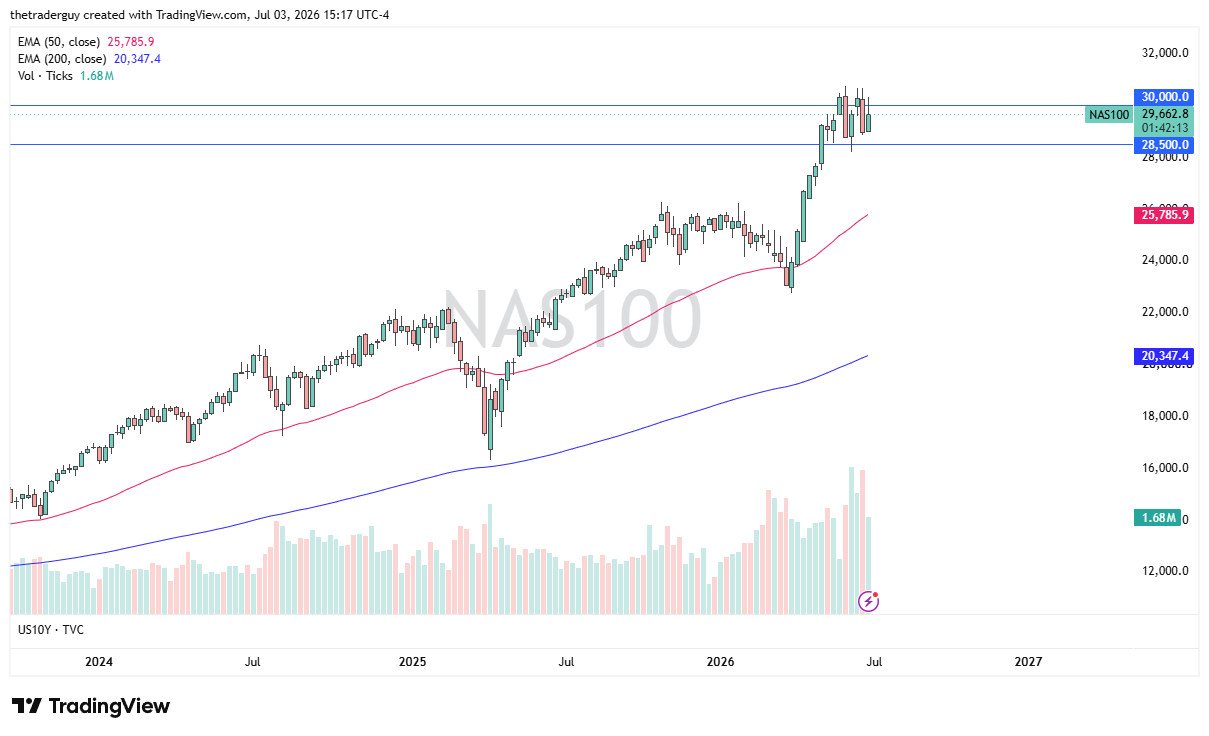







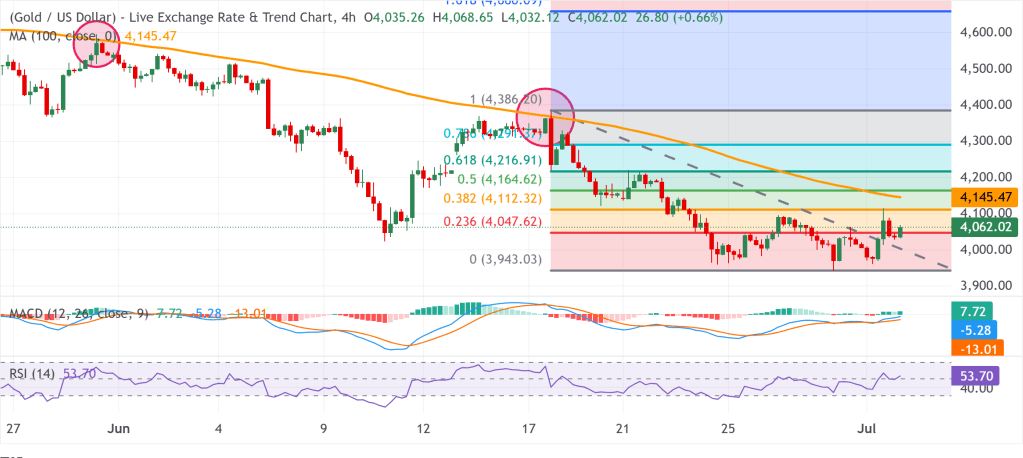
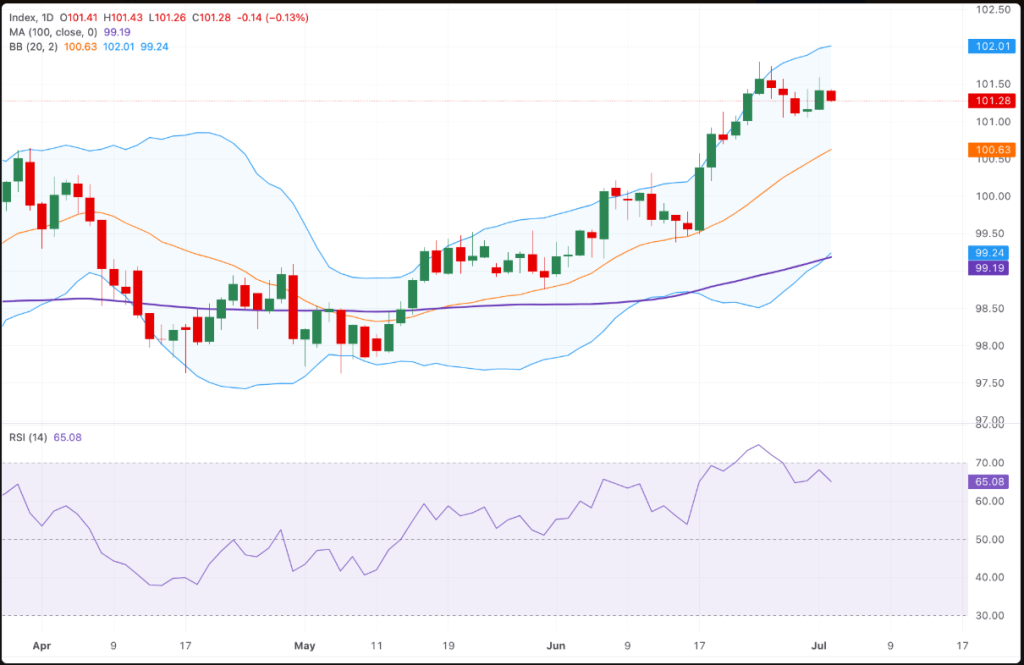


 THE ETERNAL SOVEREIGN