The US Dollar Index (DXY) edged lower to around 101.20 during Thursday’s early European trading session. Despite the pullback, the near-term outlook remains constructive, supported by bullish momentum signals from the RSI.
From a technical perspective, 101.80 serves as the immediate resistance level. A decisive break above this barrier could reinforce the bullish bias, while initial support is seen at 101.05, the first downside target should selling pressure intensify.
The US Dollar Index (DXY), which measures the value of the US Dollar against a basket of six major currencies, traded around 101.20 during Thursday’s early European session. The greenback softened as investors adopted a cautious stance ahead of the release of the closely watched June US employment report, the key macroeconomic event on Thursday’s calendar.
Economists expect the Nonfarm Payrolls (NFP) report to show that the US economy added 110,000 jobs in June, while the unemployment rate is forecast to remain unchanged at 4.3%. A weaker-than-anticipated labor market reading could weigh on the US Dollar and increase expectations for Federal Reserve policy easing.
However, the downside may be limited if the data surprises to the upside. According to Akihiko Yokoo, Senior Analyst at Mitsubishi UFJ Bank, stronger-than-expected payroll figures could provide fresh support for the greenback and trigger a renewed upward move in the currency. He noted that a positive labor market surprise could encourage a rebound in the US Dollar as market participants reassess the outlook for US interest rates.
Technical Analysis
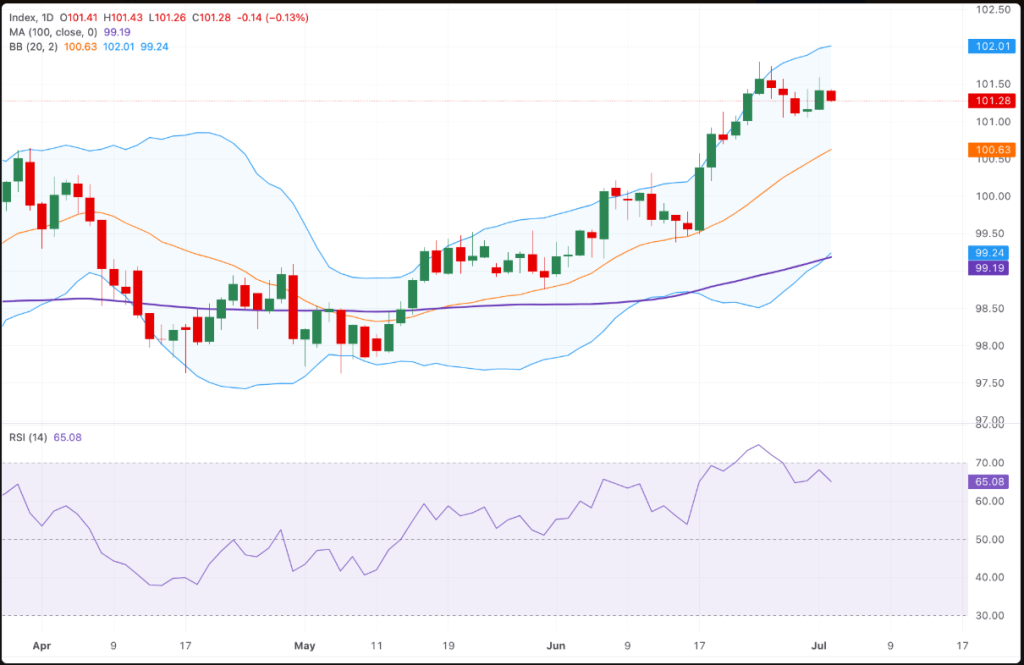
From a technical standpoint, the US Dollar Index (DXY) maintains a constructive near-term outlook. On the daily chart, the index continues to trade above both its 20-day Bollinger Band midpoint and the 100-day moving average, signaling that the broader bullish trend remains intact. Meanwhile, the 14-day Relative Strength Index (RSI) is hovering around 65, indicating solid upward momentum without yet entering overbought territory.
On the upside, the first key resistance level is the June 24 high at 101.80. A sustained break above this barrier could open the door for a move toward the upper Bollinger Band near 102.00, where bullish momentum may begin to encounter profit-taking pressure.
On the downside, initial support is located at the June 30 low of 101.05. Further weakness could expose the Bollinger Band midpoint around 100.65, followed by stronger support near the lower Bollinger Band at 99.25 and the 100-day moving average at 99.20. A deeper decline toward this support cluster would be required to challenge the current bullish structure and shift the near-term outlook to a more neutral stance.

Leave a comment