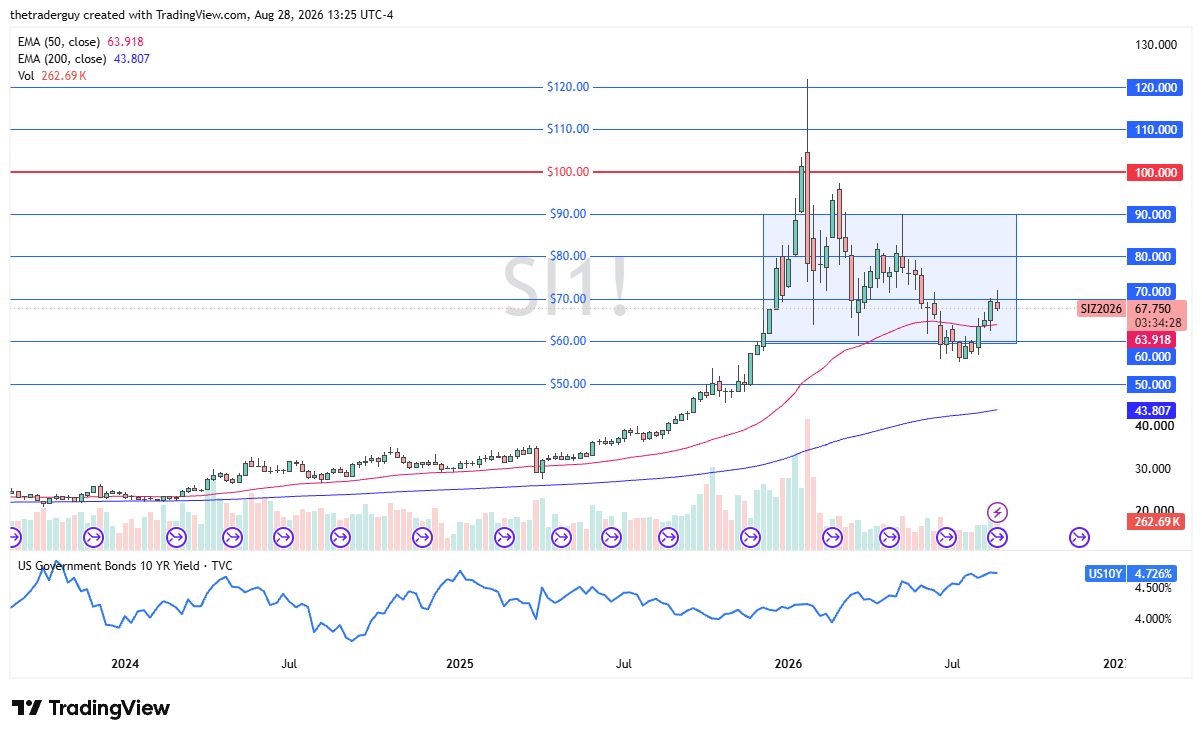
Silver experienced significant volatility this week, briefly dropping toward the 50-week EMA near $64 before staging a strong recovery. Despite stronger-than-expected U.S.
Non-Farm Payrolls data, which reinforced inflation concerns, silver managed to rebound sharply. The metal’s resilience in the face of hawkish economic data suggests that underlying buying demand remains strong.
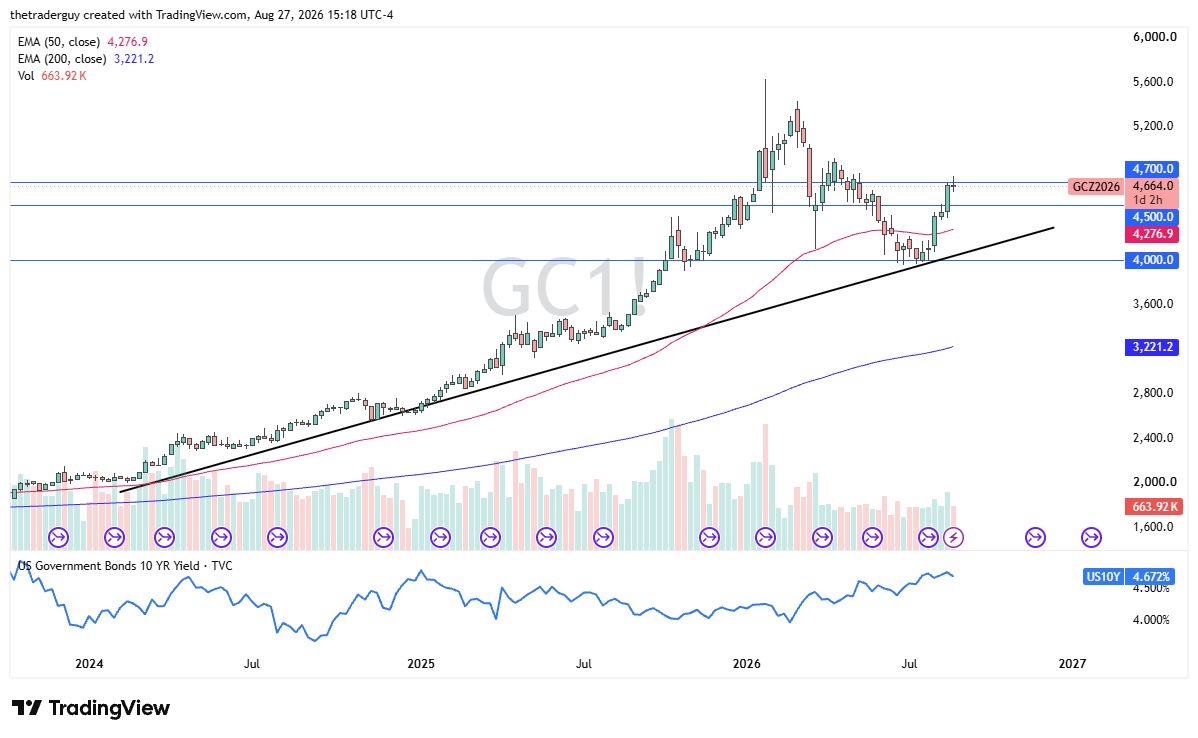
Gold
Gold followed a similar path, initially declining before recovering toward the end of the week. While volatility remains elevated, the rebound indicates that bullish sentiment is still present.
The $4,500 level has emerged as a key pivot point, and a decisive break above this area could open the door for further gains. Investors appear increasingly focused on broader debt concerns rather than interest rate pressures alone.
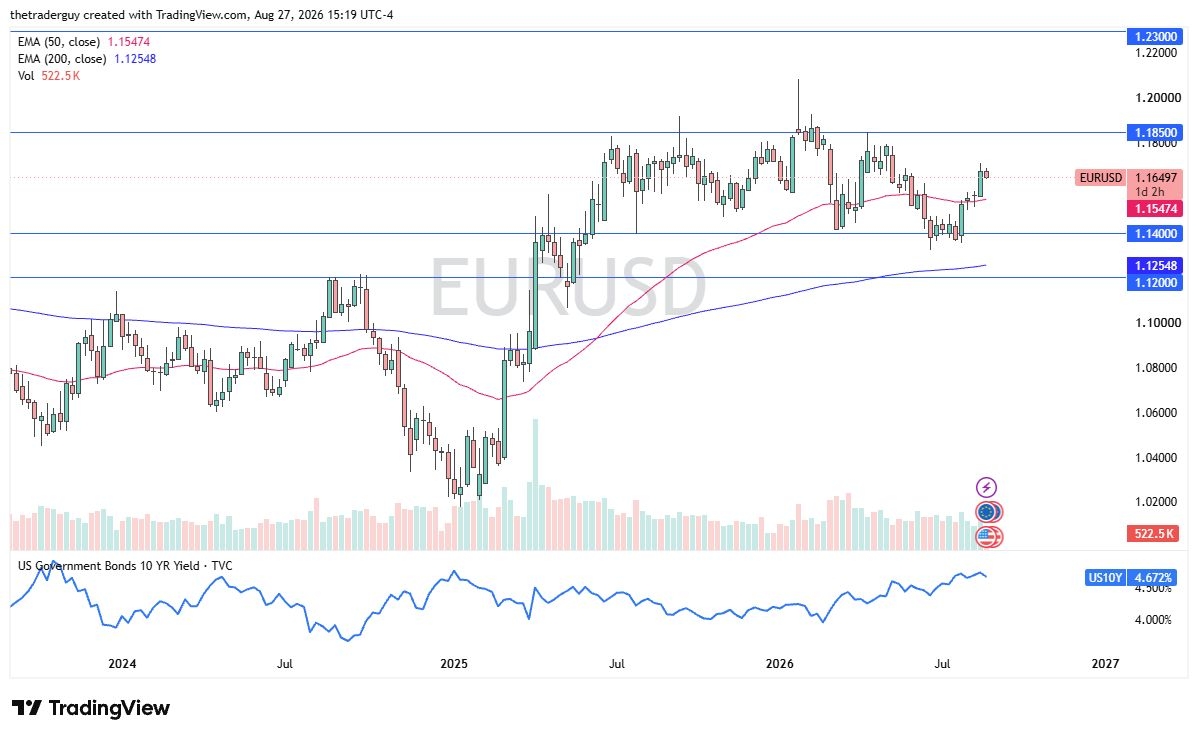
EUR/USD
EUR/USD posted modest gains during the week amid expectations that both the European Central Bank and the Federal Reserve may raise interest rates by 25 basis points.
The pair remains on track to test the 1.17 area, a level that has repeatedly acted as an important resistance zone. Although the outlook remains cautiously bullish, confidence in a sustained euro rally is still limited.
GBP/USD
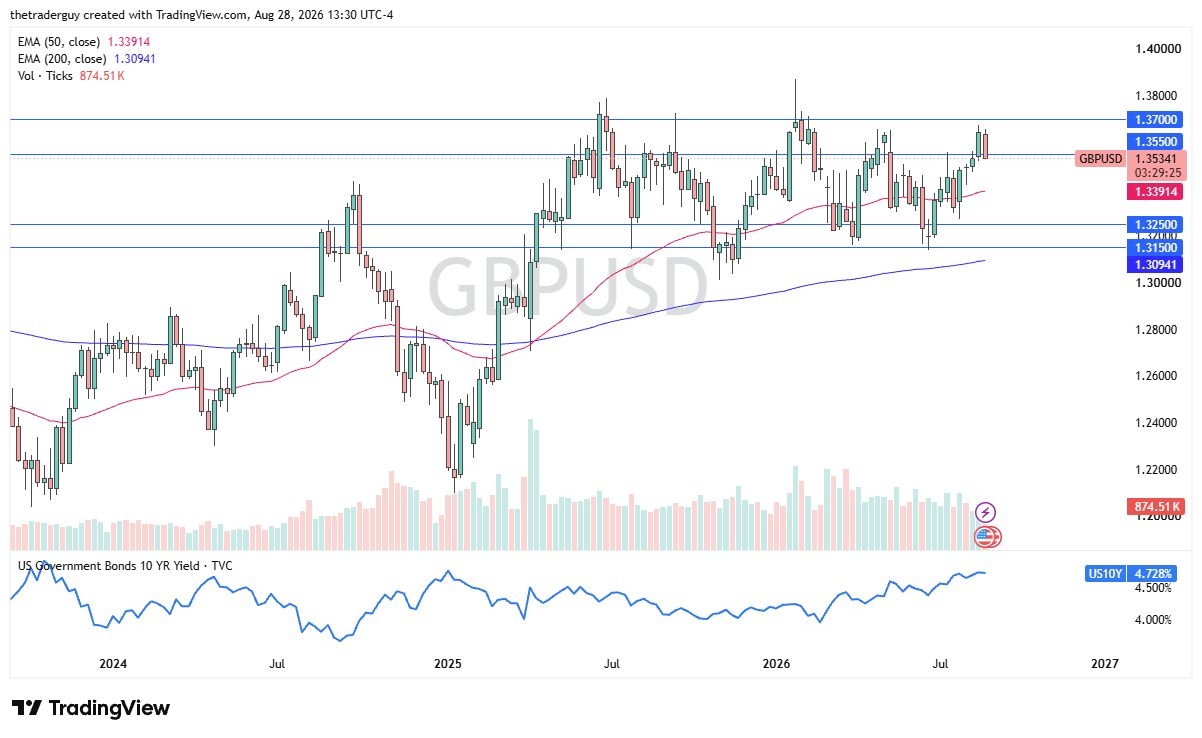
The British pound traded erratically as markets continued to reassess the outlook for U.S. monetary policy.
Support for the pound comes from the Bank of England’s relatively higher interest rates, although concerns over the UK’s energy outlook later in the year may create additional uncertainty.
NASDAQ 100
The NASDAQ 100 demonstrated impressive resilience, recovering from early-week losses and maintaining its broader upward trajectory.
Investor sentiment continues to favor buying pullbacks, supported by strong momentum and ongoing confidence in growth-oriented equities.
USD/MXN
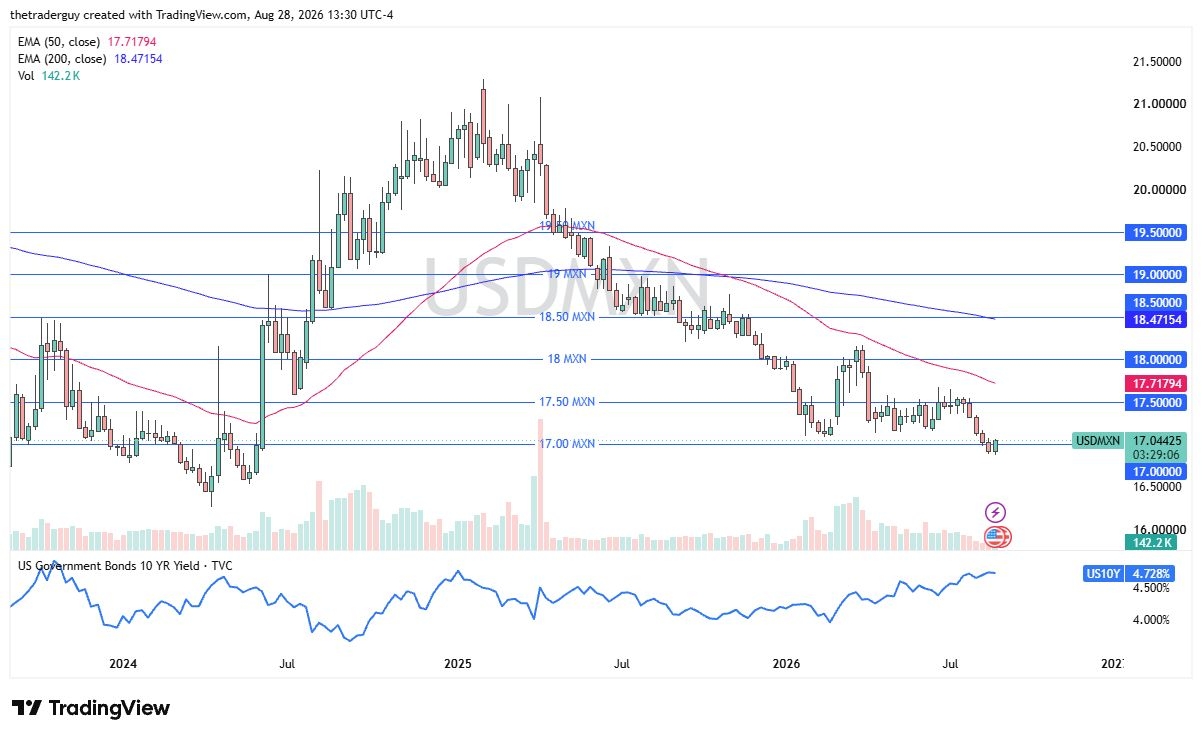
The U.S. dollar weakened further against the Mexican peso, reinforcing the pair’s bearish trend. Market sentiment remains tilted toward additional downside, with the 16.50 level standing out as a major support zone to watch in the coming weeks.
AUD/USD
The Australian dollar ended the week higher, benefiting from expectations that the Reserve Bank of Australia will maintain a relatively hawkish stance.
At the same time, traders are increasingly pricing in the possibility of future Federal Reserve rate cuts, providing additional support for the Aussie. The currency may continue to perform well against lower-yielding alternatives such as the Swiss franc.
USD/JPY
USD/JPY recorded a sharp weekly decline, although some stabilization emerged near the lows. The 155 level remains a critical support area, and holding above it could encourage a recovery. While U.S. interest rates continue to favor the dollar, speculation surrounding potential policy normalization in Japan has increased pressure on the pair.
The US dollar’s struggle is no longer simply about one economic reading or a single Federal Reserve official. The bigger issue is a persistent ceiling. On the daily chart, 100 on the US Dollar Index (DXY) has repeatedly been within reach, yet the greenback has failed to establish a sustained break above it. This week was no different. DXY slipped below the mid-99s and briefly fell into the upper-98s, with the index last trading near 98.99 after losing almost 0.6% during the session.
The broader 52-week range remains between 95.55 and 101.80, meaning the current move does not represent a collapse. Instead, it highlights repeated rejection at a key technical barrier. The dollar can remain below 100 for an extended period; what it has consistently failed to achieve is a daily close above that threshold. The key question now is whether Friday’s Nonfarm Payrolls (NFP) report can provide the catalyst. NFP is unlikely to create an entirely new dollar trend by itself, but it could determine whether the next challenge of 100 turns into a yield-driven breakout or another retreat toward the 98 area.
The Technical Barrier Markets Continue to Underestimate
Round numbers carry significant weight in foreign exchange markets because they influence options positioning, systematic trading strategies and investor psychology. The 100 level on DXY is not inherently special, but several factors converge around it: it represents a major psychological threshold, has capped recent recoveries and sits close to several important medium-term moving averages.
Recent technical readings show DXY struggling beneath its 20-day midpoint and 100-day moving average. Meanwhile, the upper volatility boundary remains positioned around the low-100 area, suggesting that a move beyond that region would represent a meaningful change in the current market structure. RSI is also not signaling an outright collapse. Instead, it reflects a market that has repeatedly struggled to maintain upward momentum. That makes the problem more persistent rather than necessarily more dramatic.
Remaining below 100 keeps the dollar in a range-bound role: a funding currency during calm markets, a safe-haven asset during periods of stress and, more broadly, a reflection of US interest-rate differentials.
A decisive daily close above 100, followed by additional gains, would bring the 101–102 region back into focus, an area associated with the June peak. Until that happens, rallies toward 100 remain vulnerable to selling unless Treasury yields provide the dollar with enough support to sustain the advance.
Friday’s NFP Is the Catalyst, Not the Underlying Story
The August Employment Situation report is scheduled for release at 08:30 ET on Friday, September 4. Expectations remain relatively subdued. The Wall Street Journal survey consensus calls for nonfarm payrolls to rise by around 53,000 following July’s 23,000 decline, while the unemployment rate is expected to remain at 4.1%. Average hourly earnings are projected to increase 0.3% month-over-month, or approximately 3.0% annually.
However, the potential range of outcomes is wide. Some analysts view July’s weakness as being distorted by seasonal and calendar-related factors and anticipate a rebound toward 65,000–80,000 jobs. Others remain concerned that any improvement could largely reflect education-sector or seasonal noise.
The latest ADP employment figures were weaker than expected, contributing to Thursday’s dollar decline, while weekly jobless claims have remained relatively contained. Overall, the labor market is showing neither a clear collapse nor a powerful acceleration. That uncertainty creates an unfavorable backdrop for a currency attempting to break through major resistance.
The dollar’s reaction function remains familiar, although the market is placing different emphasis on the data. A stronger-than-expected report — particularly payroll growth above 80,000, a lower unemployment rate and persistent wage growth — would likely push Treasury yields higher, beginning with the front end of the curve.
Two-year Treasury yields would probably react first. Expectations surrounding the September Federal Reserve meeting could shift further toward a tighter policy outcome, providing DXY with momentum toward 99.50–100.00.
But reaching 100 is not the same as breaking it. For a sustainable breakout, the rise in short-term yields would need confirmation from longer-dated Treasuries rather than being offset by weakness at the long end.
A broadly in-line report, with payroll growth around 40,000–70,000, unemployment at 4.1% and wages close to expectations, would likely leave the dollar trapped within its existing range. Traders could fade the initial move and turn their attention toward the following week’s inflation data.
The clearest threat to the 100 resistance level would come from a weak employment report. Another negative payroll reading or a noticeable rise in unemployment could remove the prospect of a near-term retest of 100 and push DXY deeper into the 98s.
Such an outcome would weaken the dollar’s interest-rate support. Two-year yields could decline, while risk assets and gold could benefit. DXY would then likely focus on the mid-98s and the lower part of the recent trading range.
Wages may ultimately prove just as important as the headline payroll figure. Payroll data can be volatile, whereas average hourly earnings provide the Federal Reserve with a clearer signal about whether labor-market conditions continue to generate inflationary pressure.
A 0.4% monthly wage increase alongside a strong employment report could create a significant bullish catalyst for the dollar. Conversely, 0.2% wage growth combined with weak payrolls would likely trigger a bond-market rally first, with the dollar reacting afterward.
Treasury Yields Remain the Dollar’s Most Important Counterpart
The dollar does not respond to NFP in isolation. Its reaction is heavily influenced by the Treasury market.
At the beginning of this week, the two-year Treasury yield was around 4.39%, the 10-year near 4.79% and the 30-year around 5.27%. These levels do not indicate a financial crisis, but they do suggest that markets are no longer expecting a simple return to the low-rate environment that dominated much of the post-2010 period.
Thursday’s dollar weakness coincided with declining Treasury yields, reinforcing one of the clearest short-term relationships in the market: lower nominal and real yields generally weigh on the greenback.
The opposite dynamic explains why DXY repeatedly approaches 100. Whenever the front end of the Treasury curve begins pricing tighter Federal Reserve policy, the dollar moves higher. But when longer-term yields fail to confirm that tightening — partly because term premium is already elevated — the dollar’s advance tends to stall.
That creates the central risk for the current setup. The dollar remains supported by US economic exceptionalism and the belief that American markets can continue absorbing enormous government borrowing. At the same time, it is increasingly exposed to the behavior of long-duration assets.
When Treasury bonds sell off because of stronger growth or inflation, the dollar generally benefits. But when yields rise because markets are struggling to absorb excessive government supply, the currency’s positive response becomes much less reliable.
Foreign investors holding dollar-denominated assets must consider factors such as cross-currency funding costs and whether 10-year and 30-year Treasury yields adequately compensate them for fiscal risks.
The 2s10s spread — the difference between the 10-year and two-year yields — and the 10s30s spread will therefore be important around the NFP release.
A bull-steepening move following weak employment data, where short-term yields decline more rapidly than long-term yields, would normally be negative for the dollar.
A bear-steepening move after strong employment data, in which long-term yields rise faster than short-term yields, would be more complicated. Higher long-term yields could attract capital toward US assets, but they could also tighten financial conditions and eventually weaken the same labor market that initially supported the dollar.
Underlying all of this is the enormous volume of Treasury issuance. The post-Labor Day calendar remains heavy, with additional coupon reopenings still needing to be absorbed. The official sector has also been experimenting with larger Treasury buybacks, with expanded operations expected from September 9.
Buybacks can reduce the amount of duration available to private investors, but they do not eliminate the government’s overall debt burden.
US Treasury debt outstanding has now moved beyond $40 trillion. Meanwhile, the composition of Treasury demand has shifted toward more price-sensitive investors, including funds, households and relative-value traders, while the traditional price-insensitive official-sector bid has become less dominant.
This is one reason term premium can become a structural issue rather than merely a cyclical one.
The Global Sovereign Debt Wave Is Bigger Than the US
The pressure is not limited to the United States, which helps explain why the dollar’s traditional safe-haven behavior has become less automatic than it was during earlier crises such as 2011 or 2020.
OECD governments issued record amounts of debt in 2025 and are expected to raise approximately $18 trillion gross during 2026. Refinancing requirements are estimated at around $14 trillion, while net borrowing could approach $4 trillion. Total outstanding OECD sovereign bond debt has already surpassed $60 trillion.
Japan is dealing with a 10-year government bond yield that has approached 3%. European governments still need to refinance debt accumulated during the pandemic era at significantly higher borrowing costs. Emerging-market governments are also competing for the same international pool of capital.
When Treasuries, German Bunds, UK Gilts and Japanese government bonds all require heavy refinancing during the same period, the marginal dollar of institutional demand becomes increasingly sensitive to relative yields.
That is the essence of the current sovereign “avalanche.” It is not necessarily a wave of defaults. Instead, it represents a persistent supply of government duration that must be absorbed by investors at a price that makes the risk worthwhile.
For the dollar, this creates a two-sided dynamic.
A genuine global crisis can still drive investors toward Treasuries and therefore support the dollar. But if the problem originates within sovereign bond markets themselves — too much government debt competing for insufficient savings — the dollar no longer automatically benefits.
The US currency wins only if American assets continue to look relatively attractive and if the Federal Reserve is not simultaneously easing policy while government issuance accelerates.
That is why the 100 level on DXY has increasingly become a test of whether US yields represent a global capital magnet or a warning signal about fiscal risk.
Commodities Offer Another Clue About Dollar Direction
The traditional inverse relationship between the dollar and commodities remains relevant.
A weaker DXY reduces the effective dollar cost of globally traded commodities. Gold typically benefits from such a move, while industrial metals can also gain if the weaker currency reflects easier monetary conditions rather than deteriorating economic growth.
Oil is more complicated. It is priced in dollars but is primarily driven by supply, demand, geopolitical developments and spare capacity. A supply shock can push oil higher even while the dollar appreciates.
The likely relationships around Friday’s payroll report are relatively straightforward.
A weak NFP reading could pressure the dollar, support gold and boost metals if falling real yields provide additional assistance.
A strong employment report could lift DXY toward 100 and temporarily weigh on gold as markets price a more restrictive Federal Reserve stance.
Oil, however, will probably focus more heavily on the growth implications of the employment report and developments in the Middle East than on the dollar alone.
Commodities can subsequently feed back into the currency through inflation expectations. A weaker dollar that simultaneously pushes oil and import prices higher while wage growth remains firm could strengthen expectations for another challenge of 100.
Conversely, if the dollar falls alongside declining real yields and stable oil prices, the move could reinforce the broader bearish pressure on DXY.
The wage component of Friday’s report therefore acts as the key link between these two scenarios.
The Dollar’s Current Risk Profile
DXY should be viewed as a hybrid asset rather than a straightforward risk-off trade.
It remains an important funding currency for global carry strategies. When volatility is low and the Federal Reserve is holding rates steady, investors can borrow or short the dollar to finance positions elsewhere.
That makes the 100 region particularly crowded for dollar bulls. Late buyers risk entering just as upside momentum is becoming exhausted, leaving the market vulnerable to a disappointing economic report.
The dollar is also a currency driven by policy divergence. If Friday’s data pushes the Federal Reserve toward tighter policy while Europe and Japan remain constrained by their own fiscal and bond-market pressures, the dollar could strengthen even against a backdrop of elevated US fiscal concerns.
Policy divergence remains one of the strongest bullish arguments for DXY below 100.
But the dollar is no longer viewed as an unquestioned fiscal safe haven. Markets increasingly distinguish between the unparalleled depth of US financial markets and the country’s unusually large fiscal deficit.
Market depth can keep the dollar strong during a sudden crisis. It does not necessarily prevent a gradual decline when government issuance becomes the dominant theme.
Positioning ahead of NFP should therefore account for this mixed character.
Buying a pre-release move toward 99.80 risks paying a premium for a level that has repeatedly rejected the dollar. At the same time, aggressively selling every rebound toward 99.50 without a clear strategy below 98.70 ignores the possibility that strong wage data could produce a rapid squeeze higher.
A more disciplined approach is to preserve optionality around the 100 level or wait for the initial 15-minute range following the 08:30 ET release to break before committing to the direction.
What Could Actually Change the Technical Picture?
Three developments would matter most.
First, NFP and wage growth would need to push two-year Treasury yields above their recent highs and keep them there into the following week’s inflation data. That would provide the strongest foundation for another attempt at 100.
Second, Treasury auctions would need to show signs of deteriorating demand, such as weaker indirect participation, while markets simultaneously price a more restrictive Federal Reserve. That combination could cause the dollar rally to fail at 100 because rising yields would be viewed as compensation for fiscal risk rather than evidence of stronger monetary support.
Third, a genuine global duration sell-off could emerge, with Japanese government bonds, UK Gilts and US Treasuries all falling together and overwhelming the traditional safe-haven demand for dollars.
That would represent the broader sovereign-debt “avalanche” scenario. It would not require a dramatic crisis headline. It could simply result from another quarter in which enormous government bond issuance meets a smaller pool of official-sector demand.
Until one of these catalysts materializes, the daily DXY chart remains clear.
100 is still the key barrier.
The recent 98.99 close reinforces the market’s refusal to accept higher levels. Friday’s NFP report is unlikely to permanently settle the issue, but it could determine whether the dollar’s next encounter with 100 finally produces a breakout — or another rejection.
The US Dollar Index remains under pressure after Fed Governor Christopher Waller suggested a possible pause in interest rate increases, diverging from Kevin Warsh’s more hawkish stance.
Following Waller’s comments, market-implied odds of a Federal Reserve rate hike in September dropped to 50.2%.
Traders are now focused on the US August Nonfarm Payrolls report, which is forecast to show 56,000 new jobs and an unemployment rate holding steady at 4.1%.
The US Dollar Index (DXY), which tracks the US Dollar (USD) against six major currencies, remains under pressure for a third straight session, trading near 99.00 during Asian trading hours on Friday.
The Greenback weakened after Federal Reserve Governor Christopher Waller indicated that he would favor keeping interest rates unchanged at the September policy meeting, assuming upcoming inflation figures do not deliver any major surprises.
Waller’s relatively dovish stance contrasts with the more hawkish tone struck by Fed Chairman Kevin Warsh just one week earlier. Following Waller’s remarks, expectations for a September rate hike declined sharply, with the CME FedWatch Tool putting the probability at 50.2%, down from 63.2% a day earlier.
Market attention is now turning to the US August employment report, which could provide fresh clues about the Federal Reserve’s next policy steps. Economists expect Nonfarm Payrolls to rise by 56,000, while the Unemployment Rate is projected to hold at 4.1%.
Meanwhile, a stronger Japanese Yen is adding to the Dollar’s downside pressure. Traders are closely monitoring the possibility of Japanese authorities intervening in the currency market while also increasing bets on potentially tighter monetary policy from the Bank of Japan later this year.
Yen extends gains as intervention risks increase
Scotiabank strategists noted the Yen’s unusually strong performance, highlighting a 1.5% gain against the US Dollar that builds on Wednesday’s significant advance. The sharp appreciation has revived speculation that Japanese authorities could intervene to prevent excessive Yen strength or further volatility in the USD/JPY pair.
Technical Analysis: DXY remains under bearish pressure
On the daily chart, the US Dollar Index is trading around 98.98, maintaining a bearish short-term outlook below both the 9-period and 50-period Exponential Moving Averages (EMAs), which have shifted into resistance.
The 14-day Relative Strength Index (RSI) remains below the 50 level at around 40, indicating that selling pressure is still present despite the recent slowdown in the decline. At the same time, the weakening FXS Fed Sentiment Index points to reduced support for the US Dollar from expectations surrounding Fed policy.
Initial resistance is seen around 99.26, corresponding to the 9-period EMA, while the 50-period EMA near 99.79 creates a stronger resistance zone. A sustained daily close above these moving averages would help reduce the current bearish bias. Until then, the DXY remains exposed to further declines toward previous daily-chart lows.
USD/JPY remains under pressure near its lowest level in a month.
Softer expectations for additional Federal Reserve tightening and lower US Treasury yields continue to weigh on the US Dollar.
Rising expectations of further Bank of Japan rate hikes, together with speculation of official intervention, are providing support for the Japanese Yen.
The USD/JPY pair traded in a narrow range during Friday’s Asian session, hovering around 155.75 after recent declines. Although little changed on the day, the pair remains close to its August low and is on track for a significant weekly loss as investors await the latest US Nonfarm Payrolls (NFP) report.
Market participants are closely monitoring the employment data for clues about the Federal Reserve’s next policy move. With expectations for a September rate increase having eased, the report could shape the outlook for US interest rates and influence near-term Dollar performance. Until then, traders may remain cautious about betting on a sustained recovery in USD/JPY.
The US Dollar weakened after Federal Reserve Governor Christopher Waller noted that inflation appears to be moderating, increasing the likelihood that policymakers could leave interest rates unchanged at the upcoming FOMC meeting. The comments pushed US bond yields lower and dragged the Dollar to its weakest level in more than a week.
Meanwhile, the Japanese Yen continues to benefit from growing expectations that the Bank of Japan will tighten policy further. Markets have largely priced in a 25-basis-point rate hike at the September 17–18 BoJ meeting, with another increase potentially following in December. Expectations strengthened after BoJ board member Hajime Takata suggested the central bank should take a more flexible approach to rate hikes rather than adhering to a fixed semi-annual schedule. Combined with speculation of currency market intervention, these factors continue to support the Yen and limit upside potential for USD/JPY.
USD/JPY Technical Outlook: Bears Remain in Control Below Key Resistance
4-Hour Chart Analysis
From a technical perspective, USD/JPY continues to trade with a bearish bias after failing to sustain a move above the 200-period Simple Moving Average (SMA) on the 4-hour chart earlier this week. The rejection from this key trend indicator suggests that sellers remain firmly in control of the market.
A decisive break below the August swing low in the 155.25–155.20 area could act as a fresh bearish signal, potentially attracting additional selling pressure. Such a move may push the pair below the psychological 155.00 level and extend the corrective decline from its recent multi-decade peak.
Key Support Levels
155.25–155.20 – August swing low
155.00 – Psychological support
154.50 – Next potential downside target
154.00 – Major support zone
Key Resistance Levels
200-period SMA (4H) – Immediate resistance
160.00 – Major psychological barrier
For bullish momentum to return, USD/JPY would need to reclaim and hold above the 200-period SMA. A sustained move beyond the 160.00 level would be required to significantly reduce the current downside pressure and signal a broader shift in market sentiment.
Overall, the technical structure continues to favor sellers, with downside risks remaining elevated as long as the pair trades below key resistance levels.
GBP/USD bulls remain cautious as expectations for Fed policy help curb the dollar’s decline following weak US ADP employment data.
Rising US-Iran tensions continue to support the safe-haven US dollar, keeping upward pressure on GBP/USD limited.
Traders await the US ISM Services PMI for fresh direction ahead of Friday’s Nonfarm Payrolls (NFP) report.
The GBP/USD pair remains below the key 1.3500 level during Thursday’s Asian session, consolidating near a three-week low reached in the previous session.
The US Dollar (USD) steadies after retreating the day before, supported by expectations for tighter Federal Reserve (Fed) policy and ongoing geopolitical uncertainty. Markets have increased bets that the Fed could raise interest rates this month following hawkish comments from Fed Chair Kevin Warsh last Friday. Rising energy prices also add to inflation concerns, strengthening the case for tighter monetary policy and providing support for the USD, which weighs on GBP/USD.
At the same time, US-Iran tensions have intensified after fresh US strikes on Iranian targets were followed by retaliatory drone and missile attacks from Tehran across the Gulf. Persistent confrontations around the Strait of Hormuz are keeping geopolitical risks elevated and further boosting demand for the safe-haven US Dollar. However, weaker US Treasury yields are preventing USD buyers from making aggressive moves and helping limit downside pressure on GBP/USD.
Investors now await the US ISM Services PMI for fresh trading signals, while Friday’s closely watched Nonfarm Payrolls (NFP) report remains the main focus. Further developments in the Middle East could also drive volatility across financial markets, influencing USD movements and creating short-term trading opportunities in GBP/USD.
On the 4-hour chart, GBP/USD is trading near the 200-period Simple Moving Average (SMA) and remains above the 50.0% Fibonacci retracement of the July-August advance. A decisive break below this level could expose the pair to deeper Fibonacci support at 1.3425 and 1.3357, where buyers may attempt to defend the broader bullish structure.
On the upside, immediate resistance stands at the 38.2% Fibonacci retracement near 1.3521, followed by the 23.6% level at 1.3580. Further gains could bring the cycle-high resistance around 1.3676 into focus.
The US dollar has opened September under pressure, surrendering around half of the gains sparked by Federal Reserve Chair Kevin Warsh’s hawkish remarks on Friday. At first glance, this may suggest that investors are starting to scale back expectations for tighter Fed policy. However, the rates market is sending a somewhat different signal.
The front end of the US yield curve remains substantially repriced. Two-year SOFR rates are holding above 4.20%, more than 10 basis points above pre-Warsh levels, while markets are pricing in roughly 16 basis points of tightening for September and around 37 basis points through the end of the year. Put simply, the dollar has weakened even though expectations for Fed tightening have remained largely intact.
That disconnect is becoming the central theme for FX markets this week.
Dollar Weakens Despite Higher Rate Expectations
All G10 currencies strengthened against the dollar on Monday, despite continued hawkish pricing in the US front end.
Under normal circumstances, that setup would favor the greenback. Higher anticipated US interest rates increase the relative appeal of dollar-denominated assets and can encourage capital inflows into the currency.
Instead, investors appear increasingly focused on the longer end of the Treasury curve.
Long-term US yields have climbed, partly alongside renewed oil-price gains following another round of strikes between the US and Iran. Rather than interpreting higher yields simply as evidence of stronger returns on US assets, currency markets appear to be viewing the move through the lens of fiscal concerns.
That is important because investors are becoming increasingly alert to the possibility of Treasury measures aimed at containing borrowing costs.
Fiscal Risks Complicate the Dollar’s Bullish Case
The latest market reaction indicates that the so-called debasement trade remains relevant.
Treasury Secretary Scott Bessent’s earlier push toward larger Treasury buybacks appears to have continued influencing investor thinking. If markets believe that a sustained rise in long-term yields could eventually prompt stronger Treasury intervention, then higher yields may not automatically translate into dollar gains.
Instead, they could intensify concerns about fiscal sustainability, government debt management and the currency’s longer-term purchasing power.
This has created a notable split across the US yield curve.
The front end suggests the Fed could maintain a tighter stance, providing fundamental support for the dollar.
The long end is highlighting fiscal and Treasury-management risks, limiting that support.
For dollar bulls, this divergence is becoming increasingly important. The Fed’s hawkish repricing has so far failed to fully overcome the fiscal-risk premium weighing on the currency.
US Data Will Determine Whether the Dollar Pullback Deepens
Despite Monday’s decline, it may still be too early to aggressively bet against the dollar.
Following Warsh’s comments, investors would likely need a series of significantly weaker US economic reports before expectations surrounding the September 16 FOMC meeting are materially reversed.
The data sequence begins with ISM Manufacturing and JOLTS, followed by ADP employment, ISM Services, and ultimately Friday’s nonfarm payrolls report.
Current expectations point to a relatively resilient US economy.
ISM Manufacturing is projected to remain above 55, while services activity is expected to stabilise. ADP employment growth of roughly 40,000 would indicate softness but may not be sufficient to fundamentally alter the Fed outlook. Likewise, payroll growth around 65,000 would suggest a cooling labor market rather than an outright collapse.
That distinction is crucial.
A moderate slowdown alone is unlikely to erase Warsh’s hawkish message. For the dollar’s decline to evolve into a more durable trend, several economic indicators would likely need to weaken simultaneously and force markets to substantially reduce expectations for September tightening.
DXY: 100 Is Still the Critical Barrier
Technically, the US Dollar Index (DXY) is trading near 99.60, after recovering from August lows around 98.60 but failing so far to regain the psychologically significant 100.00 level.
The technical picture highlights the key battle. The 100.00–100.15 zone has emerged as important resistance following August’s breakdown. A decisive move above this area would indicate that the post-Warsh repricing is beginning to translate back into the FX market and would strengthen the argument for another advance in the dollar.
For now, DXY remains below that threshold.
The dollar therefore finds itself at an interesting crossroads: monetary-policy expectations remain supportive, but price action has yet to validate that bullish outlook.
Opening Bell View
The key question this week is not simply whether upcoming US data beats or misses expectations. Instead, investors need to determine whether the economic numbers are weak enough to reverse the hawkish repricing already reflected in short-term interest rates.
If manufacturing, services and labor-market data remain broadly resilient, the front-end rates narrative should continue supporting the dollar, potentially allowing DXY to make another attempt at 100.00. Seasonal trends in September have also historically provided some support for the greenback.
Conversely, if the US economy delivers a series of significant downside surprises and markets begin removing expectations for September tightening, the current dollar pullback would gain a much stronger fundamental basis.
For now, the clearest interpretation is that the dollar’s correction has moved further than the shift in Fed expectations would suggest.
The next move therefore depends heavily on the US data. Until short-term rates begin moving lower alongside the dollar, the decline below 100 appears more like a test of the hawkish Fed narrative than a confirmed reversal of it.
Friday’s breakdown below the rising support line marked the first major warning for gold, while Monday’s close confirmed the second as prices settled below the $4,500 level.
Gold ended Monday at $4,481.50 and has since slipped toward $4,426, putting both bearish signals firmly in place. However, this weakness is viewed as temporary within the broader long-term bull market, with the next few months potentially resembling the consolidation seen in late 2012 and 2013 before the larger uptrend resumes.
Silver Confirms the Bearish Signal
Silver’s recent short-term strength proved short-lived. As expected, the metal has now fallen at roughly twice gold’s pace, resolving the earlier outperformance within a single session.
Silver remains near its declining resistance line, but a decisive close back below that level could trigger a much sharper decline. The bearish setup is reinforced by several technical signals:
Silver has already broken below its rising support line.
Friday’s high occurred precisely where two support/resistance lines intersected, once again highlighting the importance of these technical levels.
Dollar Breakout Adds Pressure
The US Dollar Index has now closed above its declining resistance line for three consecutive sessions, confirming the recent breakout. With the dollar continuing to advance, the August decline in the greenback increasingly appears to have run its course.
That development creates an unfavorable backdrop for precious metals. A stronger dollar, combined with rising oil prices and renewed inflation concerns, could keep downward pressure on gold and silver.
Gold Falls Despite Renewed Conflict
The most important signal from today’s session is how gold reacted when geopolitical tensions escalated again.
The US and Iran exchanged strikes after roughly a month without direct attacks. US forces reportedly targeted Iranian rocket launchers on Larak Island, while Iran responded with missile and drone attacks against US facilities in Jordan and the UAE. Reports also indicated that a tanker struck mines and a bulk carrier was seized near Bandar Abbas, while President Trump renewed threats involving Kharg Island, a major Iranian oil-export hub.
Brent crude climbed back above $90, yet gold fell by more than 1%.
That reaction is significant. A month earlier, similar headlines triggered massive rallies in gold. This time, renewed fighting and a surge in oil prices failed to attract a sustained safe-haven bid.
The market appears to be focusing instead on the inflationary impact of higher oil prices. Rising energy costs could keep inflation elevated, encouraging the Federal Reserve to maintain a hawkish stance. Combined with the confirmed dollar breakout, that pressure appears to be outweighing gold’s traditional geopolitical safe-haven appeal.
The Bigger Picture
Gold and silver are both showing increasingly bearish technical signals, while mining stocks are also moving lower. At the same time, the US dollar has confirmed its breakout and rising oil prices are reinforcing inflation concerns.
The clearest takeaway is simple: when a major geopolitical escalation occurs and gold falls instead of rising, the market is sending a powerful signal that traders should not ignore.
USD/JPY remains supported by a mix of domestic and external factors.
Japan’s growing fiscal challenges and the persistent interest rate gap with the US continue to weigh on the Japanese Yen.
Expectations of further Fed tightening, alongside geopolitical uncertainty, are boosting demand for the US Dollar.
The USD/JPY pair traded close to its strongest level since July 31 during Wednesday’s Asian session, hovering around the 160.25–160.30 area after recent gains.
Pressure on the Japanese Yen intensified after a global bond selloff pushed Japan’s 10-year government bond yield to 3% for the first time since 1996. Rising borrowing costs are increasing concerns over the sustainability of Japan’s substantial debt burden, particularly as Prime Minister Sanae Takaichi pursues ambitious investment initiatives. These fiscal worries have weakened sentiment toward the Yen and provided additional support for USD/JPY.
At the same time, US Treasury Secretary Scott Bessent reiterated his view that the Bank of Japan should take stronger monetary action to address Yen weakness, reinforcing market expectations of a BoJ rate increase later this month. Despite the prospect of tighter policy, Japanese interest rates remain well below those in other major economies, especially the United States, preserving the attractiveness of Yen-funded carry trades and limiting support for the currency.
BoJ Under Growing Pressure as Markets Await Policy Signals
According to Rabobank strategist Jane Foley, scrutiny of the Bank of Japan has increased significantly as US officials continue to comment on Japanese monetary policy. She noted that Bessent recently intensified pressure on the central bank by expressing confidence that it would “do the right thing” and signaling a strong possibility of a rate hike later this month. Such remarks highlight the heightened focus on the BoJ’s next policy move as bond yields rise and the Yen remains under strain.
Meanwhile, the US Dollar continues to benefit from safe-haven demand amid escalating tensions between the United States and Iran. Growing expectations that the Federal Reserve could raise interest rates again, fueled by concerns that higher oil prices may keep inflation elevated, have also strengthened the Greenback.
Despite the favorable backdrop for USD/JPY, traders appear reluctant to make aggressive new bullish bets ahead of Friday’s US Nonfarm Payrolls report, which could provide important clues about the Fed’s policy outlook and the next directional move for the currency pair.
Technical Analysis: USD/JPY
USD/JPY maintains a positive short-term bias and is attempting to extend its advance after breaking above the key 200-period Simple Moving Average (SMA) on the 4-hour chart at 160.20. Sustained trading above this level suggests improving bullish momentum and keeps the focus on higher resistance targets.
The first upside objective is the 61.8% Fibonacci retracement level at 160.64. A decisive break above this barrier could open the door toward the 78.6% retracement near 162.10, followed by the previous swing high around 163.96.
On the downside, immediate support is located at the 200-period SMA around 160.20. Further weakness could see the pair test the 50% Fibonacci retracement at 159.62. A move below this level may accelerate selling pressure toward the 38.2% retracement at 158.59, with the 23.6% Fibonacci level near 157.32 serving as the next significant support zone.
Overall, the technical outlook remains constructive while USD/JPY holds above the 160.20 region, though traders may remain cautious ahead of Friday’s US Nonfarm Payrolls report.
EUR/USD edged higher to around 1.1620 during Tuesday’s early Asian session, maintaining its position above the key 1.1600 level as markets await the release of the Eurozone’s preliminary August HICP inflation figures.
The Euro remains supported despite a firmer US Dollar, with traders closely watching the upcoming inflation data for clues about the European Central Bank’s next policy moves.
In Germany, consumer inflation accelerated to 2.9% year-on-year in August, up from 2.8% in July and marking the third straight monthly increase. However, monthly CPI growth slowed to 0.2%, below the 0.3% market forecast.
The ECB has already raised borrowing costs once, and markets are increasingly pricing in another rate hike at its September 10 meeting. Investors are also anticipating further monetary tightening into next year if inflation remains persistent.
Meanwhile, hawkish signals from the Federal Reserve could limit EUR/USD’s upside. Traders have increased expectations for a September Fed rate hike after Kevin Warsh indicated that policymakers may need to take further action if they lack confidence that underlying inflation is moving back toward the 2% target.
Warsh Provides Clearer Guidance on Fed Policy
Scotiabank strategists noted that Warsh’s Jackson Hole remarks helped clarify his policy stance following the uncertainty surrounding his comments after the July FOMC meeting. His latest comments provided markets with a clearer signal ahead of the September policy decision.
For EUR/USD, the focus now shifts to the Eurozone HICP inflation report, which could provide fresh direction for the pair and influence expectations for both ECB and Fed policy.
Technical Analysis: EUR/USD
On the daily chart, EUR/USD is trading around 1.1622, maintaining a mildly bullish structure. The pair has moved above the 20-period Bollinger Band midpoint at 1.1600 and the 100-day SMA near 1.1570, reinforcing the positive setup following its rebound from the mid-1.15 area.
Momentum also remains supportive, with the 14-day RSI near 57, indicating continued buying interest while still staying comfortably below overbought territory.
On the upside, the upper Bollinger Band around 1.1713 represents the next key resistance zone, where the pair could encounter some profit-taking. On the downside, 1.1600 serves as the first support level, followed by the 100-day SMA near 1.1570. A break below these levels could open the way toward the lower Bollinger Band around 1.1488, which represents a stronger potential demand zone.
Silver attempted to extend its rally during the week but struggled to maintain momentum above the $70 mark. Renewed concerns over U.S. interest rates and comments from Federal Reserve Chairman Kevin Warsh shifted sentiment, prompting traders to reassess expectations for future monetary policy.
The $70 level now appears to be a significant resistance zone, and the metal could remain under pressure in the near term while markets digest the Fed’s outlook.
Nasdaq 100
The Nasdaq 100 experienced considerable volatility throughout the week, ultimately remaining trapped within a broad consolidation range. Despite short-term uncertainty and lingering concerns among investors, strong corporate earnings continue to support the longer-term bullish trend.
Traders may look for fresh buying opportunities after the recent pullback, although caution remains elevated.
Gold
Gold pushed toward the $4,700 level but failed to establish a decisive breakout. Hawkish remarks from Fed Chair Kevin Warsh unsettled financial markets and increased focus on the critical $4,500 support area.
This psychologically important level could determine the next major move, with a sustained break lower potentially triggering a deeper correction.
AUD/USD
The Australian dollar initially advanced but quickly surrendered gains, forming a bearish weekly candlestick pattern that reflects growing hesitation among buyers. With the pair approaching the upper boundary of its longer-term trading range and technical indicators signaling overbought conditions, downside risks are increasing. Key support remains near the 0.69 level.
USD/MXN
The U.S. dollar strengthened notably against the Mexican peso, particularly toward the end of the week.
While Mexico still offers a favorable interest-rate advantage, expectations that the Federal Reserve could maintain a restrictive stance for longer have boosted demand for the greenback. The 17.00 area remains an important technical level that traders continue to monitor closely.
GBP/USD
Sterling lost momentum during the week as markets reacted to unexpectedly hawkish signals from the Federal Reserve.
After testing a major resistance zone on the higher time-frame charts, GBP/USD appears vulnerable to remaining within its established range. Unless new catalysts emerge, range-bound trading may continue in the weeks ahead.
EUR/USD
The euro retreated sharply after failing to sustain gains above the 1.17 level, a price area that has repeatedly acted as resistance.
Investors increasingly favor the U.S. dollar as interest-rate expectations continue to support the greenback. If the policy gap between the Federal Reserve and the European Central Bank widens further, additional pressure on EUR/USD could follow.
BTC/USD
Bitcoin reversed course dramatically late in the week, raising questions about the strength of the recent rally.
Although the broader trend remains constructive, the inability to decisively overcome the $80,000 threshold suggests bullish momentum may be fading. Traders will be watching closely to see whether a deeper pullback develops, with the $80,000 level continuing to act as a major obstacle.
The US Dollar has maintained a generally firmer tone this week amid relatively subdued market conditions. Higher US Treasury yields, combined with an oversold short-term technical backdrop, are providing support for the Greenback. The Dollar is also holding firm against the Japanese Yen, despite comments from a Bank of Japan Deputy Governor that appeared to reinforce expectations of a possible rate hike next month. So far, movements in US yields appear to have a stronger influence on USD/JPY than changes in Japanese rates.
Meanwhile, Russia and China have formally rejected participation in the US-led economic pressure campaign against Iran. Without their involvement in “Operation Economic Outcast,” Washington’s policy toward the conflict may provide a pathway for reducing its direct involvement. At the same time, the US appears to be increasing pressure on Canada, with Trade Representative Greer warning that some Canadian imports could face restrictions. Despite the escalating tensions, the Canadian Dollar has remained relatively resilient, falling around 0.25% this week and ranking around the middle of the G10 performance table.
Prices
G10
EUR/USD: The Euro slipped to a five-day low near 1.1640 on Wednesday, roughly the midpoint of its rally following the US Treasury’s announcement that it would double its bond buybacks. The pair has remained below 1.1660 today and has edged slightly beneath Wednesday’s low during the European session. Technical support is seen around 1.1635 at the 200-day moving average, followed by the 1.1625 area near the 61.8% Fibonacci retracement.
USD/JPY: The Dollar remained below Tuesday’s high around 159.50 against the Yen but still recorded its strongest close in six sessions near 159.30. The pair has marginally surpassed Wednesday’s high in European trading. The five-day moving average has crossed above the 20-day moving average for the first time since the July intervention. The market continues to appear willing to test the BOJ and US Treasury, despite growing expectations that the BOJ could raise rates twice before year-end. Higher oil prices and US yields may provide additional support. The August 18 high, just below 159.80, remains the key level above.
GBP/USD: Sterling declined roughly 0.4% on Wednesday, marking one of its sharpest daily losses in a month. The pair fell to just below 1.3585, almost reaching the 61.8% retracement of its rally following the US Treasury’s bond-buyback announcement. Losses have continued today, with GBP/USD approaching 1.3570. Further technical support is seen around 1.3335–1.3360. Options worth GBP840 million at 1.3550 expire today.
USD/CAD: The Canadian Dollar remains under pressure following the sharp deterioration in US-Canada trade relations. Consistent with historical correlations, CAD weakness has coincided with a widening Canada-US two-year yield spread, which reached 128 basis points on Wednesday, its widest level in nearly three weeks. USD/CAD climbed toward 1.3895 before holding below that level today. Initial resistance is located near last week’s high around 1.3910, followed by the 20-day moving average near 1.3920 and the 1.3950–1.3960 zone. Trade Representative Greer’s threat to restrict certain Canadian imports remains an additional source of pressure.
AUD/USD: The Australian Dollar approached 0.7190 on Wednesday, its strongest level since June 1, before profit-taking pushed it back toward 0.7165. The five-day moving average is also located around this level, and the Aussie has remained above it for roughly two weeks. Stronger-than-expected Australian inflation data and robust household spending have reinforced expectations that the RBA could deliver another rate hike.
Emerging Markets
USD/MXN: The Dollar traded on both sides of Tuesday’s range against the Mexican Peso but settled within it, leaving the near-term bias tilted slightly higher. Momentum indicators remain technically oversold after five consecutive weeks of declines. Rising US-Canada trade tensions may also increase concerns about the future of USMCA. USD/MXN has edged slightly above 16.99 today. A move above 17.00 would expose last week’s high just below 17.08, followed by the 20-day moving average near 17.10 and the 17.1365 area, corresponding to the 38.2% retracement of the Dollar’s decline from late July.
USD/CNH: After closing below 6.72 on Tuesday for the first time in roughly three and a half years, the Dollar recovered and settled around 6.7225 against the offshore Yuan. The pair is consolidating near 6.72 today. The firmer Dollar appears to have encouraged the PBOC to set a slightly weaker reference rate, with the CNY fixing raised to 6.7840 from 6.7829.
USD/INR: The Indian Rupee weakened as markets reopened following Wednesday’s holiday. Higher oil prices and a broadly stronger US Dollar weighed on the currency. The Rupee had gained around 0.35% on Tuesday, its strongest advance in nearly a month. USD/INR has rebounded toward 95.56 after reaching around 95.39 earlier in the week, with last week’s high slightly above 95.76.
Other Markets
US equities faced some pressure from higher yields and oil prices ahead of NVIDIA’s earnings, although the company’s results subsequently supported parts of the technology sector across Asia-Pacific markets. South Korea’s KOSPI gained around 1.5%, standing out among regional markets despite the central bank’s recent rate hikes. The benchmark rate now sits at 3%. In Europe, the technology-light Stoxx 600 was down around 0.4% during the morning session. Meanwhile, Nasdaq futures were up roughly 1%, while S&P 500 futures gained slightly less.
Benchmark 10-year government bond yields rose by around 3–5 basis points across the US and Europe on Wednesday. Yields remained broadly firmer today, with European rates rising 1–2 basis points and the US 10-year Treasury yield increasing around 2 basis points.
Gold ended a five-session winning streak with a sharp 1.3% decline on Wednesday, giving back more than two days of gains. The precious metal remained under pressure today, falling to a four-day low slightly below $4,579. If the recent rally was partly driven by the US Treasury’s bond-buyback announcement, the first corrective target could be around $4,555. Silver also appears vulnerable after encountering strong resistance near $70, although it remains within Tuesday’s trading range of roughly $67.45–$69.95.
October WTI crude recovered from a dip below $80, its first move under that level since August 14, before reaching an intraday high near $83.30 during New York trading. Oil remains above $80 today and is hovering around $82 ahead of the North American session. Last week’s high was close to $87.70.
Economic Data
The US economic calendar includes the preliminary goods trade deficit, retail and wholesale inventories, weekly Initial Jobless Claims, and the Kansas City Fed’s August manufacturing survey. The improvement in the US trade balance remains distorted by businesses bringing forward imports ahead of last year’s tariffs. Even so, the overall trade deficit narrowed to roughly $534.8 billion in the first half of 2026 from $716.6 billion in H1 2025 and $558 billion in H1 2024. Inventory figures typically have limited immediate market impact but feed into GDP estimates, alongside the real trade balance.
Weekly jobless claims continue to point to a relatively resilient labor market. The four-week moving average declined for five consecutive weeks through the end of July before edging higher to around 204,000 in mid-August.
Canada is scheduled to release its June establishment employment figures, although markets tend to react more strongly to the timelier household employment survey. Statistics Canada will also publish an estimate of the Q2 current account ahead of tomorrow’s preliminary GDP report. After remaining in deficit since Q2 2022, Canada’s current account is expected to have moved into surplus in Q2 2026. Following contractions in Q4 2025 and Q1 2026, the economy is expected to regain lost ground in Q2, with forecasts centered around 3.2%–3.4% annualized growth. However, the intensifying trade dispute with the US could weigh on growth later in the year.
Mexico will publish its July trade balance. The country’s external trade remains a relative bright spot, with the first-half trade surplus increasing to around $9.86 billion from $1.43 billion a year earlier. Exports rose 10.7% in H1, while imports increased 7.7%. The central bank recently raised its 2026 GDP growth forecast to 1.5% from 1.1% and slightly lowered its 2027 inflation projection.
Eurozone M3 money supply growth accelerated to 3.4% year over year in July from 3.3% in June, marking its fastest pace since June 2025. Household lending growth increased to 3.1%, while lending to non-financial corporations accelerated to 4.4%.
In Australia, stronger-than-expected CPI data was followed by evidence that higher interest rates have yet to significantly weaken household spending. Consumer spending jumped 1.1% in July, well above the 0.3% consensus forecast, while June growth was revised higher to 1.0%. Although private capital expenditure fell unexpectedly in Q2, the previous quarter’s increase was revised higher. Markets are now pricing in almost a 50% probability of an RBA rate hike next month, compared with just over 10% at the end of last week, while a hike before year-end is now fully priced in.
Japanese investors sold foreign bonds and equities last week after three consecutive weeks of buying. Foreign bond sales reached JPY1.98 trillion, the largest weekly outflow since early April, while foreign equity sales totaled nearly JPY870 billion, the biggest liquidation since early June.
China’s industrial profit growth slowed to 11.2% year over year in July from 15.1% in June, marking the third consecutive monthly slowdown. However, the headline figure masks a notable divergence, with the high-tech sector continuing to account for more than half of year-to-date profit growth.
AUD/USD climbs to a three-month peak as improving risk sentiment supports the Aussie.
Resilient Australian consumer spending keeps the possibility of an RBA rate hike on the table.
Fed Chair Warsh’s speech and upcoming sentiment data could influence the US Dollar’s next move.
The Australian Dollar (AUD) extended its gains to a three-month high of 0.7198 on Thursday, despite a steady US Dollar supported by stronger-than-expected labor market data and hawkish remarks from Federal Reserve officials. AUD/USD was last trading around 0.7194, up 0.34%.
AUD/USD advances as strong Australian spending and Wall Street gains outweigh Fed hawkishness
Wall Street continued to move higher, supported by NVIDIA’s latest earnings results. US economic data was mixed, with Initial Jobless Claims falling from 207K to 203K, beating market expectations of 208K. Meanwhile, the US Goods Trade Balance deficit widened from $102.1 billion to $118.8 billion in July.
The US Dollar Index (DXY), which measures the Greenback against a basket of six major currencies, remained broadly unchanged near 99.12 despite higher Treasury yields. The benchmark US 10-year Treasury yield climbed nearly three basis points to 4.676%.
Several Federal Reserve officials also delivered comments at the Jackson Hole Symposium. Cleveland Fed President Beth Hammack argued that policymakers should act now to contain persistent inflation, while Chicago Fed President Austan Goolsbee said the three-month inflation trend “doesn’t look terrible.” Boston Fed President Susan Collins adopted a more neutral tone but noted that a rate hike could be justified if inflation data proves disappointing.
Attention now turns to Fed Chair Kevin Warsh, who is scheduled to speak at Jackson Hole on Friday. Investors will also assess the University of Michigan’s final Consumer Sentiment reading for August for additional clues on the US economic outlook.
Meanwhile, Australian household spending increased 1.1% in July, according to data released Thursday. The resilient consumer demand could add further inflationary pressure and reinforce expectations for tighter monetary policy. Minutes from the Reserve Bank of Australia’s latest meeting also showed that policymakers had considered the possibility of raising interest rates.
With no major Australian economic releases scheduled, AUD/USD is likely to remain primarily influenced by movements in the US Dollar and broader market sentiment.
AUD/USD Price Forecast: Technical Outlook
On the daily chart, AUD/USD is trading around 0.7195 and retains a bullish near-term outlook, with the pair firmly positioned above the 50-, 100-, and 200-day simple moving averages, which are clustered near 0.7010. The pair is currently testing horizontal resistance around 0.7198, while the 14-day Relative Strength Index (RSI) near 70 points to overbought conditions. This could limit the pace of additional gains, although it has yet to provide a definitive reversal signal.
On the upside, the key near-term hurdle remains at 0.7198. A sustained break above this level could reinforce the bullish momentum and pave the way for further upside.
On the downside, initial support is found around 0.7195, while stronger support lies along the rising trend line and the 50-, 100-, and 200-day SMA cluster near 0.7010. A deeper correction could bring the pair back toward this broader support zone.
EUR/USD holds modest gains around 1.1655 during Friday’s early Asian trading session.
Markets remain focused on Fed Chair Warsh’s speech at the Jackson Hole Symposium in Wyoming on Friday.
The ECB is widely expected to hike its key interest rates in September.
EUR/USD edges higher to around 1.1655 during Friday’s early Asian trading session. The pair could face increased volatility later in the day as Federal Reserve Chair Kevin Warsh prepares to deliver his closely watched keynote speech at the Jackson Hole Economic Policy Symposium.
The Euro continues to receive support from the European Central Bank’s hawkish policy outlook and resilient Eurozone economic data. ECB Executive Board member Isabel Schnabel said Wednesday that interest rates may need to rise further, citing inflationary risks stemming from the prolonged Middle East conflict and stronger-than-expected economic activity across the Eurozone.
Recent data also highlighted the resilience of the Eurozone economy, with business activity expanding at its fastest pace of the year. Markets are currently pricing in roughly a 96% probability that the ECB will lift its deposit rate to 2.50% at its September meeting.
Meanwhile, traders are closely awaiting Fed Chair Kevin Warsh’s speech in Jackson Hole, Wyoming, on Friday. His remarks could provide fresh insight into the outlook for the US economy and future monetary policy.
Bank of America’s US rates strategist Mark Cabana expects Warsh to indicate that further rate hikes remain possible if inflation fails to ease further. However, a speech focused mainly on longer-term structural issues such as productivity and demographics could be viewed by markets as relatively dovish.
ECB outlook continues to support the Euro
Scotiabank strategists point out that the Euro has recently lost some momentum as yield differentials have shifted, with German-US yield spreads providing slightly less fundamental support for the currency. Nevertheless, they believe the broader policy divergence between the ECB and Fed remains favorable for the Euro.
With markets increasingly anticipating ECB tightening in September while scaling back expectations for further Fed rate hikes, the relative monetary-policy outlook continues to offer a constructive medium-term backdrop for EUR/USD.
On the daily chart, EUR/USD retains a positive near-term outlook, with the pair trading above both the 100-day simple moving average (SMA) and the middle line of the 20-day Bollinger Bands. The pair is approaching resistance around the upper Bollinger Band, while the 14-day Relative Strength Index (RSI) near 65 indicates solid upward momentum without yet reaching overbought territory.
On the downside, initial support is located around 1.1585–1.1575, where the 100-day SMA and Bollinger middle band converge. A deeper correction could bring the pair toward stronger support near 1.1465, around the lower Bollinger Band.
On the upside, a decisive move above the upper Bollinger Band near 1.1710 could pave the way for additional gains. Conversely, another rejection at this level may trigger a pullback toward the 1.1585–1.1575 support zone.
DXY remains supported above the 99.00 level, though upside momentum is constrained by the 200-day EMA around 99.75.
Market-implied odds of a September Fed rate hike have fallen to 40.14%, down from roughly 50% on August 10.
The Dollar Index’s recent three-month low was driven by an expanded Treasury buyback program rather than a shift in Federal Reserve policy.
The US Dollar Index (DXY) trades slightly above 99.00, up around 0.25%, after climbing to just below 99.25 following stronger-than-expected US PCE inflation data. However, the move does not necessarily signal renewed expectations for a September Federal Reserve rate hike, as markets have actually reduced their rate expectations throughout August.
Fed Rate Expectations Shift Lower
Markets now price a 40.14% probability of a September 16 rate hike, versus 59.86% for a hold. Expectations for additional tightening have also weakened significantly, with the probability of rates reaching 4.00%-4.25% by December falling to 8.13% from 24.13% on August 10.
The 2027 outlook points in the same direction, with the probability of two rate increases by June falling to 74.50% from 86.71% two weeks earlier. This suggests traders are increasingly debating when the next hike could arrive rather than how far the Fed will ultimately raise rates.
Dollar Rebound Follows Fiscal Developments
The Dollar Index’s recent recovery began from around 98.50, its lowest level in more than three months. That decline followed the US Treasury’s expansion of its long-term debt buyback program, which was aimed at containing borrowing costs.
The fiscal backdrop remains a concern for the dollar. Treasury purchases of longer-dated bonds while issuing more debt at the short end effectively reduce the average maturity of government borrowing, a development that can weigh on the currency when investors interpret it as an attempt to suppress long-term yields.
Technically, DXY remains below the 200-day EMA near 99.75 and the 50-day moving average just below 100.00, leaving significant resistance overhead.
Key Levels to Watch
Resistance: 99.25, 99.75, 100.00, then 101.75
Support: 99.00, 98.50, followed by levels below 98.00
Bias: Bearish while DXY remains below the 200-day EMA near 99.75
Bullish invalidation: A daily close above 99.75 could shift attention toward 100.00
Despite the latest inflation-driven bounce, the broader technical setup remains fragile. A sustained break above 99.75 would be needed to suggest that the Dollar Index is transitioning from a short-term rebound into a more durable recovery.
The US dollar is trading mixed against the G10 currencies, with most major pairs moving within narrow ranges of around ±0.1%. The Norwegian krone is the notable exception, falling nearly 0.3% as Brent crude extended its decline for a second straight session, dropping more than 2%. The Canadian dollar remains under pressure from concerns that the US trade war could persist for longer. Meanwhile, despite softer US Treasury yields and a modest rise in Japanese government bond yields, the dollar climbed to a four-day high against the yen near JPY159.50.
China has formally opposed the unilateral and secondary sanctions imposed by the US on Iran and entities doing business with Tehran. Following the UAE’s decision to sever economic ties with Iran earlier this month, China has become Iran’s largest trading partner. US Treasury Secretary Bessent has suggested that a major financial institution could face sanctions in the coming days. Speculation has focused on two major Chinese banks that reportedly received formal warnings from the US Treasury in April. Sanctioning either institution ahead of next month’s Trump-Xi meeting could create significant market disruption.
Prices
G10
Euro: EUR/USD slipped to around $1.1655 yesterday, marking a fresh three-day low. It briefly dipped to approximately $1.1650 during late Asian trading before rebounding in early European hours to near $1.1675. The previous day’s high was slightly above $1.1685. Last week, European buyers twice pushed the euro toward $1.1710 before North American traders sold into the strength.
Japanese yen: Despite a nearly five-basis-point decline in the US 10-year Treasury yield yesterday, the dollar remained resilient against the yen. With US yields softer today but Japanese 10-year JGB yields moving higher, USD/JPY reached roughly JPY159.50. The pair has remained range-bound between about JPY158.00 and JPY159.60–159.80 for the past two weeks. While many market participants question the effectiveness of the recent intervention, expectations for a BOJ rate hike next month have surged to around 80%, compared with below 30% before the intervention. The probability of another hike by year-end has also risen to about 60%, from below 10%.
Sterling: GBP/USD posted an inside day yesterday, remaining within the pre-weekend range of roughly $1.3620–$1.3675, and continues to trade within that band. Momentum indicators are stretched, but the pair could still test a marginal new high. A move below $1.3590–$1.3600 would provide an early indication that a broader consolidation or correction is underway.
Canadian dollar: The Canadian dollar was the weakest G10 currency yesterday, losing around 0.6%—its largest daily decline since the Federal Reserve delivered a hawkish hold at Warsh’s first meeting as Chair. USD/CAD climbed to around CAD1.3860 yesterday and moved slightly above CAD1.3865 today. The next technical objective is around CAD1.3900–1.3910. The main driver was the two-year interest-rate differential, with the US yield premium widening by nearly 10 basis points to almost 130 basis points.
Australian dollar: After reaching approximately $0.7180 before the weekend, AUD/USD retreated toward $0.7140 yesterday. It touched a marginal new low today before recovering toward $0.7160. Although momentum indicators remain stretched, the pair could attempt to revisit last week’s high.
Emerging Markets
Mexican peso: Risk aversion, weaker monthly IGAE data and a downward revision to Q2 GDP growth—from 1.5% to 1.4% quarter-over-quarter—pressured the peso. USD/MXN climbed to around MXN16.9735 before easing toward MXN16.93 as risk sentiment improved. Last week’s high was around MXN17.07–17.08. The peso declined approximately 0.3% yesterday, its largest one-day drop in a month, while the Colombian peso fell about 0.8% and the Brazilian real weakened roughly 0.25%.
Chinese yuan: After falling to a marginal new low since February 2023 near CNH6.7130 yesterday, USD/CNH recovered toward CNH6.7255 and moved slightly higher today. Both technical and fundamental factors point to a potential period of consolidation. The PBOC fixed the dollar slightly higher for a third consecutive session, at CNY6.7852 versus CNY6.7841 previously. Meanwhile, reports indicate the US may consider an additional 7.5% tariff on Chinese goods over concerns about excess manufacturing capacity ahead of the upcoming Xi-Trump meeting. China’s rejection of the new Iran sanctions adds another layer of tension.
Indian rupee: The rupee strengthened to a seven-day high, apparently supported by intervention. USD/INR fell to around INR95.39, giving the rupee a 0.35% gain—the strongest daily advance of the month. The dollar settled near INR95.4150, marking its first close below the 20-day moving average, currently around INR95.48, since last Monday.
Other Markets
Equities: Global equities were generally firmer. Most major Asia-Pacific markets advanced, although Hong Kong and China’s CSI 300 lagged. The regional MSCI index only partially recovered from yesterday’s 1.2% decline. Europe’s Stoxx 600 was flat yesterday but has gained nearly 0.5% today. US equity futures are also higher, with S&P 500 futures up around 0.55% after yesterday’s 0.3% decline. Nasdaq futures have risen about 1% following a roughly 0.75% drop in the index yesterday.
Bonds: Benchmark 10-year yields declined yesterday, partly reflecting lower oil prices. Reports suggested Treasury officials are considering using the Treasury General Account to support additional government bond purchases, which would inject reserves into the banking system. Such a move could complicate Warsh’s objective of shrinking the Federal Reserve’s balance sheet. With oil prices moving higher today, European yields have fallen roughly 2–4 basis points, while the US 10-year Treasury yield is near 4.67%, compared with just below 4.70% at yesterday’s close.
Gold and silver: Gold’s four-session rally stalled near $4,681 yesterday, its highest level in more than three months, although it still closed above the pre-weekend high around $4,632. The metal briefly moved above $4,696 today before retreating below $4,619 and is posting modest losses in early European trading. A break below $4,600 could open the way toward $4,540. Silver has struggled to break through $70 for two consecutive sessions. Another failed attempt today triggered some profit-taking, sending silver to a three-day low just below $67.60.
WTI crude: October WTI remained within the August 20 trading range of approximately $84.25–$87.70 over the previous two sessions before breaking lower today. Prices fell toward $82, reaching a six-day low and touching the 38.2% Fibonacci retracement of this month’s rally from roughly $73 on August 5. The 20-day moving average sits near $81.25, while the next retracement target is around $80.40.
Economic Data and Central Banks
US: Today’s US calendar features house prices, new home sales, building permits, several regional Federal Reserve surveys and the Conference Board’s August consumer confidence report. However, broader developments—including tougher sanctions on Iran, potential use of the Treasury General Account for bond buybacks and Fed Chair Warsh’s speech at Jackson Hole tomorrow—could overshadow the incoming economic data.
Mexico: Mexico is due to release Q2 current-account data. Despite maintaining a trade surplus, the country continues to run a modest current-account deficit, which was around 0.5% of GDP last year and is projected by the IMF to remain at a similar level this year. The quarterly figure typically has limited market impact.
Germany: Germany revised Q2 GDP growth upward to 0.3% from 0.2% and released additional details. Private consumption increased only 0.1% after falling 0.6% in Q1, while capital expenditure declined 0.2% following a 1.3% contraction in the previous quarter. Government spending rose 0.1%, compared with a 0.9% increase in Q1. Separately, the IFO survey showed improving sentiment, with the overall business climate index rising for a fourth consecutive month to 88.8, its highest level since last August.
Australia: Minutes from the Reserve Bank of Australia’s latest meeting reinforced the hawkish hold message delivered earlier this month. Several policymakers believe another rate increase could still be necessary, while inflation risks remain tilted to the upside. Although the RBA appears in no rush to raise rates again following three hikes earlier this year, markets now price slightly above a 60% probability of another increase before year-end, up from just below 60% last week. A softer July CPI report tomorrow may not materially alter expectations. Headline inflation is forecast to slow to 3.3% from 3.8%, while trimmed-mean inflation could prove stickier at 3.5%, compared with 3.6% previously.
Australian Dollar climbs after stronger-than-expected CPI, eyes multi-month peak ahead of US PCE
AUD/USD extends its gains for a second consecutive session, rising toward 0.7170 as supportive fundamentals bolster the pair.
Australia’s hotter-than-forecast July CPI keeps expectations of further RBA tightening alive, lending support to the Australian Dollar.
The US Dollar remains subdued as Treasury yields decline and hopes for US-Iran diplomacy grow, with traders awaiting the US PCE inflation report.
AUD/USD attracts fresh buying for a second straight day, advancing toward the 0.7170 region after Australia released its latest consumer inflation data during Wednesday’s Asian session. The pair remains close to its highest level since early June, reached last Friday, as market participants turn their attention to the upcoming US Personal Consumption Expenditures (PCE) Price Index for further direction.
Data from the Australian Bureau of Statistics showed that headline CPI inflation eased to 3.5% year-over-year in July from 3.8% in June. However, the figure exceeded the 3.2% market consensus, keeping the possibility of additional interest-rate tightening by the Reserve Bank of Australia (RBA) on the table and providing fresh support for the Aussie.
Meanwhile, the US Dollar continues to struggle for upward momentum as expectations for an immediate Federal Reserve rate hike fade. Lower US Treasury yields, declining oil prices and optimism surrounding potential US-Iran diplomatic progress are also weighing on the greenback. Investors are likely to remain cautious ahead of the US PCE inflation figures, which could offer additional clues about the Fed’s upcoming policy decisions.
Recent softer US inflation data has strengthened expectations that the Federal Reserve could maintain rates at its September 15–16 meeting. A CNBC report also indicated that the US Treasury could deploy nearly $1 trillion to support increased buybacks of longer-dated bonds announced last week. At the same time, weaker oil prices have helped ease inflation concerns, contributing to lower Treasury yields and further limiting demand for the US Dollar.
Overall, the current fundamental backdrop remains favorable for AUD/USD bulls, supporting expectations for further near-term gains. Any downside correction could attract fresh buying interest as long as the pair maintains its broader bullish structure.
AUD/USD continues to trade above the 100-period Simple Moving Average (SMA) on the 4-hour chart, currently around 0.7085, signaling a constructive short-term trend. The 0.7085 area serves as immediate support, with buyers likely to defend this level and preserve the broader recovery.
As long as AUD/USD remains above 0.7085, the bullish bias stays intact, keeping the pair positioned for a potential continuation toward its recent multi-month highs.
Canadian Dollar slips as oil prices fall, while USD/CAD eyes US PCE for fresh direction
USD/CAD attracts modest buying interest as weaker crude prices put pressure on the commodity-linked Canadian Dollar.
Escalating US-Canada trade tensions add to CAD headwinds, although softer US Dollar demand limits the pair’s upside.
Markets await the US PCE inflation report for signals on the Federal Reserve’s rate outlook and the next USD/CAD move.
USD/CAD edges higher during Wednesday’s Asian session, trading around the mid-1.3800 area while remaining within Tuesday’s range. Investors are now turning their attention to the US Personal Consumption Expenditures (PCE) Price Index, which could provide a fresh catalyst for the pair.
The upcoming US inflation figures are expected to offer further clues about the Federal Reserve’s monetary-policy outlook and influence demand for the US Dollar. However, fading expectations for an immediate Fed rate hike, declining US Treasury yields and improving hopes for US-Iran diplomatic negotiations continue to limit USD gains and keep a lid on USD/CAD.
Softer-than-expected US inflation data for July has reduced expectations for near-term Fed tightening, with markets increasingly anticipating that policymakers will leave interest rates unchanged at the September 15–16 meeting. Meanwhile, reports that the US Treasury could deploy nearly $1 trillion to help finance expanded buybacks of longer-term bonds have contributed to further declines in Treasury yields, weighing on the greenback.
The Canadian Dollar, meanwhile, remains vulnerable to pressure from falling crude oil prices. Growing optimism over a potential diplomatic breakthrough between the US and Iran has pushed oil prices to a two-week low after Washington reportedly offered sanctions relief and an end to its naval blockade in exchange for the reopening of the Strait of Hormuz and an end to attacks by regional proxies.
Additional pressure on the Loonie comes from escalating US-Canada trade tensions. Canada has announced new tariffs on US imports in retaliation for Washington’s 50% tariffs on approximately $20 billion worth of Canadian goods.
Despite these factors favoring USD/CAD upside, the mixed fundamental picture suggests caution before assuming that the pair can extend its recent recovery from the 1.3730 region, its lowest level in three months, reached last Friday.
USD/CAD maintains a bearish short-term bias while trading below the 100-period Simple Moving Average (SMA) on the 4-hour chart, currently near 1.3912. This level remains an important resistance zone, and sellers could continue to defend it unless the pair breaks and holds decisively above the moving average.
A sustained move above 1.3912 would weaken the current bearish structure and potentially signal the beginning of a broader recovery. Until then, the pair remains vulnerable to renewed downside pressure.
The US Dollar Index (DXY) closed the week almost unchanged near 98.80 after briefly dipping into the 98.50 area before recovering. The Greenback remains close to its lowest level since May, with weaker Treasury yields playing a key role. The US Treasury’s decision to at least double buybacks of longer-term debt has pushed yields lower, weighing on the Dollar despite stronger-than-expected US business activity data.
Gold climbed above $4,600 to reach a three-month high, while the Australian Dollar advanced to a multi-month peak. Crude Oil also remained elevated near a four-week high as geopolitical tensions in the Middle East continued.
US Dollar Forecast: Key Events Ahead
The upcoming week is heavily weighted toward the second half, with limited Dollar catalysts early on. The main highlights arrive on Wednesday with the July Personal Consumption Expenditures (PCE) Price Index, the Federal Reserve’s preferred inflation measure, followed by Friday’s key events: new Fed Chair Kevin Warsh’s first Jackson Hole keynote and the preliminary annual benchmark revision to US Nonfarm Payrolls.
With the Dollar already trading near recent lows, a dovish tone from Warsh or a significant downward revision to employment data could put additional pressure on the Greenback.
EUR/USD Outlook
EUR/USD finished the week around 1.1680, remaining below the psychological 1.1700 level after another failed attempt to break higher. With few major Eurozone catalysts before Friday’s inflation data, the pair is likely to remain primarily driven by Dollar movements and developments at Jackson Hole. A stronger Eurozone HICP reading could reduce expectations for further ECB easing and provide support for the Euro heading into month-end.
GBP/USD Outlook
GBP/USD ended the week around the mid-1.3600s after retreating from its midweek highs. With little significant UK economic data scheduled, the pair is likely to take its cues mainly from the US Dollar and Warsh’s Jackson Hole speech. Trading could remain subdued before Friday before potentially seeing increased volatility.
USD/JPY Outlook
USD/JPY closed the week slightly above 159.00 as a softer Dollar was offset by continued Yen weakness caused by wide interest-rate differentials. Tokyo CPI data on Friday will be closely watched for clues about the Bank of Japan’s policy outlook. Stronger inflation could reinforce expectations for a September rate hike and put downward pressure on USD/JPY.
AUD/USD Outlook
AUD/USD climbed toward 0.7170, reaching its highest level in several months and outperforming other major currencies. The RBA minutes kick off the week, but Tuesday’s monthly inflation report will be the key event. Headline inflation is expected to ease toward 3.2% from 3.8%. A weaker-than-expected reading could reduce remaining expectations for RBA tightening and challenge the Australian Dollar’s recent rally.
WTI Oil Outlook
WTI Crude ended the week in the high-$80s, close to a four-week high. With no major oil-specific economic releases ahead, geopolitical developments remain the main driver. Washington’s shift toward economic sanctions against Iran instead of additional military strikes has reduced immediate concerns about a supply disruption, although stalled negotiations continue to support oil prices.
Gold Outlook
Gold closed above $4,600 at a three-month high, supported by a weaker US Dollar, declining real yields and renewed safe-haven demand amid Middle East tensions. The upcoming PCE inflation data and Warsh’s Jackson Hole speech will be crucial for the precious metal. A dovish signal from the new Fed Chair could extend Gold’s rally, while a more cautious stance on interest rates could trigger a deeper pullback.
The Nasdaq 100 ended the week lower, continuing to struggle to gain momentum above the psychologically important 30,000 level. Market participants remain cautious as uncertainty surrounding the economic outlook persists, while ongoing developments in the Middle East continue to influence investor sentiment.
Additional pressure came after reports that the U.S. Treasury plans to conduct significant buybacks of 30-year bonds next month, a move that appears to have unsettled markets in the short term. Despite the recent weakness, the broader picture remains largely unchanged. The Nasdaq 100 continues to trade within a long-term bullish trend, suggesting that the latest pullback has not yet altered the overall upward trajectory.
NZD/USD
The New Zealand dollar also posted gains during the week, but its advance is encountering strong resistance in the 0.60–0.61 zone, an area that could limit further upside in the near term.
Compared with several other Asia-Pacific currencies, the kiwi has benefited from expectations that the Reserve Bank of New Zealand (RBNZ) may maintain a relatively hawkish stance. However, the broader interest rate landscape continues to favor the United States, where yields remain comparatively attractive. As a result, the interest rate differential between the U.S. and New Zealand continues to provide underlying support for the U.S. dollar, potentially capping NZD/USD gains despite recent strength.
Gold
Gold prices rallied strongly during the week, breaking above the $4,500 level, a development that reinforces the metal’s underlying bullish momentum and highlights continued demand for safe-haven assets.
Despite the breakout, volatility is likely to remain elevated as investors navigate a complex mix of geopolitical tensions and evolving conditions in the U.S. Treasury market. These factors are expected to keep market sentiment fluid in the near term. Nevertheless, the broader outlook remains constructive, with gold continuing to trade within a well-established long-term uptrend, suggesting the recent advance may be part of a larger bullish continuation.
WTI Crude Oil
WTI crude oil remains highly volatile, with prices continuing to react sharply to developments in the Middle East. The unpredictable geopolitical situation means that any new headline could quickly trigger significant moves in the oil market.
The risk of further escalation remains a key concern, particularly given the possibility of disruptions to global oil supplies. While short-term price action is likely to remain choppy, the broader outlook for crude oil remains supported by geopolitical risk and the potential for supply constraints. Over the longer term, these factors could continue to provide upward pressure on oil prices.
DAX
The DAX remains under pressure, with investors closely monitoring concerns over Europe’s energy supply heading into the winter. Any deterioration in the energy situation could weigh on the German economy and create additional headwinds for the index.
Germany’s economy is heavily reliant on its industrial sector, making the DAX particularly sensitive to rising energy costs or potential supply disruptions. Against this backdrop, the 26,000 level remains a key area to watch, as traders assess whether the index can maintain its recent strength or face a deeper correction.
USD/JPY
The USD/JPY pair remained highly volatile, with the U.S. dollar moving sharply against the Japanese yen throughout Friday’s session and capping off another turbulent trading week.
The 160 yen level remains a significant resistance area, likely to attract considerable attention from traders. Market participants are also keeping a close eye on the possibility of Japanese authorities intervening to support the yen, although there has been relatively little discussion of intervention recently.
Meanwhile, the widening interest-rate differential between the U.S. and Japan continues to support the carry trade, potentially keeping demand for USD/JPY elevated as traders seek to benefit from the yield gap between the two currencies.
USD/MXN
The U.S. dollar continued to weaken against the Mexican peso, with the peso benefiting from its relatively attractive yield. The ongoing interest-rate differential between the two countries remains a key factor supporting demand for the Mexican currency.
However, this trend could reverse quickly if global financial conditions deteriorate or a broader financial crisis emerges, as investors may move away from higher-yielding emerging-market currencies toward traditional safe-haven assets.
For now, USD/MXN remains firmly entrenched in a strong downtrend, keeping the broader outlook bearish for the pair.
EUR/USD
The euro strengthened against the U.S. dollar this week, supported by broad-based weakness in the greenback. If the bullish momentum continues, the 1.19 level could become a longer-term target, although EUR/USD will first need to overcome resistance around 1.18.
In the event of a short-term correction, the 50-week EMA near 1.1550 remains an important potential support zone. Overall, the direction of the pair continues to be closely tied to interest-rate expectations and movements in the U.S. Treasury market, which remain key drivers of the dollar’s performance.
US Dollar Index Holds Near Three-Month Low Amid Fading Fed Rate-Hike Bets
The US Dollar Index (DXY), which measures the performance of the US Dollar against a basket of major currencies, remains under pressure during Friday’s Asian trading session. After a modest rebound the previous day, the index attracted fresh selling and hovered around the 98.80–98.75 area, remaining close to its lowest level since mid-May.
USD Remains Under Pressure as Fed Rate-Hike Expectations Fade
The US Dollar continues to face headwinds as markets scale back expectations for an immediate Federal Reserve interest rate hike. Softer-than-expected US inflation data released last week reinforced expectations that the Fed may maintain its current policy stance, weighing on demand for the Greenback.
The impact of the US Treasury’s decision to increase certain long-term debt buyback operations has also diminished. Meanwhile, renewed inflation concerns linked to higher energy prices could continue to support US Treasury yields, potentially limiting the downside for the Dollar.
Geopolitical Risks Provide Support for the Safe-Haven USD
Rising geopolitical tensions are another factor preventing a sharper decline in the US Dollar. Crude oil prices climbed to a three-week high after President Donald Trump announced tougher economic measures against Iran and warned of severe penalties for countries conducting business with Tehran or helping it circumvent sanctions.
Higher oil prices could fuel inflation concerns and keep US bond yields elevated. At the same time, escalating tensions may increase demand for the US Dollar as a traditional safe-haven asset.
Market pricing also remains relatively supportive of the USD. The CME FedWatch Tool shows that traders continue to assign roughly a 68% probability of at least one Federal Reserve rate hike by the end of the year. This outlook could help cushion the DXY against deeper losses.
DXY Technical Outlook
From a technical perspective, the US Dollar Index maintains a bearish near-term bias while trading below its 200-day Simple Moving Average (SMA) near 99.16.
The recent failure to sustain gains above the 78.6% Fibonacci retracement around 98.52 leaves the index vulnerable to additional selling pressure. On the upside, the 200-day SMA and the 61.8% Fibonacci retracement near 99.22 form a significant resistance zone that could limit any recovery.
Overall, the DXY remains vulnerable to further declines, although persistent inflation risks, elevated Treasury yields and geopolitical uncertainty could provide support for the US Dollar and slow its downward momentum.
USD/JPY Steadies Near 159.00 as Japan Inflation Strengthens BoJ Rate-Hike Bets
The Japanese Yen (JPY) traded largely sideways against the US Dollar on Friday, with USD/JPY hovering around 159.05 during the early Asian session. Stronger-than-expected inflation data from Japan reinforced expectations that the Bank of Japan (BoJ) could raise interest rates at its upcoming September meeting, helping offset concerns over weaker domestic growth.
Japan Inflation Strengthens BoJ Rate-Hike Expectations
Japan’s headline Consumer Price Index (CPI) rose 2.0% year over year in July, accelerating from 1.6% in June. Meanwhile, core CPI, which excludes volatile fresh food prices but includes energy costs, increased 1.8% YoY, up from 1.6% previously.
The pickup in underlying inflation could strengthen the case for further monetary policy normalization by the BoJ. Market pricing currently reflects an approximately 80% probability of a rate hike at the next policy meeting, while expectations are building for the central bank to lift its policy rate from 1.0% to 1.25% in September.
Higher energy prices could further reinforce inflationary pressures. Renewed tensions in the Middle East have pushed oil prices higher, while the weaker Yen may also contribute to imported inflation in Japan.
Geopolitical Risks Could Limit Yen Gains
Despite stronger inflation data and rising BoJ rate-hike expectations, geopolitical developments could restrict the Yen’s upside. Japan remains heavily dependent on Middle Eastern energy supplies, meaning a prolonged escalation in the region could increase oil prices and weigh on Japan’s economic outlook.
At the same time, heightened geopolitical uncertainty may boost demand for the US Dollar as a safe-haven asset, providing additional support for USD/JPY.
However, the Yen’s medium-term outlook appears to be improving. Firmer BoJ policy, structural reforms and a resilient Japanese economy could gradually strengthen the JPY and provide a fundamental counterweight to the US Dollar.
USD/JPY Technical Outlook
From a technical perspective, USD/JPY retains a bearish near-term bias as the pair remains below both the 100-day Simple Moving Average (SMA) and the 20-period Bollinger middle band.
Initial resistance is located around 159.45, followed by the 100-day SMA near 160.00. A sustained break above this zone would be needed to weaken the current bearish structure, with the upper Bollinger Band around 163.30 representing a further upside barrier.
On the downside, the lower Bollinger Band near 155.50 provides the next major technical support. A decisive break below recent lows could expose this area and reinforce the broader bearish outlook.
Overall, USD/JPY remains vulnerable to further declines while capped below the 159.45–160.00 resistance zone, although geopolitical risks and safe-haven demand for the US Dollar could limit the Yen’s gains.
Australian Dollar Slips After Disappointing Labor Report
AUD/USD comes under renewed selling pressure as weaker-than-expected Australian employment data weighs on the Australian Dollar.
Australia’s unemployment rate climbed to 4.5% in July, exceeding the 4.4% market forecast.
Fed minutes indicated that policymakers could support near-term rate hikes if inflation remains elevated, while the benchmark rate was kept at 3.5%–3.75%.
AUD/USD retreats after gaining more than 0.5% in the previous session, trading near 0.7120 during Thursday’s Asian session. The pair is pressured by a weaker Australian Dollar following disappointing domestic employment figures.
Australia’s unemployment rate increased to 4.5% in July, above economists’ expectations of 4.4%. Employment also deteriorated sharply, with the economy losing 15.8K jobs compared with an 80.2K increase in June and falling well short of the forecast for a 15.0K rise.
AUD Faces Additional Headwinds From RBA and China Concerns
Rabobank strategists noted that expectations for additional Reserve Bank of Australia tightening remain limited, with markets pricing in only around 12 basis points of rate hikes over the next three months. They also pointed to weaker Chinese demand for Australian commodities and softer domestic economic conditions as growing risks for the Aussie.
Still, AUD/USD could find some support from a weaker US Dollar, which has been pressured by recent economic developments and shifting Federal Reserve expectations. Minutes from the Fed’s July meeting showed that several policymakers were open to raising interest rates in the near term if inflation failed to moderate, while the benchmark rate remained unchanged at 3.5%–3.75%.
Although inflation is still above the Fed’s 2% target, recent monthly readings suggest that price pressures are easing. This has reduced expectations for an immediate rate increase. The CME FedWatch Tool now shows a 32.7% probability of a rate hike at the next meeting, down from 47% one month earlier.
AUD/USD is trading near 0.7110 on the daily chart, remaining above both the nine-period and 50-day Exponential Moving Averages (EMAs). This positioning keeps the pair’s near-term outlook moderately bullish, particularly as prices continue to move beyond the recent consolidation range.
The 14-day Relative Strength Index (RSI) stands at 63.2, indicating positive momentum while remaining below overbought territory. This suggests that buyers still have room to push prices higher, although broader Federal Reserve sentiment remains relatively subdued compared with previous peaks.
The first key resistance level is the psychological 0.7200 mark. On the downside, initial support is located around the nine-period EMA at 0.7087. A break below this level could expose the next support zone near the 50-period EMA at 0.7034, where dip-buyers may attempt to regain control.
Canadian Dollar Strengthens as Oil Prices Rise and US Dollar Weakens
USD/CAD extends its decline as stronger crude oil prices support the commodity-sensitive Canadian Dollar.
Oil prices climb amid heightened Middle East tensions and stalled US-Iran negotiations, raising concerns over potential supply disruptions.
Fed minutes indicated that policymakers could favor near-term rate hikes if inflation remains elevated, while keeping the benchmark rate at 3.5%–3.75%.
USD/CAD falls for a second consecutive session, trading around 1.3800 during Thursday’s Asian session. The pair remains under pressure as the Canadian Dollar gains momentum from rising crude oil prices.
Oil prices have advanced sharply as tensions in the Middle East intensify and negotiations between the United States and Iran remain deadlocked. The situation has extended into the strategically important Strait of Hormuz. Although US President Donald Trump said oil shipments continue to pass through the waterway, he also indicated that further negotiations with Tehran remain possible.
Oil Rally Supports the Canadian Dollar
TD Securities highlighted the ongoing geopolitical risks as an important driver of crude prices, warning that the Iran conflict could escalate further. With the threat of supply disruptions still present, the bank expects Brent crude’s geopolitical risk premium to remain elevated as traders price in the possibility of additional instability across the region.
USD/CAD is also pressured by a softer US Dollar amid shifting expectations for Federal Reserve policy and recent economic data. Minutes from the Fed’s July meeting showed that officials were prepared to consider raising interest rates in the near term if inflation failed to ease, while the benchmark rate remained unchanged at 3.5%–3.75%.
Although inflation remains above the Fed’s 2% target, recent monthly figures indicate that price pressures are moderating. The signs of cooling inflation have reduced expectations for an immediate rate hike. Markets now see a 32.7% probability of a Fed rate increase at the next meeting, down from 47% one month earlier, according to the CME FedWatch Tool.
Gold and silver are trading within relatively tight ranges after their strong breakouts earlier this month, as traders await a fresh catalyst to determine whether the precious metals rally resumes or reverses.
The US Dollar Index (DXY) has remained resilient despite growing macroeconomic headwinds, while traditional relationships between precious metals and key economic indicators have become increasingly unclear. Against this backdrop, the release of the July FOMC meeting minutes later Wednesday could provide the catalyst needed to trigger the next major move.
Macro Signals Offer Little Direction
The recent consolidation in precious metals partly reflects conflicting signals from their traditional macro drivers.
The relationship between gold and silver remains strong, with their five-day correlation standing at around 0.96. However, correlations with other major indicators have become far less straightforward.
Over the past five days, gold has shown relatively strong correlations with US 2-year yields, 10-year Treasury yields and 10-year real yields, despite these relationships typically pointing in the opposite fundamental direction. Silver has displayed a similar pattern, with correlations of around 0.66, 0.70 and 0.71, respectively.
Meanwhile, gold and silver have shown almost no relationship with the US dollar over the same period, with five-day correlations near zero. Fed rate expectations have also provided limited guidance, while correlations with the Nasdaq 100 and VIX futures remain weak and inconsistent.
With gold and silver still closely linked but most traditional macro signals offering mixed messages, traders may need to rely more heavily on price action to determine the next direction.
US Dollar Remains Resilient
The lack of a clear relationship between precious metals and the US dollar becomes more understandable when looking at the recent performance of the DXY.
Although the dollar has faced several negative headwinds this month and broken below the uptrend established from its January lows, it has remained range-bound in recent weeks.
The DXY has attracted buying interest below 99.50, extending toward the 38.2% Fibonacci retracement of the January-to-June advance, while gains above 100.00 have faced resistance.
The dollar’s resilience is significant because its earlier decline was one of the factors supporting the strong breakout in gold and silver at the start of the month. With the 50-, 100- and 200-day moving averages beginning to flatten, continued sideways movement in the DXY may be limiting further upside momentum in precious metals.
Gold Price Outlook
Gold climbed as high as $4,450 per ounce after breaking above the bearish trendline from its January peak and the wedge formation that had contained price action since early June.
The metal has since entered a consolidation phase.
Gold has found buying interest below the $4,333 area, corresponding to the 23.6% Fibonacci retracement of the January-to-June decline, while this week’s low has reached around $4,312. With gains capped near $4,450, this zone currently defines the key trading range.
A decisive move above $4,450 would bring the 200-day moving average into focus. A clean break above that level could open the way toward $4,580, which aligns with the 38.2% Fibonacci retracement and an important historical support-resistance area.
On the downside, a break below $4,312 could expose gold to further losses toward $4,200, which represents the upper boundary of the earlier breakout zone. The 50-day moving average sits just below that level.
Momentum indicators are also becoming less supportive. The 14-day RSI is forming lower highs and lower lows while approaching the neutral 50 level. Meanwhile, the MACD remains positive but is converging toward its signal line.
Overall, the technical picture suggests a more cautious stance for gold bulls. The medium- and longer-term outlook remains constructive, but near-term price action is likely to play a greater role in determining the next directional move.
Silver Price Outlook
Silver is showing a similar technical structure after breaking above the bearish trendline extending from its January record high.
The metal has since consolidated between resistance near $67 and support around $63.29. Tuesday’s session produced a bearish engulfing candle, pushing silver closer to the lower end of its current range.
Momentum indicators are also losing strength. The 14-day RSI is making lower highs and approaching the neutral 50 level, while the MACD is turning lower and converging toward its signal line, although it remains in positive territory.
The series of upper wicks on recent daily candles also suggests that sellers are becoming more active at higher levels.
Near-term, the $61 area and 50-day simple moving average form an important support zone. A decisive break below this region could expose silver to the $55.63-$54.80 area, which includes a key support level and the mid-July low.
If $63.29 continues to hold, attention will return to resistance at $67. Above that level, the 100-day moving average, the 23.6% Fibonacci retracement of the January-to-July decline and the 200-day moving average create a more significant resistance zone.
A sustained breakout above this area would strengthen the case for a continuation of silver’s earlier bullish move and potentially bring $78 into focus.
FOMC Minutes Could Trigger the Next Breakout
With gold and silver consolidating, the US dollar holding firm and traditional macro relationships sending mixed signals, markets appear to be waiting for a clear catalyst.
The July FOMC minutes could provide that catalyst by offering fresh insight into Federal Reserve policymakers’ views on inflation, interest rates and the future path of monetary policy.
For now, $4,312-$4,450 for gold and $63.29-$67 for silver remain the key ranges to watch. A decisive breakout from either range could provide a clearer signal for the next major move in precious metals.
The GBP/USD pair edges lower to around 1.3535 during Wednesday’s early Asian session, with the British Pound coming under pressure after weaker-than-expected UK labor market figures. Market participants are now turning their attention to the UK’s Consumer Price Index (CPI) report, due later in the day, for fresh clues on the inflation outlook and the Bank of England’s policy path.
On the daily timeframe, GBP/USD continues to exhibit a constructive bullish outlook, trading above both the 100-day Simple Moving Average (SMA) and the Bollinger Bands’ 20-day midpoint, reinforcing the strength of the prevailing uptrend. The 14-day Relative Strength Index (RSI) stands at 60.8, remaining in positive territory without reaching overbought levels, indicating that upside momentum could persist in the near term.
From a technical perspective, the pair faces immediate resistance near the upper Bollinger Band at 1.3615, a level that may limit further advances. On the downside, initial support is located around the Bollinger middle band at 1.3450, followed by the 100-day SMA at 1.3420. Additional support is seen near the lower Bollinger Band at 1.3285. Holding above this key support cluster would keep the broader bullish structure intact and favor buying on pullbacks rather than signaling a trend reversal.
Fundamental Analysis
UK labour market data released by the Office for National Statistics showed that the unemployment rate held at 4.9% in the three months to June, slightly above the 4.8% market forecast. Meanwhile, average earnings including bonuses slowed to 4.1% from 4.4% previously, pointing to easing wage pressures and potentially reducing the likelihood of a Bank of England (BoE) rate hike later this year.
Markets currently price in one BoE rate increase by year-end, which would take the benchmark rate from 3.75% to 4.0%. ING economist James Smith noted that persistent weakness in private-sector hiring and wage growth means the threshold for a 2026 rate hike remains relatively high unless energy prices experience a severe and sustained surge.
Meanwhile, expectations for a September Federal Reserve rate hike have also declined, offering some support to GBP/USD by limiting further US Dollar gains. Markets now see around a 35% probability of a Fed rate hike in September, down from 47% a month earlier, according to the CME FedWatch Tool.
Scotiabank strategists noted that Sterling has weakened only modestly, broadly tracking declines among its major European peers. Although the latest UK employment figures were disappointing, the data has so far failed to create a significant downside divergence for the Pound.
EUR/USD Strengthens Above 1.1550 as Bullish Outlook Holds
The EUR/USD pair extends gains to trade near 1.1585 during early European hours on Wednesday. The Euro strengthens against the US Dollar after Germany’s ZEW Economic Sentiment survey exceeded market expectations. Investors now await a speech from European Central Bank (ECB) President Christine Lagarde later in the day for fresh clues on the ECB’s monetary policy outlook.
On the daily chart, EUR/USD maintains a bullish near-term outlook, with the pair trading above the 100-day moving average (MA) and the Bollinger middle band. This technical setup points to a positive underlying trend following the rebound from support near the lower Bollinger band at 1.1364. The 14-day Relative Strength Index (RSI) stands at 63.8, indicating that buyers remain in control while momentum is approaching overbought levels without reaching them decisively.
On the upside, the August 17 high at 1.1614 represents the first key resistance level. A sustained move above this area could expose the Bollinger upper band near 1.1650, where the pair may encounter stronger selling pressure.
On the downside, initial support lies at the 100-day MA around 1.1570, followed by the Bollinger middle band at 1.1505. If selling pressure intensifies, EUR/USD could retreat toward the lower Bollinger band near 1.1365, with this level remaining important for maintaining the broader bullish trend.
Fundamental Analysis
Data released Tuesday showed that Germany’s ZEW Economic Sentiment Index rose to 34.2 in August from 26.3 previously, beating market expectations of 30.0. The ZEW Current Situation Index also improved significantly to -61.1 from -77.6 in July, coming in above the forecast of -68.8 and providing additional support for the Euro.
Markets are increasingly pricing in further ECB rate hikes. According to the ECB Watch Tool, traders see a 90%–94% probability of a 25-basis-point rate increase to 2.50% at the ECB’s next policy meeting on September 9.
US Dollar remains supported despite weaker Fed hike expectations
MUFG analysts noted that the recent shift in US Dollar sentiment, following last week’s economic data that reduced expectations for further Fed rate hikes, has not resulted in significant unwinding of long-Dollar positions. The US Dollar Index (DXY) continues to hold above its 200-day moving average at 99.185, suggesting that the softer Fed policy outlook has yet to trigger a major Dollar sell-off.
Gold rebounds as softer USD and fading Fed hike bets lift XAU/USD
Gold recovers from a fresh weekly low as renewed US Dollar weakness provides support.
Softer US economic data and easing inflation reduce expectations for a September Fed rate hike.
XAU/USD remains capped by the 100-day SMA, with the $4,386–$4,455 zone acting as key resistance.
Gold (XAU/USD) rebounds on Friday after slipping to a fresh weekly low of $4,311 earlier in the session. The precious metal trades near $4,381 at the time of writing, supported by a weaker US Dollar and declining expectations of an imminent Federal Reserve interest rate hike. However, Gold remains below Thursday’s two-month peak of $4,449.
Fresh US economic data reinforced concerns that economic momentum is slowing. Retail Sales dropped 0.6% month-over-month in July, significantly below expectations for a 0.1% rise and reversing June’s 0.2% increase.
The disappointing spending data comes after this week’s CPI and PPI reports pointed to gradually easing inflationary pressures. However, preliminary University of Michigan figures showed that one-year inflation expectations rose slightly to 4.3% in August from 4.2%, while the five-year expectation remained unchanged at 3.3%.
The weaker economic data has pushed short-term Treasury yields lower and pressured the US Dollar as markets scale back expectations for a September Fed rate hike. The US Dollar Index (DXY) is trading around 99.50, down approximately 0.45% on the day.
According to the CME FedWatch Tool, markets are now assigning roughly a 71% probability that the Fed will leave interest rates unchanged next month.
This environment remains broadly supportive for non-yielding Gold in the near term, although the inflation outlook remains uncertain. Inflation is still above the Fed’s 2% target, while energy-related price pressures have yet to fully ease amid continued uncertainty surrounding the reopening of the Strait of Hormuz.
TD Securities noted that CTA net-long positioning in Gold is becoming increasingly established alongside renewed discretionary buying. The bank expects the precious metal to remain well supported at elevated levels if the Fed stays on hold amid weaker economic data, even with higher energy prices.
Technical analysis: XAU/USD faces resistance at the 100-day SMA
XAU/USD remains close to recent highs but has yet to achieve a convincing break above the 100-day Simple Moving Average (SMA) at $4,386. Gold continues to trade comfortably above the 20-day SMA, which coincides with the Bollinger middle band around $4,173.
The daily RSI is near 62, while the MACD remains in positive territory, indicating that bullish momentum is still intact and could support another attempt to break higher.
On the upside, the $4,386–$4,455 area represents a significant resistance zone, defined by the 100-day SMA and the upper Bollinger Band. A sustained move above this region could reinforce the bullish outlook and open the door to further gains.
On the downside, initial support lies around $4,173 at the Bollinger middle band, followed by the psychological $4,000 level. A deeper correction could expose the lower Bollinger Band near $3,891.
Forex Today
The US Dollar starts Tuesday under pressure, with the US Dollar Index (DXY) hovering near two-month lows and remaining below the 100.00 threshold. A string of weaker-than-expected US data covering employment, inflation and retail sales has reduced expectations for a Federal Reserve rate hike next month.
Meanwhile, geopolitical tensions in the Middle East are supporting commodities. A senior Iranian official said Tehran is adopting a “fully offensive” posture and warned that tensions around the Strait of Hormuz could escalate if diplomatic efforts fail. The comments pushed Crude Oil more than 2% higher and provided additional support for Gold.
US Dollar performance today
The US Dollar is broadly weaker against most major currencies, with the largest declines seen against the Australian Dollar, New Zealand Dollar and Swiss Franc. The Greenback is strongest against the Japanese Yen, while its performance against the Canadian Dollar remains broadly unchanged.
EUR/USD holds near 1.1580 after pulling back from a two-month high around 1.1614, with Dollar weakness continuing to underpin the pair.
GBP/USD remains firm around the mid-1.3500s, close to three-month highs as traders await Tuesday’s UK labor market data.
USD/JPY trades around 159.00 after markets largely looked past weaker-than-expected Japanese second-quarter GDP data.
AUD/USD remains near the lower 0.7100s and leads the major currencies despite softer Chinese Industrial Production and Retail Sales figures released over the weekend.
Gold extends its recovery above $4,400 as a weaker US Dollar and heightened Middle East tensions boost demand for the precious metal.
WTI Crude Oil climbs toward $84.00 per barrel as renewed Iranian threats increase the geopolitical risk premium in energy markets.
Key economic events ahead
Tuesday’s Asian session begins with Australia’s Westpac Consumer Confidence report. Attention then shifts to the UK labor market report, with the Bank of England particularly focused on Average Earnings and the ILO Unemployment Rate.
Later, Germany and the Eurozone will release ZEW economic sentiment data, while European Central Bank Executive Board member Philip Lane is scheduled to speak.
The US session features Building Permits, Housing Starts, Industrial Production and Pending Home Sales, providing further clues about the health of the US economy. New Zealand’s second-quarter Producer Price Index will round out the day’s major releases.
AUD Advances as Fading Fed Hike Bets Weigh on US Dollar
AUD/USD advances for a third straight session as weaker Fed rate-hike expectations continue to weigh on the US Dollar.
Rising US-Iran tensions, following Trump’s stance on the expiring agreement and the naval blockade, add to broader geopolitical uncertainty.
Traders turn their attention to Australia’s August consumer confidence and Q2 Wage Price Index data for fresh clues on the RBA’s policy path.
AUD/USD extends its upward momentum for a third consecutive day, trading near 0.7110 during Tuesday’s Asian session. The pair remains supported as the US Dollar struggles amid diminishing expectations for additional Federal Reserve rate hikes.
The unexpected drop in US Nonfarm Payrolls in July, together with relatively soft consumer inflation data released last week, has reduced expectations for a rate increase at the Fed’s next meeting. CME FedWatch Tool data now shows a 35% probability of a hike, down from 47% one month ago.
Geopolitical developments between the US and Iran are also influencing market sentiment. On Monday, US President Donald Trump said he was not interested in extending the expiring agreement with Iran, pointing to the naval blockade of Iranian ports as a sign of US leverage. Trump also reiterated his proposal to place the strategically important waterway under full US control.
Iranian Foreign Ministry spokesman Esmail Baghaei, meanwhile, said a deal remains out of reach because of security concerns and what he described as the “obstructionist behavior of destructive elements.” He called on Washington to remove the blockade before further negotiations could take place.
In Australia, attention is shifting toward upcoming economic indicators that could offer fresh insight into the domestic policy outlook. The August Westpac Consumer Confidence Index is due first, followed by the Q2 Wage Price Index. Australian wages are expected to increase 0.8% quarter-on-quarter, matching the pace recorded in the previous quarter.
Australia wage data unlikely to alter RBA expectations
Brown Brothers Harriman strategists expect the upcoming Australian labor-market figures to have a limited impact on expectations for Reserve Bank of Australia policy. BBH expects Q2 wage growth to remain at 0.8% q/q for a third consecutive quarter, while annual growth is forecast to ease to 3.2% from 3.3% in Q1.
This combination is unlikely to significantly change the current market view that the RBA will keep interest rates unchanged. As a result, the upcoming data present only limited potential for a meaningful repricing of RBA rate expectations.
RBA futures point to limited tightening
RBA cash-rate futures currently imply around a 60% probability of one final 25-basis-point rate increase by year-end, which would take the cash rate to 4.60%. However, BBH believes the risks are tilted toward the RBA maintaining its restrictive stance for longer rather than delivering another near-term hike.
With monetary policy already considered somewhat restrictive, markets may be pricing in a greater chance of additional tightening than is ultimately likely.
Technical Analysis: AUD/USD maintains a bullish bias above key EMAs
AUD/USD is trading around 0.7110 and retains a constructive technical outlook as the pair remains above both the nine-period and 50-period Exponential Moving Averages. The shorter-term EMA is positioned above the longer-term measure, reinforcing the pair’s positive near-term trend.
The 14-day Relative Strength Index stands at 65.84, approaching overbought territory. This indicates strong bullish momentum but also suggests that the recent advance may be becoming stretched.
Initial support is located around the nine-period EMA at 0.7074, followed by the 50-period EMA near 0.7028. Holding above these levels would keep the broader near-term bias tilted to the upside. However, with RSI elevated, further gains from current levels could increasingly give way to consolidation rather than a sustained straight-line rally.
EUR/USD pauses as oil-fueled inflation risks lend support to the US Dollar.
EUR/USD holds steady near 1.1580 after retreating slightly from a two-month high.
Higher oil prices revive inflation concerns and could strengthen expectations for another Fed rate hike, supporting the US Dollar.
Growing expectations of a final 25-basis-point ECB rate increase in September continue to underpin the Euro.
EUR/USD remains largely unchanged around the 1.1575–1.1580 area during Tuesday’s Asian session, stabilizing after Monday’s modest decline from a two-month peak. However, a slight recovery in the US Dollar suggests caution before assuming the pair will resume its recent advance from the 1.1350 region, the July monthly low.
Last week’s softer US inflation figures and weaker consumer spending data reduced expectations for an imminent Federal Reserve rate increase, pushing the US Dollar Index to its lowest level since June 16 on Monday. However, the recent rise in crude oil prices has brought inflation concerns back into focus and could encourage the Fed to maintain a more hawkish policy stance. Persistent geopolitical risks are also supporting safe-haven demand for the Greenback, potentially limiting EUR/USD gains.
Tensions surrounding the Middle East remain a key market driver. US President Donald Trump said Washington does not intend to extend its Memorandum of Understanding with Iran, which expired on Monday. Trump also reiterated his proposal to place the strategically important Strait of Hormuz under US control and issued further warnings regarding Oman. The ongoing US-Iran standoff has pushed crude oil prices to a two-week high, increasing inflation risks and reinforcing expectations for at least one additional Fed rate hike before year-end.
Markets will therefore focus closely on Wednesday’s FOMC Minutes for fresh clues about the Federal Reserve’s future policy direction. The minutes could influence near-term USD movements and provide the next major catalyst for EUR/USD.
Meanwhile, expectations that the European Central Bank could deliver one final 25-basis-point rate increase at its September meeting continue to offer support to the Euro. This outlook could help limit the downside risk for EUR/USD in the near term.
Technical Analysis: EUR/USD faces key resistance near 1.1600
EUR/USD is trading just below the 50.0% Fibonacci retracement of the April–June decline, making this level an important near-term resistance zone. A sustained break above this barrier could strengthen the bullish outlook and open the way toward the 200-day Simple Moving Average near 1.1630, followed by the 61.8% Fibonacci retracement around 1.1647.
On the downside, initial support is located at the 38.2% Fibonacci retracement near 1.1522. A break below this level could expose the 23.6% retracement at 1.1445, while the broader structural support remains around the 1.1320 cycle low.
Post-CPI summer trading conditions continue to suppress FX volatility, keeping EUR/USD largely range-bound. However, our models indicate that the pair is becoming somewhat undervalued in the short term, reinforcing our moderately bullish outlook for the weeks ahead. Meanwhile, developments in the Gulf remain a secondary driver for currencies, with their impact more evident in relative-value trades than in major USD pairs.
USD: Watching for a Shift in Fed Rhetoric
The post-CPI midsummer environment is naturally weighing on FX volatility, and this subdued backdrop could persist for at least the next couple of weeks. Despite this, we continue to favour some downside for the US dollar, as we believe markets remain overly confident about the prospect of further Federal Reserve tightening.
For now, Fed officials’ comments represent the clearest potential catalyst for a meaningful market move. There remains considerable uncertainty over the tone that could emerge from the Jackson Hole Symposium later this month, particularly after the latest CPI report pointed somewhat toward a dovish interpretation without providing a conclusive signal.
Recent comments have offered mixed signals. Beth Hammack, who supported a rate hike, continued to argue in favour of tighter policy, while Tom Barkin expressed some reservations about the need for additional increases, despite not being viewed as a dovish FOMC member. A further softening in rhetoric from more centrist policymakers could strengthen expectations for a less hawkish Fed.
Today’s US economic calendar features July retail sales, forecast to rise just 0.1% month-on-month, alongside the University of Michigan surveys. With both releases considered relatively secondary, they would likely need to significantly exceed or miss expectations to generate a substantial dollar move.
Meanwhile, market attention toward Middle East headlines appears to be fading. US-Iran talks remain stuck, while Brent crude prices declined yesterday, offering some support to global bond markets. The threshold for oil prices to re-establish a strong direct influence on the dollar remains relatively high. Instead, Gulf developments may continue to have a greater impact on G10 relative-value pairs such as NOK/SEK and AUD/NZD, which remain more closely linked to the energy narrative.
EUR: Increasingly Undervalued
Our models estimate EUR/USD’s short-term fair value at around 1.1600–1.1650, largely reflecting an approximately 10bp narrowing in two-year swap rate differentials. These rate spreads continue to have a considerably stronger influence on the pair than other underlying factors.
This supports our constructive view on EUR/USD, although we do not expect a sustained move above 1.1600 in the coming days unless Fed communication turns notably more dovish. For now, EUR/USD bulls may instead focus on the strengthening technical support around 1.1500.
In the eurozone, the second estimate of second-quarter GDP is due today. Markets are not expecting any meaningful revision to the preliminary 0.4% quarter-on-quarter growth figure.
JPY: BoJ Expectations Yet to Support the Yen
Despite significant moves in Japanese money markets this week, the yen has struggled to maintain upward momentum. The key development is the possibility that the Japanese government may become more accepting of a faster Bank of Japan tightening cycle.
Previously, markets assumed that a growth-focused government would limit the BoJ to roughly one rate hike every six months. The latest signals suggest Tokyo is placing greater emphasis on the exchange rate and wants to ensure that any potential joint intervention with the US to support the yen — the first such operation since 1998 — is effective.
Markets are now pricing roughly a 75% probability of a 25bp BoJ rate hike in September. As a result, two-year US-Japan swap differentials have narrowed by nearly 40bp since mid-July, a development that would normally put downward pressure on USD/JPY.
The pair’s resilience may instead reflect benign market conditions that continue to favour yen-funded carry trades. Nevertheless, the risks surrounding yen funding are clearly increasing. If the Fed leaves rates unchanged in September as expected, USD/JPY could potentially fall back below 158. In the meantime, traders seeking to express outright yen strength may increasingly turn to short CHF/JPY positions.
The US Dollar (USD) remains under pressure against major currencies on Friday, although it has managed to limit its decline as investors reassess the Federal Reserve’s (Fed) monetary policy outlook and monitor ongoing developments in the Middle East. In Europe, markets are awaiting second-quarter Gross Domestic Product (GDP) data, while later in the US session, attention will turn to July Retail Sales and the University of Michigan’s preliminary Consumer Sentiment Index.
US economic data released Thursday showed that annual Producer Price Index (PPI) inflation eased to 4.7% in July from 5.5% in June, coming in below the 4.9% market forecast. Meanwhile, the CME FedWatch Tool shows that markets are now pricing roughly a 33% probability of a 25-basis-point Fed rate hike in September, down from around 50% a week earlier. Against this backdrop, the US Dollar Index remains below the 100.00 level during Friday’s European session.
Fed hawkishness remains as August inflation approaches
Commerzbank analysts believe upcoming US economic data will play a crucial role in determining the Fed’s next policy steps, particularly the August inflation figures due shortly before the next Fed meeting. They also pointed to Cleveland Fed President Beth Hammack’s continued hawkish stance. Hammack argues that inflation is unlikely to decline on its own and that the Fed needs to support its rhetoric with concrete action. She has also suggested that a single rate hike would not be sufficient, highlighting that some policymakers remain focused on combating inflation despite recent signs of easing price pressures.
Meanwhile, US Treasury Secretary Scott Bessent said Thursday that Washington plans to introduce measures against Iran that would be unprecedented, while US Defense Secretary Pete Hegseth stated that the US could maintain its blockade of Iran indefinitely. Oil prices reacted higher early Friday, with crude gaining around 1% to trade near $81.30.
Reuters reported Friday, citing three sources familiar with the matter, that the Bank of Japan (BoJ) could raise interest rates as early as September and may accelerate its tightening pace thereafter from its current pattern of roughly two hikes per year. USD/JPY moved lower during the European morning, trading below 159.30.
Yen reaction remains limited despite BoJ tightening expectations
OCBC analysts noted that the Japanese Yen’s response has remained relatively muted despite growing expectations for another BoJ rate increase. If the central bank hikes rates again in September, it would represent its third increase within nine months and the fastest pace of monetary tightening since the collapse of Japan’s asset bubble in 1989. However, OCBC cautioned that uncertainty remains over the government’s willingness to support further rate increases beyond September or October, leaving investors unsure about the ultimate pace of Japan’s policy normalisation.
Gold remains pressured by Middle East uncertainty
Despite the changing expectations surrounding a September Fed rate move, uncertainty over the Middle East continues to limit Gold’s upside potential. After ending Thursday in negative territory, Gold (XAU/USD) remains under pressure on Friday, trading below $4,350 during the European session and down around 0.5% on the day.
EUR/USD recovered after dipping toward 1.1500 on Thursday and finished the session almost unchanged. The pair extended its recovery slightly on Friday, trading just below 1.1550. The Eurozone economy is expected to have expanded at an annualized rate of 1% in the second quarter.
GBP/USD also moved higher early Friday, fluctuating around 1.3500 after recording modest declines over the previous two sessions.
Dollar steadies as traders await pivotal U.S. inflation reports
The U.S. dollar traded largely unchanged on Tuesday as investors avoided major currency bets ahead of closely watched inflation data that could influence expectations for Federal Reserve policy. Meanwhile, oil prices edged higher after an Iranian official stated that the Strait of Hormuz would remain closed until Washington met Tehran’s conditions.
By 16:31 ET (20:31 GMT), the U.S. Dollar Index, which measures the greenback against a basket of six major currencies, was holding near 99.82.
Focus shifts to CPI and PPI releases
Market attention is firmly centered on the July Consumer Price Index (CPI) and Producer Price Index (PPI) reports due on Wednesday and Thursday. The inflation readings follow a weaker-than-expected U.S. employment report released last Friday, which prompted investors to reassess the outlook for future Federal Reserve interest-rate moves.
Analysts expect both headline and core CPI to show monthly increases after June’s subdued readings, while annual inflation measures are forecast to ease slightly compared with the previous month.
According to José Torres, Senior Economist at Interactive Brokers, core inflation could fall to its lowest level in more than five years if it comes in below expectations at 2.4%, highlighting how broader disinflation trends are being overshadowed by geopolitical risks.
Torres also noted that headline inflation is projected to remain notably higher than core inflation due to elevated food and energy costs. He argued that a lasting resolution to tensions in the Middle East could further accelerate the decline in overall inflationary pressures.
Torres added that a resolution to the ongoing geopolitical conflict could swiftly eliminate concerns about additional interest-rate hikes. In his view, inflation would move much closer to the Federal Reserve’s 2% target by the end of the year, shifting policymakers’ attention toward protecting the labor market from further weakening rather than combating price pressures.
Oil jumps as Iran ties Hormuz reopening to U.S. concessions
In the Middle East, oil prices climbed nearly 2% on Tuesday after surging around 5% in the previous session, as uncertainty surrounding the Strait of Hormuz continued to support energy markets.
Investors have been closely monitoring developments since U.S. officials, including President Donald Trump, repeatedly suggested that discussions over reopening the strategic waterway were underway. Iran, however, has denied engaging in direct negotiations with Washington, stating that its talks have been conducted exclusively through Oman.
Conflicting statements from both sides have added to market uncertainty. While U.S. officials have maintained that the strait remains open to commercial shipping, Iranian authorities have argued that it is effectively closed. The absence of a clear breakthrough toward a peace agreement has contributed to recent gains in oil prices.
Iran and Oman are reportedly working on a framework for managing the strait, with Qatari officials indicating that negotiations have reached an advanced and sensitive stage. At the same time, reports have suggested that Washington and Tehran may be edging closer to a potential arrangement, with Oman and Pakistan continuing to play key mediating roles.
Tehran has insisted that any reopening of the Strait of Hormuz depends on Washington fulfilling commitments outlined in a previously negotiated interim peace framework, including lifting sanctions, ending naval restrictions, and providing compensation for war-related damage. The U.S. has responded with demands of its own, underscoring the ongoing deadlock.
Iranian officials reiterated that the waterway would remain closed until the country’s conditions are met, signaling that tensions remain far from resolved.
Shipping activity through the strait has also slowed markedly. Data from maritime analytics firm Kpler showed vessel crossings declining sharply over the weekend, highlighting the disruption to one of the world’s most important energy transit routes.
Yen retreats while Australian dollar gains after RBA decision
The Japanese yen weakened modestly against the U.S. dollar, surrendering additional gains made following last month’s major currency intervention. USD/JPY rose 0.1% to 159.31, moving closer to the psychologically important 160 threshold.
Meanwhile, the Australian dollar edged 0.1% higher to $0.7059 after the Reserve Bank of Australia left its benchmark interest rate unchanged at 4.35%, in line with market expectations.
The RBA noted that disruptions to global oil supplies are adding to inflationary pressures and that higher fuel costs appear to be filtering through to a broader range of goods and services. As a result, policymakers expect inflation to remain elevated for an extended period.
The central bank acknowledged that tighter financial conditions and slowing economic activity are helping to moderate demand. However, it emphasized that inflation remains well above target and is not expected to return to the midpoint of its target range until late 2027, with risks still skewed to the upside.
The US Dollar remains supported by strong safe-haven inflows as uncertainty persists over the reopening of the Strait of Hormuz.
A larger-than-expected decline of 23,000 jobs in July, coupled with downward revisions to previous payroll figures, points to a softening US labor market and reduces expectations for further Federal Reserve tightening.
According to the CME FedWatch Tool, the probability of a September Fed rate increase has fallen to 46%, compared with 67% previously.
The US Dollar Index (DXY), which tracks the Greenback against a basket of six major currencies, edged higher to around 99.70 during Monday’s Asian session, recovering after posting slight losses in the previous trading day.
Demand for the US Dollar remains supported by a cautious market mood as geopolitical risks stay elevated. The conflict between the United States and Iran has entered a sensitive diplomatic stage, while ongoing military activity and uncertainty surrounding the Strait of Hormuz continue to drive investors toward safe-haven assets. Although Iran indicated that Oman-mediated talks on managing the waterway are progressing, traders remain reluctant to abandon defensive positions, helping the Dollar retain its strength.
Meanwhile, softer US labor market data has reduced expectations for additional Federal Reserve tightening in the near term. July’s Nonfarm Payrolls report showed an unexpected decline of 23,000 jobs, while June’s payroll growth was revised down sharply to 20,000 from 57,000, reinforcing signs of a cooling employment environment.
Market expectations for a September rate hike have consequently weakened. Data from the CME FedWatch Tool shows traders now assign roughly a 46% chance of a 25-basis-point increase next month, compared with 67% a week ago. Attention is now shifting toward upcoming US inflation releases for further guidance on the Fed’s policy path.
Bond Market Reaction
Analysts at TD Securities noted that Treasury yields moved lower and the yield curve steepened following the disappointing payroll figures, even as the unemployment rate eased to 4.1%. The weaker employment data helped alleviate concerns that the labor market was reaccelerating, leading investors to scale back expectations for future rate increases. As a result, pricing for September tightening was reduced by around 3 basis points.
Barkin Signals Balanced but Cautious Outlook
Richmond Fed President Thomas Barkin struck a somewhat more cautious tone, emphasizing that current labor market conditions reflect a “low-hire, low-fire” environment. His remarks suggest employment remains weak but stable rather than deteriorating sharply, reducing the urgency for further policy tightening.
At the same time, Barkin highlighted the resilience of corporate earnings, noting that company profits remain strong and continue to grow. This could limit the scope for a more dovish Fed stance if labor market softness does not spread more broadly across the economy.
The FXS Fed Sentiment Index declined by 1.68 points to 137.01, indicating a moderation in perceived hawkishness. Nevertheless, the index remains well above the neutral 100 level, suggesting that overall Fed communication continues to lean toward maintaining a relatively restrictive monetary policy stance.
Yen struggles to hold intervention gains as dollar hovers near six-week lows
Currency markets traded cautiously on Thursday, with the Japanese yen giving up part of its recent intervention-driven rally and the U.S. dollar remaining close to a six-week low. Investor sentiment was restrained by uncertainty surrounding a proposed U.S.-Iran agreement and anticipation ahead of key U.S. payrolls data.
The yen was little changed at 157.71 per dollar in early trading after posting losses in the previous two sessions. Although it has retreated from Monday’s peak of 155.20, reached following suspected intervention, the currency remains well above last month’s multi-decade low near 164 per dollar.
Elsewhere, major currencies showed limited movement. The euro held steady at $1.1557, while sterling traded flat at $1.3469. The Australian and New Zealand dollars were also largely unchanged at $0.7056 and $0.5885, respectively.
The U.S. dollar index, which measures the greenback against a basket of six major currencies, was steady at 99.65, lingering near its weakest level in six weeks as traders awaited fresh catalysts.
Market participants continued to monitor developments in the Middle East after reports emerged of a proposed agreement involving Iran and Oman aimed at resolving the U.S.-Iran conflict. According to Reuters, the proposal could grant Tehran authority over inbound shipping traffic through the Strait of Hormuz.
Washington has yet to comment officially on the reported plan. While President Donald Trump recently suggested an agreement to reopen the strategic waterway was close, U.S. officials have consistently maintained that they would not support any arrangement giving Iran control over access to the critical energy shipping route.
Oil markets reacted modestly, with Brent crude futures slipping 0.5% to $79.08 per barrel, hovering near levels seen following the interim peace accord between the United States and Iran in June.
Markets adopt wait-and-see approach as central banks and payrolls take center stage
Investors remained cautious, with markets largely in a holding pattern as traders assessed geopolitical developments and awaited fresh economic signals. According to Ray Attrill, Head of FX Strategy at National Australia Bank, the recent calm in oil markets has removed one of the key drivers that had been influencing asset prices in recent weeks.
Attrill noted that market participants are closely watching whether a U.S.-Iran agreement materializes, with uncertainty over the outcome keeping trading activity subdued.
BOJ minutes strengthen case for further tightening
Attention also turned to Japan after minutes from the Bank of Japan’s June policy meeting revealed policymakers discussed rising inflation risks that could warrant additional interest-rate increases, even as they lifted borrowing costs to their highest level in 31 years.
The discussion underscores growing concern within the BOJ about broader price pressures and reinforces expectations that another rate hike could come as early as September.
Although the yen surged as much as 5% against the dollar following intervention efforts by Tokyo and coordinated measures with Washington, the currency has struggled to maintain those gains.
A recent Reuters survey highlighted skepticism over the effectiveness of intervention alone, with nearly 95% of respondents saying currency market operations would not provide a lasting solution to yen weakness. Most respondents argued that further BOJ rate hikes would be necessary to support the currency over the longer term.
U.S. payrolls report expected to shape Fed outlook
Investors are now focused on Friday’s U.S. nonfarm payrolls report for further guidance on the Federal Reserve’s policy trajectory.
Recent data showed the U.S. services sector remained resilient in July despite rising input costs, though employment growth within the sector slowed. Economists surveyed by Reuters expect the upcoming report to show payrolls increased by 80,000 jobs in July, following a gain of 57,000 in June, while the unemployment rate is projected to remain unchanged at 4.2%.
Adding to market uncertainty, Federal Reserve Governor Lisa Cook indicated on Wednesday that she remains open to the possibility of additional rate hikes if inflation proves persistently elevated, signaling that policymakers are not yet ruling out further tightening despite signs of moderating labor-market momentum.
The Japanese Yen retreats against the US Dollar as traders question the sustainability of the currency’s recent rally.
The Yen’s earlier gains were largely supported by coordinated intervention from Japanese and US authorities.
Market participants are now turning their attention to the US ADP Employment Change report and July’s Nonfarm Payrolls (NFP) data for fresh clues on the Federal Reserve’s policy outlook.
The Japanese Yen (JPY) surrenders its earlier gains and trades little changed near 157.70 against the US Dollar (USD) during Wednesday’s European session. The USD/JPY pair rebounds as confidence in the Yen’s recent rally begins to fade, prompting investors to question whether the currency can sustain its strength.
The Yen had outperformed in recent sessions after coordinated intervention by the United States (US) and Japan aimed at curbing what Japan’s Ministry of Finance (MoF) described as “excessive volatility and disorderly movements” in the currency market.
However, many analysts argue that the Yen’s recovery is likely to be temporary unless it is supported by stronger underlying economic fundamentals.
Analysts say intervention offers only temporary relief
Strategists at MUFG believe official intervention will remain relatively limited in scale, noting that while coordinated action between the US and Japan could provide near-term support for the Yen, it is unlikely to reverse the broader weakening trend on its own. They argue that lasting appreciation will require a meaningful shift in economic fundamentals, rather than relying solely on market intervention.
TD Securities shares a similar assessment, describing the latest intervention as an effort by Japanese authorities to buy time while fiscal policies work to boost demand for Yen-denominated assets. The firm suggests the strategy also depends on a weaker US Dollar, potentially driven by softer US economic data or another bearish catalyst. However, TD warns that unless the Bank of Japan (BoJ) accelerates its tightening cycle with a series of rate hikes toward 2%, the longer-term outlook still favors a renewed rise in USD/JPY. The brokerage highlights the wide interest rate gap, with Japan’s one-year, one-year overnight index swap (OIS) rate near 1.9% compared with 4.1% in the US.
Meanwhile, the US Dollar edges slightly lower as traders await the release of the US ADP Employment Change report for July at 12:15 GMT.
Economists at Deutsche Bank forecast private-sector payrolls to increase by 65,000, improving from June’s reading of 49,000.
The ADP report is expected to influence expectations for the Federal Reserve’s (Fed) policy path ahead of Friday’s closely watched US Nonfarm Payrolls (NFP) report for July, which could provide fresh guidance on the outlook for interest rates.
GBP/USD edged lower to around 1.3425 during the early Asian session on Tuesday as investors favored the safe-haven US Dollar amid ongoing uncertainty surrounding US-Iran relations.
US President Donald Trump maintained that discussions with Iran are currently taking place, while Iranian officials rejected the claim and stated that no negotiations are underway, adding to geopolitical uncertainty.
Meanwhile, the US Dollar received additional support after the ISM Manufacturing PMI rose to 55.6 in July, beating market expectations and signaling stronger-than-anticipated expansion in the manufacturing sector.
GBP/USD Slides Toward 1.3425 as Safe-Haven Dollar Gains on US-Iran Uncertainty
The GBP/USD pair weakened to around 1.3425 during Tuesday’s early Asian trading session, with the US Dollar attracting safe-haven demand amid persistent uncertainty surrounding potential US-Iran negotiations.
US President Donald Trump stated on Monday that discussions with Iran remain active, describing the situation as Tehran’s “last chance” to reach an agreement. He also indicated that negotiations could begin within the next few days with the aim of reopening the Strait of Hormuz and addressing US concerns over Iran’s nuclear activities.
However, Iranian officials rejected Trump’s claims. Foreign Ministry spokesperson Esmaeil Baghaei said that no talks with Washington are currently underway and emphasized that Iran is focused on negotiations with Oman regarding the Strait of Hormuz.
The Greenback also drew support from stronger-than-expected US economic data. The Institute for Supply Management (ISM) reported that the Manufacturing PMI climbed to 55.6 in July from 53.3 in June, surpassing market forecasts of 54.0 and signaling continued strength in the manufacturing sector.
Market participants are now turning their attention to the US July employment report due later this week, which could provide fresh clues about the outlook for the Federal Reserve and the US Dollar.
Meanwhile, sterling remains under pressure despite a relatively hawkish vote split at the Bank of England’s latest policy meeting. The BoE left interest rates unchanged at 3.75% in a 6-3 decision, with three policymakers favoring a rate increase. Nevertheless, Governor Andrew Bailey struck a cautious tone, arguing that the disinflation process remains on track and dampening expectations of an aggressive tightening cycle. Investors currently anticipate only one additional BoE rate hike before year-end.
Analysts at Rabobank noted that speculative bearish positions against the Pound increased ahead of the BoE meeting. While the Monetary Policy Committee delivered a more hawkish voting outcome than expected, Bailey’s dovish remarks limited support for sterling, leaving overall sentiment toward the currency subdued.
The US Dollar Index (DXY) trades with a softer tone near 99.70 during Monday’s Asian session. The greenback came under pressure after President Trump stated that fresh negotiations with Iran would begin on Monday, following his decision to cancel a planned military strike. Investors are now turning their attention to Friday’s US Nonfarm Payrolls (NFP) report, which could provide important clues about the Federal Reserve’s next policy move.
US Dollar Weakens as Improved Risk Appetite and Iran Diplomacy Weigh on Safe-Haven Demand
The US Dollar Index (DXY), which tracks the greenback against a basket of six major currencies, trades around 99.70 during Monday’s Asian session. The index remains under pressure as improving market sentiment reduces demand for traditional safe-haven assets. Investors are also awaiting the release of the US ISM Manufacturing PMI later in the day for fresh economic signals.
Risk sentiment received a boost after US President Donald Trump announced on Sunday that he had canceled a planned military strike on Iran and that new talks between Washington and Tehran would begin on Monday. Trump indicated that an agreement to reopen the Strait of Hormuz could be within reach and reiterated his commitment to pursuing a diplomatic solution to Iran’s nuclear program.
The prospect of easing tensions between the United States and Iran has diminished demand for the US Dollar as a defensive asset, weighing on the currency in the short term. If diplomatic progress continues, the greenback could face additional downside pressure against its major peers.
Market participants are now focused on Friday’s US labor market report for further direction. Economists forecast that Nonfarm Payrolls (NFP) increased by 91,000 jobs in July, while the unemployment rate is expected to edge higher to 4.3%. A stronger-than-anticipated employment report could provide support for the Dollar and help limit further losses in the DXY.
Meanwhile, the Federal Reserve left interest rates unchanged at its July meeting last week. According to CME FedWatch data, traders now see roughly a 64.7% probability of a September rate hike, down significantly from nearly 77% before the Fed’s latest decision, reflecting a more cautious outlook for monetary tightening.
Analysts at Commerzbank believe the Dollar could face renewed selling pressure once geopolitical tensions ease further. They argue that the Fed is unlikely to raise rates as aggressively as current market pricing suggests, meaning the fading geopolitical premium could expose the currency to additional weakness if expectations for tighter policy continue to moderate.
The Federal Reserve left interest rates unchanged at 3.50%–3.75% on Wednesday, but the key takeaway for markets was not the decision itself—it was what Chair Kevin Warsh chose not to signal about September.
Three members of the Federal Open Market Committee (FOMC) voted in favor of an immediate 25-basis-point rate increase, while the policy statement retained a generally hawkish stance on inflation. The Fed noted that economic activity continues to expand at a solid pace, the labor market remains resilient, and inflation is still running above the central bank’s 2% target.
Taken at face value, those remarks could be interpreted as laying the groundwork for further tightening.
However, Warsh avoided providing any clear indication that a September rate hike is likely. Instead, he emphasized a data-dependent approach, preserving flexibility rather than committing to another increase.
That nuance is important.
Ahead of the meeting, many investors viewed September as the most probable timing for the next rate hike if policymakers remained on hold in July. After Warsh’s remarks, confidence in that scenario eased noticeably, leaving the outlook for September far less certain.
Hawkish Messaging, Softer Market Interpretation
The result is a notable disconnect.
On one hand, the Fed’s message remains hawkish. Inflation is still above target, economic growth appears strong enough to withstand tighter policy, and several policymakers already favor higher rates.
On the other hand, financial markets interpreted the outcome as relatively dovish because the Fed showed no urgency to tighten further.
This was evident in the immediate market reaction. Two-year Treasury yields declined and the US dollar weakened after the announcement, indicating that traders reduced expectations for near-term rate increases.
From my perspective, the dollar may continue to face pressure unless upcoming inflation reports revive expectations of a September hike.
For now, the Fed has effectively shifted the focus back to incoming economic data.
If inflation proves persistent, markets could quickly reprice toward a more hawkish September outlook. However, if inflation and labor-market data begin to soften, investors may increasingly view July’s decision not as a postponed rate hike, but as the start of a more prolonged pause in the tightening cycle.
DXY: 100.300 Back in the Spotlight
Technically, the US Dollar Index now has the potential to extend its move lower following the post-Fed rejection.
The key downside area to watch is 100.300, which provides the next meaningful support zone.
As long as DXY fails to regain its recent highs and expectations for September tightening remain contained, the path of least resistance could remain lower towards this level.
A clean break below 100.300 would strengthen the bearish dollar narrative, while a recovery driven by stronger inflation data and renewed Fed hike expectations would challenge it.
For now, the interesting takeaway from the Fed is simple: the rhetoric was hawkish, but the market was expecting something even more hawkish.
And in markets, the difference between what happens and what was already expected is often what matters most.
From a technical perspective, the US Dollar Index (DXY) appears vulnerable to further downside after its post-Fed rejection.
The next key level to monitor is 100.300, which stands out as the nearest significant support zone.
As long as DXY remains unable to reclaim its recent highs and market expectations for a September rate hike stay subdued, bearish momentum could continue to build toward this area.
A decisive break below 100.300 would reinforce the case for further dollar weakness and confirm a more bearish outlook. Conversely, stronger-than-expected inflation data or a renewed increase in expectations for Fed tightening could help the dollar recover and invalidate the current downside scenario.
For now, the main lesson from the Fed meeting is straightforward: policymakers delivered a hawkish message, but markets had been positioned for an even more hawkish outcome.
In financial markets, what drives price action is often not the event itself, but the gap between reality and investor expectations.
USD/CAD edges higher as the US Dollar stages a solid rebound from its lowest level since June 17. Rising tensions between the United States and Iran continue to fuel inflation concerns and reinforce expectations that the Federal Reserve could maintain a hawkish stance, providing support for the Greenback. Meanwhile, worries over potential supply disruptions help keep oil prices elevated, lending support to the Canadian Dollar and limiting further gains in the currency pair.
The USD/CAD pair moved slightly higher during Friday’s Asian trading session, ending a three-day decline that had pushed the pair to its lowest level since June 17. The pair remains above the key 1.4000 level, although buying momentum appears limited.
The US Dollar found modest support as markets continued to price in the possibility of at least one additional interest rate increase from the Federal Reserve. While recent US economic data painted a mixed picture—showing slower economic growth in the second quarter and easing inflation pressures through the Personal Consumption Expenditures (PCE) Price Index—investors remain cautious about ruling out further monetary tightening.
Despite signs of cooling inflation, fluctuating oil prices continue to raise concerns about price stability, potentially encouraging the Fed to maintain a restrictive policy stance. At the same time, escalating tensions between the United States and Iran, along with fears of a wider Middle East conflict, have boosted demand for the safe-haven US Dollar. Most recently, the US military confirmed a major wave of strikes against Iranian targets in response to missile attacks on American forces earlier in the week.
However, gains in USD/CAD may remain constrained by support for the Canadian Dollar. Iran’s rejection of an Omani proposal regarding partial control of the Strait of Hormuz, combined with continued attacks by Yemen’s Houthi forces in key shipping routes such as the Bab al-Mandab Strait, the Red Sea, and the Gulf of Aden, has intensified concerns over potential disruptions to global energy supplies. These risks have helped support crude oil prices, which in turn provide backing for the oil-sensitive Canadian Dollar and may limit further upside in the USD/CAD pair.
US Dollar bulls stay cautious ahead of the highly anticipated FOMC policy announcement later on Wednesday.
Ongoing geopolitical tensions continue to support demand for the safe-haven US Dollar.
A rebound in oil prices has reignited inflation concerns and strengthened expectations of further Fed tightening, lending support to the greenback.
The US Dollar Index (DXY), which measures the Greenback against a basket of major currencies, is trading in a narrow range below the 101.50 mark during Wednesday’s Asian session as investors await the outcome of the Federal Reserve’s two-day FOMC meeting. Despite the consolidation, the index remains supported near a one-month high reached on Tuesday and continues to exhibit a constructive bias amid ongoing geopolitical tensions.
Market sentiment shifted after Iran’s Islamic Revolutionary Guard Corps (IRGC) launched multiple ballistic missiles at US military positions in the Middle East late Tuesday. Adding to the uncertainty, President Donald Trump reiterated that Washington is prepared to resume strong military action against Iran if diplomatic efforts fail to quickly resolve the crisis. These developments have heightened concerns about a renewed escalation in the region, boosting demand for the safe-haven US Dollar.
At the same time, the latest Middle East tensions have triggered a sharp rebound in crude oil prices, reigniting worries about inflation and increasing speculation that the Federal Reserve could raise interest rates again. This backdrop is likely discouraging traders from taking aggressive bearish positions on the DXY, though gains remain limited ahead of the Fed’s policy announcement later in the day.
Investors are primarily focused on the Fed’s guidance regarding future monetary policy, which is expected to be the next major catalyst for the US Dollar. Analysts at DBS note that markets remain “highly cautious” ahead of the FOMC decision, despite the recent pullback in oil prices following a temporary easing of US-Iran hostilities. According to the bank, traders are still pricing in roughly a 34% probability of a rate hike at this meeting and nearly 100% odds of a hike in September, highlighting expectations that the Fed may resume tightening even as some geopolitical risk premium in energy markets has faded.
USD/JPY remains below the 164.00 mark after last week’s rally stalled just shy of that psychological level, leaving the pair at its strongest level against the Japanese Yen since 1986.
Japan’s authorities spent a record ¥11.73 trillion intervening in April and May to support the Yen—nearly twice the size of the previous record effort. Despite the massive defense, the protected exchange-rate level was breached within six weeks.
Attention now turns to Friday’s packed schedule, which will feature the Bank of Japan’s policy decision, the release of its quarterly Outlook Report, and the Finance Ministry’s monthly intervention data, all arriving in the same trading session.
USD/JPY Outlook: Tokyo Can Still Defend the Yen, but Its Options Are Narrowing
The Japanese Yen edged slightly higher on Monday, with USD/JPY slipping 0.05% while remaining just below the 164.00 level after last week’s rally stalled a mere ¥0.01 short of the mark. Investors have spent the past two weeks wondering whether Japanese authorities will step in again—and whether they can still afford to do so. The issue, however, is not a shortage of funds but a shortage of effective policy options.
Japan Has Plenty of Dollars, but Limited Flexibility
Japan’s foreign-exchange reserves stand at roughly $1.3 trillion, second only to China globally. However, around $1.1 trillion is invested in foreign securities—primarily U.S. Treasury bonds—which cannot be sold quickly without disrupting markets and potentially locking in losses.
The country’s readily deployable reserves are estimated at $150–180 billion in cash deposits held at the Bank of Japan and other central banks. In addition, Japan maintains a Federal Reserve swap line worth up to $120 billion. Based on the average size of previous interventions, analysts estimate Japan could still conduct roughly 30 more operations if necessary. The real limitation is therefore not financial capacity.
A Record Intervention Delivered Only Temporary Relief
After USD/JPY broke above 160.00 in April, Japan’s Ministry of Finance spent a record ¥11.73 trillion (around $73 billion) intervening in April and May. The effort was nearly twice as large as any previous intervention campaign.
Despite the scale of the operation, the market erased its impact within six weeks, with USD/JPY not only reclaiming the defended level but advancing roughly four yen beyond it. The episode highlighted how difficult it is to reverse a strong market trend without supportive economic fundamentals.
IMF Rules Create Another Constraint
A lesser-known challenge comes from international classification rules. The International Monetary Fund generally considers a currency “freely floating” only if official interventions remain limited and infrequent over a rolling period.
Analysts estimated earlier this year that Japan may have room for only a few additional interventions before risking scrutiny over its free-floating status. In other words, Tokyo’s ability to defend the Yen may be constrained more by policy credibility and international standards than by available cash.
Monday’s Market Action Highlighted the Yen’s Weakness
The Yen’s muted reaction to a sharp decline in oil prices underscored the currency’s structural challenges. Crude oil plunged nearly 9% following easing tensions between Washington and Tehran—a development that should significantly benefit energy-importing Japan.
Yet the Yen gained less than ¥0.10 against the U.S. Dollar.
This suggests that factors beyond energy costs are driving the currency. Although the U.S.-Japan yield gap has narrowed by roughly 40 basis points from its cycle extremes, the Yen has continued to weaken. Rising domestic inflation expectations and persistent capital outflows appear to be offsetting the impact of narrowing rate differentials.
Meanwhile, verbal intervention from Japanese officials has continued, but markets are increasingly ignoring such warnings.
A Critical Week for USD/JPY
Tokyo’s relative silence may be strategic. Currency intervention tends to be most effective when it aligns with broader market forces, and this week’s calendar could provide such an opportunity.
The key event arrives on Wednesday, when the Federal Reserve announces its policy decision. Markets largely expect rates to remain unchanged at 3.75%, though some investors still see a possibility of a surprise hike.
Japan’s data releases follow shortly afterward:
Thursday: Tokyo CPI, unemployment, and retail sales data.
Friday: Bank of Japan policy decision, Outlook Report, and Governor press conference.
Friday: Ministry of Finance intervention statistics for July, which could reveal whether authorities have already entered the market.
While the consensus expects the BoJ to keep rates unchanged at 1.00%, some reports suggest policymakers are becoming increasingly concerned that Yen weakness is adding inflationary pressure, potentially opening the door to a faster tightening cycle.
Key USD/JPY Levels
Resistance
164.00 remains the crucial barrier.
Above that, there is little historical chart structure, leaving 164.50 and 165.00 as the next psychological targets.
Support
163.00 is the first important support level.
162.50 follows below.
The rising 50-day EMA near 161.50 remains the key trend support.
Outlook
The broader trend remains bullish while USD/JPY holds above 163.00. However, the primary risk to further gains is not economic data or technical factors but potential official action from Japanese authorities. The period immediately following Wednesday’s Federal Reserve decision could prove especially important, as it offers the most favorable backdrop for any surprise intervention or policy shift.
Silver advanced over the week but continued to struggle to break decisively above the key $60 level. This major psychological resistance remains a focal point for traders, with selling pressure re-emerging as prices approach the area.
Meanwhile, the $55 region continues to provide solid support, helping to limit downside moves. Despite the recent gains, silver remains challenged by the higher interest-rate environment, which continues to weigh on the precious metals market.
Gold
Gold followed a similar pattern, climbing toward the $4,200 area before retreating from a level that has repeatedly acted as a significant resistance zone. The pullback highlights the market’s ongoing struggle to establish sustained momentum above this threshold.
On the downside, the $4,000 mark remains a key psychological support level, with additional buying interest emerging around $3,900. Overall, gold continues to trade in a volatile and uneven manner, with price action heavily influenced by developments in the Middle East. Geopolitical headlines are likely to remain a major driver of market sentiment, affecting not only gold but also interest-rate expectations, which continue to play a crucial role in shaping global financial markets.
USD/CAD
The U.S. dollar strengthened against the Canadian dollar over the week, even as oil prices surged. This divergence is not particularly surprising, as elevated market uncertainty has boosted demand for the U.S. dollar, while rising U.S. interest rates continue to support the currency. The positive interest-rate differential remains an important factor attracting buyers to the pair.
Although USD/CAD experienced a pullback in recent weeks after an extended bullish run, the correction appears to have helped ease overbought conditions. With the market showing signs of stabilizing, the pair may be positioned to resume its broader uptrend, with the 1.4150 area emerging as a key upside target.
EUR/USD
The euro weakened against the U.S. dollar during the week, with the 1.1400 level continuing to serve as a crucial support zone. This area has attracted significant market attention, having acted as a key consolidation level over the past year.
Looking ahead, the outlook for the pair remains heavily influenced by monetary policy expectations. Elevated U.S. interest rates continue to provide strong support for the dollar, reinforcing its appeal relative to other major currencies. As a result, interest-rate dynamics are likely to remain a primary driver of EUR/USD price action in the near term.
USD/JPY
The U.S. dollar remained firmly supported against the Japanese yen, as the yen continues to struggle amid the wide interest-rate gap between Japan and the United States. The pair’s broader trend remains bullish, with underlying fundamentals continuing to favor the U.S. dollar.
While a short-term correction cannot be ruled out after the recent advance, any pullback is likely to be viewed as a buying opportunity by market participants. The substantial interest-rate differential between the two economies continues to attract demand for the pair, reinforcing the longer-term upward outlook for USD/JPY.
GBP/USD
The British pound declined over the week, but the broader market structure remains largely unchanged. GBP/USD continues to trade within a well-established consolidation range between 1.3150 and 1.3700, suggesting that the recent weakness is part of ongoing sideways price action rather than the start of a new trend.
As the pair remains range-bound, it is likely to continue attracting traders who favor consolidation and mean-reversion strategies. Compared with other major currencies, the pound has shown relative resilience against the U.S. dollar, supported in part by the Bank of England’s comparatively hawkish policy stance, which has helped limit downside pressure on sterling.
Bitcoin (BTC/USD)
Bitcoin continues to experience choppy and unpredictable price action, with market sentiment largely driven by shifts in overall risk appetite. As investors weigh macroeconomic conditions and broader financial market trends, volatility is likely to remain elevated.
Despite the recent fluctuations, the $60,000 level appears to be establishing itself as a significant support zone. From a technical perspective, the latest weekly candlestick resembles a shooting star, following two consecutive hammer formations. This combination suggests a market lacking clear directional conviction, increasing the likelihood of continued sideways trading as participants wait for a stronger catalyst to determine the next major move.
Nasdaq 100
The Nasdaq 100 attempted to move higher during the week but quickly surrendered its gains as investor caution remained elevated. Ongoing geopolitical uncertainty and concerns about the economic outlook continue to weigh on sentiment, limiting the index’s ability to sustain upward momentum.
From a technical standpoint, the index appears vulnerable to a deeper correction if selling pressure persists. However, a decisive break above the high of the latest weekly candlestick would signal renewed bullish strength and could improve the near-term outlook. For now, persistent tensions in the Middle East and expectations of higher interest rates remain key headwinds, making it difficult for growth-oriented assets such as the Nasdaq 100 to stage a strong and sustained rally.
The pair gains traction as the US conducts a 13th straight night of military strikes against Iran, fueling geopolitical uncertainty. Market participants are now turning their attention to the UK’s June Retail Sales data, due later on Friday, for fresh direction and trading cues.
GBP/USD rebounds toward 1.3325, ending a five-session decline during Friday’s Asian trading hours.
Despite the recovery, gains may remain capped as escalating military tensions in the Middle East continue to support demand for the safe-haven US Dollar. Investors are also awaiting the release of the UK Retail Sales report later in the day for fresh market direction.
Geopolitical risks remain elevated after the US Central Command (CENTCOM) carried out a 13th consecutive night of strikes on Iranian-linked targets. US President Donald Trump stated that Iran would be held accountable for Houthi attacks and warned that both Iran and the Houthis could face significant military consequences, further boosting risk aversion and underpinning the Greenback.
Meanwhile, expectations for the Bank of England remain largely unchanged. Markets widely anticipate the BoE will leave its benchmark interest rate at 3.75% at next week’s meeting while assessing the economic impact of the Middle East conflict. According to Reuters, traders continue to price in one or two quarter-point rate increases by the end of 2026, little changed from earlier expectations.
Attention now turns to the UK Retail Sales figures, which could provide additional insight into the BoE’s policy outlook. Economists forecast a 0.3% monthly decline in June sales following May’s 1.2% increase. A stronger-than-expected result could strengthen the case for the BoE to maintain a hawkish stance, potentially offering further support to the Pound.
Analysts at Scotiabank highlighted that market expectations remain firmly anchored ahead of the BoE meeting, with investors largely expecting no change in interest rates. The stable policy outlook is likely to continue shaping near-term GBP/USD trading as markets await fresh economic data for clearer direction.
The US Dollar Index (DXY) remains under pressure as investors weigh renewed inflation worries against signs of slowing economic momentum in the United States. Ambiguous signals from Federal Reserve Chair Kevin Warsh have added uncertainty to the Dollar’s longer-term trajectory, while ongoing geopolitical tensions in the Middle East continue to support safe-haven flows, potentially limiting further downside for the Greenback.
The US Dollar Index (DXY), which tracks the US Dollar against a basket of six major currencies, extended its decline for a second straight session, hovering near 101.00 during Thursday’s Asian trading hours.
The Greenback remains under pressure as investors assess the impact of rising inflation risks, fueled by higher energy prices, alongside signs of a slowing US economy. Although the Federal Reserve is widely expected to keep interest rates unchanged at its next policy meeting, evolving rate expectations and mixed signals from newly appointed Fed Chair Kevin Warsh have increased uncertainty surrounding the Dollar’s longer-term direction.
Nevertheless, losses in the US Dollar may be limited by persistent safe-haven demand amid escalating geopolitical tensions in the Middle East. Market concerns intensified after US President Donald Trump warned of potential strikes on Iranian infrastructure if Tehran targets vessels passing through the Strait of Hormuz, prompting Iran to threaten rapid retaliation against US-associated energy facilities in the region.
Further adding to the uncertainty, Iran-backed Houthi forces reportedly carried out missile and drone attacks on two Saudi oil tankers in the Red Sea. The incident represents the first direct assault on tankers in the strategic waterway, threatening a key alternative route for Saudi crude exports and raising fears of a broader regional conflict.
EUR/USD edges higher to around 1.1405 during Wednesday’s Asian trading session. Elevated energy prices are raising concerns about renewed inflationary pressures, reinforcing expectations that the European Central Bank may maintain a tighter policy stance. Meanwhile, geopolitical tensions remain in focus after President Donald Trump downplayed the chances of near-term negotiations with Iran, as US military operations against the country entered an eleventh consecutive night.
EUR/USD posts modest gains near 1.1405 during Wednesday’s early Asian trading hours, supported by the European Central Bank’s increasingly hawkish outlook. The Euro finds demand against the US Dollar as investors position ahead of the ECB’s policy announcement scheduled for Thursday.
European sovereign bonds advanced earlier this week as persistent geopolitical risks in energy markets and concerns over renewed inflation pressures led traders to anticipate a less accommodative ECB policy trajectory.
Although the ECB is broadly expected to keep its deposit rate unchanged at 2.25% at the July meeting, market pricing suggests rates could climb to 2.66% by December and 2.73% by February 2027. According to Reuters, investors have also fully priced in a rate hike for September.
On the geopolitical front, US President Donald Trump downplayed the likelihood of near-term talks with Iran as hostilities continued and Yemen’s Iran-backed Houthi forces renewed threats against shipping in the Red Sea. Trump warned on Tuesday that Washington would retaliate if maritime routes were disrupted, though he provided no details on the potential response.
Meanwhile, Iran’s senior military leadership stated that Tehran would broaden its military operations and target US and allied interests throughout the region should Washington strike Iranian nuclear facilities, according to Xinhua. The escalating Middle East conflict could strengthen demand for traditional safe-haven assets, including the US Dollar, potentially limiting further upside in EUR/USD.
Major currency pairs traded within familiar ranges early Tuesday as investors avoided making aggressive moves while monitoring developments in the Middle East. Attention now turns to Germany and the Eurozone’s ZEW Economic Sentiment surveys, while the US economic calendar remains light for the remainder of the day.
After Monday’s volatile session, crude oil prices eased modestly, with West Texas Intermediate (WTI) slipping around 0.5% to trade near $82 per barrel. Oil initially retreated after reports suggested mediators had proposed a 10-day ceasefire between the United States and Iran to revive diplomatic negotiations. However, hostilities continued to escalate.
US President Donald Trump warned that Iran would face consequences following the deaths of American service members, while US forces carried out strikes for a tenth consecutive day, targeting areas near Sirik, Bandar Abbas, Qeshm Island, Chabahar, and Konarak. Iran responded with attacks on US assets across the Gulf, keeping geopolitical tensions elevated.
Oil Supported by Ongoing Geopolitical Risks
Despite signs of diplomatic engagement, analysts remain cautious. Deutsche Bank noted that Iran acknowledged receiving proposals from international mediators, but escalating rhetoric from both Yemen’s Houthi movement and President Trump helped push Brent crude to settle 1.27% higher at $89.22 per barrel.
OCBC warned that any broader escalation could revive concerns over a prolonged disruption to global oil supplies, potentially lifting crude prices back above $100 per barrel. Such a scenario could increase market volatility, weaken demand for carry trades, and reinforce demand for the US Dollar as investors seek safe-haven assets.
Fed Faces Fresh Inflation Concerns
The US Dollar Index (DXY) extended Monday’s gains by more than 0.2%, although it traded sideways just below the 101.00 level during Tuesday’s European session.
According to Commerzbank’s Volkmar Baur, persistently high energy prices could make it increasingly difficult for the Federal Reserve to avoid raising interest rates. While policymakers typically focus on core inflation, sustained increases in oil prices risk feeding into broader inflation through second-round effects, complicating the Fed’s policy outlook.
Sterling Softens Despite Stable Labor Market
UK labor market data showed the ILO unemployment rate remained unchanged at 4.9% in the three months to May. Meanwhile, average earnings excluding bonuses increased 4.3% year-over-year, below expectations of 4.5%.
The softer wage growth limited Sterling’s recovery, although GBP/USD edged slightly higher to around 1.3450 after three consecutive daily declines. Investors now await Wednesday’s UK inflation report.
New Zealand Dollar Outperforms After Inflation Surprise
New Zealand’s second-quarter inflation accelerated more than expected, with the annual Consumer Price Index (CPI) rising to 4.1%, up from 3.1% in the previous quarter and exceeding forecasts of 4.0%.
The stronger inflation reading boosted expectations that the Reserve Bank of New Zealand could maintain a restrictive policy stance, lifting NZD/USD above 0.5850, its strongest level since early June.
Euro, Canadian Dollar and Yen Hold Steady
EUR/USD traded quietly around 1.1420 after posting modest losses on Monday.
USD/CAD remained above 1.4050 despite Canadian inflation slowing to 2.8% in June from 3.2% previously. The Canadian Dollar also faced pressure after the White House announced that President Trump would impose 50% tariffs on most Canadian imports, citing what Washington described as discriminatory treatment of US automobiles, alcohol, and dairy products.
Meanwhile, USD/JPY held near 162.50. Japanese Prime Minister Sanae Takaichi stated that the government would continue balancing economic support with fiscal sustainability while working to preserve market confidence.
USD/JPY may face downside pressure as the US Dollar loses momentum amid improving risk sentiment sparked by fresh diplomatic developments.
Iran has reportedly received mediation proposals aimed at easing tensions with the United States, including the possibility of a 10-day ceasefire.
Meanwhile, Japanese Prime Minister Sanae Takaichi reaffirmed her commitment to preserving market confidence and ensuring fiscal discipline in Japan’s economic strategy.
USD/JPY advanced for a fourth consecutive session, trading near 162.60 during Tuesday’s European session, though activity remained subdued with Japanese banks closed for the Marine Day holiday.
The pair’s upside may remain limited as the US Dollar struggles to build momentum amid improving market sentiment. Hopes for a reduction in geopolitical tensions emerged after Iranian officials confirmed receiving mediation proposals from international intermediaries aimed at easing the standoff with the United States, including discussions of a possible 10-day ceasefire.
According to Axios, President Donald Trump is considering two contrasting approaches: supporting a temporary ceasefire to allow the reopening of the strategically important Strait of Hormuz or joining Israel in a broader military campaign. The deliberations come as US military assets continue to be deployed across the region while diplomatic efforts remain underway.
Meanwhile, Japanese Prime Minister Sanae Takaichi reiterated the government’s commitment to preserving market confidence and maintaining fiscal discipline. She also highlighted plans to accelerate economic growth, targeting real GDP expansion above 1% and nominal growth exceeding 3% in the near term, while pursuing stronger long-term economic performance.
Investors are now looking ahead to Japan’s June National Consumer Price Index (CPI), due on Friday, for fresh clues on the Bank of Japan’s policy trajectory. Economists expect core inflation, which excludes fresh food, to increase 1.6% year-over-year, compared with 1.4% in May, reinforcing speculation over the central bank’s next policy move.
DXY bulls remain cautious, avoiding aggressive positioning as they await greater clarity on evolving geopolitical risks.
Higher oil prices are stoking inflation concerns and reinforcing expectations of additional Federal Reserve rate hikes, providing support for the US Dollar.
The favorable fundamental environment indicates that any near-term pullbacks are likely to attract fresh buying interest.
The US Dollar Index (DXY), which measures the Greenback against a basket of major currencies, is struggling to build on a modest uptick during Monday’s Asian session and is hovering near the 100.80–100.75 area, little changed on the day. Despite the subdued price action, the broader outlook remains supportive for the US Dollar as escalating US-Iran tensions and expectations of a more hawkish Federal Reserve continue to underpin sentiment.
The Middle East conflict intensified over the weekend after the United States carried out a ninth consecutive night of strikes against Iran, following reports of another American service member being killed in Iraq. President Donald Trump stated that the operation was conducted in response to recent US military casualties. Iran retaliated by launching ballistic missiles and attack drones at targets in Bahrain, Jordan, Kuwait, and Iraq, heightening fears of a wider regional conflict. The growing geopolitical uncertainty is encouraging investors to maintain a risk premium in markets, boosting demand for the US Dollar as a traditional safe-haven asset.
At the same time, crude oil prices have surged to their highest levels since June 12, driven by concerns over supply disruptions linked to the closure of the Strait of Hormuz and a US naval blockade of Iranian ports. The sharp rise in energy costs is reviving inflation worries and increasing expectations that major central banks, including the Fed, may need to keep monetary policy tighter for longer. Market pricing reflected in the CME FedWatch Tool continues to indicate the possibility of at least one Fed rate hike in 2026, reinforcing the constructive outlook for the Greenback and limiting downside risks for the DXY.
Looking ahead, the US economic calendar is relatively quiet on Monday, leaving the Dollar largely influenced by remarks from Federal Open Market Committee (FOMC) officials and developments in the Middle East. While geopolitical headlines are likely to remain a key source of volatility, the overall fundamental backdrop continues to favor the bulls, suggesting that any notable pullbacks in the DXY are likely to attract fresh buying interest.
Light Sweet Crude posted strong gains over the past week, a move largely driven by persistent geopolitical tensions in the Middle East that continue to fuel concerns over potential supply disruptions.
The market appears firmly positioned to challenge the $85 per barrel mark. Any near-term weakness or corrective pullbacks are likely to attract fresh buying interest, particularly from short-term traders looking to capitalize on the prevailing bullish momentum.
Gold
Gold retreated below the $4,000 threshold once again during the week, remaining under pressure as investors continue to assess the interest rate outlook. Persistent concerns that elevated borrowing costs could reduce the appeal of non-yielding assets such as gold have weighed on market sentiment.
The $4,000 level remains a key technical support zone. A sustained hold above this area could help stabilize prices, while a decisive break lower may open the door to additional downside pressure.
Silver
Silver came under heavy selling pressure during the week, dropping to a fresh low before attempting a modest recovery heading into Friday’s session. Despite the rebound, the broader technical outlook remains weak, with rallies likely to encounter renewed selling interest as bearish sentiment continues to dominate the market.
The $50 level remains a significant support zone that has influenced price action on several occasions in the past. Given the current downward momentum, a move toward this area cannot be ruled out. Rising interest rates continue to undermine the appeal of non-yielding assets, leaving silver vulnerable to further declines and offering little incentive for bullish positioning at this stage.
CAC 40
The CAC 40 experienced volatile and range-bound trading throughout the week. However, following the sharp decline seen in the previous week, the recent consolidation can be viewed as a constructive sign that the market may be stabilizing. A decisive break above the 8,400 level could pave the way for further gains toward 8,500.
A sustained move beyond 8,500 would strengthen the bullish outlook and potentially trigger a broader upward advance. On the downside, the 8,000 area continues to provide significant support, and as long as the index remains above this level, the longer-term uptrend is likely to stay intact.
Natural Gas
Natural gas prices edged lower over the past week, extending the prevailing bearish trend. The weakness is largely consistent with seasonal demand patterns, as this period of the year typically experiences softer consumption. Under these conditions, short-term rebounds are likely to be viewed as selling opportunities rather than the start of a sustained recovery.
Market sentiment remains tilted to the downside, with traders likely to sell into rallies that show signs of losing momentum. A break below this week’s low could accelerate selling pressure and expose the $2.50 level as the next significant downside target. Given that the market is currently focused on the August contract, a substantial upward move appears unlikely unless an intense and widespread heatwave significantly boosts energy demand across the United States.
USD/CAD
The US dollar came under significant pressure against the Canadian dollar during the week, with the 1.40 level providing a measure of support heading into the weekend. Strength in crude oil prices has contributed to the Canadian dollar’s resilience, as rising energy prices generally benefit Canada’s commodity-linked currency.
The 1.40 area is likely to remain a closely watched support zone, making next week’s price action particularly important for determining the pair’s near-term direction. Recent movements have been influenced by a combination of factors, including ongoing geopolitical tensions in the Middle East, softer-than-expected US CPI and PPI data, and stronger-than-forecast Canadian employment figures released the previous week. Together, these developments have increased pressure on the US dollar while providing support for the Canadian currency.
NASDAQ 100
The Nasdaq 100 declined during the week, revisiting the 28,500 level, a region that has repeatedly acted as an important support zone. The market’s ability to hold above this area is likely to attract attention from investors looking for value opportunities and could help sustain the broader consolidation pattern.
If buyers successfully defend the 28,500 support level, the index may stage a rebound and continue trading within its established range. Under current conditions, the broader outlook still favors a move back toward the 30,000 mark over time. However, a significant deterioration in geopolitical conditions, particularly in the Middle East, could undermine risk sentiment and challenge the bullish scenario.
EUR/USD
The EUR/USD pair continued to hover around the key 1.14 level throughout the week. This area, which previously served as a major support zone, remains an important reference point for traders. Although the euro managed to recover modestly earlier in the week, higher US interest rates have continued to limit upside momentum and provide underlying support for the US dollar.
The broader bias remains cautious, with rallies likely to face resistance if buying momentum begins to fade. Given the current interest rate dynamics and ongoing demand for the dollar, traders may prefer a short-term trading approach, looking to capitalize on brief upward corrections while remaining alert to signs of renewed weakness in the pair.
GBP/USD slips toward 1.3470 during Friday’s Asian session.
The US carried out a sixth consecutive day of strikes against Iran, fueling geopolitical tensions.
Markets continue to increase expectations for additional Bank of England rate hikes this year.
The GBP/USD pair remains under modest pressure, slipping to around 1.3470 during Friday’s Asian session as heightened geopolitical tensions in the Middle East dampen investor risk appetite and lend support to the US Dollar. Market participants are also awaiting the preliminary University of Michigan Consumer Sentiment Index for July, due later in the day.
Risk aversion intensified after the United States launched a sixth consecutive day of military strikes against Iran. Authorities in Bandar Abbas reported damage to civilian infrastructure, including electricity facilities and a railway station, adding to concerns over a widening regional conflict.
The US Central Command (CENTCOM) stated that the latest operations were aimed at further weakening Iran’s military capabilities and confirmed that naval forces had boarded a vessel as part of efforts to enforce the blockade around the strategic waterway. Earlier this week, President Donald Trump warned that Iranian bridges and power infrastructure could become targets unless Tehran returned to negotiations. The escalating conflict has increased demand for traditional safe-haven assets, providing additional support for the US Dollar against Sterling.
Meanwhile, recent US inflation figures have offered mixed signals. Consumer price inflation eased in June, while producer prices also declined, reinforcing expectations that inflationary pressures are moderating. Even so, traders continue to assign roughly a 55% probability to a Federal Reserve interest rate hike in September, according to the CME FedWatch Tool.
In the UK, Bank of England Governor Andrew Bailey acknowledged concerns over the renewed hostilities between the US and Iran but said the conflict has not materially altered the country’s inflation outlook. Markets continue to expect the BoE to raise interest rates at its November meeting, with another increase largely priced in by April 2027, according to Reuters.
The U.S. Dollar Index remains under pressure as cooling inflation signals reduce expectations of additional Fed rate hikes. However, concerns over energy-driven price pressures and rising tensions between the United States and Iran help cushion the Greenback’s downside. Market participants now await upcoming U.S. economic releases for fresh direction amid mixed fundamental signals.
The US Dollar Index (DXY), which measures the Greenback against a basket of major currencies, traded in a narrow range near 100.50 during Thursday’s Asian session, hovering close to the almost four-week low reached the previous day. While declining expectations of further Federal Reserve rate hikes continue to weigh on the dollar, concerns over energy-driven inflation and rising geopolitical tensions between the United States and Iran are helping to limit downside pressure.
Fresh economic data released on Wednesday showed that the US Producer Price Index (PPI) fell 0.3% in June, following a revised 0.6% increase in the previous month. The weaker PPI reading came after Tuesday’s softer-than-expected Consumer Price Index (CPI) report, reinforcing expectations that inflationary pressures are easing. As a result, investors have become less concerned that the Federal Reserve will need to maintain higher interest rates for an extended period, creating a bearish backdrop for the US dollar in the near term.
Geopolitical developments, however, continue to provide some support for the Greenback. Tensions between the United States and Iran have intensified significantly this week, with both countries carrying out additional military operations. On Wednesday, US forces conducted airstrikes targeting Iranian missile and drone facilities, while Tehran responded with retaliatory attacks against US-linked military assets across the region, signaling a worsening conflict.
US President Donald Trump further heightened tensions by warning that key Iranian infrastructure, including power stations and bridges, could become targets if hostilities escalate further. In addition, a US aircraft reportedly engaged an empty oil tanker attempting to breach the naval blockade around Iranian ports. At the same time, Iran has effectively restricted access through the Strait of Hormuz and threatened to disrupt shipping in the Bab el-Mandeb Strait.
These developments raise concerns about global trade flows and energy supplies, helping to keep oil prices elevated and maintaining a geopolitical risk premium in financial markets. Furthermore, market expectations for at least one additional 25-basis-point Federal Reserve rate hike remain intact, discouraging traders from aggressively selling the dollar. Investors are now awaiting upcoming US economic data releases for clearer direction on monetary policy and the next move in the currency markets.
The US Dollar Index trades lower against its major counterparts as markets scale back expectations for a more hawkish Federal Reserve.
US inflation softened in June, with both headline and core CPI easing to 3.5% and 2.6% year-over-year, respectively.
Fed Chair Kevin Warsh reiterated that the central bank remains firmly committed to bringing inflation under control, emphasizing zero tolerance for persistently elevated price pressures.
The US Dollar (USD) weakens against its major peers as investors scale back expectations for further Federal Reserve (Fed) rate hikes this year after softer-than-anticipated US inflation data for June. The US Dollar Index (DXY), which tracks the Greenback against a basket of six major currencies, is trading around 100.80, down roughly 0.12% on the day.
Data released by the US Bureau of Labor Statistics (BLS) on Tuesday showed headline Consumer Price Index (CPI) inflation eased to 3.5% year-over-year in June from 4.2% in May, coming in below the market forecast of 3.8%. Meanwhile, core CPI, which strips out food and energy prices, rose 2.6% annually, undershooting both the 2.8% consensus estimate and May’s 2.9% reading.
Following the inflation report, market expectations for another Fed rate increase this month dropped sharply. According to the CME FedWatch Tool, the probability of a rate hike has fallen to 16.6%, down from 41.7% a day earlier.
Despite the softer inflation figures, Fed Chair Kevin Warsh maintained a firm stance on price stability during his congressional testimony on Tuesday, stressing that policymakers have “no tolerance for persistently elevated inflation.” He added that if monetary policy remains on the right path, the inflation surge seen over the past five years will eventually become a thing of the past.
Market participants now await the release of June’s US Producer Price Index (PPI), scheduled for 12:30 GMT, for additional insight into wholesale inflation trends and the Fed’s policy outlook.
Meanwhile, rising tensions between the United States and Iran could continue to support demand for the Greenback, as investors seek the safety of the world’s reserve currency amid growing geopolitical uncertainty.
GBP/USD gathers strength to near 1.3360 in Tuesday’s Asian session.
Renewed US strikes on Iran and fears over Strait of Hormuz shipping might cap the upside for the pair.
BoE’s Pill said interest rates are likely to rise to keep inflation in check.
The GBP/USD pair remains on the front foot, trading near 1.3360 during Tuesday’s Asian session. Even so, gains in the pair may be restrained as investors monitor mounting geopolitical tensions between the United States and Iran. Market participants are also turning their attention to the release of the US June Consumer Price Index (CPI) later in the day.
According to Reuters, US President Donald Trump announced on Monday that Washington had reinstated a naval blockade on Iran and would keep the Strait of Hormuz open through a fee-based arrangement following renewed missile and drone exchanges. The US military also confirmed fresh strikes against Iranian military facilities, noting that more than 50,000 US troops are currently stationed across the Middle East.
On Tuesday, Iran’s Islamic Revolutionary Guards Corps (IRGC) warned that any cooperation with what it described as the “aggressor enemy” in the Strait of Hormuz would postpone the waterway’s reopening and could trigger a global energy crisis. Heightened fears of a broader US-Iran conflict may continue to support demand for the safe-haven US Dollar (USD), limiting further upside in GBP/USD.
Meanwhile, expectations have grown that the Bank of England (BoE) may need to raise interest rates later this year to contain persistent inflation. BoE Chief Economist Huw Pill stated that tighter monetary policy is likely to be required to prevent inflationary pressures from becoming deeply embedded.
The US Dollar Index (DXY) moved higher as investors sought the safety of the US dollar amid escalating geopolitical tensions in the Middle East. Tehran has rejected further negotiations, insisting that Washington first fulfill earlier commitments regarding transit security and Iranian oil exports. Meanwhile, market participants continue to anticipate one final interest-rate hike from the Federal Reserve before the end of the year, providing additional support for the greenback.
The US Dollar Index (DXY), which tracks the US Dollar against a basket of six major currencies, extended its gains for a second consecutive session, hovering around 101.10 during Monday’s Asian trading hours.
The Greenback continued to attract safe-haven flows as geopolitical tensions in the Middle East intensified. According to Bloomberg, the US Central Command (CENTCOM) carried out additional strikes on Sunday aimed at reducing Iran’s ability to threaten civilian vessels transiting the strategic waterway.
Reuters reported that US forces have struck more than 300 Iranian targets over the past three days, including approximately 140 targets on Saturday alone, while Washington and Tehran offered conflicting assessments regarding the status of maritime traffic through the strait. The latest escalation has further diminished prospects for diplomatic progress, with Tehran insisting that the US must first honor previous commitments related to shipping security and the normalization of Iranian oil exports before negotiations can move forward.
The US Dollar also found support from rising concerns that the intensifying US-Iran conflict could drive energy prices higher, fueling inflationary pressures and potentially keeping Federal Reserve policy restrictive for longer. Investors are now focused on Tuesday’s release of the US Consumer Price Index (CPI) report for fresh signals on the Fed’s policy path. Economists expect headline CPI to decline by 0.1% month-over-month in June, while core CPI is forecast to increase by 0.3%.
Market participants continue to price in one additional Federal Reserve rate hike before year-end. Attention will also turn to Fed Chair Kevin Warsh, who is scheduled to make his first official appearance before Congress on Tuesday, with traders looking for further guidance on the outlook for monetary policy.
Natural gas came under strong selling pressure during the week, with prices breaking below the key $3.00 level on Friday. While this move points to continued bearish momentum in the near term, the scope for further declines may be relatively limited.
Seasonal patterns typically keep the natural gas market confined within a broad trading range during this period of the year. Although the overall bias tends to remain slightly negative, any upward moves should still be approached cautiously due to soft demand conditions. Unless unusually high temperatures trigger a surge in electricity consumption, demand for natural gas is unlikely to strengthen significantly.
As the primary heating season remains several months away in the United States, the market lacks a major catalyst for sustained gains. Consequently, natural gas prices are likely to remain range-bound for the time being, with traders awaiting stronger seasonal demand later in the year.
WTI Crude Oil
WTI crude oil posted a modest gain over the week, although much of the earlier strength was driven by market reactions to U.S. strikes on Iran. Since then, a large portion of those gains has been erased, indicating that the market remains uncertain about its next directional move.
At present, crude oil appears to be settling into a typical summer trading range as traders assess geopolitical developments alongside broader supply and demand dynamics. The $68 level may emerge as an important support zone, potentially providing a floor for prices if selling pressure persists.
For now, the market seems more likely to consolidate than trend decisively in either direction. A period of sideways trading over the next week or two could help establish a clearer range before the next significant move develops.
Gold
Gold prices spent much of the week under pressure, but the key development was the market’s successful defense of the $4,000 level. The strong rebound from this area reinforces its importance as a major support zone and suggests that buyers remain active on dips.
While the recovery is encouraging for bullish sentiment, it remains uncertain whether the upward momentum can be sustained in the near term. Traders will likely continue to monitor broader macroeconomic factors, particularly movements in the U.S. dollar, for clues about gold’s next direction.
A weaker dollar could provide additional support for the precious metal by improving its appeal to international investors. Conversely, renewed strength in the greenback may limit further gains and keep gold trading within its recent range.
EUR/USD
The euro ended the week lower but managed to hold above the important 1.1400 support area, suggesting that buyers are still defending this level despite recent weakness. While the overall tone remains somewhat bearish, the next few trading sessions should provide greater clarity regarding the pair’s near-term direction.
Market participants will be closely watching price action around current levels to determine whether support can continue to hold. A sustained move below 1.1400 would likely reinforce downside pressure and shift attention toward lower technical targets.
Should the pair break decisively beneath support, the 1.1200 region could become the next key area of interest. This level aligns with the projected target from a bearish flag formation on the daily chart and is further supported by the presence of the 200-week Exponential Moving Average, making it a potentially significant zone for buyers to re-enter the market.
USD/CAD
The U.S. dollar traded in a relatively choppy manner against the Canadian dollar throughout the week, reflecting ongoing uncertainty surrounding Canada’s economic outlook and broader market sentiment. Price action remains confined within a historically significant area that previously served as the starting point of a major breakdown in early 2025, which helps explain the market’s current lack of directional conviction.
Given the technical backdrop, a near-term pullback would not be surprising. Even if prices retreat, demand could emerge on dips, particularly as the pair approaches lower support levels where buyers have previously shown interest.
The 1.4000 region remains a key support zone and may continue to act as a solid floor due to the substantial amount of historical trading activity associated with it. On the upside, a move toward 1.4500 remains possible, although the market will likely require a stronger fundamental or macroeconomic catalyst before such a rally can gain momentum.
USD/MXN
USD/MXN spent much of the week moving sideways, with the pair continuing to hover around the 17.50 level. This area is particularly noteworthy from a technical perspective, as it previously acted as a significant resistance zone and may now play an important role in determining the market’s next directional move.
Traders will be watching closely to see whether the pair can establish momentum above current levels. A breakout beyond this week’s high could open the door for a move toward the 18.00 mark, which represents the next major psychological resistance level.
Despite this potential upside scenario, the broader fundamental backdrop continues to favor the Mexican peso due to the interest rate differential between the two countries. As a result, the longer-term bias may still lean toward USD/MXN weakness. However, clearer bearish price signals would likely be needed before a convincing short-selling opportunity emerges.
Silver
Silver experienced a sharp decline during the week, briefly falling below the critical $60 level before recovering and attracting renewed buying interest. Despite the rebound, the metal remains in a vulnerable position, with the $60 area continuing to serve as a key battleground between buyers and sellers.
While silver has managed to stabilize for the moment, the broader outlook remains cautious. Sustained upside momentum may prove difficult unless supported by a more favorable macroeconomic environment, particularly through lower U.S. interest rates or a weakening U.S. dollar.
From a technical standpoint, the $57 level represents an important support zone. A decisive break below this area could trigger additional selling pressure and pave the way for a deeper decline toward the $50 mark. Until stronger bullish catalysts emerge, traders are likely to remain focused on downside risks and broader market conditions.
GBP/USD
The British pound advanced over the course of the week, although gains remained capped near the 1.3450 region. This area continues to act as a significant resistance zone, with selling pressure likely extending toward the psychologically important 1.3500 level.
While the broader trend has shown signs of resilience, the pair has yet to generate enough momentum to break convincingly above resistance. As a result, traders may remain cautious until a clearer directional signal emerges.
For the time being, GBP/USD appears likely to remain within a broader trading range. In this environment, short-term rallies that begin to lose momentum could present opportunities for sellers, particularly if resistance levels continue to hold and market conditions fail to support a sustained breakout.
Escalating tensions between the US and Iran drove oil prices higher, reigniting inflation worries and dampening investor sentiment.
A stronger US Dollar continues to weigh on EUR/USD, with geopolitical uncertainty taking precedence over economic fundamentals.
Investors are looking ahead to the Fed minutes for policy clues, although developments in the Middle East remain the primary catalyst for market direction.
After a turbulent first half of the year marked by the US-Israel conflict with Iran and President Trump’s frequent policy reversals, investors were hoping for a quieter period as the summer holiday season approached. Instead, geopolitical tensions appear to be resurfacing.
Oil prices have climbed sharply over the past few sessions, recovering to levels last seen before the conflict. While Trump may later attempt to ease market concerns with softer rhetoric, the immediate reaction has been a renewed focus on geopolitical risks.
My view is that Trump is unlikely to favor a major escalation, which could limit the magnitude of any oil rally compared with the dramatic price swings witnessed during the peak of the conflict earlier this year. However, his recent remarks have undeniably heightened concerns over potential supply disruptions from Iran and the broader Middle East. In particular, markets are once again watching the possibility of Tehran restricting traffic through the Strait of Hormuz, a critical global energy chokepoint.
The coming days should provide greater clarity on how the situation develops, but for now, there is a growing risk that markets could find themselves facing a familiar geopolitical backdrop once again.
Fed Minutes Likely to Take a Back Seat as Geopolitical Risks Return
Markets initially appeared to shrug off the renewed tensions between the US and Iran earlier this week, but sentiment has shifted noticeably. As geopolitical concerns intensify, investors are likely to pay less attention to incoming macroeconomic data. While the minutes from the Federal Reserve’s June meeting are due later today and are expected to reaffirm a hawkish policy stance, supporting the US Dollar, the market’s primary focus has returned to oil prices and their implications for inflation and interest-rate expectations.
Investor sentiment deteriorated after President Trump’s remarks at the NATO summit unsettled financial markets, prompting a broad risk-off move that weighed on European equities and US stock futures. Addressing reporters, Trump stated that the memorandum of understanding with Iran was no longer valid and referred to Iranian leaders in highly critical terms, signaling a tougher stance toward Tehran.
The change in rhetoric has significantly reduced hopes for renewed diplomatic engagement. Only a few days ago, expectations were growing that both Washington and Tehran would maintain restraint ahead of another round of negotiations. Instead, concerns over renewed confrontation have resurfaced, placing geopolitical risks back at the forefront of market attention.
Euro Lacks Clear Catalysts Amid Mixed Fundamental Signals
The euro continues to face a challenging outlook as conflicting economic and geopolitical factors shape market sentiment. On the positive side, Germany’s industrial production data surprised to the upside, with output increasing by 0.9% in May, supported by stronger activity in the automotive and construction sectors.
The data suggests that Europe’s industrial economy has remained relatively resilient despite recent geopolitical uncertainty. However, the renewed escalation of tensions in the Middle East threatens to push energy costs higher once again, potentially weighing on economic growth across the region. At the same time, investors remain divided over the European Central Bank’s policy path, with expectations for a September rate hike no longer representing the market’s base-case scenario.
Nevertheless, ECB policymakers are unlikely to signal an end to the inflation fight while geopolitical risks remain elevated. Underlying price pressures continue to run above desired levels, prompting officials to maintain a cautious and data-dependent stance. Comments from senior ECB members this week may reinforce that message, providing intermittent support for the euro. Even so, such support could prove limited as the US Dollar continues to benefit from safe-haven demand and expectations that US interest rates will remain elevated for longer.
EUR/USD Technical Analysis
From a technical standpoint, EUR/USD remains trapped in a consolidation phase, although the near-term bias appears to favor the downside. The pair is currently hovering around the key 1.1400 support zone. A sustained break below this level could open the door for a deeper pullback toward the 1.1300 region.
On the upside, resistance is initially seen near 1.1450. If buyers manage to push the pair above this barrier, attention would shift to the psychological 1.1500 level, followed by the next major resistance around 1.1575.
At present, a stronger bullish move in EUR/USD would likely require a meaningful change in expectations surrounding Federal Reserve policy or a notable weakening in US economic conditions. With neither scenario appearing likely in the near term, investors continue to favor the US Dollar, supported by its yield advantage and renewed geopolitical concerns stemming from rising US-Iran tensions, which have also helped sustain higher oil prices.
EUR/USD posts modest gains, hovering around the 1.1430 level during Friday’s early Asian trading session.
ECB meeting accounts revealed that policymakers expect inflationary pressures to remain elevated despite markets pricing in nearly three additional rate hikes.
A US official reaffirmed that Washington remains committed to pursuing a diplomatic resolution with Iran.
The EUR/USD pair edges higher to around 1.1430 during Friday’s early Asian session, supported by a weaker US Dollar (USD). The Euro finds support as investors increase expectations for further European Central Bank (ECB) tightening amid persistent inflation concerns and uncertainty surrounding the Middle East conflict.
Minutes from the ECB’s latest meeting released on Thursday showed that policymakers were presented with forecasts indicating inflation could remain above the central bank’s target through next year, even with nearly three additional rate increases. After raising interest rates in June, the ECB is widely expected to deliver two more hikes over the coming year as it seeks to contain inflationary pressures, including those stemming from higher energy costs linked to the Iran conflict.
Market participants have recently strengthened their bets on additional ECB rate hikes amid growing doubts over the prospects for a lasting agreement between the United States and Iran to end the war. These expectations continue to lend support to the common currency.
Investors will remain focused on developments in the US-Iran conflict, as any escalation in tensions could increase demand for safe-haven assets and weigh on EUR/USD. Nevertheless, a US official stated on Thursday that Washington remains committed to the memorandum of understanding with Iran, despite President Donald Trump’s remarks earlier this week that the framework agreement aimed at ending the conflict was “over.”
The US Dollar Index remains under pressure after the FOMC Minutes failed to deliver a more hawkish signal. Still, expectations for a Fed rate hike later this year and renewed tensions between the US and Iran are helping to limit downside momentum.
The US Dollar Index (DXY), which measures the Greenback against a basket of major currencies, remains under mild selling pressure for a second consecutive day. However, the decline has been limited, with the index trading within Wednesday’s range during Thursday’s Asian session and hovering just below the 101.00 level, down roughly 0.1% on the day.
Demand for the US Dollar has softened following the release of the latest FOMC Minutes, which failed to deliver a significantly more hawkish policy signal. The minutes from the June 16–17 meeting showed policymakers remained divided on the future path of interest rates, with many officials suggesting the federal funds rate could finish the year at or slightly below its current level.
Despite this, Federal Reserve officials continued to highlight persistent upside inflation risks, indicating that additional policy tightening may still be necessary to bring inflation back toward the 2% target. Markets continue to price in approximately a 70% probability of a 25-basis-point rate increase in September. At the same time, renewed geopolitical tensions between the US and Iran have provided support for the Greenback by reinforcing safe-haven demand and fueling expectations of higher inflation.
The latest escalation in the Middle East followed fresh US military strikes against Iran in response to attacks on commercial shipping in the Strait of Hormuz. Tehran retaliated with ongoing attacks targeting US military facilities and assets in Bahrain and Kuwait. Further adding to uncertainty, US President Donald Trump stated on Wednesday that the memorandum of understanding intended to ease regional tensions had effectively collapsed. Against this backdrop, traders are reluctant to initiate aggressive bearish positions on the Dollar ahead of the release of US Weekly Jobless Claims data, which could offer fresh direction for the market.
EUR/USD remains on the defensive, struggling to attract meaningful buying interest as escalating tensions involving Iran continue to fuel demand for the safe-haven US Dollar. Meanwhile, the latest surge in crude oil prices has reignited inflation concerns, prompting markets to price in a greater likelihood of further Fed tightening and providing additional support to the Greenback. Investors now await the release of the June FOMC Minutes for fresh clues on the Federal Reserve’s policy outlook and the pair’s next directional move.
The EUR/USD pair manages to hold above the 1.1400 level during Wednesday’s Asian session, though upside momentum remains limited as renewed tensions between the United States and Iran dampen risk appetite. Market participants also prefer to stay on the sidelines ahead of the release of the FOMC Minutes, seeking additional clarity on the Federal Reserve’s future policy direction before taking fresh positions.
Geopolitical concerns intensified after the US launched a fresh round of strikes against Iran on Tuesday in response to reported attacks on three oil tankers transiting the Strait of Hormuz, raising fears that the fragile ceasefire could unravel. The escalation prompted investors to seek safety in the US Dollar, with the resulting risk premium providing support for the Greenback and weighing on the EUR/USD pair.
Adding to the USD’s strength, Washington reportedly revoked a major exemption that had enabled Iran to continue selling oil on global markets. The move fueled a sharp rise in crude oil prices and reignited concerns over energy-driven inflation. As a result, traders increased expectations that the Fed could deliver at least one additional rate hike before year-end, pushing US Treasury yields higher and offering further support to the US currency.
Despite the favorable backdrop, USD bulls remain cautious ahead of the publication of the Minutes from the Fed’s June 16–17 policy meeting later in the day. Investors will closely examine the document for fresh signals regarding the central bank’s monetary policy outlook, which could shape near-term USD sentiment and determine the next directional move for EUR/USD.
The U.S. Dollar Index remains below 101.00 as easing expectations of Fed rate hikes offset concerns over Hormuz-related risks.
The U.S. Dollar Index (DXY) continues to trade sideways on Tuesday, lacking sufficient momentum to break out of its recent range.
Fresh tensions in the Strait of Hormuz provide support for the safe-haven U.S. dollar, helping limit downside pressure.
However, fading expectations of additional Federal Reserve rate hikes keep bullish sentiment in check and restrict further gains in the greenback.
The U.S. Dollar Index (DXY) remained range-bound below 101.00 on Tuesday, extending its consolidation for a third consecutive session as geopolitical risks and monetary policy expectations pulled the dollar in opposite directions.
Renewed tensions between the U.S. and Iran, particularly in the strategically vital Strait of Hormuz, provided support for the safe-haven greenback. Reports of an oil tanker being struck in the waterway and Iran’s efforts to strengthen its control over the strait have raised concerns over the durability of the 60-day ceasefire agreement. The resulting uptick in crude oil prices has revived inflation worries, lending additional support to the U.S. dollar.
However, upside momentum remains limited as expectations for further Federal Reserve tightening continue to fade. Following June’s softer-than-expected Nonfarm Payrolls report, markets scaled back their outlook for Fed rate increases in 2026 from two hikes to between zero and one, reducing support for the dollar.
Adding to the cautious tone, the U.S. ISM Services PMI eased to 54.0 in June from 54.5 previously, meeting forecasts but offering little incentive for fresh USD buying. As a result, traders remain hesitant to extend the dollar’s rebound from the 97.40–97.45 support zone seen earlier this year.
Attention now turns to Wednesday’s FOMC Minutes, which could provide clearer guidance on the Fed’s policy outlook and determine the DXY’s next directional move.
US Dollar: Investor positioning continues to provide solid support into year-end – NBC
According to analysts Stéfane Marion and Kyle Dahms of National Bank of Canada, the US Dollar remains near its 2026 peak, supported by persistent inflation in the United States and a widening interest-rate advantage over other major economies. While these factors are likely to keep the greenback well supported in the near term, the analysts are increasingly cautious about the sustainability of the rally beyond the third quarter.
The dollar has strengthened against all major currencies over the past month as markets reassessed the outlook for US interest rates, reinforcing the currency’s yield advantage. However, NBC argues that expectations for imminent Federal Reserve tightening may be overdone.
June’s labor-market data painted a softer picture than headline sentiment suggests. Nonfarm payrolls increased by just 57,000, missing market expectations, while previous months’ figures were revised lower by a combined 74,000 jobs. Meanwhile, the household survey showed a decline of 507,000 employed workers and a notable drop in full-time employment, pointing to underlying weakness in the labor market.
NBC notes that speculative positioning has become increasingly skewed toward a stronger dollar, indicating that much of the bullish narrative may already be priced in. As a result, the USD could become more vulnerable to weaker inflation readings, further signs of labor-market cooling, or any scaling back of expectations for future Fed rate hikes.
The bank therefore expects the US Dollar to remain supported in the short term, but warns that slowing job growth and crowded market positioning make it difficult to justify extending the recent rally far beyond Q3. This view aligns with the gap between the Federal Reserve’s projections and private-sector forecasts: while roughly half of FOMC members still anticipate higher rates this year, only a small minority of economists expect additional tightening. NBC shares that skepticism, arguing that although inflation remains elevated enough to discourage rate cuts, labor-market conditions are soft enough to allow policymakers to remain patient before considering further hikes.
NBC’s broad USD index forecast reflects this outlook, with the index expected to gradually ease from 120.8 currently to 115.9 by Q2 2027, signaling a moderation rather than a reversal of dollar strength.
Bitcoin showed a modest recovery over the week, finding support around the $60,000 level and signaling a potential stabilization after its recent decline. However, caution remains warranted, as the cryptocurrency has experienced significant downward pressure and market sentiment is still fragile.
Looking ahead, any upward movement is likely to face resistance from sellers until Bitcoin can establish itself firmly above the $65,000 mark. On the downside, a break below the low of the current weekly candle could trigger renewed bearish momentum, increasing the likelihood of a move toward the $50,000 level.
EUR/USD
EUR/USD traded within a relatively narrow range throughout the week, with the 1.14 level continuing to serve as an important support zone for market participants. Sentiment shifted slightly following a weaker-than-expected U.S. Non-Farm Payrolls report, which prompted investors to scale back expectations of further interest rate hikes by the Federal Reserve.
Despite this development, the broader outlook remains uncertain. A break below the previous week’s low could accelerate bearish momentum and pave the way for a decline toward the 1.12 level. On the upside, any recovery attempts should be approached cautiously until the pair can convincingly move above 1.15, ideally supported by a daily close above that threshold.
NZD/USD
NZD/USD posted solid gains for most of the week, although the pair began to lose momentum on Friday, suggesting that bullish sentiment may be fading. If the U.S. dollar strengthens broadly in the coming sessions, the New Zealand dollar could be among the currencies most vulnerable to a reversal.
The pair has remained trapped within a long-standing trading range, while New Zealand’s monetary policy outlook differs from that of several other major economies. The central bank has maintained a relatively less hawkish stance, which could limit the kiwi’s upside potential. Given these factors, bearish opportunities may emerge if further signs of weakness develop. Additionally, Friday’s price action resembles a shooting star candlestick pattern, often viewed as a warning of potential downside pressure, making it a technical signal worth monitoring closely.
USD/CAD
USD/CAD traded largely sideways throughout the week, reflecting a period of consolidation after recent moves. While the pair may appear somewhat stretched in the short term, price action is likely to remain volatile given the close economic relationship between the United States and Canada.
Although the latest U.S. employment data came in weaker than expected, broader fundamentals continue to support the U.S. dollar. At the same time, concerns over the Canadian economy’s performance may limit the Canadian dollar’s strength. As a result, any near-term pullback in USD/CAD could present buying opportunities, particularly if the pair declines toward the key 1.40 support area, where demand may re-emerge.
GBP/USD
GBP/USD delivered a strong performance during the week, advancing above the 1.33 level and testing the 50-week Exponential Moving Average (EMA). A decisive break above this week’s high, near 1.34, could reinforce bullish momentum and pave the way for a move toward the 1.35 area.
The pair has spent an extended period trading within a range, making the recent recovery a relatively natural development. The British pound has also demonstrated greater resilience against the U.S. dollar compared with several other major currencies. Should the U.S. dollar come under renewed selling pressure, sterling could emerge as one of the primary beneficiaries. Conversely, even if the dollar regains strength, the current market structure offers little incentive for a bearish outlook on GBP/USD, as the pair continues to show underlying support and positive momentum.
Silver
Silver experienced considerable volatility throughout the week, with price action remaining choppy and directionless. The $60 level continues to act as a key psychological resistance zone, creating a significant hurdle for any sustained upward movement.
Despite periodic rebounds, the broader technical picture remains cautious following the recent formation of a new swing low. This suggests that rallies may continue to face selling pressure, particularly if bullish momentum begins to fade. From a technical perspective, the 50-week Exponential Moving Average (EMA), currently near $64.36, represents an important resistance area and may serve as the primary upside barrier in the near term. Until silver can break convincingly above this level, the market is likely to remain vulnerable to further downside pressure.
Gold
Gold has shown signs of improvement over the past several weeks, with prices recovering and attempting to build a stronger foundation. The market is now approaching the 50-week Exponential Moving Average (EMA), a key technical level that could determine the next major move. A successful breakout above this resistance may strengthen bullish momentum and open the door for a rally toward the $4,400 level.
On the downside, a decline below the $3,900 support zone would likely weaken the outlook and increase the risk of a deeper correction toward $3,500. Overall, gold appears to be in the process of establishing a long-term bottom, although confirmation is still needed. Traders should continue to monitor the performance of the U.S. dollar, as further dollar weakness could provide additional support for gold prices and enhance the prospects for a sustained recovery.
The Nasdaq 100
The Nasdaq 100 advanced for most of the week, continuing to reflect the market’s underlying strength. However, trading activity was shortened due to the market closure on Friday, which slightly distorts the weekly candlestick. Additionally, Thursday’s session was heavily influenced by the release of the U.S. Non-Farm Payrolls report. While the data came in weaker than expected, the impact does not appear severe enough to significantly alter the broader market outlook.
Looking ahead, the index may enter a period of consolidation following its substantial gains over the past several months. Rather than expecting an immediate continuation of the rally, a sideways trading phase could help absorb recent gains and establish a stronger foundation for future advances. Within this context, short-term pullbacks may present attractive buying opportunities, as the longer-term trend remains constructive and investor sentiment continues to favor equities.
The US Dollar edged lower toward the 100.80 level as traders slightly scaled back expectations for a hawkish Federal Reserve.
The US economy added 57K new jobs in June, falling short of the 110K forecast.
Investors are now turning their attention to the US ISM Services PMI report, scheduled for release on Monday.
The US Dollar Index (DXY), which measures the Greenback against a basket of six major currencies, edged slightly lower to around 100.80 during Friday’s Asian session. The US Dollar faced renewed pressure after traders scaled back expectations for a hawkish Federal Reserve following the release of June’s United States Nonfarm Payrolls (NFP) report on Thursday.
Data from the CME FedWatch Tool showed that the probability of the Fed delivering at least one interest rate hike at the September meeting fell to 53.2%, down from nearly 64% on Wednesday.
Market participants reduced hawkish Fed expectations after the June NFP figures came in well below forecasts. The US economy added 57K jobs during the month, significantly missing the 110K estimate. In addition, May’s payrolls figure was revised lower to 129K from the previously reported 172K. Despite the weaker hiring data, the Unemployment Rate declined to 4.2%, compared with expectations and the prior reading of 4.3%.
Meanwhile, Average Hourly Earnings — a key indicator of wage growth — increased 3.5% year-over-year, matching market expectations and improving from the previous 3.4% reading.
Looking ahead, investors will closely monitor the US ISM Services PMI report for June, due on Monday. The data is expected to be a key driver for the US Dollar, as the services sector represents roughly two-thirds of the US economy.
The US Dollar Index (DXY) edged lower to around 101.20 during Thursday’s early European trading session. Despite the pullback, the near-term outlook remains constructive, supported by bullish momentum signals from the RSI.
From a technical perspective, 101.80 serves as the immediate resistance level. A decisive break above this barrier could reinforce the bullish bias, while initial support is seen at 101.05, the first downside target should selling pressure intensify.
The US Dollar Index (DXY), which measures the value of the US Dollar against a basket of six major currencies, traded around 101.20 during Thursday’s early European session. The greenback softened as investors adopted a cautious stance ahead of the release of the closely watched June US employment report, the key macroeconomic event on Thursday’s calendar.
Economists expect the Nonfarm Payrolls (NFP) report to show that the US economy added 110,000 jobs in June, while the unemployment rate is forecast to remain unchanged at 4.3%. A weaker-than-anticipated labor market reading could weigh on the US Dollar and increase expectations for Federal Reserve policy easing.
However, the downside may be limited if the data surprises to the upside. According to Akihiko Yokoo, Senior Analyst at Mitsubishi UFJ Bank, stronger-than-expected payroll figures could provide fresh support for the greenback and trigger a renewed upward move in the currency. He noted that a positive labor market surprise could encourage a rebound in the US Dollar as market participants reassess the outlook for US interest rates.
Technical Analysis
From a technical standpoint, the US Dollar Index (DXY) maintains a constructive near-term outlook. On the daily chart, the index continues to trade above both its 20-day Bollinger Band midpoint and the 100-day moving average, signaling that the broader bullish trend remains intact. Meanwhile, the 14-day Relative Strength Index (RSI) is hovering around 65, indicating solid upward momentum without yet entering overbought territory.
On the upside, the first key resistance level is the June 24 high at 101.80. A sustained break above this barrier could open the door for a move toward the upper Bollinger Band near 102.00, where bullish momentum may begin to encounter profit-taking pressure.
On the downside, initial support is located at the June 30 low of 101.05. Further weakness could expose the Bollinger Band midpoint around 100.65, followed by stronger support near the lower Bollinger Band at 99.25 and the 100-day moving average at 99.20. A deeper decline toward this support cluster would be required to challenge the current bullish structure and shift the near-term outlook to a more neutral stance.
We expect ECB speakers at Sintra to broadly reinforce market expectations of another rate hike this year, following President Lagarde’s relatively balanced opening remarks. Meanwhile, the US dollar has continued to give back recent gains, with markets now turning their attention to upcoming data releases and Fed-related commentary, particularly Warsh’s speech at Sintra, which is expected to carry a hawkish tone. USD/JPY remains in the intervention zone, keeping Japanese authorities on alert.
USD: Losing Momentum Ahead of Key Data and Warsh
The dollar has softened against most G10 currencies, largely driven by improving risk sentiment as equities recover. Sentiment has also been supported by reports of renewed US–Iran negotiations despite recent geopolitical tensions. However, this risk-positive environment is weighing on traditional commodity-linked currencies such as the AUD, CAD, and NOK, as well as the yen. Even so, the recent decline in oil prices appears overstretched, and we still expect AUD and NOK to perform better into the summer, supported by carry and a more constructive energy outlook.
Attention now shifts to US data. We expect consumer confidence to come in above consensus at 97.5 versus 94.5, consistent with resilient US consumption. JOLTS job openings are forecast to edge lower to 7.25m (consensus 7.3m), which would still be consistent with a broadly healthy labor market given the vacancies-to-unemployment ratio remains above 1.0.
Overall, today’s data should be modestly supportive or neutral for the dollar. However, bullish momentum has clearly faded, and improved risk appetite limits upside potential for now, with markets instead looking to Warsh’s Sintra remarks and upcoming jobs data for clearer direction.
EUR: Sintra Likely to Be Uneventful for the Euro
Lagarde’s opening remarks suggested no meaningful shift in ECB communication strategy, reinforcing the view that Sintra is unlikely to trigger a repricing of policy expectations. She acknowledged a less urgent policy backdrop compared to 2022–2023 while noting continued economic resilience.
Nothing in this messaging is likely to materially alter expectations for another rate hike. We expect other ECB speakers to broadly support this view, even as recent sentiment data points to easing inflation pressures.
Upcoming eurozone CPI releases remain in focus. Spain surprised to the upside at 3.2%, France is expected to moderate to 2.0%, and Germany is forecast to hold steady at 2.6%. Overall, these figures are unlikely to significantly shift EUR direction.
We see downside risks for EUR/USD ahead of US data and Warsh’s speech, but continue to expect stabilization around or slightly above 1.140 rather than a retest of recent lows.
JPY: Approaching Intervention Territory
USD/JPY continues to trend higher, raising the risk of Japanese FX intervention. Authorities previously intervened heavily near 160, spending roughly $70bn when the pair moved above that level. The 162 area is widely viewed as a potential next line in the sand.
However, policymakers may prefer to wait for thinner liquidity conditions or key event risks before acting, including US holidays and upcoming macro catalysts such as Warsh’s speech and the US jobs report.
There is also a possibility that intervention is delayed toward mid-July, following seasonal patterns seen last year. Still, intervention would likely only slow the trend rather than reverse it, unless accompanied by a shift in BoJ policy or a broader turn in the US dollar cycle later in the year.
Gold fell 12% in June, prompting questions over whether further downside is likely, while USD/JPY remains in focus amid intervention concerns.
Gold has rebounded above the 4,000 level but is still set to record a 12% monthly loss in June—its steepest decline since October 2008. The drop reflects a broader market shift away from geopolitical risk premiums and back toward concerns over elevated U.S. interest rates.
The metal is also heading for its first quarterly loss since 2024 and its largest three-month drop since Q2 2013.
The selloff has been driven by rising expectations that the Federal Reserve will continue tightening policy. After a hawkish FOMC meeting and persistently high Core PCE inflation at 3.4%, markets are now pricing in more than a 60% chance of a 25-basis-point rate hike in September, with up to three hikes still seen as possible this year.
These expectations have pushed the U.S. dollar to a 13-month high, while higher real yields have increased the opportunity cost of holding non-yielding assets like gold.
Together, a stronger dollar, rising real yields, and a hawkish Fed stance continue to pressure gold prices.
Market attention now shifts to Fed Chair Kevin Walsh’s remarks at the ECB Sintra Forum and Thursday’s U.S. non-farm payrolls report, which could offer further clues on the rate outlook and gold’s direction.
For a sustained recovery, gold would likely need lower real yields, a weaker dollar, or a reversal in hawkish Fed expectations—none of which currently appear imminent.
Gold Forecast – Technical Analysis
Gold has broken down from its symmetrical triangle formation and slipped below the 200-day simple moving average, hitting a low of 3,942—its weakest level since November.
The 50-day SMA has now crossed beneath the 200-day SMA, confirming a bearish “death cross” signal. Alongside an RSI reading below 50, technical indicators continue to point toward downside momentum.
On the downside, sellers may target 3,930—the November low—followed by 3,800. A break beneath that level could open the door toward the psychological support zone around 3,500.
On the upside, any recovery would first need to reclaim 4,100, which aligns with this week’s high and the March low. Beyond that, resistance is seen near a declining trendline around 4,300, followed by horizontal resistance at 4,350. A sustained move above this zone would bring the 200-day SMA near 4,500 back into focus.
USD/JPY
USD/JPY has surged to a 40-year high above 162, heightening concerns that Japanese authorities may intervene to support the yen.
The currency has weakened to levels last seen in 1986, increasing speculation that Tokyo could step into the market in the near term, even as the U.S. dollar has eased slightly from its 13-month peak.
The yen is down 2% in the second quarter, marking its fourth consecutive quarterly decline and the longest losing streak in four years, as the wide interest rate gap between the U.S. and Japan continues to weigh on the currency.
Finance Minister Satsuki Katayama has reiterated that authorities are prepared to act at any time if necessary. Historically, interventions have often occurred during periods of thin liquidity, and with a holiday-shortened trading week, conditions could be conducive to action.
The key market debate is increasingly shifting from whether intervention will occur to when it might happen. However, unless any intervention is supported by a narrowing U.S.-Japan yield differential, its impact is likely to be short-lived.
Previous interventions in late February and early May briefly strengthened the yen, but USD/JPY resumed its uptrend as markets quickly re-priced U.S. rate expectations. In that context, intervention has often been faded, as underlying macro forces remain unchanged.
The carry trade continues to be supported by the persistent yield advantage in the U.S., keeping upward pressure on USD/JPY.
Recent hawkish Federal Reserve signals and sticky Core PCE inflation at 3.4%, a three-year high, have led markets to price in around a 60% chance of a 25-basis-point rate hike in September, with expectations of up to three hikes this year.
Looking ahead, attention turns to Federal Reserve Chair Kevin Walsh’s remarks at the ECB Sintra Forum, alongside Thursday’s U.S. non-farm payrolls report. Ahead of that, U.S. consumer confidence and JOLTS job openings data will also be closely watched for further clues on the interest rate outlook.
USD/JPY Forecast – Technical Analysis
USD/JPY has broken above the upper boundary of its rising wedge pattern, extending gains to a new 40-year high at 162.40 and effectively invalidating the prior bearish reversal setup.
Momentum indicators show the RSI in overbought territory across multiple timeframes, suggesting the pair may pause for consolidation before attempting further upside.
On the bullish side, buyers are now eyeing a move toward 165, with the longer-term projection extending to 170 if momentum persists.
On the downside, initial support is seen at 160.20, followed by the key psychological level at 160.00. A break below that zone would expose the 50-day SMA near 159.50, with deeper support at 157.90, where the rising trendline aligns with horizontal support.
Gold prices remain steady near $4,015 during Wednesday’s early Asian trading session as investors monitor ongoing US-Iran negotiations. Market sentiment was influenced after US envoy Steve Witkoff and Jared Kushner met with Qatar’s prime minister on Tuesday to discuss diplomatic efforts between Washington and Tehran.
Traders are also turning their attention to key US labor market data due later this week, with the ADP Employment Change report and the closely watched Nonfarm Payrolls (NFP) release expected to provide fresh clues on the Federal Reserve’s policy outlook and the near-term direction of gold prices.
Gold prices (XAU/USD) remained largely unchanged near the $4,015 level during Wednesday’s early Asian session as investors assessed the outlook for potential US-Iran negotiations in Doha. Market participants remained cautious after conflicting statements from Washington and Tehran highlighted the uncertain nature of the temporary peace agreement reached earlier this month.
According to CNBC, US President Donald Trump stated on Tuesday that discussions between the two nations would take place in Qatar, adding that Iran had requested a meeting following the recent exchange of US airstrikes. However, an Iranian Foreign Ministry spokesperson reportedly rejected claims that talks were scheduled in the coming days.
US representatives Jared Kushner and Steve Witkoff arrived in Doha on Tuesday, where they were expected to meet with Qatar’s prime minister to discuss regional developments and ongoing diplomatic efforts involving Iran. Despite these engagements, no direct high-level talks between US and Iranian officials have been confirmed.
Progress toward a lasting diplomatic resolution could enhance demand for Gold as investors seek safe-haven assets amid geopolitical developments. Conversely, continued uncertainty surrounding the negotiations may fuel concerns about inflation and monetary policy, potentially increasing expectations for tighter interest rates. While Gold is widely viewed as a hedge against inflation, its lack of yield can make it less attractive in a higher-rate environment.
Attention now shifts to key US labor market releases, including the ADP employment report on Wednesday and the Nonfarm Payrolls (NFP) report on Thursday. Stronger-than-expected employment figures could reinforce expectations that the Federal Reserve will keep interest rates elevated for longer, supporting the US Dollar and potentially limiting upside momentum in Gold prices.
AUD/USD comes under renewed selling pressure on Wednesday as a combination of factors continues to support the US Dollar. Ongoing uncertainty surrounding Iran and growing expectations of further Fed rate hikes remain key tailwinds for the greenback. Meanwhile, the pair shows little reaction to China’s RatingDog Manufacturing PMI, which came in broadly in line with expectations.
AUD/USD failed to build on Tuesday’s rebound from the 0.6865 area, its lowest level in three months, and came under renewed selling pressure during Wednesday’s Asian session. The pair slipped back below 0.6900 and showed little reaction to China’s latest private manufacturing PMI data.
China’s RatingDog Manufacturing PMI eased to 51.7 in June from 52.2 in May, reinforcing concerns about slowing economic momentum. Combined with Tuesday’s official PMI figures, which highlighted weak domestic demand and subdued consumer spending, the data weighed on the Australian Dollar, which is often viewed as a proxy for China’s economic health. A modest recovery in the US Dollar further added to the pair’s downside pressure.
The Greenback continued to benefit from its safe-haven appeal amid uncertainty surrounding US-Iran negotiations and growing expectations that the Federal Reserve may need to raise interest rates further. Although US officials arrived in Qatar to discuss the implementation of a preliminary peace agreement, Iran’s reluctance to engage with US envoys has cast doubt on the prospects for a lasting resolution, keeping geopolitical risks elevated.
At the same time, stronger-than-expected US labor market data supported the USD. The JOLTS report showed job openings climbed to a two-year high of 7.594 million in May, underscoring continued labor market resilience. Combined with concerns that renewed tensions in the Middle East could reignite inflationary pressures, the data strengthened market expectations for additional Fed tightening.
Investors now await remarks from Fed Chairman Kevin Warsh at the ECB Forum in Sintra, alongside key US data releases including the ADP employment report and ISM Manufacturing PMI. Attention will then turn to Thursday’s closely watched Nonfarm Payrolls report, which could provide the next major catalyst for AUD/USD.
USD/JPY rallies to a fresh four-decade peak on Tuesday amid broad Yen weakness.
The widening US-Japan yield gap continues to weigh on the JPY and underpin the pair.
Renewed demand for the US Dollar, fueled by Iran-related tensions and expectations of further Fed tightening, adds to the upside momentum.
The USD/JPY pair extends its powerful rally above the key 162.00 mark, reaching a new 40-year high during Tuesday’s Asian trading session. Nonetheless, concerns over potential intervention from Japanese authorities continue to limit additional gains.
Japanese Finance Minister Satsuki Katayama and US Treasury Secretary Scott Bessent recently agreed to coordinate on currency matters if required. In addition, Chief Cabinet Secretary Minoru Kihara reiterated last week that the government stands ready to respond to excessive foreign-exchange fluctuations. At the same time, traders remain cautious about adding fresh bearish positions on the Japanese Yen (JPY) following the Bank of Japan’s (BoJ) increasingly hawkish tone.
Minutes from the BoJ’s June policy meeting revealed that officials discussed rising inflation risks, with some members advocating a faster pace of rate hikes toward neutral levels. Growing evidence of stronger inflationary pressures in Japan further supports expectations for additional policy normalization. Even so, Japanese interest rates remain significantly below those in the US, preserving the attractiveness of carry trades that continue to weigh on the Yen.
On the other hand, uncertainty surrounding US-Iran diplomacy and expectations of further Federal Reserve (Fed) tightening are helping the US Dollar (USD) stabilize after its recent retreat from a 13-month peak, providing additional support for USD/JPY. While US President Donald Trump stated that Iran had sought talks with Washington in Qatar, Iranian officials denied that any negotiations with the US are planned in the near future.
Gold started the previous week with a noticeable gap lower, highlighting the market’s ongoing uncertainty and elevated volatility. Price fluctuations are likely to remain significant in the near term as traders continue to react to various external factors.
The $4,000 level remains a key support zone. As long as gold stays above this threshold, short-term pullbacks could present buying opportunities. However, a decisive break below $4,000 may trigger a deeper correction, potentially sending prices toward the $3,500 area.
On the upside, a move above the 50-week EMA would strengthen the bullish outlook and could pave the way for a rally toward $4,600. That said, gold continues to be influenced by a range of macroeconomic and geopolitical developments, making its direction less predictable.
For now, the most likely scenario may be a period of consolidation, with prices trading within a broad range while the market searches for its next major catalyst.
EUR/CHF
The euro declined notably against the Swiss franc over the past week, yet the 0.92 level continues to serve as an important support area. A rebound from this zone would not be surprising, as the pair appears to be searching for enough momentum to resume a move higher, potentially targeting a break above 0.93.
In the near term, buying on a bounce remains an attractive strategy, especially if support at 0.92 continues to hold. However, if the pair falls decisively below this level, downside pressure could intensify, opening the door for a move toward 0.91.
Overall, EUR/CHF may remain range-bound in the short run, with traders closely watching whether support at 0.92 can sustain another upward attempt.
USD/CHF
The U.S. dollar posted gains against the Swiss franc during the week, but a significant portion of those advances was later erased. This price action suggests that the pair may be due for a corrective pullback after its recent rally.
The 0.80 level stands out as a key area to watch. A retreat toward this support zone could provide a potential buying opportunity if the market shows signs of stabilization and renewed bullish momentum. Traders may look for a bounce from this level as confirmation of a possible continuation higher.
On the upside, a breakout above the high of the current weekly candlestick would strengthen the bullish outlook and could lead to a test of the 0.82 level.
Overall, the short-term bias remains cautiously positive, although a pullback toward support may be needed before the next leg higher can develop.
USD/MXN
The U.S. dollar advanced against the Mexican peso during the week, but the 17.50 level once again proved to be a strong area of resistance. The subsequent pullback from those highs is not particularly surprising and suggests that the pair may continue trading within its established consolidation range.
Looking ahead, USD/MXN is likely to remain volatile and range-bound as traders assess the next directional catalyst. While occasional swings above or below recent levels are possible, the broader price action continues to favor consolidation rather than the start of a sustained trend.
Even if the U.S. dollar manages to break decisively higher against the Mexican peso, the move may not offer an attractive trading opportunity given the pair’s tendency to remain choppy and unpredictable. For now, traders may be better served by focusing on short-term range dynamics rather than chasing a potential breakout.
Nasdaq 100
The Nasdaq 100 moved lower throughout the week, but the broader picture suggests that the index is simply consolidating after an extended rally. Recent weakness appears to be a healthy pause as the market works off some of the excess optimism and overbought conditions that developed earlier.
Despite the pullback, the longer-term outlook remains constructive. Buyers are likely to re-emerge over time, although current market conditions do not necessarily justify taking large positions. The index may continue to trade within a range while investors assess economic data, corporate earnings, and monetary policy expectations.
Short-term declines could present attractive buying opportunities, particularly if prices approach the 28,500 level, which may act as a significant support area. For now, the focus remains on identifying value during pullbacks rather than betting against the broader uptrend.
Overall, the bias remains cautiously bullish, with dip-buying favored over short-selling.
GBP/USD
The British pound posted a modest recovery against the U.S. dollar during the week, with the 1.32 level continuing to establish itself as an important support zone. The market’s ability to hold above this area suggests that buyers remain active and willing to defend the pair on pullbacks.
On the upside, the 1.33 level remains a key resistance barrier. A successful move above this threshold would strengthen bullish sentiment and could pave the way for a further advance toward the 1.35 level.
In the near term, GBP/USD is likely to remain range-bound between support at 1.32 and resistance at 1.33 as traders wait for a stronger catalyst. However, a breakout above the upper boundary of this range could signal the start of a more sustained upward move.
Overall, the outlook remains cautiously positive, with the potential for additional gains if buyers can push the pair decisively above 1.33.
EUR/USD
The euro experienced a notable decline against the U.S. dollar during the week but managed to recover and return to the 1.14 area. This level has served as a major short-term support zone for much of the past year, making current price action particularly important for determining the pair’s next direction.
After briefly breaking below 1.14, the market has rebounded to retest this key level. Traders will be watching closely to see whether it acts as resistance following the breakdown or if buyers can regain control and push the pair higher.
A sustained move above 1.1450 would improve the bullish outlook and could encourage additional buying interest in the euro. However, there is also a strong possibility that EUR/USD remains anchored around the 1.14 level while the market searches for a clearer catalyst.
Ultimately, the pair’s direction may depend less on euro-specific factors and more on the broader performance of the U.S. dollar. As a result, developments in U.S. economic data, interest rate expectations, and overall dollar sentiment are likely to play a decisive role in shaping EUR/USD’s next major move.
USD/JPY
The U.S. dollar continued its gradual advance against the Japanese yen during the week, maintaining the bullish momentum established by recent breakouts. As a result, USD/JPY remains one of the key currency pairs to watch in the current market environment.
The 162.00 level represents an important resistance zone. A decisive break above this threshold could signal the continuation of the broader uptrend and open the door to further gains for the U.S. dollar.
While Japanese authorities have recently intervened in the currency market to support the yen, the underlying fundamentals still appear favorable for USD/JPY. In particular, the significant interest rate differential between the United States and Japan continues to attract investors toward the pair.
Short-term pullbacks may therefore present buying opportunities, especially if prices retrace toward the key 160.00 level, which is likely to act as an important support area. As long as this zone holds, the overall bullish bias remains intact.
Overall, the outlook continues to favor the upside, with traders closely monitoring whether USD/JPY can break through 162.00 and extend its recent rally.
USD/CAD weakens as the oil-sensitive Canadian Dollar draws support from higher crude prices.
Oil prices advanced after an attack on a vessel near Oman disrupted UN evacuations through the Strait of Hormuz, reviving concerns over global energy supplies.
Meanwhile, the US Dollar could remain supported by rising expectations of a Federal Reserve rate hike, which continue to bolster demand for the Greenback.
USD/CAD extends its decline for a second straight session, hovering near 1.4200 during Friday’s Asian trading hours. The pair comes under pressure as the commodity-linked Canadian Dollar gains support from stronger crude oil prices. Canada, one of the world’s largest net oil exporters, relies heavily on petroleum exports as a key source of foreign exchange revenue.
Oil prices climbed after a suspected projectile strike on a cargo vessel near Oman forced the United Nations to suspend evacuation operations through the strategically important Strait of Hormuz, reigniting concerns over global energy supply disruptions.
Geopolitical tensions escalated further late Thursday after two US officials claimed Iranian forces had opened fire on the vessel while it was transiting the strait. Iranian authorities later warned that ships operating outside designated Hormuz routes could no longer be assured safe passage.
However, losses in USD/CAD may remain capped as the US Dollar continues to draw support from increasing expectations of another Federal Reserve rate hike. CME FedWatch data currently shows markets pricing in a 63.4% chance of a rate increase at the Fed’s September 15–16 meeting.
The hawkish outlook has been reinforced by stronger inflation readings. The headline Personal Consumption Expenditures (PCE) Price Index accelerated to 4.1% year-over-year in May from 3.3% previously, marking the first time in three years that the gauge has risen above 4.0%. The surge was largely driven by higher energy costs linked to Middle East tensions, keeping expectations for additional tightening alive.
Meanwhile, the Fed’s preferred inflation measure, the core PCE index, edged higher to 3.4% annually from 3.3%, its strongest pace since October 2023, underscoring persistent inflation pressures that continue to underpin the Greenback.
The United States Dollar Index remains supported as expectations for a Federal Reserve rate hike continue to build. Markets are now pricing in a 63.4% chance of a rate increase in September, according to the CME Group FedWatch tool. Meanwhile, US PCE inflation accelerated to 4.1% in May amid oil supply concerns linked to tensions in the Middle East, reinforcing expectations that the Fed could keep tightening policy.
The US Dollar Index (DXY), which tracks the performance of the US Dollar (USD) against a basket of six major currencies, recovers some of its previous session losses and trades near 101.50 during Friday’s Asian session. Investors now await the release of the Michigan Consumer Sentiment Index later in the day for fresh market direction.
The Greenback remains supported by increasing expectations that the Federal Reserve (Fed) could raise interest rates again. According to the CME FedWatch tool, markets are currently pricing in a 63.4% chance of a rate hike at the Fed’s September 15–16 meeting.
The hawkish outlook follows stronger inflation data, with the headline Personal Consumption Expenditures (PCE) Price Index rising to 4.1% year-over-year in May from 3.3% previously. The jump marks the first time in three years that headline PCE inflation has moved above the 4.0% threshold, largely driven by higher energy prices linked to tensions in the Middle East, keeping the possibility of additional Fed tightening alive.
Meanwhile, the core PCE Price Index, the Fed’s preferred measure of underlying inflation, climbed to 3.4% annually from 3.3% in April, marking the strongest core inflation reading since October 2023.
BMO Chief US Economist Scott Anderson stated that elevated PCE inflation is likely to keep the Fed cautious, with further rate hikes remaining a possibility. He added that persistent service-sector inflation may not ease quickly even if energy prices decline, suggesting continued policy debates between Fed hawks and doves.
The Australian Dollar remains under pressure versus the US Dollar as expectations for further Federal Reserve rate hikes stay firm.
Investors are now focusing on the US PCE Inflation data for fresh signals regarding the Fed’s future monetary policy direction.
Meanwhile, Australia’s labor market showed resilience, with employers adding 40.3K new jobs in May, surpassing market forecasts of 25K.
The AUD/USD pair edges slightly lower to around 0.6890 during Thursday’s European session as the Australian Dollar remains under mild pressure against the US Dollar. The Greenback continues to stay supported by expectations that the Federal Reserve’s next policy move could be another rate hike.
The US Dollar Index (DXY), which measures the USD against six major currencies, trades near 101.55 at the time of writing, remaining close to Wednesday’s more-than-one-year peak of 101.80.
Data from the CME FedWatch Tool shows markets are pricing in nearly an 82% probability of at least one Fed rate increase this year.
Traders are now turning their attention to the US Personal Consumption Expenditures (PCE) Price Index for May, scheduled for release at 12:30 GMT, as the report could provide fresh insight into the Fed’s future interest-rate path.
Meanwhile, Australia’s May labor market figures exceeded expectations. The Australian Bureau of Statistics reported that employers added 40.3K jobs during the month, well above forecasts of 25K. This follows April’s revised decline of 40.7K jobs, compared with the previously reported 18.6K drop. The unemployment rate also eased to 4.4% from 4.5%, matching market expectations.
Technical Analysis
AUD/USD trades near 0.6890 and continues to show a bearish short-term outlook, with the pair remaining below the 20-day Exponential Moving Average (EMA) at 0.7025. Price action has continued to drift away from the key trend indicator, while the Relative Strength Index (RSI) stands at 26.6 in oversold territory, suggesting that bearish momentum remains strong even though the recent decline may be overstretched.
On the upside, the first major resistance is seen around the 20-day EMA near 0.7025. A recovery above this level would help reduce immediate downside pressure.
On the downside, key support is located at the March 30 low of 0.6833. A break beneath this area could open the door for a deeper decline toward the January 7 high near 0.6766.
After the latest price action, markets are nearing a key inflection point.
The U.S. dollar is pressing against a significant resistance area, while precious metals are holding just above important support levels. The way today’s session closes could offer the confirmation traders have been waiting for and help define the next major directional move.
U.S. Dollar Index (DX.F)
As noted in the prior session:
“(…) The dollar remains confined within a relatively tight range, with recently reclaimed March highs acting as support, while a major resistance zone caps upside near the 38.2% Fibonacci retracement, the upper edge of the rising channel, and a bearish gap from late May 2025 (100.75–100.95). (…)”
From a current standpoint, buyers have successfully defended the reclaimed March highs, giving the dollar enough momentum to retest the highlighted resistance cluster.
At present, the index is trading above both the 38.2% Fibonacci retracement and the prior bearish gap from last year. However, the upper boundary of the rising channel remains a key barrier.
This level is important because today’s close could prove decisive not only for the dollar but also for the broader metals complex.
A daily close above the channel resistance would signal a potential breakout, opening the path toward the next resistance zone around 101.39–101.59, where the 127.2% Fibonacci extension aligns with the May 2025 highs. Such a development would likely weigh on precious metals.
Conversely, another failed breakout—similar to Friday’s rejection—could push the dollar back toward the March highs, offering relief to metals and easing downside pressure.
In short, today’s close may be one of the most consequential of the week.
Platinum (PL.F)
On the daily chart, one clear observation stands out.
Although platinum has not yet registered a daily close below the key 1641 level, buyers were unable to hold the June low—a technical signal that raises doubts about their commitment to sustaining higher prices.
The current low is now positioned within an important support zone, formed by two bullish gaps from late November, the lower boundary of the orange channel, and the 127.2% Fibonacci extension.
Put differently, support is still present.
However, support by itself is not sufficient.
If buyers fail to reclaim 1665 by today’s close—in effect losing the bullish gap from June 12—a move toward the 1600 area becomes increasingly probable, particularly if the U.S. dollar maintains upward momentum, consistent with Friday’s bearish scenario.
On the other hand, the first meaningful sign of recovery would be a daily close back above 1707, which would also reinforce the earlier invalidation of the break below the March low.
Palladium (PA.F)
To frame today’s session, it is useful to revisit yesterday’s outlook:
“(…) Palladium remains below the previously broken lower boundary of the orange consolidation. As long as price holds below 1305, a further decline toward the 1234 area cannot be ruled out. (…)”
From today’s perspective, palladium has largely followed that bearish roadmap, with the downside target now reached. Price is currently trading beneath the lower boundary of the June 12 bullish gap.
This is an unfavorable development for buyers.
The reason is straightforward: a sustained break below that gap threatens the validity of the previously discussed double-bottom structure.
At this stage, bulls need to act quickly to reclaim the gap. If they fail to do so, the market is likely to shift its focus toward the possibility of another downside extension.
Copper (HG.F)
Copper (HG.F) moved in line with yesterday’s technical expectations. As previously noted:
“(…) As long as Thursday’s price gap remains unfilled, the bearish outlook for Friday stays in place:
“(…) with the downside gap from Thursday still acting as overhead resistance, a retest of today’s low and a possible move toward the next support area around 617–619 remains on the table.”
The failed attempt to break back into the lower edge of Thursday’s bearish gap sparked renewed selling pressure, and price ultimately reached the projected downside target (well done to those who positioned for the move).
From here, the setup becomes more nuanced.
Copper has now entered a key support region defined by prior highs from February and April, along with the May 20 low. This zone previously stabilized price action in May and could again act as a base for buyers to step in.
However, given the strength and momentum of today’s bearish candle, any recovery may initially be limited, with a move toward the 38.2% Fibonacci retracement near 611 looking more likely than a full bullish reversal at this stage.
Today’s Takeaway
Dollar (DX.F)
Focus on the upper boundary of the rising channel
A daily close above it would open the path toward 101.39–101.59
Rejection would likely lead to a retest of the March highs
Today’s close is a key confirmation point
Platinum (PL.F)
Key level to watch: 1665
A close below this support keeps bearish pressure in place
Next major support lies near 1600
Bullish momentum only improves on a move back above 1707
Palladium (PA.F)
Trading below the June 12 bullish gap at 1249 raises the risk of further downside and a retest of recent lows
A recovery back above this level would weaken the bearish setup
Copper (HG.F)
Currently testing the 612.85–615 support zone
Next key level below is 611
A move back above 627.50 would invalidate today’s bearish breakdown
Stay disciplined, respect key levels, and let confirmation guide positioning.
The US Dollar Index (DXY) advanced to a fresh 13-month high of 101.45 on Wednesday, supported by strong domestic economic data and a complex geopolitical backdrop that continued to underpin demand for the Greenback. Further boosting sentiment, the US S&P Global Composite PMI rose to 52.2, surpassing May’s 51.5 reading and indicating that business activity in the United States remained on a solid expansionary path.
The US Dollar Index (DXY), which tracks the US Dollar’s performance against a basket of six major currencies, remained firmly supported for a third straight session, trading near a fresh 13-month high of 101.45 during Wednesday’s Asian trading hours.
The Greenback continued to draw strength from a combination of solid US economic fundamentals and an evolving geopolitical environment. Market participants weighed conflicting developments surrounding a potential diplomatic opening between the United States and Iran. While Donald Trump claimed that Tehran had fully agreed to allow nuclear inspections, Iranian Foreign Minister Abbas Araghchi cautioned that meaningful nuclear negotiations have yet to commence.
Geopolitical tensions remained elevated after Iran’s lead negotiator emphasized that the strategic Strait of Hormuz would not return to its pre-conflict status and would remain under Iranian control. At the same time, diplomatic efforts elsewhere appeared constructive, with Washington hosting a new round of discussions between Israel and Lebanon aimed at securing a ceasefire involving the Iran-backed Hezbollah.
On the economic front, upbeat US data reinforced the narrative of American economic resilience. The preliminary June S&P Global Composite PMI rose to 52.2, exceeding May’s 51.5 reading and signaling continued expansion in overall business activity.
The manufacturing sector remained particularly strong, with the output index climbing to 55.7 from 55.1, outperforming expectations of 54.8. Meanwhile, the Services PMI improved to 51.3 from 50.7, slightly above the market forecast of 51.0, highlighting persistent strength in service-sector demand. Investors now turn their attention to the May Personal Consumption Expenditures (PCE) Price Index, due on Thursday, for further clues on inflation trends.
According to the CME FedWatch Tool, expectations for a more hawkish stance from the Federal Reserve have strengthened considerably. Markets are currently pricing in an 86.1% probability of a rate hike in December, up sharply from 61% prior to last week’s FOMC meeting.
United States Dollar Index remains close to 13-month highs
The United States Dollar Index stays near a 13-month peak around 101.13, supported by hawkish expectations surrounding the Federal Reserve policy outlook. Meanwhile, US Vice President JD Vance stated that negotiations have achieved “great progress,” despite lingering tensions behind the scenes.
The United States Dollar Index (DXY), which tracks the US Dollar against six major currencies, traded steadily near the 101.00 mark during Tuesday’s Asian session after posting modest gains in the previous session.
The index continues to hover close to its 13-month high of 101.13, reached on June 19, as markets maintain a hawkish view on the Federal Reserve policy outlook. The Fed kept interest rates unchanged at 3.50%–3.75% during its June meeting.
Still, updated economic forecasts and remarks from Kevin Warsh, who chaired his first Fed meeting, were viewed as more hawkish than expected. Following the announcement, futures markets fully priced in a 25-basis-point rate hike for September, while also assigning a small probability to a potential increase as early as next month.
Despite the Dollar’s resilience, easing geopolitical tensions may limit further upside. Ongoing peace discussions between the US and Iran have improved market sentiment and reduced inflation concerns. According to CNBC, US Vice President JD Vance said negotiations had made “great progress,” although some tensions remain unresolved.
On Monday, Vance also stated that Iran had agreed to allow inspectors from the International Atomic Energy Agency back into the country. Iranian Foreign Minister Abbas Araghchi echoed the positive tone, noting that the Switzerland talks had produced “major progress.”
Gold holds steady near $4,200 as US–Iran peace progress offset by Fed hawkish stance
Gold prices remain flat near $4,190 during early Asian trading on Tuesday. Progress in US–Iran peace negotiations may pressure the precious metal, while expectations of a Fed rate hike later this year grow after the new Fed Chair struck a hawkish tone.
Gold prices remained steady near $4,190 during Tuesday’s early Asian session as traders monitored ongoing developments surrounding the US–Iran peace negotiations.
US Vice President JD Vance said talks between Washington and Tehran had made “great progress,” despite recent tensions. He noted that negotiations in Bürgenstock were continuing and that Iran had agreed to allow inspectors from the International Atomic Energy Agency back into the country.
However, discussions became strained after Iran announced the closure of the Strait of Hormuz in response to Israeli strikes on Lebanon, arguing the attacks violated the ceasefire agreement.
According to Saxo Bank analyst Ole Hansen, energy prices remain a major short-term driver for precious metals. He added that the uneven progress in US–Iran talks could pressure oil prices while supporting demand for gold.
Meanwhile, expectations for tighter US monetary policy also weighed on bullion. Markets increasingly anticipate a Federal Reserve rate hike later this year after new Fed Chair Kevin Warsh adopted a hawkish stance on inflation during his first policy meeting. Higher interest rates tend to reduce gold’s appeal since the metal does not offer yields.
Traders are now pricing in nearly an 89% probability of a Fed rate hike in December, up sharply from 61% before last week’s FOMC meeting, according to the CME FedWatch Tool.
You begin the day with a clear plan, but one trade goes wrong, then another. Before long, you’re down $1,500 on a $2,000 drawdown, and a familiar thought appears:
“Just one big trade to recover everything.”
That thought is often what destroys accounts.
When you’re in a deep drawdown, survival—not heroics—is the priority. If buying power remains, opportunity still exists. But once frustration dictates position size, trading turns into gambling.
The worst mistake is increasing size after losses
After a significant loss, the instinct is to recover quickly.
You want to erase the damage and return to breakeven as fast as possible. But that urgency is precisely what leads to account failure.
In recovery mode, the correct response is the opposite: reduce size.
If you’re already down heavily, the focus should shift from profit to control. Trading a single micro contract may feel insignificant, but it helps remove emotional pressure and restore discipline. Small, consistent trades rebuild confidence more reliably than aggressive recovery attempts.
Your real risk is the drawdown, not the account size
A $50,000 prop account can be misleading. The real constraint is often the drawdown limit—commonly around $2,000.
That figure defines your actual risk capacity.
A practical guideline is to risk only 5%–10% of the drawdown per trade. On a $2,000 limit, that equates to roughly $100–$200 risk per trade.
This ensures that a single mistake does not end the account. When already in drawdown, risk should usually be even smaller.
Use structured limits to prevent emotional trading
A useful safeguard is a two-trade rule: after two stopped-out trades, stop for the day.
This is not about predicting market direction. It is about protecting decision quality. After losses, traders tend to overtrade, widen stops, or force setups.
That’s where damage accelerates.
The objective is not to “win it back today,” but to prevent a manageable drawdown from becoming terminal.
Recovery is a process, not a moment
If you are down $1,500 on a $2,000 drawdown, your goal is not immediate recovery.
First, stop the bleeding. Second, regain rhythm. Third, rebuild gradually with disciplined execution.
Recovery may come in small increments—$100, then $150, then $200. The pace may feel slow, but consistency is what restores control.
Traders who chase full recovery in one move often lose the account. Those who scale down and focus on quality trades give themselves a real chance to recover.
A simple drawdown recovery framework
When approaching or exceeding risk limits:
Stop trading and reset
Reduce size to the smallest viable contract
Keep risk at 5%–10% of drawdown
Limit yourself to high-quality setups only
Stop after two consecutive losses
Respect daily loss limits
Avoid “make it back” trades
Rebuild gradually with discipline
This approach is not exciting, but it is effective.
Final thought
A drawdown does not have to end an account. Emotional decisions after the drawdown do.
Amateur thinking says: “I need one big trade to recover.” Professional thinking says: “I need to protect capital and trade back with discipline.”
If you’re down significantly on a small drawdown limit, the solution is not larger risk—it is smaller size, tighter control, and patience.
A few disciplined trades with minimal size can stabilize the account far faster than any aggressive recovery attempt.
Recent tensions in the Middle East have reignited discussion over whether the petrodollar system is beginning to weaken. Our view remains cautious. While a degree of diversification in how oil trades are settled is plausible, the more important issue is where Gulf oil revenues are ultimately invested. In both areas, any shift is likely to be incremental rather than disruptive.
The latest geopolitical developments have once again put the petrodollar debate in the spotlight. Markets are now asking whether disruptions in energy flows could speed up the adoption of non-dollar currencies in oil-related transactions. This is significant, as it feeds into broader questions about the dollar’s global dominance.
However, it would be premature to declare the “end of the petrodollar.” As with other de-dollarisation narratives, the underlying reality appears far more measured than headline-driven commentary suggests. It is useful to distinguish between trade invoicing and capital allocation. On the trade side, factors such as China’s rising role as a major Gulf energy buyer, the gradual expansion of renminbi payment systems, and experimentation with alternative settlement mechanisms are all noteworthy. Yet the dollar’s international position is equally, if not more, dependent on how surplus revenues from energy exporters are invested globally.
This is the central issue examined here. Overall, while there may be some gradual diversification in both trade settlement and investment flows, the core structure of the petrodollar system still appears deeply entrenched and difficult to displace.
Executive Summary
Oil settlement shift remains unproven. Data from March 2026 shows a temporary increase in renminbi-denominated settlement activity through China’s Cross-Border Interbank Payment System (CIPS), coinciding with the outbreak of the Iran conflict. However, this spike proved short-lived, with flows normalising in April and May. SWIFT trade finance data similarly indicates only a modest uptick in March, set against a broader gradual rise that began in 2022–2024. China’s expanding economic footprint in the Gulf remains an important structural factor, with its share of GCC trade rising to roughly 21% over the past decade. This has been accompanied by incremental progress in non-dollar settlement infrastructure, including the UAE–China swap arrangement, participation in mBridge, and cooperation between the UAE central bank and CIPS.
Gulf savings accumulation keeps sovereign wealth in focus. Excluding Saudi Arabia, GCC economies are expected to generate combined current account surpluses of around $150bn annually over the next five years, translating into roughly $0.8tr in external savings accumulation by 2030. Gulf sovereign wealth funds collectively manage about $6tr in assets, with the UAE alone estimated at around $2.7tr. This raises the central question of how these large pools of capital are allocated globally. On balance, GCC external portfolios remain heavily dollar-weighted, with around 69% of BIS-tracked international assets denominated in USD versus 46% globally, suggesting a stronger USD bias than the global average, even if sovereign wealth fund allocations are not fully captured in these figures.
What de-dollarisation could realistically look like. From a trade invoicing perspective, China’s role in GCC energy trade implies an upper bound of roughly $300bn in annual flows that could, in theory, shift toward yuan settlement under extreme scenarios. From an investment perspective, de-dollarisation would more likely emerge through a slowdown in new USD allocations rather than large-scale reallocation of existing holdings. Even a reduction in incremental USD investment flows to below about $100bn per year would signal a meaningful directional change.
GCC’s global role: significant but not system-defining. The Middle East accounts for roughly a quarter of global fuel exports, while fuel trade itself represents only 10–12% of total global merchandise trade. This limits the systemic impact of any GCC-driven de-dollarisation on the broader international monetary system. Overall de-dollarisation trends remain gradual, pointing to incremental diversification rather than a structural break. While the euro and renminbi may increasingly compete at the margins, the dollar’s dominance continues to be supported by entrenched network effects.
Market implications. Persistent USD dominance in GCC energy invoicing reinforces dollar network advantages, while USD funding markets demonstrated resilience even during the March peak in geopolitical stress.
Shift in Oil Settlement: Evidence Remains Inconclusive
The renewed conflict in the Middle East has reignited debate over whether momentum is building toward greater use of non-dollar currencies in energy invoicing. However, publicly available data remains limited and does not yet point to a clear structural shift. The increase in renminbi settlement activity seen in March through China’s CIPS system has been highlighted by some observers, including the European Central Bank, as a potential early signal of changing energy trade dynamics.
That said, the overall picture remains mixed. Following a temporary surge in March, CIPS transaction volumes eased back toward more typical levels in April and May, despite continued geopolitical tensions. SWIFT trade finance data offers a similar pattern: while renminbi usage had already been gradually rising through 2022–2024, the March 2026 increase was relatively modest and was followed by some decline in April, suggesting no sustained acceleration in non-dollar settlement activity so far.
The surge in CNY transactions seen in March so far looks to be a one-time event
China’s expanding economic footprint in the Gulf is an important factor to monitor. Expectations of greater renminbi use in Gulf energy trade are primarily driven by commercial rather than geopolitical considerations, as GCC countries are not subject to sanctions and retain flexibility in their choice of settlement currencies.
The commercial rationale begins with trade patterns. China’s share of GCC exports and imports has almost doubled over the past decade, reaching roughly 21%.
At the same time, Gulf trade has shifted increasingly toward emerging markets, which now represent about 60% of the GCC’s external trade—reversing the situation seen 25 years ago.
This shift is significant for global energy flows, given that the GCC accounts for 51% of total external trade turnover among emerging market fuel exporters in IMF classifications (excluding Russia, which is treated separately as a more diversified commodity producer). Within the GCC, the UAE has also surpassed Saudi Arabia in total external trade volumes over the past decade.
China’s share of GCC trade flows has almost doubled over the past decade, reaching 21% in annual turnover terms.
From a global trade and increasingly multipolar perspective, there is a gradual trend toward less dollar-exclusive energy settlement. This reflects China’s deepening trade ties with major exporters and the parallel development of alternative payment systems. Initiatives such as the UAE–China currency swap agreement, participation in mBridge, and the UAE central bank’s MoU with CIPS all indicate a slow but steady expansion of supporting infrastructure.
China’s renminbi internationalisation has progressed unevenly over the past two decades, but the overall direction has been toward broader use in trade settlement and payments. As China has become the largest trading partner for an increasing number of countries, greater RMB-denominated settlement has followed as a natural outcome of deeper trade integration.
A notable recent development during the Iran conflict was reports that Iran requested payments in Bitcoin or CNY, highlighting growing consideration of the renminbi as an alternative to the US dollar system, particularly as a way to mitigate exposure to US sanctions. Geopolitical factors may therefore continue to influence RMB adoption.
At the same time, policymakers have prioritised financial stability over rapid internationalisation. This approach is unlikely to change even amid de-dollarisation narratives. Limited capital account convertibility continues to constrain RMB internationalisation, and its role as a reserve currency remains relatively modest.
Nonetheless, policy efforts are ongoing. President Xi Jinping has emphasised the goal of a “powerful currency”. The People’s Bank of China has recently introduced a repo facility for foreign central banks, international financial institutions, and sovereign wealth funds, allowing them to access RMB liquidity using Chinese government bonds, central bank bills, and policy bank bonds as collateral. This could support greater RMB usage by providing access to China’s relatively low interest rates.
China currently maintains 32 currency swap lines totalling up to RMB 4.5 trillion. These arrangements have increasingly evolved from symbolic frameworks into operational liquidity tools. By the end of 2025, outstanding RMB drawn by overseas central banks had reached RMB 94.2 billion.
China continues to expand the infrastructure supporting RMB internationalisation.
However, greater Gulf exposure to China does not imply an erosion of the dollar’s role as a petro-currency. China’s rising share in global trade does not automatically translate into a proportional increase in RMB usage. Moreover, if Gulf economies continue to invest heavily in domestic energy, logistics, and defence infrastructure, their import demand is likely to remain diversified across both advanced and emerging market partners.
On swap lines, earlier this year there was significant attention on the UAE’s reported request for a standing US dollar swap line to join the group of major developed-market central banks such as the euro area, Japan, the UK, Switzerland, and Canada. Although this discussion has since faded from view, it suggests that the UAE continues to view itself firmly within the dollar-based monetary system, supported by its USD/AED currency peg.
The Gulf Continues to Build Oil-Related Savings…
The Gulf continues to build up significant oil-related savings. A key issue for the dollar narrative is not simply how Gulf trade is invoiced, but whether the region still generates sufficiently large external surpluses to remain influential in global capital flows. Some analysts argue that higher domestic spending and imports have reduced GCC current account surpluses to the point where the region is no longer a meaningful capital exporter.
However, IMF forecasts suggest a different picture. They indicate that the GCC as a whole will still accumulate substantial external surpluses. While Saudi Arabia is expected to remain closer to a balanced or even deficit position, the rest of the GCC—particularly the UAE, Qatar, and Kuwait—continues to stand out as a major source of savings. Excluding Saudi Arabia, the region is projected to generate around $150 billion in annual current account surpluses over the next five years, even assuming oil prices of $70–80 per barrel. This would amount to roughly $0.8 trillion in cumulative surpluses by 2030, which would need to be deployed into global financial assets.
The Gulf Continues to Build Oil-Driven Financial Surpluses
A key issue for the dollar narrative is not simply how Gulf trade is invoiced, but whether the region still generates sufficiently large external surpluses to remain influential in global capital markets. Some argue that higher domestic spending and imports have eroded GCC current account surpluses, reducing its role as a major exporter of capital.
However, IMF projections point in a different direction. Even if Saudi Arabia is expected to hover closer to balance or even modest deficits, the broader GCC remains a significant source of external savings. Excluding Saudi Arabia, countries such as the UAE, Qatar, and Kuwait are projected to generate combined current account surpluses of around $150bn per year over the next five years, assuming oil prices remain in the $70–80 per barrel range. Over this period to 2030, this translates into an estimated cumulative surplus of roughly $0.8tr that will need to be deployed into global financial assets by the GCC excluding Saudi Arabia.
Excluding Saudi Arabia, the GCC is projected to generate around $0.8tr in current account surpluses through 2030
Persistent external surpluses in the Gulf mean the region remains structurally important not only for trade invoicing, but also for shaping the currency composition of global financial assets. In the GCC, sovereign wealth funds play a central role in recycling these surpluses. As discussed previously, in hydrocarbon-exporting economies these funds often dominate external investment activity, far outweighing central bank reserve holdings.
Originally designed to preserve and grow finite oil and gas wealth for future generations, GCC sovereign wealth funds have expanded into major global investors, with combined assets under management of roughly $6tr. This represents more than one-third of the total assets held by the world’s 100 largest sovereign wealth funds. The UAE alone accounts for an estimated $2.7tr, making it the largest sovereign wealth hub in the region. Four of the six GCC countries rank among the world’s top ten sovereign wealth fund holders, underscoring the scale of their global financial footprint. These allocation decisions are therefore as relevant to the evolution of the petrodollar system as trade invoicing patterns.
GCC sovereign wealth: Scale and global relevance
Top-tier sovereign wealth ownership is heavily concentrated in the Gulf, reinforcing its systemic importance in global capital flows.
At the same time, the GCC remains broadly USD-oriented in its external investment profile. However, measuring this exposure precisely is difficult due to limited transparency. The IMF’s COFER dataset captures only central bank reserves, which are relatively small in the Gulf compared with sovereign wealth funds. Meanwhile, SWFs disclose little detail on currency composition. Even US Treasury data is distorted by custodial holdings in financial hubs such as the UK, Switzerland, and the Benelux countries.
As a result, indirect measures are used. One useful proxy comes from BIS locational banking statistics, which track the currency composition of cross-border banking claims and liabilities. While imperfect and not fully capturing sovereign wealth activity, it provides a useful indicator of external financial currency exposure.
On this basis, GCC external portfolios remain heavily dollar-centric. By end-2025, around $0.6tr—about 69% of international assets linked to GCC financial and non-financial sectors—were denominated in US dollars, significantly above the global average of roughly 46%. In contrast, euro exposure is relatively low at around 8%, compared with a global share of 34%. The region also shows a somewhat higher allocation to non-core currencies. Notably, rather than declining, the dollar share of GCC cross-border assets has actually increased over the past decade, diverging from broader global diversification trends.
GCC External Financial Exposure Remains Strongly USD-Weighted by Global Standards
Pre-2025 currency shares have been recalculated using end-2025 FX rates.
While BIS locational banking statistics are an imperfect proxy for sovereign wealth fund currency allocation—since most SWFs are structured outside domestic banking systems—they still offer a useful directional signal.
There are several reasons why this proxy is informative. First, the GCC’s currency pegs to the US dollar naturally reinforce USD dominance across both trade and capital flows, anchoring financial behavior to the dollar. Second, international comparisons provide validation. Norway is a useful benchmark because its sovereign wealth fund discloses detailed currency composition. In Norway’s case, BIS cross-border banking data does not exactly mirror the sovereign fund’s allocation, but it does reproduce the broad hierarchy of currencies quite accurately: the US dollar is dominant, followed by a group of non-core currencies, with the euro lagging behind. This supports the view that BIS-based measures can still capture meaningful structural patterns.
Norway cross-check supports BIS signal reliability
The Norwegian case suggests BIS banking data may not precisely match sovereign fund allocations, but it does reflect their overall currency ordering.
If the BIS-derived GCC data similarly reflects sovereign wealth fund behavior, it implies that a substantial share of Gulf sovereign wealth is already concentrated in dollar assets. On this basis, at least around $4tr of assets may be USD-denominated, compared with much smaller exposures to non-core currencies (approximately $0.6tr) and the euro (around $0.5tr).
In other words, the evidence suggests that GCC sovereign wealth is already heavily dollar-centric at scale, even if precise allocation data remains opaque.
What Gulf De-Dollarisation Could Realistically Look Like
The question is not whether Gulf de-dollarisation is likely, but what its practical upper bound would be if it were pursued as a stress scenario rather than a baseline forecast.
A useful extreme reference point is Russia. Since 2014—and especially after 2022—Russia’s external trade and reserves have shifted sharply toward China and the renminbi, driven by sanctions and constraints on access to traditional reserve assets. By 2025, the RMB share of Russia’s trade invoicing had risen to roughly match China’s share of its trade (around 30–33%), and the yuan also became a dominant reserve asset due to limited alternatives.
In Russia’s case, trade settlement increasingly aligned with the structure of its external trade, with China playing a central role in both imports and exports.
However, the GCC is fundamentally different. Its geopolitical position, financial integration, and market depth make a direct analogy misleading. At most, Russia provides a “stress boundary” for how far currency diversification can go under extreme constraints. In the Gulf, China accounts for roughly 20% of external trade, implying that even in an aggressive scenario, RMB invoicing might plausibly rise only to around that level. On that basis, up to roughly $300bn of the GCC’s estimated $1.5tr annual trade turnover could, in an extreme case, be invoiced in renminbi.
Trade shift potential is bounded, not open-ended
Even under aggressive assumptions, currency diversification in trade would likely remain structurally capped by actual trade composition.
The constraints are even more binding on the asset side. GCC sovereign wealth funds are too large and too globally embedded to be rapidly reallocated. As a result, any de-dollarisation process would likely occur incrementally through new annual flows rather than through reshaping the existing stock of assets.
Given projected current account surpluses of about $150bn per year, even a scenario where USD allocation falls below 70% of new inflows—roughly $100bn annually—would already represent a meaningful shift toward diversification. But even then, the dollar would remain dominant in accumulated wealth.
Importantly, this still falls far short of any rapid or wholesale exit from USD exposure as the primary store of Gulf wealth.
So far, most of the discussion around alternatives has focused on the renminbi. However, a more realistic end-state is likely multipolar rather than binary, with dollars, euros, RMB, and other currencies coexisting. The euro, in particular, appears unlikely to displace the dollar in energy markets. The eurozone accounts for only about 11% of GCC trade, and Europe itself has shown limited appetite to challenge USD dominance in oil pricing, despite some success in gas and carbon benchmarks.
That said, Europe’s financial markets are gradually becoming more competitive. Euro-denominated debt issuance rose sharply in 2026, up around 30% to a record $1.1tr, driven by stronger international participation and increased “Reverse Yankee” activity. While policy progress on deeper capital markets integration remains uneven, demand for euro-denominated assets has improved.
Stablecoins are sometimes mentioned as a potential new settlement layer for energy trade, but current evidence remains highly speculative. Where they are used, they tend to reinforce dollar dominance rather than weaken it, since most stablecoins are ultimately backed by USD assets. For example, Tether ranks among the largest holders of US Treasuries globally.
The Gulf remains central, but not decisive alone
Even if GCC invoicing or allocation patterns were to diversify, global outcomes would still depend on the broader energy system, not just the Gulf.
The Middle East accounts for roughly one-quarter of global fuel exports, meaning it is influential but not determinative of global pricing or currency use. Post-2022 shifts have also increased the role of the United States as a major energy exporter, especially in LNG.
According to the IEA’s medium-term projections, the Americas are expected to retain a strong position in global fuel markets, particularly in oil, with North and Latin America together holding about a 38% share versus roughly 33% for the Middle East.
In that context, the global energy system may be becoming more geographically fragmented, but not necessarily less dollar-centric.
Middle East Still Accounts for About a Quarter of Global Fuel Exports, While the Americas Remain a Strong Competitor
This underscores a key point: any serious “petrocurrency” argument must address two dimensions simultaneously. First, whether the Gulf itself gradually reduces its reliance on the US dollar in trade settlement and external savings. Second, whether any such shift is large enough to meaningfully alter global currency aggregates.
Broader de-dollarisation remains gradual
The petrocurrency debate is an important subset of the wider de-dollarisation discussion, particularly in relation to the UAE’s increasing global energy ambitions following its BRICS+ participation and more assertive production strategy. However, current evidence still points toward a slow-moving global adjustment rather than a structural break.
To begin with, global fuel trade itself is relatively small in the context of world commerce—only around 10–12% of total merchandise exports.
More importantly, international institutions consistently find that the US dollar remains the dominant currency in trade invoicing. The IMF reports no clear, broad-based shift away from the dollar in oil trade, while ECB analysis similarly shows that the dollar and euro together still account for more than 80% of global invoicing, with the renminbi remaining marginal at the global level.
Limited transmission from Gulf shifts to global currency structure
This matters for interpreting any potential diversification in Gulf energy settlement. Even if parts of energy trade become less exclusively dollar-based, the global impact would likely be muted unless accompanied by a broader reconfiguration of global financial markets.
The dollar’s dominance is not anchored solely in trade flows, but in the deeper structure of global finance—central bank reserves, private cross-border assets and liabilities, and the scale of USD-denominated debt and securities markets.
In fact, broader dollarisation indicators suggest that while there has been some long-term diversification—particularly on the asset side—this process has recently slowed. By 2025, several measures of de-dollarisation show signs of stagnation, reflecting the lack of deep alternative markets outside the US dollar and euro segments.
De-dollarisation has stalled at the margin
A key structural constraint remains the limited depth of non-USD and non-EUR debt markets, which restricts the ability of global investors— including sovereign wealth funds—to meaningfully diversify at scale.
Incremental change, not systemic shift
None of this implies a static system. Gradual increases in euro and renminbi settlement in selected energy transactions are plausible, as is a modest rebalancing in how Gulf surpluses are deployed.
But the broader picture remains one of incremental adjustment rather than systemic rupture: parts of the Gulf economy may become slightly less dollar-centric at the margin, without materially dislodging the dollar’s central role in global trade and financial architecture.
Market Implications
The advantages of the US dollar in international finance and invoicing are well established, largely driven by powerful network effects. Recent ECB analysis estimates that of the roughly 190 basis points of “convenience yield” earned by foreign investors holding US Treasuries, about 170 basis points is attributable specifically to the dollar’s reserve-currency status and global utility. In that context, continued Gulf exporters’ earnings and reinvestment in USD assets remain an important structural support for relatively low US government borrowing costs.
A related question that emerged during periods of geopolitical stress was whether developments in the Middle East could materially affect global dollar funding conditions. Specifically, could GCC economies—given their role as global oil exporters and financial intermediaries—be large enough providers of dollar liquidity through wholesale funding or commercial paper markets to tighten global USD funding if disrupted?
In FX markets, stress in dollar liquidity is typically reflected in the cross-currency basis swap market, where European institutions, for example, may effectively pay up to obtain dollars by swapping euros at a discount. During the peak of recent tensions in March, however, this indicator remained broadly stable, suggesting that global dollar funding markets were resilient and that any shock from the region remained localised rather than systemic.
Dollar funding resilience during stress episodes
Cross-currency basis swaps showed limited movement, reinforcing the depth and stability of USD funding markets even under geopolitical strain.
The broader petrodollar framework may be evolving, but only gradually. Recent geopolitical tensions have renewed attention on whether major energy producers and consumers will increasingly settle transactions in non-dollar currencies, and there are signs of marginal diversification—particularly with China’s growing role in Gulf trade and the gradual development of alternative payment infrastructures.
However, this should not be mistaken for a rapid erosion of dollar dominance. The key issue is not only the currency used in trade invoicing, but the destination of accumulated oil surpluses. On this front, the adjustment appears even slower. The Gulf continues to generate sizeable external surpluses, sovereign wealth funds remain the primary mechanism for recycling them, and available balance-sheet evidence still points to a financial system that is more dollar-weighted than the global average.
Bottom line
While the euro, the renminbi, and other non-core currencies can introduce greater competition at the margin—both in settlement and in incremental portfolio allocation—the evidence does not support a rapid de-dollarisation of the global system. Structural constraints, limited deep alternative markets, and entrenched network effects mean that any transition is likely to remain gradual. For now, the US dollar remains firmly embedded at the centre of global energy and financial flows.
The US dollar strengthened against the Japanese yen for most of the week, extending the broader bullish trend that has dominated the pair in recent months. As long as this momentum remains intact, traders are likely to view pullbacks as buying opportunities rather than signs of a reversal.
The ¥160 level may provide initial support in the near term. If the pair falls below that threshold, additional support could emerge around ¥158, where buyers may step in once again.
Bitcoin
Bitcoin moved lower during the week, but the cryptocurrency continues to find support around the key $60,000 level. This area remains an important technical floor for the market, and traders will be closely watching whether buyers can defend it in the coming sessions.
A decisive break below $60,000 could trigger additional selling pressure, potentially opening the door for a decline toward the $50,000 level, which represents the next major support zone.
AUD/USD
The Australian dollar attempted to move higher during the week but struggled to maintain its gains, with the market retreating and signaling a degree of underlying weakness. Despite the pullback, the pair remains confined within a well-defined trading range.
The 0.6950 level continues to serve as a key support zone, while 0.7150 remains a significant resistance area. As long as these boundaries hold, AUD/USD is likely to remain range-bound, with traders looking for opportunities at the extremes of the range.
USD/MXN
The US dollar advanced against the Mexican peso during the week, but the pair continues to encounter strong resistance around the 17.50 level. This area has repeatedly attracted selling interest and remains a key barrier for further upside momentum.
A sustained break above 17.50 could signal a shift in market sentiment and pave the way for a move toward the 18.00 peso level, which would become the next major upside target.
USD/CAD
The US dollar strengthened significantly against the Canadian dollar during the week, supported by growing concerns that the Canadian economy is losing momentum. Signs of slowing economic activity and increasing recession risks have weighed on the Canadian dollar, helping to drive USD/CAD higher.
As economic conditions in Canada remain challenging, the US dollar could continue to benefit from its relative strength, particularly if investors favor safer and higher-yielding assets.
Nasdaq 100
The Nasdaq 100 posted solid gains over the course of the week, reflecting the strong bullish sentiment that continues to support the technology-heavy index. Although the market opened with a gap higher on Monday, prices later pulled back to fill that gap before resuming their upward trajectory.
The successful rebound following the gap fill suggests that buyers remain firmly in control, reinforcing the positive outlook for the index.
Gold
Gold spent most of the week under pressure, although the broader market remained relatively stable as prices continued to hold above the critical $4,000 support level. This area has become a key battleground between buyers and sellers and is likely to determine the next major directional move.
A sustained break below $4,000 could signal a significant shift in market sentiment and potentially mark the beginning of a new bearish phase. For now, however, buyers appear willing to defend this important support zone.
Silver
Silver continued to trade in a volatile and directionless manner during the week, with prices hovering around the 50-week Exponential Moving Average (EMA). Similar to gold, the metal appears to be stuck in a broad consolidation phase, lacking the momentum needed to establish a sustained trend.
The market is currently positioned between two major technical levels: $60 on the downside and $70 on the upside. These boundaries have become the primary areas to watch for the next significant breakout.