Gold remains supported for a second consecutive session as the US dollar edges lower. However, expectations for further Fed tightening and lingering geopolitical tensions involving Iran may limit losses in the greenback and restrain upside in the precious metal. Traders are also likely to stay cautious ahead of the closely watched US Nonfarm Payrolls report.
Gold prices (XAU/USD) edged higher on Thursday, climbing to a fresh daily high during the European session as a modest pullback in the US dollar provided support. However, gains remained limited as expectations for further Federal Reserve tightening and ongoing geopolitical tensions continued to underpin the greenback, keeping bullion largely within the previous day’s trading range. Investors also appeared cautious ahead of the highly anticipated US Nonfarm Payrolls (NFP) report.

The dollar came under mild pressure after weaker-than-expected US economic data. According to ADP, private-sector employment increased by 98,000 jobs in June, falling short of forecasts for 113,000 and slowing from May’s 122,000 gain. Meanwhile, the ISM Manufacturing PMI slipped to 53.3 from 54.0, signaling a moderation in manufacturing activity. The report also showed a notable decline in the Prices Paid Index to 73.0 from 82.1, suggesting easing cost pressures, while the Employment Index improved slightly to 49.7 from 48.6. Combined with the recent decline in crude oil prices, these developments have helped reduce near-term inflation concerns and weighed on the US dollar, offering support to gold.
Despite the softer data, markets continue to expect further Fed tightening. The CME FedWatch Tool shows traders pricing in roughly a 64% probability of a rate hike in September and nearly an 85% chance that borrowing costs will be increased before year-end. Those expectations were reinforced by comments from Kevin Warsh, who reiterated the Fed’s commitment to its 2% inflation target and dismissed expectations of a shift toward looser monetary policy despite calls from Donald Trump for lower interest rates. Several Fed officials have also suggested that rates may need to remain elevated for longer, a factor that should continue to support the dollar and limit upside potential for non-yielding assets such as gold.
Geopolitical developments are also influencing market sentiment. Indirect negotiations between the United States and Iran in Qatar ended without meaningful progress toward easing tensions surrounding the strategically important Strait of Hormuz. At the same time, Russia launched a new wave of missile and drone attacks on Ukraine, keeping geopolitical risks elevated and maintaining demand for safe-haven assets.
Looking ahead, attention now turns to the US Nonfarm Payrolls report. As one of the Fed’s most closely watched indicators, the employment data could significantly influence expectations for future interest-rate moves, shaping the near-term direction of both the US dollar and gold prices.
XAU/USD Technical Analysis: Recovery Attempts Face Resistance Within Bearish Structure
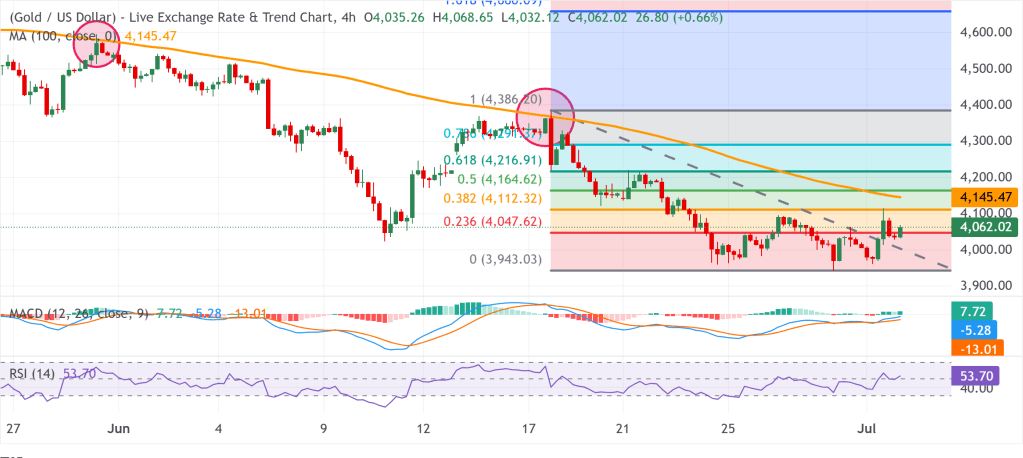
From a technical standpoint, gold remains vulnerable despite its recent rebound. The latest short-covering rally stalled near the 38.2% Fibonacci retracement of the decline recorded over the past two weeks, suggesting that buyers are struggling to regain control. In addition, XAU/USD continues to trade below its 100-period Simple Moving Average (SMA) on the 4-hour chart, keeping the broader near-term outlook tilted to the downside.
That said, momentum indicators have improved. The MACD remains in positive territory and is trending higher, while the Relative Strength Index (RSI) holds near 54, indicating modest bullish momentum without entering overbought conditions. Gold’s ability to sustain gains above the 23.6% Fibonacci retracement level also supports the possibility of further recovery, although any advance is likely to remain constrained unless key resistance levels are broken.
On the upside, the first hurdle is the 38.2% Fibonacci retracement at $4,112.32. A decisive move above this level could open the door toward the 100-period SMA at $4,145.47, followed by the 50% retracement level at $4,164.62. Beyond that, resistance is seen at the 61.8% Fibonacci level near $4,216.91, then the 78.6% retracement at $4,291.37, with the record high around $4,386.20 representing the ultimate bullish target.
On the downside, immediate support lies at the 23.6% Fibonacci retracement around $4,047.62, a level recently reclaimed by buyers. Failure to hold above this zone would weaken the recovery narrative and expose the key support area near the recent swing low of $3,943.03.
Overall, while improving momentum indicators suggest scope for additional upside corrections, gold remains trapped within a broader bearish technical framework as long as it trades below the 100-period SMA and fails to break above the $4,112–$4,145 resistance zone. A move beyond that area would be needed to shift the near-term outlook toward a more constructive stance.

Leave a comment