- Bitcoin slides below $63,000 as escalating Middle East tensions continue to pressure risk assets.
- Ethereum retreats but finds near-term support at its 50-day EMA, despite persistent ETF outflows.
- XRP remains technically fragile, leaving the door open for a break below $1.10 even as modest capital inflows provide limited support.
Cryptocurrencies trade broadly lower on Friday as investors continue to evaluate the fallout from ongoing military exchanges between the United States and Iran. Bitcoin (BTC) has fallen more than 1% on the day, slipping below $63,000 and extending its pullback from the weekly peak near $65,600.
Ethereum (ETH) and XRP are also under pressure, with ETH drifting toward key short-term support around $1,800, while XRP remains pinned below the crucial $1.10 threshold.
US-Iran conflict dampens risk appetite
Military operations involving the US and Iran entered a sixth consecutive night, intensifying geopolitical uncertainty across global markets. According to reports, strikes in southern Iran have targeted civilian infrastructure, including power facilities and a railway station in Bandar Abbas.
Adding to market concerns, Reuters reported that Iran has directed Yemen’s Houthi forces to prepare for a potential closure of the Red Sea oil shipping route should attacks on Iranian energy assets escalate further, raising fears of disruption to global energy supplies.
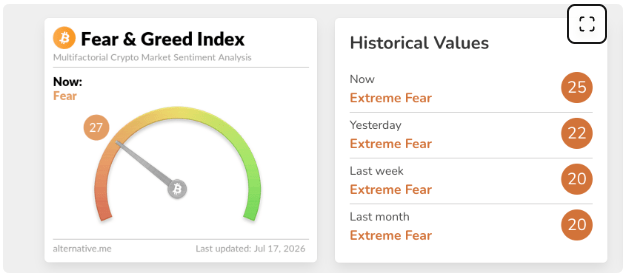
Despite the heightened tensions, overall crypto market sentiment has remained relatively stable, though firmly cautious. The Fear & Greed Index stood at 27 on Friday, up slightly from 25 a day earlier, but still within the Fear zone. The modest improvement reflects lingering optimism following softer US inflation data earlier this week, which briefly supported a rebound in risk assets such as Bitcoin, Ethereum, and XRP before geopolitical concerns regained prominence.
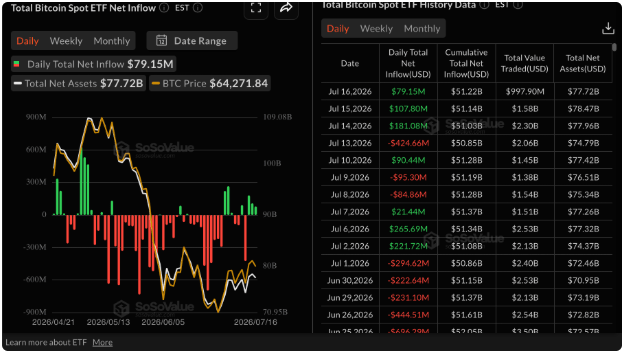
Meanwhile, spot Bitcoin ETF inflows remained positive on Thursday, totaling approximately $79 million. However, the figure represented a slowdown from the $108 million recorded on Wednesday and the $181 million seen on Tuesday. Should institutional demand remain resilient in the weeks ahead, it could help offset geopolitical headwinds, supporting a period of consolidation before Bitcoin potentially makes another push above the $65,000 level.
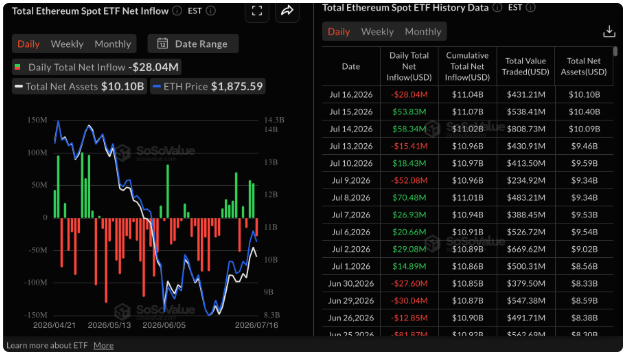
Ethereum spot ETFs shifted back into risk-off territory on Thursday, recording net outflows of $28 million. The reversal snapped a two-day streak of inflows that brought in $54 million on Wednesday and $58 million on Tuesday. The renewed selling pressure coincided with Ethereum’s rejection from its weekly peak near $1,947, highlighting growing investor caution and reinforcing the broader risk-averse mood across financial markets.
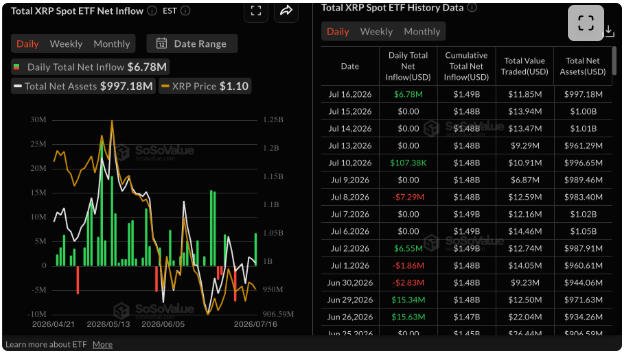
For XRP, spot ETF demand showed signs of improvement on Thursday, drawing nearly $7 million in net inflows, according to SoSoValue data. The uptick followed several sessions of subdued activity and suggests a modest return of investor interest. As a result, cumulative net inflows rose to approximately $1.49 billion, while total net assets stood near $997 million. Nevertheless, continued inflows into US-listed XRP ETFs will be crucial to counterbalance selling pressure in the spot market and provide a foundation for a more sustained recovery.
Bitcoin Price Outlook: Technical Weakness Keeps BTC Under Pressure
Bitcoin continues to exhibit a bearish near-term bias, trading below its 50-day, 100-day, and 200-day Exponential Moving Averages (EMAs), signaling that sellers remain in control. Additional overhead pressure comes from the Parabolic SAR indicator positioned around $65,600, reinforcing a key resistance zone. Meanwhile, the Relative Strength Index (RSI) sits at 47, slightly below the neutral 50 mark, reflecting subdued buying momentum despite a mildly positive reading from the Moving Average Convergence Divergence (MACD) histogram.
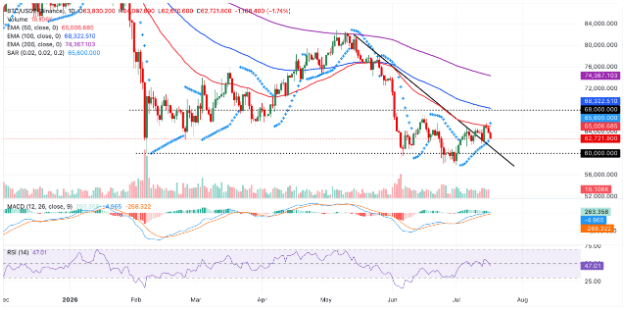
On the upside, Bitcoin faces immediate resistance at the 50-day EMA near $65,007, followed by the Parabolic SAR around $65,600. Together, these levels form a significant near-term barrier ahead of the 100-day EMA at $68,323 and the longer-term 200-day EMA at $74,367.
On the downside, support is located around $61,106, where a previously broken descending trendline now serves as a key structural floor. A daily close below this level could accelerate selling pressure and trigger a deeper correction. For sentiment to improve meaningfully, Bitcoin will need to reclaim and hold above the dense resistance zone around $65,000, which currently caps recovery attempts and preserves the prevailing bearish outlook.
Altcoin Outlook: Ethereum and XRP Drift Toward Key Support Levels
Ethereum (ETH) trades around $1,830, remaining above its short-term support cluster formed by the 50-day EMA at $1,811 and the Parabolic SAR at $1,801. These levels provide a modest cushion against further declines, although the broader trend remains constrained. ETH continues to trade below the 100-day EMA at $1,942 and the 200-day EMA at $2,185, keeping the medium- and long-term outlook cautious. Momentum indicators offer mixed signals, with the RSI near 55 suggesting moderate buying interest, while a still-positive but weakening MACD points to fading bullish momentum.
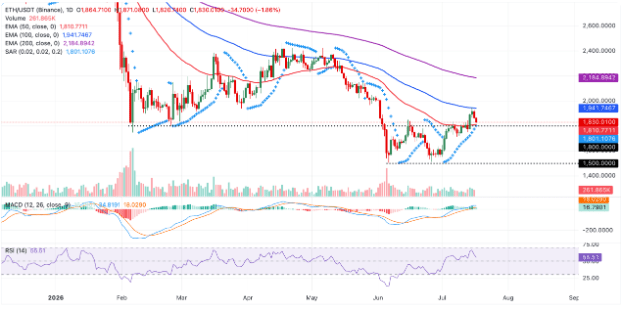
On the downside, the $1,830–$1,800 region represents a critical support zone. A break below this area could expose Ethereum to a deeper correction. On the upside, initial resistance is located at the 100-day EMA near $1,942, followed by the more significant 200-day EMA around $2,185. A decisive move above these barriers would be required to restore a stronger bullish outlook.
XRP Remains Under Pressure Below Key Resistance
XRP continues to trade below the important $1.10 resistance zone, maintaining a bearish technical bias. The token remains firmly below its 50-day, 100-day, and 200-day EMAs, indicating that sellers retain control of the broader trend. Additional resistance is provided by the middle Bollinger Band near $1.10 and a previously broken descending trendline around $1.12, suggesting that recovery attempts are being met with persistent selling pressure.
Momentum indicators remain relatively weak but not deeply oversold. The MACD retains a slightly positive reading, while the RSI near 44 reflects limited buying conviction and mild downside pressure.
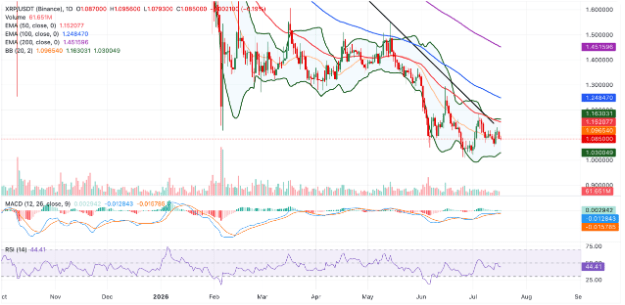
On the upside, resistance begins at $1.10, followed by $1.12 and the 50-day EMA near $1.15. Beyond that, the upper Bollinger Band around $1.16 precedes stronger resistance levels at the 100-day EMA near $1.25 and the 200-day EMA around $1.45.
On the downside, immediate support is located near the lower Bollinger Band at $1.03. A sustained move below this level could trigger further weakness and expose XRP to lower psychological support zones, leaving the overall technical outlook negative while the token remains beneath its key moving averages.
 THE ETERNAL SOVEREIGN
Leave a comment