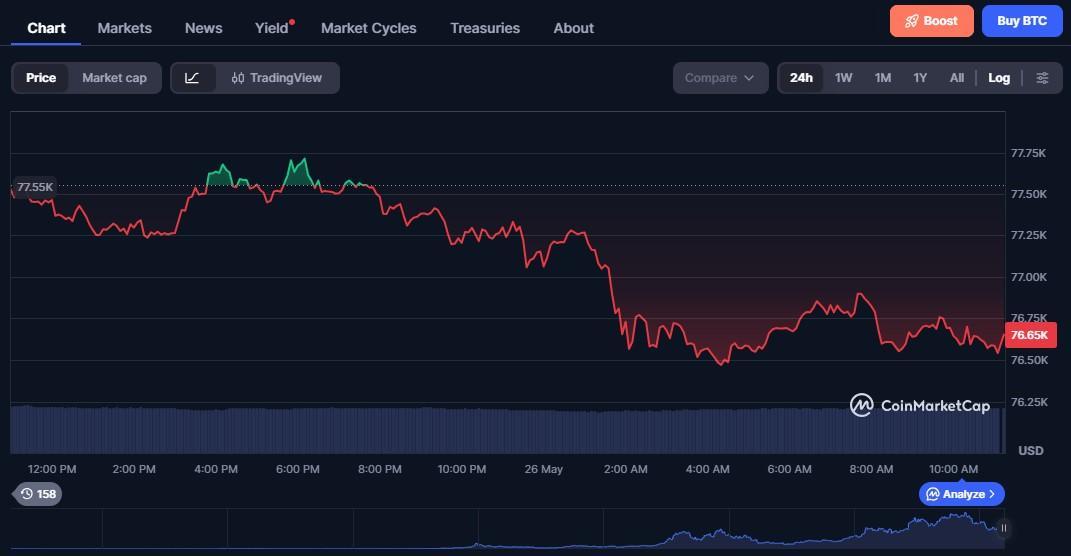
Bitcoin remains capped below the $80,000 resistance, with $77,000 acting as key near-term support.
Ethereum pulls back toward the $2,400 demand area despite recording $697 million in weekly ETF inflows.
XRP extends its decline following an overheated rally, with the RSI indicating overbought conditions.
The cryptocurrency market is undergoing a broad pullback on Monday as investors turn toward profit-taking following last week’s strong rally. Bitcoin (BTC) is trading slightly lower, with gains constrained below the $80,000 level and immediate support around $77,000.
Ethereum (ETH), meanwhile, remains above near-term support at $2,400 but has yet to build enough momentum to challenge the next major resistance at $2,600. Ripple (XRP) is hovering near $1.48 as its momentum fades after surging 72% last week, climbing from around $1.00 to a peak near $1.70.
Bitcoin, Ethereum and XRP ETFs attract strong inflows
Bitcoin spot Exchange-Traded Funds (ETFs) experienced a significant increase in investor demand, recording $1.92 billion in net inflows through Friday last week. This represented the strongest weekly inflow since October and signaled a notable improvement in risk appetite. Total cumulative inflows increased to $53.71 billion, compared with $51.79 billion the previous week.
Ethereum spot ETFs also saw a sharp rebound in demand, attracting approximately $697 million in inflows through Friday. This was a substantial turnaround from the $2.26 million in outflows recorded the week before. Cumulative inflows subsequently rose to $12.15 billion from $11.45 billion.
Institutional interest in XRP also strengthened, with XRP-related ETFs recording $40 million in inflows through Friday, significantly higher than the $2.25 million registered the previous week. SoSoValue data shows cumulative inflows of approximately $1.55 billion, while total assets under management reached $1.33 billion.
If this stronger demand for crypto investment products continues, it could provide additional support for the broader cryptocurrency market and improve its recovery prospects. However, traders should remain cautious, as renewed profit-taking may limit further gains and potentially trigger a deeper market correction.
Technical Analysis: Bitcoin Faces Resistance Near $80,000
Bitcoin is trading around $77,240, remaining comfortably above its major Exponential Moving Averages (EMAs) and preserving a bullish short-term outlook. The 50-day EMA at $66,777, 100-day EMA at $67,410, and 200-day EMA at $71,805 are all positioned below the current price, supporting the underlying uptrend. The SuperTrend indicator also remains below Bitcoin at $70,570, further confirming the positive technical structure.
However, Bitcoin has pulled back after approaching the key $80,000 resistance level. Momentum indicators suggest the market may need to consolidate before attempting another move higher. The Relative Strength Index (RSI) stands at 78, firmly in overbought territory, while the Moving Average Convergence Divergence (MACD) remains above zero with a strong positive histogram. This combination indicates that bullish momentum is still present but increasingly stretched.
Immediate support is located around $77,000, while the 200-day EMA near $71,805 provides a stronger technical floor. A deeper correction could bring the SuperTrend level at $70,570 into focus, followed by the 100-day and 50-day EMAs at $67,410 and $66,777, respectively. Given the elevated RSI and MACD readings, traders may find better risk-reward opportunities by waiting for pullbacks toward these support zones rather than chasing Bitcoin near current highs.
Altcoin Outlook: Ethereum and XRP Maintain Bullish Structures
Ethereum is trading near $2,444 and continues to hold well above its major moving averages, keeping the short-term outlook constructive. The price remains comfortably above the 50-day EMA at approximately $1,985 and the 100-day EMA near $1,973, while the 200-day EMA around $2,141 provides additional confirmation of the broader bullish trend.
Momentum remains strong, with the MACD staying in positive territory and the RSI near 77. However, the overbought RSI suggests that Ethereum’s recent advance may be becoming stretched and could require a period of consolidation.
Immediate support is positioned around $2,400, followed by the 200-day EMA at $2,141. Further downside could bring the $1,985-$1,973 area into focus, where the 50-day and 100-day EMAs create a strong support cluster. On the upside, a sustained move above $2,600 could open the door toward the psychological $3,000 level.
XRP is trading around $1.45 after a powerful rebound, with the price now positioned well above its key moving averages. XRP has moved above the 50-day EMA at $1.14, 100-day EMA at $1.18, and 200-day EMA at $1.35, highlighting a strong bullish impulse.
The RSI near 77 indicates that XRP is also firmly overbought, while the positive MACD confirms that upward momentum remains strong. Nevertheless, the stretched technical conditions increase the possibility of short-term consolidation or a pullback.
The SuperTrend indicator at $1.25 represents the first significant downside support and could attract buyers if XRP retreats. The reclaimed 200-day EMA at $1.35, followed by the 100-day and 50-day EMAs at $1.18 and $1.14, respectively, provides additional support underneath the market. A healthy correction toward $1.25 could allow momentum to reset before XRP attempts another leg higher.
Bitcoin (BTC) is trading near $62,900 on Friday, having lost more than 3% this week, though recent price action suggests the decline may be easing.
US spot Bitcoin ETFs saw net outflows of $332.08 million through Thursday, reflecting a more cautious stance among institutional investors.
Ongoing tensions in the Strait of Hormuz continue to lift Oil prices and sustain a geopolitical risk premium, boosting demand for the US Dollar and limiting Bitcoin’s upside potential.
Bitcoin (BTC) is trading near $62,900 on Friday, down more than 3% for the week as cautious institutional participation and ongoing geopolitical risks continue to pressure sentiment. Although the cryptocurrency is showing signs of stabilization, elevated Oil prices and escalating tensions in the Strait of Hormuz are limiting risk appetite and keeping the near-term outlook for BTC subdued.
Middle East tensions continue to cap Bitcoin’s upside
Geopolitical uncertainty surrounding the US-Iran conflict remained a key market theme this week, constraining demand for risk-sensitive assets such as Bitcoin. On Thursday, US Treasury Secretary Scott Bessent warned that Washington is preparing unprecedented economic measures against Iran, signaling that additional announcements could be unveiled in the coming days.
Meanwhile, Iranian officials maintained a defiant stance. Mohammad Reza Naqdi, a senior adviser to the Islamic Revolutionary Guard Corps (IRGC), stated that Tehran’s objective is to make any confrontation so costly that future US administrations would hesitate before considering military action.
The standoff has also intensified around the Strait of Hormuz. President Donald Trump reiterated that the United States maintains complete control over the critical shipping route, while Iran insisted the strait would remain closed until its demands are satisfied. At the same time, Iran-backed Houthi forces in Yemen increased attacks on vessels operating in the Red Sea and Bab el-Mandeb Strait and claimed responsibility for a drone strike targeting a Saudi Aramco refinery, heightening fears of a wider regional conflict.
The combination of these developments has amplified uncertainty surrounding global energy supplies, sustaining a geopolitical risk premium in Oil markets. Higher energy prices and safe-haven demand have supported the US Dollar, weakened broader risk sentiment, and continued to act as a headwind for Bitcoin.
Institutional demand remains subdued
Institutional flows have provided little support for Bitcoin this week. According to SoSoValue data, US spot Bitcoin ETFs recorded cumulative net outflows of roughly $332 million through Thursday, highlighting a cautious approach among large investors. If Friday’s data also shows withdrawals, BTC could end the week with net ETF outflows, reflecting softer institutional demand and a more defensive market stance.
Cooling US inflation offers support, but Oil-driven risks persist
Recent US economic releases pointed to moderating inflationary pressures, potentially giving the Federal Reserve (Fed) greater flexibility to keep interest rates unchanged. While such a backdrop would normally favor risk assets, Bitcoin has struggled to capitalize on the softer macroeconomic data.
The latest figures showed that US headline Consumer Price Index (CPI) inflation eased to 3.4% year-over-year in July, down from 3.5% previously and in line with expectations. Core CPI, which excludes food and energy, increased by 0.2% month-over-month and 2.5% annually, matching forecasts. Meanwhile, Producer Price Index (PPI) data released on Thursday came in weaker than expected, with monthly prices unchanged and annual producer inflation slowing to 4.7% from 5.5%.
Together with last week’s softer-than-expected Nonfarm Payrolls report, the data strengthens the case for the Fed to leave rates unchanged at its September meeting. A less aggressive monetary policy outlook generally benefits risk-oriented assets such as Bitcoin by reducing pressure from elevated borrowing costs and bond yields.
Comments from Fed officials, however, continue to send mixed signals. Chicago Fed President Austan Goolsbee suggested that recent inflation pressures are largely tied to temporary factors such as tariffs and energy costs, supporting a patient policy approach. In contrast, Cleveland Fed President Beth Hammack argued that inflation remains too high and that additional tightening may still be necessary to ensure price stability.
Market expectations have shifted accordingly. Fed funds futures now imply a little over a 65% chance of a rate hike before year-end, down sharply from nearly 85% a week ago. Although easing rate-hike expectations could provide a tailwind for Bitcoin, ongoing geopolitical tensions and elevated Oil prices continue to bolster demand for the US Dollar, limiting the cryptocurrency’s upside potential in the near term.
What could shape Bitcoin’s performance in the second half of August?
According to Simon-Peter Massabni, Head of Business Development at XS.com, Bitcoin is currently in a phase of rebuilding momentum rather than entering a fresh bearish trend. The cryptocurrency has been trading within a volatile $63,000–$65,000 range, repeatedly struggling to secure a decisive breakout above the $65,000 mark.
Despite headwinds from rising bond yields and broader market uncertainty, Massabni believes Bitcoin’s ability to hold relatively steady suggests that buyers have not exited the market. Instead, investors appear to be waiting for a stronger catalyst before increasing exposure.
Addressing Bitcoin’s muted response to softer US inflation data, he noted that much of the positive inflation outlook had already been priced in by the market. Since the latest inflation figures largely met expectations, they failed to deliver the surprise needed to spark a new wave of buying. Investors are now focusing less on inflation itself and more on whether the data will lead to a more accommodative Federal Reserve policy and improved liquidity conditions.
Looking ahead, Massabni maintains a cautiously optimistic outlook. His base-case scenario sees Bitcoin ending August near $70,000, with a potential trading range between $68,000 and $72,000. However, he expects the path higher to remain volatile, requiring BTC to reclaim the $67,000 level to reinforce bullish momentum. A sustained move below the $61,000–$62,000 region, meanwhile, could delay or invalidate this constructive outlook.
Bitcoin technical outlook: Stabilization signals are beginning to appear
Bitcoin was trading around $62,900 on Friday after a modest rebound in recent sessions. Since mid-July, BTC has largely moved sideways between the 78.6% Fibonacci retracement level at $65,520 and the 200-week Simple Moving Average (SMA) near $64,000, reflecting a prolonged consolidation phase.
A weekly close above $65,520 could strengthen the recovery outlook and open the door for a move toward the 61.8% Fibonacci retracement level around $78,490. Technical indicators on the weekly chart are showing early signs of improvement. The Relative Strength Index (RSI) has been trending higher, reaching 38, while the bullish MACD crossover formed in mid-July remains intact, suggesting that downside momentum may be fading.
On the other hand, failure to hold above the 200-week SMA could trigger renewed selling pressure, potentially exposing the ascending trendline support near $60,000.
From a daily-chart perspective, Bitcoin remains in a broadly corrective structure. The cryptocurrency continues to trade below key Exponential Moving Averages (EMAs) and has been confined to a $62,300–$66,500 range since mid-July.
Momentum indicators still favor caution. The daily RSI sits at 41, while the MACD histogram remains slightly negative, indicating that sellers retain a modest near-term advantage despite signs of stabilization.
Key support is located at $62,300. A decisive break below this level could accelerate losses toward the July 1 yearly low of $57,800. On the upside, initial resistance is seen at the 50-day EMA near $64,458, followed by the 100-day EMA around $66,589, which aligns closely with horizontal resistance near $66,500. Until BTC regains these levels on a sustained basis, rallies may continue to face selling pressure, keeping the broader recovery attempt in check.
Ethereum traded around $1,874 on Tuesday, down 2.8% over the past 24 hours after fluctuating between roughly $1,867 and $1,929. The key development was its rejection near $1,929 and the subsequent drop below the $1,900 level, undoing a four-day effort to establish that zone as support. Ethereum’s market capitalization currently stands near $228 billion, with approximately 120.5 million ETH in circulation.
The decline appeared to be driven primarily by broader market caution ahead of Wednesday’s U.S. inflation report rather than any Ethereum-specific weakness. Bitcoin also slipped below $64,000 during the period, while liquidations of leveraged positions added pressure across the crypto market. However, Ethereum continues to stand out because of a growing disconnect between its underlying fundamentals and price performance.
Staking participation reached a record 41.41 million ETH on August 4, representing nearly 34% of the circulating supply. With almost one-third of all ether locked in staking, alongside declining exchange balances and increasing corporate treasury accumulation, supply-side indicators continue to point toward tightening availability.
Despite these scarcity dynamics, Ethereum remains 62.2% below its 2025 all-time high of approximately $4,953 and only about 12.5% above its recent low of $1,666. By comparison, Bitcoin is down roughly 49% from its peak, leaving Ethereum underperforming by around 13 percentage points. This disparity suggests that supply constraints alone have not been sufficient to drive a stronger recovery.
Institutional demand, however, has been improving. Spot Ethereum ETFs attracted $244 million in net inflows last week—the strongest weekly intake since April 2026. On August 7 alone, the products recorded $49.6 million in inflows, marking a fourth straight day of positive demand. Since launch, cumulative net inflows into spot ETH ETFs have reached approximately $11.65 billion, while total net assets have climbed to $10.74 billion, equivalent to about 4.65% of Ethereum’s market value.
From a technical perspective, Ethereum remains at a critical juncture. The immediate pivot level is $1,890.41, with resistance located at $1,911.97, $1,950.63, and $1,972.19. Key support levels sit at $1,851.74, $1,830.18, and $1,791.52. Momentum remains moderately positive, with the daily RSI at 55.47. Meanwhile, the 20-day EMA near $1,868 and the 50-day EMA around $1,850 are separated by less than $18, highlighting the narrow margin supporting current prices.
The next major catalyst arrives with Wednesday’s U.S. CPI report. Economists expect headline inflation to rise 3.4% year-over-year and core inflation to come in at 2.5%. The outcome could determine whether Ethereum breaks above nearby resistance or slips below its tightly packed support structure.
Break Below $1,900 Resets Ethereum’s Near-Term Technical Outlook
Ethereum’s four-day effort to transform the $1,900 level from resistance into support has come to an end, and the nature of the breakdown may be more significant than the level itself.
During Tuesday’s session, ETH climbed to $1,929 before reversing sharply to $1,867, marking a swing of roughly $62, or 3.3%. The session high coincided with a cluster of major technical barriers, including the $1,927 resistance zone and the 100-day exponential moving average near $1,924. With several key reference points concentrated within a narrow range, the rejection reinforced the strength of that resistance area.
More importantly, the subsequent decline sliced through $1,900 with little resistance, suggesting the level had not yet developed meaningful buyer support despite holding for several sessions. Short-lived support zones often lack the depth needed to absorb selling pressure, making them vulnerable when momentum shifts.
At current levels around $1,874, Ethereum remains below the daily pivot point at $1,890.41 while staying above initial support at $1,851.74. This creates a relatively narrow trading corridor of roughly $39, or just over 2% of price, meaning a decisive move could emerge quickly.
Should ETH fall below $1,851.74, attention would shift to support levels at $1,830.18 and $1,791.52. The $1,840 region, which previously helped spark a rebound and coincided with improving ETF inflows, remains an important intermediate area. A sustained break beneath $1,830 could expose the market to a deeper decline toward $1,791, where stronger structural support resides.
On the upside, resistance levels are positioned at $1,911.97, $1,950.63, and $1,972.19. The $1,930 area remains the key hurdle. A successful break and hold above that threshold would likely revive bullish momentum and increase the probability of a move toward the broader $1,950–$2,000 zone, where a more meaningful breakout could develop.
From a broader perspective, Ethereum’s projected weekly trading range spans approximately $1,850 to $1,975, representing a 6.8% spread. With spot prices currently near $1,874, ETH remains in the lower portion of that range—a position it has occupied for much of the past three weeks, reflecting continued caution among market participants despite improving long-term supply dynamics.
Compressed EMA Structure Signals a Potential Volatility Breakout
Ethereum’s moving averages have converged into an unusually tight formation, a condition that often precedes a significant expansion in volatility.
The 20-day exponential moving average currently sits near $1,868, the 50-day EMA around $1,850, and the 100-day EMA near $1,924. The gap between the 20-day and 50-day averages is just $17.60—less than 1% of ETH’s price—while the distance between the 50-day and 100-day averages is approximately $74, or about 4%.
With Ethereum trading around $1,874, the asset remains above both the 20-day and 50-day EMAs but below the 100-day EMA. This configuration typically reflects a short-term recovery occurring within a broader medium-term downtrend. Similar setups have recently appeared in both Bitcoin and gold before notable directional moves emerged.
The narrow separation between the 20-day and 50-day EMAs is particularly important because it provides little technical support beneath current prices. A decline of roughly 1% would push ETH below both averages simultaneously, potentially accelerating selling pressure. When moving averages become tightly clustered, markets often experience sharp directional breaks rather than gradual trend shifts.
Simple moving averages reinforce a similar outlook. The 50-day SMA is projected to remain near current price levels in the coming weeks, while the 200-day SMA continues to trend lower. Rather than requiring a strong rally to reconnect with the long-term trend indicator, Ethereum may simply meet a declining 200-day average over time if prices remain range-bound.
That downward-sloping 200-day SMA remains one of the market’s most important structural features. As it gradually descends, it reduces the distance ETH must travel to challenge long-term resistance, increasing the likelihood of a decisive trend resolution in the months ahead.
Across timeframes, the technical picture remains mixed. Four-hour and daily charts continue to show improving momentum, with shorter-term moving averages rising beneath price. However, the weekly trend remains less constructive, as longer-term averages still sit above the market and point lower. In essence, Ethereum is recovering, but it has not yet fully repaired the broader bearish structure established earlier in the cycle.
Neutral RSI Leaves the Market Waiting for a Catalyst
Ethereum’s daily Relative Strength Index stands at 55.47, placing it comfortably above the neutral 50 level but well below the overbought threshold near 70.
This reading offers little directional guidance and instead reflects a market in consolidation mode ahead of a major macroeconomic event. Momentum indicators often flatten before high-impact data releases as traders reduce directional exposure while awaiting new information.
Compared with the capitulation conditions seen earlier this year, current market dynamics appear far healthier. During the February 2026 selloff, ETH experienced its steepest monthly decline of the cycle, ETF outflows intensified, and RSI readings plunged into deeply oversold territory. Those conditions ultimately helped establish the recovery low near $1,666.
Today’s environment is markedly different. Ethereum is trading near the lower end of its recent range, yet momentum remains neutral rather than oversold. This suggests that selling pressure has eased, but it does not necessarily indicate that buyers have regained control.
That distinction is particularly relevant ahead of the upcoming U.S. CPI release. If inflation exceeds expectations, Ethereum could face renewed downside pressure without the cushion of oversold technical conditions. Conversely, a softer inflation reading could ignite a rally from a neutral momentum base, leaving ample room for RSI to climb before signaling an overheated market.
Recent price action also reflects subdued volatility. Ethereum’s 24-hour range of approximately $62 is relatively modest by historical standards, indicating that traders are largely waiting for a catalyst before committing to a new directional move. Meanwhile, derivatives positioning suggests that recent selling was driven more by the unwinding of existing long positions than by aggressive new short activity.
For now, the daily pivot at $1,890.41 remains the key reference point. A move above that level would reinforce the case for consolidation and recovery toward higher resistance zones. A sustained break below it, however, would strengthen the argument that the market is entering a new phase of distribution and downside risk.
Record Staking Levels Highlight Ethereum’s Growing Supply Scarcity
Ethereum’s on-chain fundamentals continue to present one of the most striking contrasts in the digital asset market. While the price remains more than 60% below its all-time high, network participation and supply lockup metrics have never been stronger.
As of August 4, a record 41.41 million ETH was staked on the network, representing 33.98% of the circulating supply. Notably, this milestone was reached during a prolonged bear-market drawdown, indicating that validators continued to commit capital despite significant price weakness rather than withdrawing from the network.
At the same time, staking yields have moved in the opposite direction. The seven-day staking annual percentage rate has fallen to 2.66%, down from a peak above 5% in mid-2023. Because Ethereum’s staking rewards decline as participation increases, the surge in staked ETH has directly contributed to lower returns.
This creates an increasingly challenging investment equation. With the Federal Reserve’s policy rate sitting between 3.50% and 3.75% and the U.S. 10-year Treasury yield near 4.7%, staked ETH currently offers a lower yield than traditional fixed-income alternatives while exposing investors to cryptocurrency price volatility, validator risks, and liquidity constraints.
Yet participation continues to rise. In March, approximately 37 million ETH—around 31% of supply—was staked. Five months later, another 4.4 million ETH has entered the validator set despite further yield compression. The trend suggests that participants are prioritizing long-term network exposure over short-term income generation.
The resulting supply structure is becoming increasingly restrictive. With roughly one-third of all ETH staked, declining exchange balances, and growing corporate treasury allocations, a substantial portion of circulating supply is effectively removed from active trading. As a result, more than half of Ethereum’s available supply is held in long-term structures that rarely participate in day-to-day market activity.
This tightening supply profile remains one of the strongest long-term bullish arguments for Ethereum. However, recent price action demonstrates that supply scarcity alone is insufficient to drive appreciation without a corresponding increase in demand.
Validator Growth Suggests a Shift Toward Institutional Participation
Beyond the headline staking figures, validator activity offers additional insight into changing market dynamics.
After declining to roughly 880,000 active validators during the first half of 2026, the validator count has recently rebounded to approximately 893,000. The increase of around 13,000 validators is particularly noteworthy because it occurred while staking yields remained near multi-year lows.
This suggests that the new participants entering the network may differ significantly from those who exited. Operators willing to accept yields near 2.66% are likely either more cost-efficient, more focused on long-term asset ownership, or less dependent on staking returns as a primary source of revenue. These characteristics are generally more consistent with institutional participants than with smaller retail operators.
From a market-structure perspective, this shift is significant. Institutional validators are typically less sensitive to short-term yield fluctuations and more likely to hold assets for strategic purposes, such as treasury management, custodial services, or investment product mandates. As a result, the portion of ETH locked in staking becomes increasingly “sticky” and less responsive to market volatility.
One factor supporting this trend is the growing integration of staking into institutional investment products. The introduction of staking-enabled spot Ethereum funds has allowed professional investors to gain ETH exposure while also earning network rewards, making staking more attractive within regulated investment frameworks.
If institutional participation continues to expand, Ethereum’s supply available for trading could tighten even further. However, the trend also introduces new considerations. A validator ecosystem increasingly concentrated among large operators may raise concerns around governance influence, network centralization, and potential bottlenecks during periods of elevated withdrawal activity.
Overall, the combination of record staking participation, rising validator counts, and shrinking liquid supply points to a structurally tightening Ethereum market. The key question remains whether demand can eventually catch up to these increasingly restrictive supply dynamics.
The demand side of the Ethereum market has shown clear signs of improvement, supported by a meaningful recovery in spot ETF flows.
Spot Ethereum ETFs attracted $244 million in net inflows last week, marking their strongest weekly performance since April 2026. Momentum also improved on a daily basis, with the sector recording four consecutive sessions of positive flows. On August 7 alone, net inflows reached $49.6 million, led primarily by BlackRock’s ETF, which accounted for more than three-quarters of the day’s total, while Fidelity’s product also contributed notable demand.
Total net assets held by spot Ethereum ETFs have now risen to approximately $10.74 billion, representing about 4.65% of Ethereum’s total market capitalization. Meanwhile, cumulative assets under management across the broader ETF ecosystem have expanded to roughly $13.7 billion, reflecting growing institutional participation.
July marked an important turning point. The ETF sector generated more than $365 million in net inflows during the month, reversing the outflow trend that dominated much of the first half of 2026. This shift suggests that regulated investors have become increasingly willing to accumulate Ethereum exposure following months of weak sentiment and price declines.
The recent inflows largely coincided with Ethereum’s rebound from the $1,840 area and appeared to support expectations that the market could break decisively above the $1,900 resistance zone. However, Tuesday’s rejection near $1,929 and subsequent drop back below $1,900 indicate that selling pressure at those levels outweighed the ETF-driven demand, at least in the short term.
It is important to distinguish between daily flow data and broader trends. Individual sessions can be volatile and often provide limited insight into institutional conviction. For example, the ETF complex experienced net outflows at the end of July before quickly shifting back into accumulation mode. What matters more is the emergence of sustained multi-day inflow streaks.
By that measure, the latest data is encouraging. Four straight sessions of positive flows combined with a $244 million weekly inflow represent the strongest period of institutional accumulation since April. Notably, these purchases occurred while Ethereum traded between roughly $1,840 and $1,930, suggesting that investors were willing to add exposure despite ongoing uncertainty around the broader market outlook.
Positive Flows Matter, but Scale Remains a Constraint
While ETF demand has improved, its overall scale remains relatively modest compared with the size of the Ethereum market.
A weekly inflow of $244 million represents only about 0.11% of Ethereum’s $228 billion market capitalization. Although this is a meaningful amount of capital, it is not yet large enough to single-handedly drive a sustained trend reversal.
Interestingly, Ethereum’s ETF inflows have recently been proportionally larger than those seen in Bitcoin products relative to market size. This means that each dollar entering Ethereum ETFs can have a greater impact on price dynamics. However, because the total amount of capital involved remains smaller, the support provided by these flows is still limited compared with broader market forces.
Historical precedent also highlights the importance of persistence. Earlier in 2026, Ethereum experienced a much stronger institutional demand wave, including a lengthy inflow streak and a surge in daily purchases driven by enthusiasm surrounding staking-enabled investment products. While that episode initially boosted sentiment, inflows eventually cooled and failed to sustain upward momentum.
The current recovery in ETF demand is therefore a constructive development rather than definitive proof of a lasting trend change. To materially alter Ethereum’s market structure, the recent inflow streak will likely need to continue and broaden into a longer period of sustained institutional accumulation.
For now, ETF data suggests that demand is improving and that professional investors are gradually returning to the market. Whether that demand becomes strong enough to overcome key resistance levels and support a larger recovery remains one of the central questions for Ethereum in the months ahead.
Bitcoin dropped under the $65,000 mark on Monday, retreating as higher oil prices dampened investor appetite for risk. Market sentiment was also affected by another Bitcoin sale from major corporate holder Strategy.
The leading cryptocurrency was down 1.6%, trading at $64,147.9 as of 17:00 ET (21:00 GMT).
Traders focus on U.S. inflation data for Federal Reserve signals
Bitcoin and the broader crypto market gained support on Friday after U.S. employment data revealed the first monthly decline in nonfarm payrolls since February, driven largely by losses in local government education jobs. Payroll figures for May and June were also revised down by a combined 103,000 positions.
The labor report added uncertainty to the Federal Reserve’s policy outlook. While the broader job market continues to show resilience, inflation concerns remain elevated due to volatile oil prices linked to the conflict involving Iran. Some Fed officials also indicated a preference for tighter monetary policy during the central bank’s July meeting.
Following the data release, traders reduced expectations for a September interest-rate increase. Higher borrowing costs typically reduce demand for risk-sensitive assets, including cryptocurrencies.
Investors are now turning their attention to a series of key U.S. inflation reports this week for further guidance on the Fed’s next moves. The July Consumer Price Index (CPI) is due on Wednesday, followed by the Producer Price Index (PPI) on Thursday, while July retail sales data will be released on Friday.
Oil surge and Hormuz tensions weigh on crypto sentiment
Oil prices jumped nearly 5% on Monday after Iran rejected direct negotiations with the United States and reiterated that a full reopening of the Strait of Hormuz would depend on Washington meeting a series of demands. Concerns over global energy supplies intensified further following attacks by Iran-backed Houthi forces on Saudi energy facilities, prompting investors to seek safety in the U.S. dollar.
Crude prices had fallen the previous week on optimism surrounding potential U.S.-Iran talks. However, those losses narrowed as Tehran repeatedly denied claims of ongoing negotiations and reports emerged that a proposed Hormuz management framework could restrict access for U.S., Israeli, and other vessels deemed hostile.
Iranian state media reported that a parliamentary committee had approved the framework, including the proposed restrictions. Foreign Ministry spokesman Esmaeil Baqaei said Iran and Oman were still working on a joint statement governing the strait, adding that the plan would establish monitoring mechanisms for vessel traffic and involve compensation arrangements.
Tehran also reaffirmed that direct talks with Washington remain off the table, citing alleged breaches of the temporary peace agreement reached in June. Iranian officials maintained that lifting sanctions, ending the U.S. naval presence, and compensation for wartime damages are prerequisites for fully reopening the strategic waterway.
U.S. President Donald Trump responded by stating that Iran’s compensation demands would be met with U.S. claims for damages as well, adding that his negotiating team had been instructed to include the issue in any future discussions.
Strategy trims Bitcoin holdings
Separately, Strategy disclosed in a filing with the U.S. Securities and Exchange Commission that it sold 1,690 Bitcoin between August 3 and August 9 for approximately $108.6 million, at an average price of $64,262 per coin.
Following the sale, the company’s Bitcoin holdings declined to 840,447 BTC, currently worth about $54.7 billion. Strategy’s average acquisition cost remains around $75,385 per Bitcoin, representing a total investment of roughly $63.4 billion, including related expenses.
The transaction came shortly after the company raised $653.1 million through the sale of more than 6.5 million shares of MSTR stock. Strategy said the proceeds were used to repurchase over 1.15 million shares of its STRC preferred stock and strengthen its cash position, which stood at $4.65 billion as of August 9.
Altcoins track Bitcoin lower
The broader cryptocurrency market also traded in negative territory on Monday, with most major altcoins posting losses alongside Bitcoin.
Ethereum declined 2.4% to $1,877.78.
XRP dropped 2.3% to $1.0189.
Solana lost 1.3%.
Cardano fell 2.6%.
Dogecoin slipped 1%.
The pullback across digital assets reflected a combination of risk-off sentiment driven by geopolitical uncertainty, rising energy prices, and investor caution ahead of key U.S. inflation data later this week.
Optimism surrounding a potential US-Iran agreement has weighed on oil prices, helping ease concerns about inflation.
US equities have climbed to fresh record highs, but the still-weak correlation between BTC and the S&P 500 has limited Bitcoin’s upside momentum.
Continued net inflows into spot Bitcoin ETFs are providing additional support for the cryptocurrency.
Technical outlook: Bitcoin maintains a constructive bias while holding above key support levels, with traders watching for a breakout that could trigger the next leg higher.
Bitcoin remains comfortably above the $64,000 mark, supported by growing optimism over potential U.S.-Iran peace talks and renewed inflows into spot Bitcoin ETFs. Despite these tailwinds, BTC has gained only about 0.7% over the past 24 hours, lagging the broader rally in risk assets.
Market sentiment improved as hopes increased that the U.S. and Iran could reach an agreement to reopen the Strait of Hormuz. Oil prices have fallen for a third consecutive session and are down roughly 10% this week. U.S. Treasury Secretary Scott Bessent indicated that an agreement to restore shipping through the strategic waterway could be reached within days.
The decline in oil prices has helped ease inflation concerns, pushing Treasury yields lower. If the trend persists, investors may further reduce expectations for a more hawkish Federal Reserve stance.
Markets are currently assigning a 59% probability to a Fed rate hike in September, down from 65% a day earlier. The shift in rate expectations has also weighed on the U.S. dollar, creating a more favorable backdrop for Bitcoin and other risk-sensitive assets.
Meanwhile, optimism surrounding a potential Middle East agreement and renewed enthusiasm for AI-related investments have driven U.S. equities to fresh highs, with both the S&P 500 and Dow Jones reaching record levels.
Bitcoin, however, has not mirrored the strength seen in stocks. A relatively weak 30-day correlation between BTC and the S&P 500 helps explain the divergence, suggesting that broader risk-on sentiment alone may not be enough to fuel a major breakout. Instead, Bitcoin may require a crypto-specific catalyst to generate stronger upside momentum.
Institutional Demand Continues to Support Bitcoin
Institutional interest in Bitcoin is showing encouraging signs. Data from SoSoValue revealed that spot Bitcoin ETFs attracted $211.5 million in net inflows on Tuesday, following another strong session that saw $170.1 million in net inflows the day before.
If ETF demand remains robust and Bitcoin begins to strengthen its positive correlation with equity markets, these flows could provide additional support for higher prices. On the other hand, if institutional participation fails to accelerate meaningfully, BTC may continue to underperform despite the broader rally across risk assets.
Looking ahead, market focus is shifting toward upcoming U.S. economic data. Investors will closely monitor the ISM Services PMI release, followed by Friday’s nonfarm payrolls report, both of which could offer important clues about the Federal Reserve’s next move on interest rates and influence Bitcoin’s near-term direction.
Bitcoin has pushed back above the $64,000 level, but the broader technical picture remains slightly bearish. The price continues to trade below the 50-day EMA near $64,600, as well as the 100-day and 200-day EMAs, indicating that the recent advance may still be a corrective rebound within a larger downtrend. Meanwhile, the RSI remains near neutral territory, highlighting a lack of strong bullish or bearish momentum.
On the downside, failure to regain the 50-day EMA could trigger a retest of support around $62,500, which marks both the weekly low and the mid-July trough. A move below this level would bring the psychologically important $60,000 threshold into focus, followed by the 2026 low near $57,700. A break beneath $57,700 would confirm a lower low, increasing the risk of a deeper decline toward $55,000 and potentially $50,000, levels not seen since 2024.
For the bullish outlook to strengthen, Bitcoin must first reclaim the 50-day EMA at $64,600 and then break above the July peak near $67,000. Such a move would establish a higher high and could pave the way for a test of the 200-day EMA, currently located around $72,500.
Gold has undergone a sharp correction over the past six months after reaching an exceptionally overheated peak during its strongest cyclical bull market on record. While the pullback damaged technical indicators and weakened investor sentiment, the price action has gradually formed a large falling-wedge pattern—a chart formation that often signals a bullish breakout.
By late January, gold had surged nearly 196% in less than 28 months, marking its biggest cyclical rally in US-dollar terms. The advance became increasingly parabolic, with prices climbing more than 43% above the 200-day moving average—the most overbought reading in almost 46 years. Such extreme conditions pointed to an inevitable correction, and historical comparisons suggested a sizable retracement was likely. Gold subsequently fell about 18.6% over less than two months, broadly matching expectations.
Although that decline may have established a temporary bottom, renewed geopolitical tensions between the US and Iran, expectations of safe-haven flows into the US Dollar, regional central-bank selling, and concerns over further Federal Reserve tightening prolonged the downturn. At the same time, investors have been adjusting to the Fed’s evolving communication strategy under its new leadership, adding further uncertainty. As a result, gold’s correction deepened to roughly 26% by late July, exceeding the average drawdowns seen after previous major bull markets.
Despite the extended weakness, selling pressure has noticeably eased. More than 70% of the total decline occurred during the early phase of the correction, while subsequent losses have become progressively smaller. This slowdown has created a descending support line, whereas increasingly cautious investor sentiment has driven lower highs at a faster pace, producing a steeper resistance line. Together, these converging trendlines have formed a classic falling-wedge pattern.
Falling wedges are characterized by narrowing downward-sloping trendlines, with resistance declining faster than support. They are also typically accompanied by weakening trading volume as bearish sentiment discourages buying activity. As prices become increasingly compressed within the pattern, the setup often culminates in a breakout, making the current technical structure a potentially constructive signal for gold.
Gold’s steep-looking falling-wedge pattern appears more dramatic because it is plotted against the backdrop of the largest cyclical bull market in its history. On a shorter six-month chart, however, the decline looks far less severe. As prices continue to compress between converging support and resistance trendlines, a breakout is drawing closer. Given the nature of falling wedges, the odds favor an upside resolution, potentially marking the beginning of a fresh bullish leg as selling pressure continues to fade and buyers gradually regain control.
Falling wedges are widely regarded as reversal patterns because prolonged declines eventually exhaust selling momentum, leaving fewer sellers while attracting bargain hunters. Although chart patterns alone are not enough to justify investment decisions, they become more compelling when supported by sentiment, technical signals, and underlying fundamentals. In gold’s case, the current wedge follows an extended correction rather than a speculative peak, making it consistent with the characteristics of a potential bottoming formation.
Investor sentiment also reinforces the bullish outlook. After months of losses, enthusiasm for gold has largely faded, with many traders either indifferent or expecting further declines. At the same time, gold reached its most oversold level relative to its 200-day moving average in nearly a decade during mid-July, suggesting downside momentum may be becoming exhausted. Historically, such deeply oversold conditions have often created attractive entry points for long-term investors.
The macro backdrop is also becoming more supportive. Markets appear to be reacting less aggressively to geopolitical headlines surrounding the US-Iran conflict, while fears of additional Federal Reserve rate hikes have started to lose their impact. Despite a more hawkish-than-expected Federal Open Market Committee (FOMC) meeting, gold posted gains instead of extending its losses, a sign that buyers are becoming more resilient as the correction matures.
Fundamentals further strengthen the bullish case. Gold futures positioning indicates that speculative long exposure remains relatively low, leaving ample room for new buying. Investor allocations to gold also remain historically depressed, with the combined value of holdings in major US gold ETFs accounting for only a tiny fraction of the S&P 500’s market capitalization. Even a modest increase in portfolio allocations could generate meaningful demand for bullion. Meanwhile, global central banks continue to accumulate gold at a strong pace, with second-quarter purchases surging from a year earlier according to the latest Gold Demand Trends report.
Seasonal trends add another layer of support, as gold typically performs well through autumn, winter, and spring during bull markets. If gold breaks decisively above the falling-wedge resistance, mining stocks could outperform the metal itself thanks to their operational leverage. Taken together, oversold technicals, subdued investor positioning, supportive fundamentals, and favorable seasonality suggest that the current correction may be nearing its end, with a sustained bullish reversal becoming increasingly likely.
Bitcoin retreats below the $64,000 mark despite renewed inflows into spot Bitcoin ETFs. Ethereum’s recovery remains limited below the 100-day EMA, with the decline extending beneath the $1,900 level. Meanwhile, XRP continues to trade sideways within the $1.05–$1.10 range, supported by more than $7 million in ETF inflows recorded so far this week.
The cryptocurrency market broadly moved lower on Friday as investors continued to weigh rising macroeconomic uncertainty and escalating geopolitical risks in the Middle East. Bitcoin (BTC) slipped below the $64,000 level after reaching a weekly high of $65,745, while major altcoins Ethereum (ETH) and Ripple (XRP) remained under pressure below $1,900 and $1.10, respectively.
Investor sentiment weakened further throughout the week, with the Crypto Fear & Greed Index falling to 25, placing the market firmly in “Fear” territory compared with 28 the previous day. The decline reflects cautious positioning as traders assess inflation risks, monetary policy uncertainty, and broader global tensions.
Despite the negative sentiment, institutional demand for crypto investment products remained resilient. The Federal Reserve kept interest rates unchanged at 3.50%–3.75% on Wednesday, although three officials pushed for a 25-basis-point increase, reigniting concerns over inflation and triggering volatility across financial markets.
According to analysts at Crypto Finance, these developments caused a sharp repricing in interest-rate expectations and equities before stronger corporate earnings helped stabilize investor confidence.
Meanwhile, spot crypto ETF inflows continued to improve. Bitcoin ETF inflows rose to $233 million on Thursday, up significantly from $32 million the previous day. Data from SoSoValue shows cumulative Bitcoin ETF inflows approaching $52 billion, highlighting continued long-term institutional confidence in the asset.
Ethereum ETFs saw more mixed activity, recording around $13 million in inflows on Thursday after experiencing $19 million in outflows on Wednesday. XRP ETFs also attracted stronger demand, with inflows climbing to nearly $6 million on Thursday and total weekly inflows exceeding $7 million, suggesting growing institutional interest despite broader market weakness.
Bitcoin Technical Outlook
Bitcoin is trading around $63,969, maintaining a bearish short-term structure as it remains below the 50-day, 100-day, and 200-day exponential moving averages (EMAs). The 50-day EMA near $64,904 represents the closest resistance level, while the 100-day EMA at $67,460 and the 200-day EMA around $72,977 remain key barriers for a potential recovery.
Momentum indicators continue to signal caution. The Relative Strength Index (RSI) remains slightly below the neutral zone, while the MACD histogram stays negative, indicating persistent downside pressure.
On the downside, Bitcoin lacks strong technical support on the current timeframe, leaving the market vulnerable to further declines toward previous lows and psychological levels around $62,000 and $60,000.
Analysts at Crypto Finance noted that while bears have struggled to gain strong momentum, the lack of a fresh bullish catalyst remains a significant challenge for Bitcoin’s recovery.
Ethereum Technical Outlook
Ethereum is trading near $1,890 after retreating from its weekly high of $1,981. The cryptocurrency remains capped below the 100-day EMA at approximately $1,932 and significantly below the 200-day EMA near $2,173, keeping the broader outlook bearish.
Although ETH is holding above the 50-day EMA around $1,850, sellers continue to defend the descending resistance trendline. The RSI near 54 indicates limited bullish momentum, while the MACD turning negative suggests further upside attempts may face resistance.
A breakout above the descending trendline could open the way toward $1,932 and eventually $2,173. However, a daily close below the 50-day EMA could increase downside risks toward $1,800 and $1,600.
XRP Technical Outlook
XRP is trading around $1.07, maintaining a bearish short-term outlook as it remains below its key moving averages. The price is trading beneath the 50-day EMA at $1.13, the 100-day EMA at $1.21, and the 200-day EMA at $1.41.
Momentum indicators remain weak, with the RSI near 44 and the MACD slightly negative, suggesting that any recovery attempts may encounter renewed selling pressure.
Immediate resistance is located near the 78.6% Fibonacci retracement level around $1.12, followed by the 50-day EMA at $1.13. A stronger recovery would require XRP to overcome resistance levels around $1.21, $1.28, and $1.34.
On the downside, the key support level remains near $1.01, corresponding to the 100% Fibonacci retracement area, where buyers may attempt to defend the previous swing low.
Overall, the crypto market remains under pressure as macro uncertainty and geopolitical risks weigh on sentiment. While ETF inflows indicate continued institutional interest, Bitcoin, Ethereum, and XRP must overcome key technical resistance levels to regain bullish momentum.
The cryptocurrency market capitalisation remained largely unchanged over the last 24 hours, holding near $2.24 trillion. Despite a stronger US dollar and a cautious tone across equity markets, digital assets continue to trade close to recent highs, suggesting a period of consolidation. Market sentiment softened slightly, with the Fear & Greed Index slipping from 33 to 31, though it remains firmly within the “fear” zone. Among major altcoins, Hedera (+6%), Uniswap (+4.4%), and Aptos (+3.6%) led the gains, while Filecoin (-4.9%), Stellar (-2.6%), and Bitcoin Cash (-2.4%) posted the largest declines.
Bitcoin fell to around $65.4K, marking a second consecutive daily decline after testing its June highs. The retreat has reinforced concerns that sellers still dominate the broader trend, limiting the rebound’s ability to evolve into a sustained recovery. Technically, the 61.8% Fibonacci retracement of the May–June decline continues to act as a key resistance level.
Ethereum also lost upward momentum near $1,950, failing on its initial attempt to reclaim a former support area that has now become resistance. The lack of significant support levels between current prices and the $1,750–1,800 region leaves the asset vulnerable to further weakness. A decisive move below $1,700 would increase the risk of a broader bearish trend reasserting itself.
News Background
Bitcoin has entered what some analysts describe as an extreme undervaluation zone, with the MVRV ratio reportedly falling below 5%, according to market analyst Crypto Tice. Historically, readings at similar levels have often coincided with major cyclical lows, suggesting that Bitcoin could be approaching a long-term bottom.
Analyst CryptoPatel believes Bitcoin could climb to $116,000 by year-end, arguing that the market has already established its bear-market low and is now entering the early stages of a trend reversal, similar to the recovery that followed the 2022 downturn.
Data from Artemis shows that the combined assets held by digital asset treasury (DAT) companies have dropped from approximately $120 billion to $75 billion since October, a decline of more than one-third. The contraction reflects the broader impact of Bitcoin’s price weakness on corporate crypto holdings.
Meanwhile, Satsuma Technology, the United Kingdom’s second-largest corporate Bitcoin holder, plans to liquidate its entire reserve of 668 BTC. The company accumulated the position beginning in August 2025 at an average purchase price of $113,200 per Bitcoin. Following a collapse of more than 99% in its share price from peak levels, Satsuma is also preparing for delisting from the London Stock Exchange.
According to on-chain analytics firm CryptoQuant, Bitcoin reserves held by miners outside exchanges have declined by 72% since late 2021, falling to roughly 139,700 BTC. The steady reduction over the past four years suggests miners have continued to draw down their holdings amid changing market conditions.
In the broader digital asset ecosystem, Solana has started preparing network validators for the rollout of its highly anticipated Alpenglow upgrade. The update, scheduled to be implemented in stages between August and October, is expected to increase transaction processing speeds by as much as 80 times, significantly enhancing the network’s performance and scalability.
XRP remains under pressure, trading within a relatively narrow range between $1.10 and $1.15.
RippleX Principal Engineer Ayo Akinyele projects that agentic transactions could climb to 10 million after recently surpassing the 1 million mark.
The XRP Ledger continues to attract developers by offering an efficient and seamless infrastructure for digital payments.
XRP is edging lower on Thursday, though losses remain modest, with the token holding above the $1.13 level. The cross-border payment cryptocurrency reached a weekly peak of $1.16 on Tuesday, supported by progress surrounding the US Clarity Act and growing indications that inflationary pressures in the United States are easing.
Despite these positive developments, ongoing geopolitical tensions between the US and Iran continue to dampen appetite for risk-sensitive assets. This cautious mood is reflected in the cryptocurrency market, where the Fear & Greed Index remains firmly in the Fear zone. Investor sentiment slipped to 31 on Thursday from 33 a day earlier, reducing demand for XRP and related digital asset products.
RippleX records over 1 million agentic AI transactions
RippleX, the development arm behind the XRP Ledger, has achieved a significant milestone, with agent-driven AI transactions now exceeding 1 million.
Speaking to The Block, RippleX Principal Engineer Ayo Akinyele said he expects adoption to accelerate substantially, potentially pushing the total number of agentic transactions beyond 10 million in the near future.
According to Akinyele, the figure could eventually surpass 100 million within a few years as AI technologies advance and the supporting infrastructure becomes increasingly efficient.
Agentic payments are transactions initiated and completed by autonomous AI systems without requiring human approval at every step. Operating within predefined parameters such as spending limits and policy rules, these AI agents can independently determine how and when to make payments in pursuit of specific objectives.
As AI capabilities continue to improve, developers are increasingly embracing agentic transaction models. Autonomous agents can monitor systems, purchase data, access computing resources, and pay for various digital services needed to carry out assigned tasks.
Akinyele emphasized that RippleX is focused on creating a seamless payment experience for AI agents using the XRP Ledger, highlighting the network’s settlement efficiency as a key advantage for handling API payments and other digital service transactions.
Price Analysis: XRP Recovery Loses Steam as Bearish Pressure Persists
XRP remains supported above the $1.13 level, but its recovery is struggling to gain traction as the token continues to trade beneath several important Exponential Moving Averages (EMAs). The 50-day EMA near $1.15, the 100-day EMA around $1.23, and the 200-day EMA at $1.44 continue to act as significant resistance barriers. Nevertheless, XRP is holding above the Bollinger Bands’ midpoint at $1.11, indicating that buyers are still providing some support. Meanwhile, the Relative Strength Index (RSI) sits near 54, reflecting modest bullish momentum without signaling overbought conditions.
The Moving Average Convergence Divergence (MACD) indicator also remains above the zero line, suggesting that the recent rebound is still intact, although the broader market structure remains constrained by overhead resistance.
On the upside, the first obstacle for bulls is the 50-day EMA near $1.15, followed closely by the upper Bollinger Band around $1.16. If buying pressure strengthens, the next targets are the 100-day EMA at approximately $1.23 and the 200-day EMA near $1.44. On the downside, immediate support is located at the Bollinger Bands’ midpoint around $1.11, while stronger support emerges near the lower Bollinger Band at $1.06. A decisive move below this area could pave the way for a deeper corrective decline.
Bitcoin Reclaims Key Resistance as ETF Demand Returns
Bitcoin surged back above a critical resistance level that has defined trading over the past month, climbing to around $65,800, up 2.55% over the previous 24 hours after briefly topping $66,000. Trading volume exceeded $31 billion, helping extend its seven-day gain to 5% and pushing its 30-day return into positive territory at 2.44%. This marks Bitcoin’s first positive monthly performance since plunging to a 21-month low near $57,800 in late June.
The recovery above $65,000 is significant because the level has acted as a major technical barrier throughout the month. Bitcoin spent weeks trading below its 50-month EMA around $65,150, with repeated rebound attempts failing to break through. Moving above this resistance and maintaining gains on stronger volume suggests that the intense selling pressure that drove prices lower may be fading. As a result, Bitcoin’s market capitalization has rebounded to approximately $1.3 trillion.
The rally was not driven by a single event but rather a combination of supportive factors. Spot Bitcoin ETFs recorded five consecutive sessions of net inflows, geopolitical tensions between the United States and Iran showed signs of easing, and exchange balances continued to decline as large holders reduced selling activity. Together, these developments created Bitcoin’s strongest 24-hour performance in more than a month.
A key theme behind the rebound is the return of demand through spot Bitcoin ETFs. Throughout much of 2026, weak ETF inflows limited Bitcoin’s ability to sustain rallies. The recent five-day buying streak has effectively reversed part of June’s sharp decline and could pave the way for a move toward $68,000, provided support levels hold.
However, risks remain. The Federal Reserve’s July 28–29 meeting could introduce fresh volatility, and Bitcoin is still down roughly 25% year-to-date. Earlier ETF inflow recoveries this year were often followed by renewed outflows after major macroeconomic events. While the breakout above $65,000 is encouraging, the next several trading sessions will determine whether it becomes a solid foundation for further gains or merely another temporary recovery.
ETF Inflows Provide the Fuel
The main catalyst behind Bitcoin’s rebound has been the return of institutional demand through spot Bitcoin ETFs. The sector has now recorded its first five-day inflow streak since April, signaling renewed accumulation after months of persistent redemptions. For many market participants, the lack of ETF demand was the primary reason Bitcoin struggled to gain momentum throughout 2026.
On Monday alone, US spot Bitcoin ETFs attracted approximately $227 million in net inflows. These inflows directly impact the spot market because ETF issuers must purchase physical Bitcoin to back newly created shares. As a result, ETF flow trends have become one of the most important drivers of Bitcoin’s price action.
The latest inflow streak also represents an important psychological shift. Earlier in July, a brief three-day inflow period totaling $510 million interrupted a damaging 10-day outflow streak of $2.73 billion. While that provided initial stabilization, the current five-day run has delivered enough buying pressure to push Bitcoin decisively above the key $65,000 resistance level.
Assets held across US spot Bitcoin ETFs have recovered toward $79 billion, while cumulative net inflows since their launch in January 2024 have risen to $51.63 billion. These figures highlight a recovery in investor confidence rather than a continuation of the previous downturn.
Since their introduction, spot Bitcoin ETFs have become one of the most influential sources of demand for the cryptocurrency, offering regulated access for institutional investors such as pension funds, wealth managers, and financial advisors. When ETF inflows are strong, Bitcoin benefits from a consistent source of buying pressure. When flows weaken, prices often struggle to find support. The recent five-day inflow streak has restored that demand, helping Bitcoin reclaim a level that had repeatedly capped previous rallies. The market’s focus now shifts to whether this momentum can survive upcoming macroeconomic events, particularly the Federal Reserve meeting.
IBIT Takes the Lead, Signaling Institutional Demand Is Back
Among all spot Bitcoin ETF flow metrics, the most closely watched indicator is which fund attracts the most capital. On Monday, the answer was clear: BlackRock’s IBIT led the market with $116 million in net inflows, a development widely viewed as a sign of renewed institutional participation rather than short-term speculative buying.
The distinction is important. IBIT is considered the strongest proxy for institutional positioning within the spot Bitcoin ETF market. Given its massive asset base, each dollar flowing into the fund typically translates into larger underlying Bitcoin purchases compared with smaller ETF competitors. When IBIT leads inflows, it suggests that long-term investors are accumulating exposure rather than traders simply buying a temporary dip.
The broader ETF picture also reflected widespread buying interest. IBIT attracted $116.5 million, while ARK 21Shares added $72.7 million, Fidelity brought in $24.1 million, Bitwise gained $8.8 million, Morgan Stanley’s offering received $6.9 million, and VanEck collected $1.8 million. Meanwhile, the two Grayscale products moved in opposite directions, with the legacy trust losing $45.4 million while the lower-fee version gained $41.4 million. Combined, these flows produced approximately $227 million in net inflows, helping Bitcoin break above the crucial $65,000 level.
The composition of the inflows matters as much as the total. Earlier in July, sessions led by Fidelity or ARK while IBIT continued to experience outflows were viewed as tactical positioning or retail-driven activity. In contrast, when IBIT became the leading recipient of inflows—such as the $209.4 million inflow on July 6 and the $116 million gain on Monday—the market interpreted it as a much stronger signal of institutional accumulation.
IBIT itself posted a 1.55% increase in net asset value during Monday’s session, reflecting Bitcoin’s rise in the spot market. Its influence on the ETF ecosystem is substantial. The fund accounted for nearly 79% of June’s record ETF outflows, making its return to positive flows particularly meaningful. Because of its size, IBIT has the ability to drive sentiment and liquidity across the entire ETF complex. For now, that influence is working in Bitcoin’s favor, although investors remain focused on whether the trend can continue through the upcoming Federal Reserve meeting.
June’s Selloff Created the Foundation for the Recovery
To appreciate why a $227 million inflow day is attracting so much attention, it is important to understand the scale of June’s decline. June 2026 became the worst month ever for spot Bitcoin ETFs, with approximately $4.5 billion leaving the sector, surpassing the previous record outflow of $3.56 billion recorded in February 2025. IBIT alone accounted for nearly 79% of those redemptions.
The asset decline was dramatic. Total assets held by spot Bitcoin ETFs fell from more than $104 billion in mid-May to roughly $77 billion at the height of the June selloff. At the same time, Bitcoin dropped from above $93,000 at the start of 2026 to around $60,000 by the end of June, briefly touching a 21-month low near $57,800.
Unlike previous crypto bear markets, this downturn was not triggered by failures within the digital asset industry. There were no major exchange collapses, stablecoin de-peggings, or systemic credit crises. Instead, the decline was largely driven by macroeconomic pressures, including a hawkish Federal Reserve and heavy institutional ETF outflows.
This difference is crucial because recoveries from macro-driven selloffs tend to be faster than recoveries from structural crises. The underlying infrastructure remained intact throughout the downturn; only investor positioning changed. As a result, the return of ETF inflows has the potential to reverse the damage more quickly than in previous cycles.
That is why the recent five-day inflow streak is viewed as more than just a short-term rebound. It suggests that capital which exited due to macroeconomic concerns may now be returning as those concerns begin to ease. Compared with a backdrop of record outflows and a 21-month price low, Bitcoin’s move back above $65,000 appears to be the early stages of a mechanical recovery driven by the same flows that fueled the selloff.
Bulls and Bears Remain Divided
The institutional outlook for Bitcoin remains sharply split. One camp has become increasingly cautious, with at least one major financial institution cutting its 12-month Bitcoin target from $112,000 to $82,000 on July 1. The bank also projected zero net ETF inflows over the next year, citing stalled cryptocurrency legislation in Washington and concerns about weak institutional demand.
This bearish view argues that the ETF demand engine that powered Bitcoin’s rise in 2024 and 2025 has fundamentally weakened. If that assessment is correct, then every inflow streak seen this year—including the current one—would represent a temporary bounce rather than the start of a sustained bull market.
The opposing camp believes the June correction effectively flushed out weak holders and that the return of IBIT-led inflows marks the beginning of a more durable recovery. Supporters of this view argue that the recent inflow streak has already halted the systematic selling pressure that drove Bitcoin to its lows.
A more moderate perspective compares Bitcoin ETF adoption to the historical development of gold ETFs. Under this framework, periods of strong gains are naturally followed by significant corrections before long-term growth resumes. From this viewpoint, Bitcoin’s recent volatility may simply be part of a broader maturation process rather than a sign of structural weakness.
Ultimately, the debate will be decided by ETF flows. If inflows continue beyond the Federal Reserve meeting and develop into a sustained multi-week trend, confidence in a stronger recovery could grow and higher price targets may return. If flows weaken again, the bearish argument that institutional demand remains fragile will gain credibility. For now, however, the recent five-day inflow streak has shifted momentum back toward the bullish side of the market.
Exchange Outflows and Whale Activity Strengthen the Bullish Narrative
Beyond ETF inflows, on-chain data is also providing evidence that Bitcoin’s recovery may have stronger foundations. In a single day, roughly $686 million worth of Bitcoin was withdrawn from Binance, Coinbase, and Bybit, a substantial exchange outflow that is typically interpreted as investors moving coins into long-term storage rather than keeping them on exchanges for potential sale. When exchange balances decline, the amount of Bitcoin readily available for selling decreases, creating a more supportive supply environment.
Another encouraging signal comes from whale activity. The Momentum Whale Inflow Ratio, which measures the amount of Bitcoin large holders transfer to exchanges, turned negative for the first time in 2026 after remaining positive for five consecutive months. A positive reading generally suggests whales are preparing to sell by moving coins onto exchanges, while a negative reading indicates reduced selling intent and fewer coins entering the market.
The shift is particularly notable because it breaks a pattern that persisted throughout most of the 2026 downturn. During the decline, large holders consistently supplied Bitcoin to exchanges, creating selling pressure that repeatedly capped recovery attempts. The recent negative reading suggests that major investors have become less active sellers, removing a key source of overhead supply.
When viewed together, ETF inflows and exchange outflows create a favorable supply-demand dynamic. ETF issuers continue purchasing Bitcoin in response to investor demand, while fewer coins remain available on exchanges for sale. This combination often creates conditions for stronger price advances, as reduced supply meets increasing demand. Such an environment likely contributed to Bitcoin’s ability to break above $65,000 and briefly test $66,000.
While these indicators remain constructive, they are not permanent. Whale behavior can change quickly, and exchange balances can rise again if investors decide to take profits. Nevertheless, current on-chain data points toward accumulation rather than distribution, supporting the possibility of a continued move toward $68,000 in the near term.
Improving Macro Conditions Helped Fuel the Rally
The broader macroeconomic environment also played an important role in Bitcoin’s recent rebound. Reports suggesting that diplomatic discussions between the United States and Iran could resume helped ease geopolitical concerns that had previously driven investors toward defensive assets. As tensions appeared to soften, capital flowed back into risk-sensitive markets, including equities, commodities, and cryptocurrencies.
The relationship between Bitcoin and traditional financial markets was evident during the rally. On the same day Bitcoin reclaimed $65,000, US equities also moved higher, supported by strong corporate earnings and renewed optimism in the technology sector. In risk-on environments, Bitcoin tends to behave similarly to high-growth assets, benefiting from improved investor sentiment.
The significance of this shift becomes clearer when compared with earlier periods of heightened geopolitical uncertainty. During previous escalations in US-Iran tensions, Bitcoin ETFs experienced substantial outflows, including a single-day withdrawal of approximately $424.7 million, highlighting how sensitive institutional flows have become to macro developments. As geopolitical risks eased, investor appetite returned and ETF inflows resumed.
This improvement in sentiment directly challenges one of the key bearish arguments for Bitcoin. Critics have maintained that institutional demand remains weak and that ETF inflows are unlikely to recover meaningfully. However, a sustained risk-on environment—supported by easing geopolitical tensions and resilient corporate earnings—could encourage institutions to reallocate capital toward risk assets, including Bitcoin.
At the same time, the geopolitical backdrop remains fragile. Any renewed escalation could quickly reverse the current trend, driving investors back toward traditional safe-haven assets and weakening demand for cryptocurrencies. As a result, the same macro conditions that have supported Bitcoin’s rebound also represent one of its greatest risks.
The Federal Reserve Remains the Biggest Near-Term Risk
Despite improving flows and sentiment, attention is increasingly turning to the Federal Reserve’s July 28–29 policy meeting, which many investors view as the most important event for Bitcoin’s near-term outlook.
Current market expectations suggest roughly a 70% probability that the Fed leaves interest rates unchanged, with only a small chance of a surprise policy move. While a rate cut appears unlikely, even a neutral decision could influence risk assets depending on the tone of the Fed’s communication.
The Fed has been a major factor behind Bitcoin’s weakness this year. June’s sharp decline occurred amid a combination of persistent ETF outflows and a central bank that showed little willingness to ease monetary policy. Higher interest rates generally reduce the appeal of speculative and growth-oriented assets, including cryptocurrencies.
The primary concern for investors is asymmetrical risk. A rate hold is largely priced into markets and may have a limited impact on its own. However, a more hawkish-than-expected message—or an unexpected rate increase—could trigger a sharp reaction across risk assets. Given Bitcoin’s high sensitivity to changes in investor sentiment, it would likely experience outsized volatility under such a scenario.
On the other hand, a more dovish tone could provide significant support. If the Fed acknowledges signs of moderating inflation and hints at a more accommodative policy outlook later in the year, the current risk-on momentum could accelerate. In that case, Bitcoin may have a clearer path toward $68,000 and potentially higher levels.
The period leading up to the Fed meeting is therefore critical. Bitcoin has already regained the important $65,000 threshold and briefly touched $66,000, supported by ETF inflows, improving macro sentiment, and favorable on-chain data. Whether those gains can be consolidated into a sustainable uptrend will likely depend on how markets position themselves ahead of the Fed decision and how policymakers ultimately shape expectations for the remainder of the year.
For now, ETF demand, declining exchange balances, and improving risk appetite provide support for the bullish case. However, the Federal Reserve remains the single most important variable that could either extend the rally or abruptly halt it.
Bitcoin slides below $63,000 as escalating Middle East tensions continue to pressure risk assets.
Ethereum retreats but finds near-term support at its 50-day EMA, despite persistent ETF outflows.
XRP remains technically fragile, leaving the door open for a break below $1.10 even as modest capital inflows provide limited support.
Cryptocurrencies trade broadly lower on Friday as investors continue to evaluate the fallout from ongoing military exchanges between the United States and Iran. Bitcoin (BTC) has fallen more than 1% on the day, slipping below $63,000 and extending its pullback from the weekly peak near $65,600.
Ethereum (ETH) and XRP are also under pressure, with ETH drifting toward key short-term support around $1,800, while XRP remains pinned below the crucial $1.10 threshold.
US-Iran conflict dampens risk appetite
Military operations involving the US and Iran entered a sixth consecutive night, intensifying geopolitical uncertainty across global markets. According to reports, strikes in southern Iran have targeted civilian infrastructure, including power facilities and a railway station in Bandar Abbas.
Adding to market concerns, Reuters reported that Iran has directed Yemen’s Houthi forces to prepare for a potential closure of the Red Sea oil shipping route should attacks on Iranian energy assets escalate further, raising fears of disruption to global energy supplies.
Despite the heightened tensions, overall crypto market sentiment has remained relatively stable, though firmly cautious. The Fear & Greed Index stood at 27 on Friday, up slightly from 25 a day earlier, but still within the Fear zone. The modest improvement reflects lingering optimism following softer US inflation data earlier this week, which briefly supported a rebound in risk assets such as Bitcoin, Ethereum, and XRP before geopolitical concerns regained prominence.
Meanwhile, spot Bitcoin ETF inflows remained positive on Thursday, totaling approximately $79 million. However, the figure represented a slowdown from the $108 million recorded on Wednesday and the $181 million seen on Tuesday. Should institutional demand remain resilient in the weeks ahead, it could help offset geopolitical headwinds, supporting a period of consolidation before Bitcoin potentially makes another push above the $65,000 level.
Ethereum spot ETFs shifted back into risk-off territory on Thursday, recording net outflows of $28 million. The reversal snapped a two-day streak of inflows that brought in $54 million on Wednesday and $58 million on Tuesday. The renewed selling pressure coincided with Ethereum’s rejection from its weekly peak near $1,947, highlighting growing investor caution and reinforcing the broader risk-averse mood across financial markets.
For XRP, spot ETF demand showed signs of improvement on Thursday, drawing nearly $7 million in net inflows, according to SoSoValue data. The uptick followed several sessions of subdued activity and suggests a modest return of investor interest. As a result, cumulative net inflows rose to approximately $1.49 billion, while total net assets stood near $997 million. Nevertheless, continued inflows into US-listed XRP ETFs will be crucial to counterbalance selling pressure in the spot market and provide a foundation for a more sustained recovery.
Bitcoin Price Outlook: Technical Weakness Keeps BTC Under Pressure
Bitcoin continues to exhibit a bearish near-term bias, trading below its 50-day, 100-day, and 200-day Exponential Moving Averages (EMAs), signaling that sellers remain in control. Additional overhead pressure comes from the Parabolic SAR indicator positioned around $65,600, reinforcing a key resistance zone. Meanwhile, the Relative Strength Index (RSI) sits at 47, slightly below the neutral 50 mark, reflecting subdued buying momentum despite a mildly positive reading from the Moving Average Convergence Divergence (MACD) histogram.
On the upside, Bitcoin faces immediate resistance at the 50-day EMA near $65,007, followed by the Parabolic SAR around $65,600. Together, these levels form a significant near-term barrier ahead of the 100-day EMA at $68,323 and the longer-term 200-day EMA at $74,367.
On the downside, support is located around $61,106, where a previously broken descending trendline now serves as a key structural floor. A daily close below this level could accelerate selling pressure and trigger a deeper correction. For sentiment to improve meaningfully, Bitcoin will need to reclaim and hold above the dense resistance zone around $65,000, which currently caps recovery attempts and preserves the prevailing bearish outlook.
Altcoin Outlook: Ethereum and XRP Drift Toward Key Support Levels
Ethereum (ETH) trades around $1,830, remaining above its short-term support cluster formed by the 50-day EMA at $1,811 and the Parabolic SAR at $1,801. These levels provide a modest cushion against further declines, although the broader trend remains constrained. ETH continues to trade below the 100-day EMA at $1,942 and the 200-day EMA at $2,185, keeping the medium- and long-term outlook cautious. Momentum indicators offer mixed signals, with the RSI near 55 suggesting moderate buying interest, while a still-positive but weakening MACD points to fading bullish momentum.
On the downside, the $1,830–$1,800 region represents a critical support zone. A break below this area could expose Ethereum to a deeper correction. On the upside, initial resistance is located at the 100-day EMA near $1,942, followed by the more significant 200-day EMA around $2,185. A decisive move above these barriers would be required to restore a stronger bullish outlook.
XRP Remains Under Pressure Below Key Resistance
XRP continues to trade below the important $1.10 resistance zone, maintaining a bearish technical bias. The token remains firmly below its 50-day, 100-day, and 200-day EMAs, indicating that sellers retain control of the broader trend. Additional resistance is provided by the middle Bollinger Band near $1.10 and a previously broken descending trendline around $1.12, suggesting that recovery attempts are being met with persistent selling pressure.
Momentum indicators remain relatively weak but not deeply oversold. The MACD retains a slightly positive reading, while the RSI near 44 reflects limited buying conviction and mild downside pressure.
On the upside, resistance begins at $1.10, followed by $1.12 and the 50-day EMA near $1.15. Beyond that, the upper Bollinger Band around $1.16 precedes stronger resistance levels at the 100-day EMA near $1.25 and the 200-day EMA around $1.45.
On the downside, immediate support is located near the lower Bollinger Band at $1.03. A sustained move below this level could trigger further weakness and expose XRP to lower psychological support zones, leaving the overall technical outlook negative while the token remains beneath its key moving averages.
Bitcoin slipped to $64,195.94, down 1.40% on the day, after failing to break above $65,500 for the second time in just over a week. Its market capitalization stood at $1.29 trillion, supported by a circulating supply of 20 million BTC, while 24-hour trading volume reached $32.35 billion. Although Bitcoin remains up 2.2% over the past week, repeated rejections near the same resistance level suggest buying momentum is fading.
The rally gained traction on Wednesday when Bitcoin climbed above $65,000, reaching a three-week high of $65,529.09 after opening at $65,009.12. The cryptocurrency posted a 3.5% daily gain, with weekly performance improving to 4.03%, as trading volume totaled $23.73 billion. During the week, prices fluctuated between $62,194.46 and $64,805.30, peaking at $65,471.67.
However, the advance quickly lost steam on Thursday. Bitcoin retreated toward $64,000, falling 1.1% from the start of the UTC trading day, while Ether declined 1.7%. The pullback reflected another round of profit-taking near resistance, compounded by renewed geopolitical tensions after Iran launched attacks on U.S. military bases in Gulf states as U.S. airstrikes continued.
Current market dynamics suggest Bitcoin’s strength is being driven more by leveraged positioning than by genuine spot demand. ETF inflows, largely concentrated in a single fund, continue to influence price action, but inconsistent inflow patterns have made rallies toward $65,000 difficult to sustain. Analysts argue that Bitcoin’s estimated average holder cost basis near $53,700 remains a more meaningful reference point than bullish options positioning targeting $72,000, which has yet to receive support from underlying market flows.
Bitcoin has endured a challenging year, falling 26.1% since the start of 2026 after beginning the year above $93,000. It has declined 45.5% over the past twelve months and now trades 54.3% below its all-time high of $126,080, recorded on October 6, 2025. Among major asset classes, Bitcoin has been one of the weakest performers this year, trailing U.S. Treasuries, silver, and the Swiss franc.
Elsewhere in the crypto market, Ether traded at $1,883.01, down 2.18%, XRP eased 0.92% to $1.11, and Solana fell 2.55% to $76.20. The broader digital asset market continues to move largely in response to the same macro and liquidity-driven factors influencing Bitcoin.
Bitcoin’s 54.3% Decline Has Lasted 268 Days, Suggesting the Correction May Not Be Over
Bitcoin has now spent 268 days in a drawdown, falling 54.3% from its record high. Those figures alone challenge the view that the market has already established a definitive bottom.
History offers an important perspective. The previous two major Bitcoin bear markets lasted 363 and 376 days, with peak-to-trough losses of 84.3% and 77.6%, respectively. Compared with those cycles, the current downturn has covered only about three-quarters of the historical duration and remains significantly shallower than even the mildest of the last two declines. That suggests the correction could still be unfolding rather than reaching its conclusion.
The familiar four-year Bitcoin cycle has once again become a focus for market participants. While the current decline has not mirrored the bear markets of 2014, 2018, or 2022 exactly, its timing and overall structure share notable similarities. If Bitcoin were to experience a 70% decline from its $126,080 peak—consistent with the trend of progressively less severe bear markets—the price would fall into the $38,000–$39,000 range by early October, roughly four years after the previous cycle low. However, this represents one possible scenario rather than the most likely outcome.
There is also an important argument against an overly bearish outlook. Bitcoin recorded its lowest realized volatility on record in 2025, and historically, periods of reduced volatility have often been followed by less severe drawdowns. As a result, applying a simple 70% decline based on past cycles may overstate the downside under today’s different market conditions.
Price action throughout the year highlights the key technical levels. Bitcoin dropped from above $80,000 in late January to around $60,000 in February before staging a rebound. It finished June near $60,000 after posting a fresh 21-month low during the final week of the month. On July 1, BTC briefly touched $57,800, marking a maximum drawdown of roughly 54%, before recovering to $64,195.94.
One technical development has received relatively little attention. In late June, Bitcoin recorded its first weekly close below the 200-week moving average since 2023 after remaining under the $60,000 level for an entire week. Historically, BTC has only traded beneath this long-term trend indicator during the most severe phases of previous bear markets. Although the subsequent recovery above $60,000 is encouraging, the earlier breakdown remains a significant technical event that continues to shape the broader market outlook.
IBIT Continues to Dominate Bitcoin ETF Flows
On July 15, US spot Bitcoin ETFs attracted $107.7 million in net inflows, with BlackRock’s iShares Bitcoin Trust (IBIT) accounting for $80.8 million, or roughly three-quarters of the total. Fidelity’s FBTC contributed $16.9 million, while Grayscale’s lower-fee BTC ETF added $10 million. All remaining Bitcoin ETF products—including BITB, ARKB, BTCO, EZBC, BRRR, HODL, BTCW, MSBT, and GBTC—recorded no meaningful net activity.
The pattern has become increasingly consistent. On July 14, Bitcoin ETFs collectively attracted $181.1 million, with IBIT contributing $138.9 million and FBTC adding $21 million. No Bitcoin ETF experienced net outflows that day, lifting total Bitcoin ETF assets back to approximately $78 billion, while US spot Ether ETFs surpassed $10 billion in assets under management.
Earlier in the month, the concentration was equally apparent. On July 6, Bitcoin ETFs received $265.69 million, of which $209.4 million flowed into IBIT. The following day, overall inflows slowed sharply to $21.09 million, yet IBIT still attracted $54.45 million, implying competing funds collectively experienced net redemptions. Over the July 6–10 period, IBIT accumulated $291.9 million, exceeding the sector’s total net inflow of $197.4 million as outflows from other funds offset much of BlackRock’s gains. During the same week, GBTC lost $108.2 million, FBTC shed $93.4 million, and ARKB recorded $15.3 million in redemptions.
IBIT’s influence is just as significant during periods of outflows. Between June 22 and June 26, US spot Bitcoin ETFs experienced roughly $1.79 billion in net withdrawals, with IBIT accounting for around 73% of those redemptions. Given that the Bitcoin ETF market now manages roughly $78.5 billion in assets and holds more than 1.21 million BTC, flows into and out of IBIT increasingly shape the direction of the broader ETF market.
The impact extends beyond investor sentiment. When ETF shares are redeemed, authorized participants return those shares to the issuer, prompting custodians to sell Bitcoin in the spot market to meet cash withdrawals. Industry research cited throughout 2026 suggests ETF-related transactions now explain nearly 45% of weekly Bitcoin price movements, making fund flows a major driver of market action rather than simply a reflection of investor confidence.
As a result, Bitcoin’s near-term performance increasingly depends on a single question: how are BlackRock’s ETF investors positioning themselves?
Recovery in ETF Flows Remains Small Relative to Earlier Outflows
Although Bitcoin and Ether ETFs recently ended a prolonged redemption streak, the recovery remains modest compared with the scale of previous withdrawals.
Across eight consecutive weeks, US spot Bitcoin and Ether ETFs recorded approximately $9.46 billion in cumulative outflows, surpassing the previous record of five straight weeks of redemptions. Selling intensified through June amid broader risk-off sentiment across financial markets.
June alone generated approximately $4.51 billion in ETF withdrawals, bringing estimated net outflows for 2026 to around $5.8 billion by mid-July. May contributed another $2.30 billion, while a single trading session on June 25 saw roughly $700 million leave the sector. By the beginning of July, year-to-date net outflows had already reached $5.4 billion.
Against that backdrop, the rebound has been relatively limited. During the week of July 6–10, Bitcoin ETFs attracted $197.4 million, while Ether ETFs added $84.42 million, producing combined inflows of $281.8 million—the first positive weekly reading for both asset classes since early May.
Even so, the recovery represents only about 3% of the previous $9.46 billion withdrawn, highlighting how little of the earlier selling has been reversed.
Relative to assets under management, Ether also showed stronger momentum than Bitcoin. With approximately $9.59 billion in ETF assets, Ether’s weekly inflows equaled about 0.88% of total AUM—more than three times Bitcoin’s relative inflow intensity. Despite this stronger rebound, Ether ETFs have still experienced roughly $1.2 billion in cumulative outflows since early May.
The daily flow pattern during that positive week also reflected fragile demand. Bitcoin ETFs recorded $265.69 million in inflows on Monday, followed by just $21.44 million on Tuesday. Redemptions then returned on Wednesday (-$84.86 million) and Thursday (-$95.30 million) before Friday’s $90.44 million inflow preserved a positive weekly total. Two of the five trading sessions still ended in net outflows, underscoring that the recovery relied heavily on a handful of strong inflow days.
Before that reversal, Bitcoin ETFs had endured a 10-session outflow streak that drained approximately $2.73 billion. The streak ended on July 2 with a $221.72 million inflow led by Fidelity. Those sustained redemptions translated into billions of dollars in systematic Bitcoin selling through ETF redemption mechanisms, creating persistent market pressure regardless of broader investor views on Bitcoin’s long-term outlook.
July’s ETF Flows Highlight a Market Driven by Short-Term Swings
Bitcoin ETF activity throughout July has been characterized by sharp reversals rather than a sustained trend, with trading between July 13 and July 15 providing a clear example of the market’s recent volatility.
On July 13, US spot Bitcoin ETFs recorded a $425 million net outflow, marking the largest single-day redemption during the current period. IBIT’s net asset value declined 2.89%, with BlackRock’s redemption equating to roughly 2,990 BTC, worth approximately $185.5 million. Fidelity also experienced substantial withdrawals totaling around $245.6 million. Meanwhile, US spot Ether ETFs posted $15.41 million in net redemptions.
The following day, sentiment shifted sharply. On July 14, Bitcoin ETFs attracted $181.1 million in net inflows, led by IBIT’s $138.9 million contribution. No Bitcoin ETF reported net outflows during the session, while Bitcoin ETF prices climbed nearly 4% and Ether ETFs gained about 6%, representing their strongest daily performance in several weeks.
Momentum continued on July 15, with Bitcoin ETFs adding another $107.7 million, including $80.8 million flowing into IBIT.
Taken together, the market experienced a $425 million withdrawal followed by $288.8 million in combined inflows over the next two sessions. Throughout July, ETF flows have frequently alternated between inflows and outflows every few trading days, with neither buying nor selling pressure maintaining control for an extended period. The largest redemption of the month and one of its strongest inflow sessions occurred just 24 hours apart, highlighting the lack of a sustained directional trend.
This pattern is significant because of its influence on Bitcoin’s price discovery. If ETF flows now account for an estimated 45% of weekly Bitcoin price movements, frequent reversals in those flows can introduce considerable short-term volatility. That leaves the remaining portion of market activity—including spot trading and derivatives positioning—to absorb rapid shifts in buying and selling pressure.
One area has shown greater consistency. While spot Bitcoin ETF flows have fluctuated, leveraged Bitcoin strategy ETFs have attracted steadier inflows over the past seven weeks. That demand has helped support Strategy (MSTR) shares and prevented the stock from trading below its net asset value. At the same time, Bitcoin futures markets have continued to record positive flows, a trend often associated with stronger institutional participation.
The contrast between stable demand for leveraged products and inconsistent flows into spot Bitcoin ETFs suggests that investors using leverage have displayed greater conviction than buyers of the underlying asset. Such a divergence is unusual and may indicate that speculative positioning is currently stronger than demand in the spot market.
Leverage Continues to Drive Bitcoin as Futures Activity Outpaces Spot Buying
Bitcoin’s futures open interest has climbed to $48.90 billion, increasing 3.52%—or roughly $1.66 billion—over the past two days. The data suggests that recent price gains have been fueled primarily by leveraged positions rather than genuine spot-market demand.
The contrast between derivatives and spot flows is striking. During the period in which Bitcoin rallied from $62,194.46 to $65,529.09, US spot Bitcoin ETFs attracted $288.8 million in net inflows. Over the same timeframe, futures open interest expanded by $1.66 billion, nearly six times larger than ETF demand. This indicates that the rally was driven largely by traders increasing leveraged exposure instead of investors purchasing Bitcoin outright.
Although the increase in open interest has been described as orderly rather than excessively speculative, the size of the derivatives market remains significant. With nearly $49 billion in outstanding futures positions, relatively modest price swings can still trigger substantial forced liquidations. For comparison, the largest liquidation event over the past month totaled $363.41 million on June 25.
Recent price action, however, has not been characterized by widespread liquidations. Bitcoin’s pullback from $65,529.09 to $64,195.94 occurred without meaningful forced selling from either long or short positions, suggesting the decline reflected genuine spot-market selling rather than a cascade of leveraged liquidations.
While this orderly behavior reduces immediate systemic stress, it also implies that speculative positioning remains largely intact. Unlike liquidation-driven declines, which often reset positioning and establish stronger support levels, gradual spot-led selling leaves leveraged exposure largely untouched, creating the potential for continued volatility.
This dynamic reflects a broader imbalance in market participation. Long-term value investors may still be waiting for deeper discounts following Bitcoin’s 54.3% decline from its peak, while momentum investors appear reluctant to return until ETF inflows strengthen and broader catalysts emerge. With both groups remaining cautious, leveraged traders have become the primary force influencing short-term price action.
Perpetual futures funding rates remain positive at approximately 0.0043% every four hours, equivalent to an annualized rate of about 9.35%. Throughout Bitcoin’s advance toward $65,529.09, funding stayed positive but relatively moderate, averaging around 0.0060% every four hours.
Positive funding means traders holding long positions pay those holding shorts. However, current funding levels remain well below the elevated readings typically associated with overheated markets, indicating that leveraged bullish positioning has not yet reached extreme levels.
Liquidation data supports that interpretation. During the latest 24-hour period, total liquidations reached $37.32 million, with short positions accounting for $31.66 million, or roughly 85% of the total. Similar figures from another observation period showed shorts representing more than 82% of all liquidations.
This suggests that Bitcoin’s move from roughly $62,200 toward $65,500 was driven largely by a moderate short squeeze rather than sustained spot buying. Yet the scale of the squeeze was relatively small. The $31.66 million in liquidated short positions represents only around 0.06% of the nearly $49 billion in total futures open interest, implying that only a small portion of bearish positioning was forced out.
Compared with previous market extremes, the recent activity appears relatively subdued. During a major derivatives event in late February, perpetual funding briefly turned sharply negative while more than $500 million in crypto positions were liquidated within a single day, primarily long positions. Current conditions remain far from that level of market stress.
As a result, Bitcoin’s inability to break decisively above $65,500 is understandable. Funding rates remain moderate, short positioning has not been fully exhausted, and bearish traders retain room to re-enter the market without facing prohibitively expensive funding costs.
The combination of neutral funding, stable open interest, and only modest short-covering has produced a rally that lacked sustained follow-through, leaving Bitcoin unable to overcome a key technical resistance level.
Technical Indicators Show Improving Short-Term Momentum but Weak Long-Term Structure
From a technical perspective, Bitcoin continues to trade below its 50-day exponential moving average (EMA), currently located in the $65,100–$65,700 range. The recent high at $65,529.09 tested this resistance zone before reversing lower, reinforcing the importance of the 50-day EMA as a key trend indicator.
Momentum indicators paint a mixed picture. Daily Relative Strength Index (RSI) readings remain around 48–49, suggesting momentum has improved from oversold conditions but has yet to establish a clearly bullish trend. On the weekly timeframe, RSI remains below the critical 50 level, indicating that the broader market trend has not yet shifted in favor of buyers.
Meanwhile, the MACD shows bearish momentum gradually weakening, although it has yet to generate a confirmed bullish reversal signal.
Short-term price action remains relatively constructive. Bitcoin has maintained higher lows after its advance toward $65,500, with chart patterns resembling a pennant or symmetrical triangle that typically reflects consolidation rather than an immediate reversal. On the weekly chart, however, these higher lows continue to develop within a broader descending channel, a structure commonly associated with bear-market rallies.
The key technical levels remain well defined. A sustained move above $65,000 would strengthen the case for additional upside in the near term, while a decline below $64,500 could return Bitcoin to a broader consolidation range. Initial support lies near the 20-day moving average around $62,500, with $63,800 serving as another important support area after previously acting as resistance. On the upside, reclaiming the 50-day EMA would represent the first meaningful improvement in trend strength, opening the possibility of testing resistance between $66,600 and $67,600.
The broader technical picture remains less encouraging. In late June, Bitcoin recorded its first weekly close below the 200-week moving average since 2023—a level that has historically only been broken during the deepest phases of previous bear markets. Although the current price has recovered above that long-term average, a single rebound is insufficient to restore the long-term bullish structure. Sustained trading above the 200-week moving average over multiple weeks would be required to confirm a more durable trend reversal.
Taken together, both market flows and technical indicators point to the same conclusion: Bitcoin’s recent strength is primarily a short-term development occurring within a longer-term structure that has yet to fully recover.
Bitcoin staged a modest recovery into Friday, trading near the $64,000 mark while continuing to find support around its 200-week Simple Moving Average (SMA).
Spot Bitcoin ETF flows have remained mixed throughout the week, reflecting a cautious market sentiment as investors assess the impact of Strategy’s latest Bitcoin sale.
Although geopolitical tensions have eased slightly, lingering uncertainty continues to weigh on risk appetite, limiting the cryptocurrency’s potential for stronger gains.
Bitcoin Weekly Outlook: Resilient Above $64,000 Despite Strategy Sale and Geopolitical Headwinds
Bitcoin (BTC) climbed back above $64,000 on Friday, extending a modest recovery while maintaining support above a key technical zone throughout the week. Mixed spot Bitcoin ETF flows through Thursday reflected cautious institutional sentiment, while the market largely absorbed the impact of Strategy’s recent BTC sale, underscoring Bitcoin’s strong liquidity and resilience. Although easing tensions between the US and Iran helped improve risk appetite late in the week, ongoing uncertainty in the Middle East continued to limit the cryptocurrency’s upside potential.
Geopolitical Uncertainty Continues to Influence Market Sentiment
Investor sentiment remained fragile throughout the week as developments in the Middle East shaped broader risk appetite. Concerns initially rose after Iran announced plans to impose new service charges on vessels transiting a strategically important shipping route, arguing that the fees were intended to cover security, monitoring, and environmental protection costs rather than serve as transit tolls.
Market anxiety intensified after an oil tanker was struck while moving through the Strait of Hormuz, prompting a fresh round of US military strikes against Iranian targets. Iran responded with attacks on US military assets in Bahrain and Kuwait, while comments from US President Donald Trump suggesting that a ceasefire agreement with Iran had effectively ended added to uncertainty across financial markets.
Sentiment improved later in the week after Trump indicated that Iran had reached out seeking negotiations, raising hopes for a potential easing of tensions. The improvement helped Bitcoin erase earlier losses and advance toward the $64,000 level by Friday. Nevertheless, the geopolitical backdrop remains fragile, and any renewed escalation between the US and Iran could trigger fresh selling pressure across risk-sensitive assets, including cryptocurrencies.
Strategy’s Bitcoin Sale Highlights Market Depth
On Monday, Strategy disclosed the sale of 3,588 BTC worth approximately $216 million to fund dividend payments related to its Digital Credit program. While the announcement initially contributed to a roughly 4% decline in Bitcoin, the cryptocurrency quickly recovered and ended the session with modest gains, suggesting the market absorbed the selling pressure effectively.
According to Crypto Finance, transactions of this scale are typically conducted through over-the-counter (OTC) channels and are often hedged well before becoming public knowledge. As a result, much of the market impact is generally priced in before official disclosure.
The report also emphasized that Bitcoin’s growing liquidity enables it to handle large transactions without causing prolonged price disruptions, helping explain the brief nature of the selloff.
Dean Chen, an analyst at Bitunix Exchange, noted that Strategy’s sale demonstrated the maturity of the Bitcoin treasury model rather than undermining it. In his view, selling a small portion of holdings showed that Bitcoin can increasingly function as a liquid corporate treasury asset.
Outlook Remains Cautiously Bearish
Despite Bitcoin’s resilience, Chen remains cautiously bearish in the near term. He points to elevated US Treasury yields, stronger return opportunities in equities, continued investor interest in AI-related ventures and IPOs, and still-modest institutional inflows despite some improvement in spot Bitcoin ETF demand.
Looking ahead, Chen believes Bitcoin’s direction will depend more on whether global investors increase allocations to risk assets than on Strategy’s transaction itself. He expects BTC to remain range-bound with a slight downside bias as competition for global liquidity remains intense and new capital inflows remain limited.
For the near term, Chen identifies $68,500 as a key resistance level and $62,000 as major support. Unless macroeconomic conditions improve meaningfully, he expects Bitcoin to end the month slightly below current levels.
Institutional Investors Remain Undecided
Institutional interest showed tentative signs of recovery early this week after several consecutive weeks of net outflows. However, momentum faded later in the week as spot Bitcoin ETFs recorded two sessions of withdrawals. According to SoSoValue data, net inflows still stood at $106.96 million through Thursday, reflecting a modest improvement in overall demand.
If Friday’s ETF flows finish in positive territory, Bitcoin could end an eight-week streak of persistent outflows, potentially signaling a shift in institutional sentiment. While the data suggests investors are becoming more willing to re-enter the market, the mixed flow pattern highlights ongoing caution. Nevertheless, a sustained return of institutional capital could provide additional support for Bitcoin prices in the weeks ahead.
Total Bitcoin spot ETF net inflow daily chart. Source: SoSoValue
Total Bitcoin spot ETF net inflow weekly chart. Source: SoSoValue
Cautious Fed Outlook Keeps Bitcoin Range-Bound
On the macroeconomic front, attention centered on the release of the minutes from the Federal Open Market Committee (FOMC) meeting held on June 16–17. The report showed that Federal Reserve policymakers remain divided on the future path of interest rates, with concerns about inflation persisting even as worries surrounding the labor market have eased somewhat.
Following the release of the minutes, market expectations shifted slightly, with CME FedWatch data indicating that traders are pricing in approximately a 21.9% probability of a rate hike at the Fed’s July meeting. The prospect of interest rates remaining elevated for longer has encouraged a cautious stance among investors.
As a result, demand for risk-sensitive assets has remained subdued, with many market participants opting to stay on the sidelines until there is greater clarity on the Fed’s policy direction. This cautious macroeconomic backdrop has contributed to Bitcoin’s largely sideways price action throughout the week.
Technical Outlook: Premature to Confirm a Market Bottom
Bitcoin continued its gradual recovery on Friday, reclaiming the $64,000 level after posting a 6.84% gain the previous week. The cryptocurrency is currently finding support near its 200-week Simple Moving Average (SMA) at $62,874, having successfully rebounded from a long-term ascending trendline that has connected major lows since January 2023.
Should the 200-week SMA continue to hold as a support level, Bitcoin could build on its recent strength and target the 78.6% Fibonacci retracement level at $65,520, measured from the August 2024 low of $49,000 to the October 2025 all-time high of $126,199.
Technical indicators on the weekly chart point to improving, though still fragile, momentum. The Relative Strength Index (RSI) remains subdued near 39 but is stabilizing, while the Moving Average Convergence Divergence (MACD) remains slightly negative yet continues to recover, indicating that bearish momentum is gradually fading.
Despite these encouraging signs, it remains too early to declare that Bitcoin has established a definitive bottom. A decisive break below the 200-week SMA at $62,874 would weaken the bullish recovery scenario and could open the door for a deeper pullback toward the long-term ascending trendline support near $58,000.
On the daily timeframe, Bitcoin continues to trade with a cautious bias, remaining below its 50-day, 100-day, and 200-day Exponential Moving Averages (EMAs). These key moving averages remain well above current prices and continue to reinforce the broader medium-term downtrend.
BTC is currently hovering just above an important horizontal support area near $64,004. While momentum indicators have improved, they have yet to signal a decisive bullish breakout. The Relative Strength Index (RSI) is holding around 53, indicating modest buying strength, while the MACD remains above the zero line, reflecting recovering bullish momentum.
On the upside, the first significant obstacle lies at the 50-day EMA around $65,413. Additional resistance levels are located near the 100-day EMA at $69,000 and the 200-day EMA at $75,029. Beyond these levels, a major horizontal resistance zone around $84,410 could further limit advances.
On the downside, immediate support remains at $64,004. A sustained move below this level would increase bearish pressure and could pave the way for a decline toward the $60,000 psychological support zone, which may attract renewed buying interest.
Bitcoin Rebounds Above $64,000 as June’s Sell-Off Loses Momentum
Bitcoin entered July 7 on firmer footing, reclaiming territory that appeared out of reach just weeks earlier. The leading cryptocurrency traded at $64,033.85, up 0.76% over the previous 24 hours, extending a recovery that has lifted prices 6.27% over the past week from late-June lows in the upper-$50,000 range. During the session, Bitcoin fluctuated between $63,694.40 and $64,476.62, maintaining its position near the upper end of the range—a sign that buyers continued to support the upward move. The rebound follows one of the harshest periods of the current market cycle, when Bitcoin spent an entire week below $60,000 and briefly slipped under its 200-week moving average for the first time since 2023. Attention now turns to the forces driving the recovery, the key technical levels ahead, and the catalysts that could shape the next major move.
Bitcoin Regains $64,000 Following June’s Market Shakeout
The return above $64,000 signals a measure of stability after a turbulent June. With prices now roughly 6.27% higher week-over-week, Bitcoin has recovered meaningfully from a sharp decline that dragged the asset into the high-$50,000s. The move marks a notable improvement in sentiment following one of the most challenging months of the ongoing cycle.
Bitcoin’s market capitalization stands at approximately $1.284 trillion, accounting for around 54%–55% of the total cryptocurrency market and reinforcing its dominance within the sector. At this scale, even modest percentage gains carry significant weight; the latest 0.76% daily increase added nearly $9.7 billion in market value. Unlike smaller digital assets that can experience outsized swings on limited liquidity, Bitcoin’s weekly advance reflects substantial capital flows and broader market repositioning.
Despite the recovery, the asset remains deep below its historical peak. Bitcoin’s record high of $126,000, reached in October 2025, is still nearly 49% above current levels, underscoring the extent of the retracement. The move back to $64,000 does not reverse the broader correction but suggests an effort to establish a more durable base after the June decline.
From a technical perspective, Bitcoin pushed toward resistance near $64,500 before consolidating close to session highs. Holding near the top of the daily range indicates buyers were willing to defend gains rather than take profits aggressively. Whether that support persists will determine if the $64,000 area evolves into a sustainable foundation or proves to be another temporary rebound within a broader corrective trend.
What’s Driving the Recovery? Short Covering Takes Center Stage
The rally appears to have been fueled largely by forced buying rather than a wave of new bullish conviction. More than $450 million in short liquidations generated automatic buying pressure after Bitcoin climbed above $62,000, creating a self-reinforcing rally. When leveraged bearish positions are liquidated, exchanges close those trades by purchasing the underlying asset, which can accelerate upside momentum.
Liquidation data highlights the extent of the squeeze. Short liquidations totaled approximately $86.6 million, compared with $54.01 million in long liquidations, suggesting bearish traders were caught off guard by the reversal and forced to cover positions. The imbalance reflects a market where many participants had anticipated further declines but instead faced a rapid upside move.
Trading activity also surged during the rebound, with volume rising 104.7% above average levels. While strong volume can indicate genuine demand, a meaningful share of the activity likely came from liquidation-driven buying rather than sustained spot-market accumulation by long-term investors. This distinction is important because rallies driven primarily by short squeezes can lose momentum once forced buying subsides.
The pattern is typical of recoveries following steep selloffs. Much of the excessive leverage that amplified June’s decline had already been flushed from the market, with open interest dropping sharply during the correction. Such leverage resets often lay the groundwork for rebounds by reducing forced-selling pressure. With many bearish positions eliminated, another significant decline may require a fresh negative catalyst rather than simply a continuation of liquidation-driven selling.
The next test for Bitcoin is whether genuine spot demand can replace the mechanical buying that powered the recent advance. Short squeezes can spark impressive rallies, but sustained uptrends generally require consistent participation from long-term buyers. For now, the liquidation-driven surge has helped Bitcoin reclaim the $64,000 mark, but the durability of the recovery will depend on whether real demand emerges to support prices in the sessions ahead.
ETF Inflows Return After June’s Historic Outflow Wave
A key factor supporting Bitcoin’s recent recovery has emerged from the spot ETF market. On July 2, spot Bitcoin ETFs recorded net inflows of $221.72 million, ending a painful 10-session outflow streak that had drained roughly $2.7 billion from the sector. Subsequent data remained positive, with an additional $46.6 million in net inflows, suggesting institutional sentiment may be stabilizing after weeks of persistent selling pressure.
The improvement comes after a difficult June, during which Bitcoin ETFs experienced their largest monthly outflows on record. Investors withdrew approximately $4.5 billion from the funds, intensifying downside pressure and highlighting a broad reduction in institutional crypto exposure. Reflecting the bearish mood, analysts at Citigroup reportedly reduced their 12-month Bitcoin ETF inflow outlook to zero, underscoring the depth of market pessimism at the time.
Against that backdrop, the return of positive ETF flows carries considerable importance. Spot ETF demand has become one of the most closely watched indicators of institutional appetite for Bitcoin. The July 2 inflow suggests that some large investors viewed the late-June decline into the high-$50,000 range as a buying opportunity rather than a reason to exit.
The relationship between ETF flows and Bitcoin prices is straightforward. When investors purchase shares of a spot Bitcoin ETF, fund managers must acquire Bitcoin in the open market to back those holdings, creating direct spot demand. Conversely, redemptions force funds to sell Bitcoin, adding pressure to prices. As a result, the shift from significant outflows to net inflows effectively turns a major headwind into a potential tailwind for the market.
The challenge now is determining whether the trend can persist. One strong inflow day alone does not confirm a durable turnaround. Markets will likely need to see several consecutive sessions of positive ETF demand before investors gain confidence that institutional buying has genuinely returned. Historically, sustained inflows tend to emerge when broader macro conditions improve, particularly if the U.S. dollar weakens and Treasury yields ease. For now, the renewed inflows provide an encouraging signal, but confirmation will require continued participation.
Bitcoin Recovery Gains Traction Despite Persistent Extreme Fear
One of the more remarkable aspects of Bitcoin’s rebound is that sentiment has remained deeply negative even as prices recover. The Crypto Fear & Greed Index currently stands at 23, firmly within Extreme Fear territory, despite Bitcoin’s weekly gain of more than 6%. While the index has improved from recent lows, investor psychology remains notably cautious.
Sentiment reached particularly depressed levels in late June. The seven-day average for the index fell to 19, while the indicator briefly touched 10 when Bitcoin traded near $58,411. Such readings typically reflect widespread capitulation, uncertainty, and risk aversion among market participants—conditions that have historically appeared near major market bottoms.
This divergence between price action and sentiment is often viewed as a bullish contrarian signal. When fear dominates market psychology, much of the selling pressure may already have been exhausted. As bearish positioning unwinds and sellers become scarce, markets can recover even before investor confidence returns. In that sense, Bitcoin’s rise alongside continued pessimism resembles the early stages of previous recovery phases.
However, the current rally differs from the highly speculative advances seen during stronger bull-market periods. Much of the recent move appears to have been driven by short-covering activity and cautious repositioning rather than aggressive risk-taking. There are few signs of the exuberance or leverage expansion typically associated with mature uptrends.
That dynamic presents both opportunities and risks. The absence of widespread optimism means the market is far from overheated, leaving room for additional gains if fundamentals continue to improve. At the same time, lingering fear reflects ongoing uncertainty about whether the broader correction has truly run its course.
For now, the combination of improving ETF flows and deeply bearish sentiment creates a constructive backdrop for Bitcoin. While Extreme Fear alone is not enough to confirm a lasting bottom, its coexistence with strengthening institutional demand suggests that downside pressure may be fading and that the market could be laying the groundwork for a more sustainable recovery.
While daily price movements continue to dominate headlines, on-chain data reveals a more subtle but potentially important trend: large Bitcoin holders have been steadily increasing their exposure. Over the past two weeks, whale wallets accumulated more than 270,000 BTC, indicating that long-term investors have been using the recent market weakness as an opportunity to add positions.
This accumulation stands in sharp contrast to the cautious sentiment reflected across retail markets. While the Crypto Fear & Greed Index remains in Extreme Fear territory, major holders appear to be positioning for a longer-term recovery rather than preparing for further downside.
Whale activity often attracts attention because these investors typically operate with greater capital, longer investment horizons, and less sensitivity to short-term volatility. When large holders buy aggressively during periods of market stress, it can signal that they view prevailing prices as undervalued relative to future expectations. The acquisition of more than 270,000 BTC during the aftermath of June’s sell-off represents a significant transfer of supply into stronger hands.
Supporting this narrative is the continued decline in Bitcoin balances held on exchanges. As coins move from trading platforms into private wallets, the available supply for immediate sale decreases. Such outflows are commonly interpreted as a sign that investors intend to hold rather than liquidate their positions. Reduced exchange reserves can strengthen future rallies by limiting the amount of Bitcoin readily available when demand increases.
Taken together, whale accumulation and declining exchange balances suggest a market undergoing quiet accumulation beneath an atmosphere of widespread caution. While retail participants largely retreated during the June downturn, larger investors appear to have used the weakness to build positions. This divergence often emerges during transitional periods when markets begin shifting from distribution and capitulation toward stabilization and recovery.
The trend also complements the broader deleveraging process that unfolded during June’s correction. Open interest fell sharply as leveraged positions were liquidated, removing much of the excess speculation that had built up during earlier stages of the cycle. With leverage significantly reduced, exchange balances falling, and whales actively accumulating, the overall market structure appears healthier than it did during the height of the sell-off.
Although no single indicator guarantees a sustained advance, the combination of stronger hands accumulating, lower exchange supply, and a cleaner leverage profile provides a constructive foundation for Bitcoin’s recovery. The recent whale activity suggests that patient capital sees value where fearful investors remain hesitant.
Why the 200-Week Moving Average Remains a Critical Level
Bitcoin’s late-June decline carried significant technical implications, particularly because it pushed the cryptocurrency below one of its most closely watched long-term indicators: the 200-week moving average.
The market not only fell beneath the level intraday but also recorded its first weekly close below the 200-week average since 2023. For many long-term investors and technical analysts, this moving average serves as a key measure of Bitcoin’s structural trend and has historically acted as a major support zone during periods of market stress.
The importance of the breakdown stems largely from its rarity. Bitcoin has only traded below the 200-week moving average during the most severe phases of previous bear markets. Each occurrence has coincided with deep capitulation and widespread pessimism, which explains why the June breakdown intensified bearish sentiment across the market.
At the same time, history offers a more balanced perspective. In prior cycles, Bitcoin eventually reclaimed the 200-week moving average after breaking below it, transforming periods of extreme weakness into the foundation for future uptrends. As a result, the indicator has often served as both a warning signal and a long-term recovery marker.
Several factors suggest the recent breakdown may have occurred under conditions of significant market exhaustion. During the sharp sell-off, Bitcoin appeared deeply oversold, while open interest fell to approximately $46.5 billion as leveraged positions were systematically liquidated. The removal of excess leverage reduced forced-selling pressure and helped reset market conditions after months of speculative activity.
The subsequent rebound above $64,000 has further eased immediate concerns. More importantly, Bitcoin has reclaimed the psychologically significant $60,000 level, which previously served as a major support area during the February crash. That zone has once again emerged as a crucial battleground between buyers and sellers.
Maintaining price action above $60,000 is essential if Bitcoin is to repair the technical damage caused by the late-June breakdown. A sustained hold above that threshold would strengthen the case that the move below the 200-week moving average represented a capitulation event rather than the beginning of a deeper bear market.
For now, Bitcoin’s recovery suggests that buyers are attempting to rebuild the market structure that fractured during June’s decline. Whether the effort succeeds will depend on the cryptocurrency’s ability to defend key support levels, attract continued institutional demand, and convert the recent rebound into a broader trend reversal.
Bitcoin Trapped Between Key Support and Resistance Levels
Bitcoin’s near-term outlook is being shaped by a relatively narrow trading range, with support at $63,000 and resistance near $64,500 emerging as the most important levels for traders. How price reacts around these zones will likely determine the cryptocurrency’s next significant move.
During the latest recovery attempt, Bitcoin climbed toward the $64,500 resistance area before encountering selling pressure and consolidating just below that threshold. Despite the rejection, the asset remained near the upper end of its daily range, suggesting buyers continue to absorb supply rather than retreat aggressively. This resilience keeps the bullish case intact for now.
The key level on the downside is $63,000. As long as Bitcoin remains above this support zone, the recovery structure stays intact. A decisive break below it, however, could signal fading momentum and increase the risk of a deeper pullback.
Below $63,000, several support levels come into focus:
$62,000 – first layer of support beneath the current range.
$59,000 – the area that helped stabilize the recent rebound.
$58,115 – June’s monthly low and a major short-term support level.
$55,000 – a critical downside target if bearish pressure intensifies.
A drop below $58,115 would be particularly significant, as it would suggest sellers have regained control and could trigger another wave of downside momentum.
On the upside, a convincing break above $64,500 would strengthen the recovery narrative and shift attention toward higher resistance levels. The next major obstacle lies near $65,600, followed by a broader target zone between $65,600 and $70,000 if bullish momentum continues to build.
The current setup reflects a market still searching for direction. Bitcoin is effectively compressed between support and resistance, and such periods of consolidation often precede larger price swings. At present, the advantage appears to lean slightly toward buyers, given the market’s ability to hold near session highs and repeatedly challenge resistance rather than retreat toward support.
Why the 50-Month EMA Around $65,631 Matters
Despite recent gains, Bitcoin remains below one of its most important long-term technical barriers: the 50-month Exponential Moving Average (EMA), currently located around $65,631–$65,742.
This indicator serves as a widely monitored gauge of medium-term trend strength. Trading below the 50-month EMA suggests that sellers still maintain an advantage on the broader timeframe, even though short-term momentum has improved.
For Bitcoin bulls, reclaiming this level is arguably the most important technical objective in the near term.
A sustained move above the 50-month EMA would signal that the recent recovery is evolving into something more meaningful than a simple relief rally. It would also reduce the bearish bias that has dominated price action since the June decline and could shift the medium-term outlook toward a more neutral or constructive stance.
At current levels, Bitcoin remains only about 2.5% below the indicator. While that distance appears relatively small, overcoming a major long-term resistance zone typically requires consistent buying pressure and strong follow-through. As a result, the upcoming sessions could prove pivotal.
The broader moving-average structure highlights Bitcoin’s transitional position:
50-Month EMA: ~$65,631 (major resistance)
100-Month EMA: ~$40,322 (major long-term support)
The fact that Bitcoin remains comfortably above its 100-month EMA suggests that the long-term bull market structure has not been invalidated. However, remaining below the 50-month EMA indicates that the medium-term trend remains under pressure.
In other words, Bitcoin currently sits between a long-term bullish foundation and a medium-term corrective phase.
Looking further ahead, a move above $74,092 would represent a far more decisive bullish breakout and substantially improve the longer-term outlook. That level aligns closely with the monthly opening range near $73,674, illustrating how much ground Bitcoin must recover following June’s sell-off.
For now, the focus remains squarely on the 50-month EMA near $65,631. Reclaiming that level would provide important confirmation that buyers are regaining control and that the recent rebound has the potential to evolve into a broader recovery. Failure to do so, however, would leave Bitcoin vulnerable to remaining trapped within its corrective structure despite the recent bounce.
Derivatives Data Points to a Healthier Recovery
Bitcoin’s derivatives market is offering a relatively constructive signal as the recent rebound unfolds. Unlike previous rallies that were fueled by aggressive speculation, current positioning suggests traders are adding exposure cautiously rather than chasing price higher.
Open interest currently stands at approximately $47.71 billion, recovering from the sharp decline seen during June’s liquidation-driven selloff. Open interest reflects the total value of active futures and derivatives contracts, making it a useful measure of market participation and leverage.
The recovery in open interest indicates that traders are gradually returning to the market after leverage was largely flushed out during the correction. Importantly, the increase has not yet reached levels associated with excessive speculation, suggesting that the market is rebuilding participation on a more sustainable footing.
Funding rates reinforce this interpretation. Bitcoin’s funding rate remains positive at around 0.0087%, meaning long-position holders are paying a modest premium to short sellers. While positive funding generally reflects bullish sentiment, the current reading remains relatively subdued and far below the levels typically associated with market euphoria.
Historically, sharply elevated funding rates have often preceded corrections because they signal overcrowded bullish positioning. The current environment looks different. Traders appear constructive, but not excessively optimistic, leaving room for further upside without creating immediate vulnerability to a long-side liquidation event.
Recent liquidation data supports that view. During the latest recovery, approximately $86.6 million in short positions were liquidated compared with roughly $54 million in long liquidations. The imbalance highlights that bearish traders were forced to cover as prices moved higher, contributing to the rally’s momentum.
However, the broader derivatives landscape remains balanced. Open interest has recovered without exploding higher, funding rates remain moderate, and positioning does not indicate widespread speculative excess. Compared with conditions preceding June’s decline—when leverage had become stretched—the market now appears significantly healthier.
Taken together, derivatives metrics suggest Bitcoin’s rebound rests on a stronger foundation than a purely sentiment-driven bounce. The recovery may lack the explosive enthusiasm often seen during mature bull runs, but it also lacks the dangerous leverage imbalances that frequently lead to sharp corrections.
Prediction Markets Show Cautious Optimism
Beyond spot and derivatives activity, prediction markets offer another perspective on trader expectations. Recent contracts focused on Bitcoin’s July 7 closing price suggested participants were leaning modestly bullish, though conviction remained relatively limited.
A directional market asking whether Bitcoin would finish the day above its opening level assigned approximately:
59.5% probability to a higher close (YES)
40.5% probability to a lower or unchanged close (NO)
These figures indicate that traders saw a slightly better-than-even chance of continued gains, but not enough confidence to signal a strong consensus.
The probability distribution reflects cautious optimism rather than outright bullish conviction. Participants generally expected Bitcoin to maintain its recovery, yet remained uncertain about whether the move had enough momentum to extend significantly higher.
Momentum indicators paint a similar picture. While Bitcoin had posted a strong 24-hour gain of roughly 8.5% following the July 6 rally, shorter-term measures showed signs of slowing momentum. One-hour performance was essentially flat, while trend indicators remained below levels typically associated with sustained upside acceleration.
In practical terms, the market appears to be transitioning from an impulsive rebound phase into a consolidation phase. The initial surge attracted buyers and forced short-covering, but traders are now waiting for confirmation before committing aggressively to the next directional move.
Liquidity conditions also warrant caution when interpreting prediction-market data. Some contracts attracted relatively modest trading volume and liquidity, meaning probabilities can be influenced by comparatively small transactions. As a result, these markets are often more useful for identifying sentiment trends than for generating precise forecasts.
Across multiple prediction platforms, the broader message remained consistent: traders generally expected Bitcoin to hold its recent gains, but confidence in a sustained breakout remained limited.
That outlook aligns closely with signals from the spot market, ETF flows, sentiment indicators, and derivatives positioning. Bitcoin has clearly improved from its late-June lows, but the market has not yet reached a point where participants are overwhelmingly convinced that a new bullish trend is underway.
For now, the evidence suggests a market that is recovering and stabilizing rather than one experiencing a full-scale bull-market resurgence. The balance of probabilities favors further upside, but confirmation will likely require stronger momentum, continued ETF inflows, and a decisive break above major resistance levels such as $64,500 and the 50-month EMA near $65,631.
Gold finds it difficult to build on its modest gains during the Asian session and remains below a newly established two-week high reached just above the $4,200 level. The US Dollar draws support from safe-haven demand as investors remain cautious over ongoing uncertainties related to tensions in the Strait of Hormuz, creating pressure on the precious metal. Nevertheless, expectations for fewer interest-rate hikes from the US Federal Reserve continue to limit the Dollar’s upside, preventing buyers from taking more aggressive positions.
Technical Analysis of XAU/USD
Friday’s break above the 100-period Simple Moving Average (SMA) on the four-hour chart, followed by a move through the 23.6% Fibonacci retracement of the April-to-June decline, provided a significant boost for XAU/USD bulls. In addition, the Relative Strength Index (RSI), which remains elevated near 63, together with a positive Moving Average Convergence Divergence (MACD) signal, suggests that bullish momentum is still intact despite Gold consolidating below its recent highs.
As a result, any pullback below the 23.6% Fibonacci level around $4,164 could attract buying interest near the 100-period SMA, which is positioned around $4,147 and may act as an important support zone. A decisive drop beneath this level, however, could pave the way for a deeper decline toward the key structural support area near $3,940.
On the upside, the first resistance is located around the 38.2% Fibonacci retracement at $4,302. Beyond that, the next targets are the 50% retracement level near $4,415 and the 61.8% Fibonacci level around $4,527. A sustained advance could then bring the 78.6% retracement at $4,686 into focus, with the April swing high near $4,889 marking the next major bullish objective.
Fundamental Analysis
Although the interim agreement between the US and Iran remains in place, tensions in the Strait of Hormuz continue to simmer as Tehran moves to strengthen its influence over the vital shipping route. Over the weekend, Iran’s ambassador to China indicated that the country intends to impose new service charges on vessels transiting the strait, a proposal that has already been opposed by the United States. These developments have kept geopolitical concerns elevated, boosting safe-haven demand for the US Dollar and creating some near-term pressure on Gold prices.
At the same time, expectations for further interest-rate hikes by the US Federal Reserve have eased following weaker-than-expected US labor market data released last Thursday, which pointed to moderating employment conditions. Lower inflation concerns, reinforced by the recent decline in Crude Oil prices, could also give the Fed greater flexibility to maintain a cautious policy stance. As a result, prospects for an extended period of restrictive monetary policy have softened, limiting the Dollar’s upside potential and helping to cushion Gold from a deeper pullback.
Supporting the longer-term bullish case for the precious metal, a recent survey by the World Gold Council found that central banks are increasingly viewing Gold as a safeguard against inflation, financial instability, and geopolitical uncertainty. Nearly 90% of surveyed institutions expect global central-bank gold holdings to rise over the coming year. In addition, the European Central Bank recently reported that Gold has surpassed US Treasuries as a reserve asset in global allocations. The People’s Bank of China also continued its accumulation trend, adding 320,000 ounces of Gold in May and extending its buying streak to 19 consecutive months.
Looking ahead, investors will closely monitor the release of the US ISM Services PMI, while remarks from key members of the Federal Open Market Committee (FOMC) could influence US Dollar sentiment during the North American session. Even so, the broader fundamental backdrop remains supportive for Gold. Consequently, any short-term declines are likely to attract fresh buying interest, suggesting that the recent rebound from the year’s low may still have room to extend.
Bitcoin rebounded to around $61,800 on Friday after plunging to a 21-month low of $57,800 earlier in the week. Despite the recovery, sentiment remains cautious as US-listed spot Bitcoin ETFs experienced net outflows totaling $526.64 million through Thursday, marking an eighth straight week of withdrawals. Analysts suggest that quarter-end portfolio rebalancing by institutional investors could offer near-term support and help stabilize Bitcoin prices.
Bitcoin (BTC) has gained more than 3% this week and was trading above $61,800 on Friday, recovering from a drop to a 21-month low earlier in the week. Despite the rebound, institutional selling pressure remained evident, as spot Bitcoin Exchange-Traded Funds (ETFs) registered net outflows exceeding $526 million through Thursday, putting the market on track for an eighth consecutive week of withdrawals. Analysts, however, believe quarter-end portfolio rebalancing could offer temporary support for the leading cryptocurrency.
Institutional outflows remain a headwind
Institutional appetite for Bitcoin continued to weaken throughout the week. According to SoSoValue data, spot BTC ETFs recorded cumulative net outflows of $526.64 million by Thursday. Unless Friday sees a substantial reversal in fund flows, Bitcoin ETFs will log their eighth straight week of net withdrawals. The persistent outflows suggest institutional investors remain cautious, leaving the market with limited support as Bitcoin recently fell to a 21-month low of $57,800.
Meanwhile, a recent report from CryptoQuant pointed to growing signs of heightened volatility ahead. The firm noted that Bitcoin exchange inflows surged to nearly 50,000 BTC in a single day, reaching levels seen only four other times in 2026. On Tuesday alone, approximately 49,000 BTC flowed into exchanges, an unusually large amount that has historically coincided with periods of significant price swings.
CryptoQuant analysts emphasized that the increase in exchange deposits occurred while Bitcoin was testing the key $60,000 support zone. A decisive break below that level could open the door for a decline toward $53,000, which corresponds to Bitcoin’s realized price.
The report added that such elevated inflow activity indicates a substantial volume of Bitcoin is being transferred to exchanges, a pattern that has often preceded major directional moves in the market.
Progress in US-Iran talks supports Bitcoin rebound
Improving sentiment around geopolitical developments helped Bitcoin recover during the second half of the week, with BTC climbing back above $61,000 after plunging to a 21-month low of $57,800 on Wednesday.
On Wednesday, Qatar’s Foreign Ministry reported that the United States and Iran had achieved “positive progress” in indirect negotiations held in Doha, with discussions advancing matters linked to the June ceasefire framework. Officials noted that the talks were building on outcomes from a recent summit in Switzerland, fueling optimism that a more lasting agreement could be reached.
US President Donald Trump also expressed confidence in the negotiations, stating that progress had been made regarding potential restrictions on Iran’s nuclear program and that denuclearization efforts were moving forward. Meanwhile, Vice President JD Vance indicated that nuclear-related issues would likely be addressed in future discussions.
The next round of negotiations is expected after the funeral ceremonies for Ayatollah Ali Khamenei, whose burial is scheduled for July 9.
Despite the improved outlook, uncertainty surrounding the Strait of Hormuz remains a key risk factor. Although shipping traffic through the strategic waterway has recovered significantly, volumes remain below pre-conflict levels. Market participants will continue monitoring developments in the Middle East, as any resurgence in tensions between Washington and Tehran could quickly undermine risk sentiment and trigger renewed selling pressure in assets such as Bitcoin.
Softer US labor data eases pressure from Fed expectations
On the macroeconomic front, weaker-than-expected US employment figures have reduced expectations for further Federal Reserve tightening, creating a more favorable environment for risk assets.
Investor expectations for additional rate hikes declined after Thursday’s labor market report showed the US economy added just 57,000 jobs in June, well below forecasts of 110,000. In addition, the previous month’s payroll figure was revised lower from 172,000 to 129,000, while the unemployment rate edged down to 4.2%.
The softer labor market data, combined with easing inflation concerns driven by lower crude oil prices, prompted traders to scale back expectations for future Fed tightening. Markets shifted from anticipating one or two rate hikes in 2026 to pricing in anywhere between no hikes and a single increase. This reassessment weakened the US dollar and provided additional support for Bitcoin’s recovery.
Could quarter-end rebalancing become Bitcoin’s next catalyst?
A recent report from K33 Research suggests that quarter-end portfolio rebalancing may offer a short-term boost for Bitcoin.
According to the study, ETF flow patterns during the six trading days surrounding month-end—three sessions before and three sessions after—have frequently diverged from prevailing monthly trends. Over the past 18 months, this phenomenon was observed in half of the sample periods.
K33 analysts noted that several months in which Bitcoin underperformed the S&P 500 were followed by stronger ETF inflows around month-end and during the opening days of the following month. This behavior is consistent with portfolio rebalancing, where investors increase Bitcoin allocations after periods of relative weakness to restore target weightings within diversified portfolios.
However, the analysts cautioned that the relationship is not always consistent. Roughly half of the observed periods failed to exhibit the same pattern, suggesting that rebalancing is only one of several factors shaping institutional demand for Bitcoin.
That said, the trend has become increasingly noticeable over the last four quarters. If it persists, quarter-end portfolio adjustments could provide a meaningful tailwind for Bitcoin, potentially supporting a recovery during the opening trading sessions of July.
Market analysts remain divided on whether quarter-end portfolio rebalancing can provide a meaningful boost to Bitcoin’s outlook.
According to Ryan Lee, Chief Analyst at Bitget, quarter-end rebalancing may generate short-term trading activity, but it is unlikely to alter Bitcoin’s broader market direction. He noted that BTC has been trading in a relatively tight range between $58,000 and $62,000 after losing roughly 14% during the second quarter, while continued spot ETF outflows and weakening institutional demand remain significant headwinds.
Lee explained that portfolio adjustments can trigger opportunistic buying when cryptocurrency allocations fall below target levels. However, he emphasized that Bitcoin’s next major move will likely depend more on factors such as ETF flows, macroeconomic developments, and overall investor risk appetite than on routine portfolio rebalancing.
Dean Chen, an analyst at Bitunix, expressed an even more cautious view. In his assessment, quarter-end rebalancing is unlikely to act as a meaningful bullish catalyst for Bitcoin and should instead be viewed primarily as a short-term liquidity redistribution process rather than a source of new capital entering the market.
Chen noted that in a prolonged downtrend, rebalancing flows can work in either direction. While some investors may increase exposure to underweighted risk assets, generating temporary buying pressure, others may choose to cut positions as part of broader risk-reduction and deleveraging strategies.
As a result, he believes quarter-end rebalancing is more likely to increase short-term market volatility than establish a sustained directional trend. In his view, the process merely reallocates existing capital rather than introducing fresh funds into the market.
Consequently, Chen argues that quarter-end portfolio adjustments should be treated as a temporary market influence rather than a structural driver capable of changing Bitcoin’s longer-term trajectory. Instead, the cryptocurrency’s broader outlook will continue to be shaped by institutional demand, ETF flows, macroeconomic conditions, and overall market sentiment.
Technical Outlook: Is Bitcoin Forming a Bottom?
Bitcoin rebounded more than 3% this week, climbing above $61,800 on Friday after finding support near a long-term ascending trendline that has connected major lows since January 2023. Despite the recovery, BTC still recorded a fresh yearly low of $57,800 earlier in the week, marking its weakest level since September 2024.
On the weekly timeframe, maintaining support around the $58,000 trendline remains critical for the bullish case. If buyers continue defending this area, Bitcoin could extend its rebound toward the 200-week Simple Moving Average (SMA) near $62,652. A decisive weekly close above that level would strengthen the recovery outlook and potentially open the door for a move toward the 78.6% Fibonacci retracement level at $65,520, measured from the August 2024 low of $49,000 to the October 2025 record high of $126,199.
However, longer-term momentum indicators continue to flash warning signs. The Relative Strength Index (RSI) on the weekly chart has fallen to around 35 and is approaching oversold territory, reflecting persistent bearish pressure. Meanwhile, the Moving Average Convergence Divergence (MACD) generated a bearish crossover in late June and remains in negative territory, reinforcing the broader downtrend.
Should Bitcoin break below the ascending trendline and close the week under the $58,000 area, selling pressure could intensify, exposing the next major support zone around $55,777.
On the daily chart, BTC has recovered from its recent 21-month low but still trades below its key moving averages, keeping the broader trend tilted to the downside. The cryptocurrency remains beneath the 50-day, 100-day, and 200-day Exponential Moving Averages (EMAs), located at approximately $66,028, $69,826, and $75,782, respectively.
The daily RSI has improved to around 44 but remains below the neutral 50 level, suggesting that buying interest is recovering only gradually. At the same time, the MACD has turned positive, with the MACD line moving above both its signal line and the zero line, indicating improving momentum. Nevertheless, the recovery remains insufficient to fully offset the prevailing bearish structure.
From a resistance perspective, Bitcoin faces its first significant hurdle near $64,000. A successful break above this level would bring the 50-day EMA at $66,028 into focus, followed by the 100-day EMA at $69,826 and the 200-day EMA at $75,782. Beyond those levels, a more substantial resistance zone emerges around $84,410.
Conversely, if Bitcoin fails to regain and sustain trading above the $64,000 region, downside risks could re-emerge. In that scenario, the market may retest lower support levels, with the psychologically important $55,000 area serving as the next major target for bears.
Bitcoin investors are unlikely to remember June 2026 positively. The world’s largest cryptocurrency ended the month down more than 20%, pressured by persistent inflation, shifting Federal Reserve expectations, and an unprecedented wave of institutional selling through spot Bitcoin exchange-traded funds (ETFs).
By June 25, Bitcoin had fallen to an intraday low of $58,188 — its weakest level since September 2024 and more than 53% below its October all-time high of $126,198.
The wider crypto market suffered alongside it. Total cryptocurrency market capitalization dropped to $2.1 trillion by the end of June, down sharply from the $4.3 trillion peak recorded in October 2025. Bitcoin’s year-to-date decline widened to 34%, while its market dominance rose to roughly 55.6% as altcoins experienced even steeper losses. June’s sharp selloff, however, was not triggered by a crypto-specific event. Instead, it stemmed from a critical U.S. inflation report.
The Inflation Report That Shook Markets
On June 25, investors received a harsh macroeconomic reality check. May’s Personal Consumption Expenditures (PCE) price index — the Federal Reserve’s preferred inflation gauge — came in significantly hotter than expected. Headline inflation climbed to 4.1% year-over-year, its highest level since April 2023 and more than double the Fed’s 2% target. Core PCE, which excludes food and energy, rose to 3.4%, also marking a multi-year high.
Major financial institutions quickly revised their forecasts. Bank of America now expects three consecutive 25-basis-point rate hikes in September, October, and December, potentially lifting the federal funds rate to between 4.25% and 4.50%, up from the current 3.50%–3.75% range. Deutsche Bank projected two rate hikes beginning in September, while Goldman Sachs pushed its expectations for rate cuts back to 2027.
For Bitcoin, the environment became increasingly unfavorable. Higher interest rates tend to attract capital toward safer, yield-generating assets while reducing appetite for speculative investments. Within a day of the inflation release, more than $1.48 billion in crypto positions were liquidated, including approximately $665 million tied to Bitcoin alone.
Adding to the uncertainty, new Federal Reserve Chairman Kevin Warsh abandoned the Fed’s previous practice of forward guidance, leaving markets highly sensitive to every inflation reading. Although the Federal Open Market Committee held rates steady during its June meeting, officials removed any indication that future rate cuts were still on the table.
ETF Outflows Become the Main Story
Beyond macroeconomic pressures, June’s most significant development unfolded inside the spot Bitcoin ETF market.
According to SoSoValue, U.S. spot Bitcoin ETFs recorded $4.06 billion in net outflows during June 2026 — the largest monthly redemption since the products launched in January 2024. The figure surpassed the prior record of $3.56 billion set in February 2025. In the final week of June alone, investors withdrew $1.79 billion. Combined with May’s $2.43 billion in outflows, ETF flows for the year have now turned negative overall.
BlackRock’s NASDAQ:IBIT accounted for the majority of the withdrawals, losing roughly $3.3 billion — about 75% of June’s total outflows. On June 26 alone, the fund saw $444.5 million redeemed in a single trading session, matching the combined outflows from every other spot Bitcoin ETF that day.
Meanwhile, Fidelity Investments’s NYSE:FBTC lost $456 million during the month, while Grayscale Investments’s NYSE:GBTC recorded $303 million in redemptions.
Overall, ETF issuers are estimated to have sold around 51,726 Bitcoin — worth approximately $5 billion — over a 30-day period as authorized participants liquidated holdings to satisfy redemption demand. Just months earlier, the iShares Bitcoin Trust had been the dominant source of inflows into the category. By late June, it had effectively become the market’s primary exit route.
Signs of Stabilization Remain
Despite the heavy losses, not every indicator points toward further downside.
On-chain data suggests long-term holders have continued accumulating Bitcoin near the $58,000 level. Geoff Kendrick of Standard Chartered has argued that the recent ETF outflows appear cyclical rather than structural. In addition, the Crypto Fear and Greed Index fell to 11 — firmly within “Extreme Fear” territory — a level that has historically aligned with market bottoms rather than the beginning of extended downturns.
Strategy, formerly known as MicroStrategy, still holds 847,363 Bitcoin and remains one of the largest corporate Bitcoin owners globally. However, the company’s disclosure that it sold 32 Bitcoin to fund dividend obligations — its first net sale in years — added another layer of uncertainty to an already fragile market environment.
Attention now shifts to July 29, when the Federal Open Market Committee meets again under Chairman Warsh. With CME FedWatch data implying more than a 37% probability of another rate hike by December, the market will likely scrutinize the tone of the meeting as closely as the decision itself.
June ultimately served as a reminder that while the ETF era opened Bitcoin to institutional capital, institutional investors can reverse course just as quickly.
Bitcoin Breaks Below $60,000 as Bearish Structure Deepens
Bitcoin has slipped below the $60,000 threshold, reinforcing a deterioration in near-term market structure. BTC traded around $60,128 on Monday, briefly touching $59,748—its weakest level since October 2024. The move caps a month-long decline that has fully unwound the spring rally.
June opened near $73,674 and briefly topped at $74,092 before reversing sharply to a monthly low of $58,115, ending the month down ~18.4%. The key issue is not just the break of $60,000, but the loss of trend integrity: short-term moving averages are rolling over, and dip-buying has largely faded.
Despite strength in broader equities—particularly the Nasdaq, driven by AI-related momentum and easing geopolitical concerns—Bitcoin has failed to participate.
This divergence suggests BTC is currently behaving less like a macro hedge and more like a high-beta liquidity-sensitive risk asset competing for speculative flows. Capital rotation appears to be favoring AI infrastructure, large-cap tech, and IPO narratives, draining marginal demand from crypto.
Above 100-month EMA: $40,322 (long-term trend still intact)
Price action confirms sustained downside pressure, with weekly losses near 4.5% and monthly drawdown ~18%, alongside declining trend structure across shorter timeframes.
The market remains technically weak, though still within a cyclical correction rather than a structural breakdown.
Institutional Flows: ETF Demand Reversal Becomes Central Risk
A major shift has emerged in institutional positioning:
~ $5.96B net outflows from US spot Bitcoin ETFs over the past 30 days
Including a peak monthly redemption of ~$2.43B
Multiple large single-day withdrawals ($400–500M+), including a $1.26B outlier
Roughly $3.4B exited in a single week at peak stress
Given ETFs have become a dominant marginal price driver, this reversal materially weakens demand elasticity. Brief inflow days have not yet signaled trend reversal.
Sustained inflows would be required to stabilize price action; continued outflows would reinforce downside momentum.
Corporate Demand Weakens: Strategy Flywheel Under Pressure
The corporate accumulation narrative is also deteriorating.
Strategy, the largest corporate Bitcoin holder (~847,000 BTC), is now under pressure as BTC trades below its average cost basis. Its equity drawdown has reduced its premium-to-NAV, weakening its ability to raise capital for further accumulation.
More importantly, the firm has expanded financial flexibility to include potential Bitcoin sales for liquidity and buybacks—marking a meaningful shift away from its previous purely accumulation-driven stance.
Even if accumulation continues, the reflexive “buy-the-premium” flywheel that previously amplified demand is clearly impaired.
Derivatives markets have undergone a sharp deleveraging:
Open interest down ~19%
Majority of liquidations from long positions
Multi-billion-dollar cascading liquidation events during breakdown
This reset improves structural stability but removes a key source of reflexive upside (forced shorts and leverage expansion). Recovery now depends on genuine spot demand rather than positioning-driven flows.
Technical Structure: Bearish Alignment Across Timeframes
Bitcoin’s technical setup is aligned bearish across multiple horizons.
Price remains below all major short- and medium-term moving averages, including:
20-month EMA: $79,979
50-month EMA: $65,631 (critical level)
A sustained reclaim of $65,631 would materially weaken the bearish structure. Until then, rallies are corrective within a broader downtrend.
Shorter-term indicators reinforce weakness:
50-day MA (~$70,238) trending lower and acting as resistance
200-day MA rolling over
Most intraday averages flattening or declining above price
Price is also compressing between roughly $59,000–$61,000, suggesting volatility expansion risk rather than immediate resolution.
Key Levels: Downside Risk Remains Active
Critical support: $58,115
Break would confirm continuation of downtrend
Downside targets:
$55,000: secondary structural support
$48,000: deeper cycle retracement zone
The rising 100-month EMA (~$40,322) defines the long-term structural floor, consistent with a cyclical correction rather than full regime failure.
As long as $58,115 holds, rebound scenarios remain valid—but fragile.
Upside Structure: Heavy Resistance Cluster
Key resistance levels:
$62,500: initial supply zone
$64,178–$67,180: dense resistance cluster
$65,631: 50-month EMA (key structural pivot)
A reclaim of $65,631 would be the first meaningful signal of structural repair and open a path toward $70,000. Failure to reclaim it keeps rallies within corrective territory.
Momentum & Sentiment: Oversold, Not Reversed
Momentum remains weak across timeframes:
RSI: deeply depressed, near oversold on daily
MACD: negative with no confirmed bullish crossover
Breadth: broadly bearish across indicators
Sentiment sits at “Extreme Fear” (~18 on Fear & Greed Index), historically consistent with late-stage stress but not a timing signal on its own.
The core tension remains unresolved: sentiment is washed out, but price has not confirmed reversal.
Bottom Line
Bitcoin is in a structurally corrective phase driven by three reinforcing forces:
Bitcoin’s historically dependable four-year halving cycle indicates that the current bear market could persist through Q3 before a more sustainable bottom is established. But how do valuation metrics, central bank policy, liquidity growth, market sentiment, and institutional participation factor into the outlook?
Key Bitcoin Takeaways
The well-established four-year halving cycle points to continued downside pressure through Q3 before Bitcoin potentially forms a lasting market bottom.
Near-term momentum for Q3 still leans bearish, though the outlook for Q4 is becoming increasingly constructive as valuations remain relatively subdued and long-term holders continue to show resilience.
Long-term investors may still need to remain patient until price action provides clearer confirmation of a more bullish trend heading into the lead-up to the 2028 halving cycle.
Bitcoin H1 2026 Review
In our previous Bitcoin outlook, we noted that “Bitcoin remains in a downtrend from the October 2025 peak” and that “there is still no clear evidence the current decline has ended.” Despite several recovery attempts — including a rebound above $80K in mid-May — that assessment has largely held true. The main question facing crypto traders now is not whether the downtrend exists, but when and at what level it may finally bottom out.
Below, we revisit our quarterly outlook for the world’s largest cryptocurrency and examine the key fundamental and technical forces likely to influence Bitcoin over the months ahead.
Bitcoin Q3 2026 Outlook
From a broader market-cycle perspective, analysts continue to focus on Bitcoin’s historically reliable four-year cycle linked to the Bitcoin Halving. While past performance does not guarantee future results, the cycle has consistently helped identify major market tops and bottoms over time.
For newer market participants, the Bitcoin Halving refers to the event where mining rewards are reduced by half. This slows the pace of new Bitcoin issuance, tightening supply growth over time. Reduced supply inflation has historically strengthened Bitcoin’s scarcity narrative and increased its appeal among long-term investors. Following the April 2024 halving, Bitcoin’s annual supply growth rate fell below 1% — less than half the estimated annual supply growth of gold.
One of the most widely followed long-term cycle charts — sometimes nicknamed “The Only Bitcoin Chart You’ll Ever Need™” — illustrates how previous halvings often marked the shift from the yellow post-bottom recovery phase into the green full-scale bull market phase, eventually followed by the red bear-market reset phase as optimism fades and sentiment resets.
Projecting a similar cycle forward from the April 2024 halving suggests that Bitcoin likely peaked near the beginning of Q4 2025, with a more durable long-term bottom potentially not arriving until closer to the start of Q4 2026.
Beyond the four-year cycle, Bitcoin’s broader fundamental and technical outlook remains mixed, with several competing forces shaping the market environment.
From a macroeconomic standpoint, the monetary policy landscape appears to be shifting once again, as an increasing number of central banks lean toward higher interest rates while managing the ongoing effects of geopolitical disruptions. Although most global central banks have still been easing policy in recent months, the broader trend may be starting to reverse. Major institutions such as the European Central Bank, Bank of Japan, and Federal Reserve are all signaling a growing bias toward additional tightening, potentially pressuring other central banks around the world to follow suit.
Looking ahead, the growing focus on the risk of renewed inflation could become a meaningful headwind for Bitcoin during the second half of the year, particularly as governments around the world continue to maintain relatively accommodative fiscal policies.
At the same time, the expansion of fiat liquidity within the global financial system has moderated in recent months. The so-called “M2” money supply — a broad measure tracked by central banks that includes physical cash, checking deposits, savings accounts, and other short-term savings instruments such as certificates of deposit (CDs) — continues to increase overall, but at a slower pace. Year-over-year M2 growth has cooled to around 6%, down from levels near 12% seen earlier this year.
One of the core narratives underpinning Bitcoin’s long-term appeal is its role as “hard money” — a potential hedge against the debasement of fiat currencies. As long as the global money supply continues to expand over time, that narrative may continue to provide underlying support for Bitcoin prices.
Beyond the broader macro backdrop, another major driver of Bitcoin’s rise in recent years has been sustained accumulation from both large financial institutions and retail investors. Alongside the growing number of companies adding Bitcoin to their corporate treasuries, institutional participation through traditional finance channels has also expanded significantly. In particular, spot Bitcoin ETFs have attracted substantial demand from “TradFi” investors, with cumulative inflows approaching $53 billion. However, those inflows have largely plateaued since mid-2025, suggesting institutional momentum has slowed for now.
Broadly speaking, renewed buying activity in Bitcoin ETFs would likely provide support for the cryptocurrency, while a transition toward sustained outflows or coordinated selling could create additional downward pressure.
From a valuation standpoint, one closely watched indicator is the MVRV (Market Value to Realized Value) Z-score, which compares Bitcoin’s current market price with the average price at which coins last moved on-chain. The metric has now declined to around 0.3 — much closer to the historical bear-market bottom zone near 0.0 than the overheated peak above 3.0 seen earlier in the cycle. This suggests that Bitcoin’s valuation has become significantly less stretched, even if broader market conditions remain uncertain.
In another sign that Bitcoin is gradually maturing as an investment vehicle — and arguably emerging as a distinct asset class — this valuation metric has become noticeably less volatile over time. For example, the latest cycle peak failed to rise above 4, well below the extreme readings between 7 and 10 seen in prior cycles. As a result, the indicator may also avoid falling as deeply below zero as previous bear-market bottoms in the -0.3 to -0.6 range would imply. Whether the MVRV Z-score continues to serve as a reliable long-term valuation gauge remains to be seen.
Another important factor to monitor is the behavior of long-term holders. As highlighted in previous outlooks, investors who have held Bitcoin for more than a year are generally not seeking short-term profits. Instead, they tend to be committed long-term participants — often referred to as “HODLers” — who are less likely to sell unless they are sitting on exceptionally large gains.
As the chart below illustrates, the share of Bitcoin held for at least one year has declined from record highs above 70% to below 59%. However, the metric now appears to be stabilizing and gradually trending higher again as long-term holders continue to withstand the worst phase of the bear market. Because this indicator naturally evolves slowly, it may not shift dramatically in the near term. Still, any renewed wave of selling from longer-term holders could counterbalance ETF inflows during the second half of the year.
Taking all of these factors into account, the near-term outlook for Bitcoin in Q3 remains tilted to the downside. Growth in global money supply and Bitcoin ETF inflows has slowed, central banks are increasingly adopting a more hawkish stance, and the historically reliable four-year cycle continues to point toward additional short-term weakness.
That said, the outlook for Q4 is beginning to appear more constructive. Valuation metrics have cooled considerably, long-term holders continue to show resilience, and the four-year cycle itself is approaching what could become a major cyclical bottom.
Naturally, the scenarios outlined in this report may not unfold exactly as expected — and in some cases, the market may have already priced in these risks and opportunities. As always, traders and investors should approach Bitcoin and other crypto assets with caution while closely monitoring both macroeconomic conditions and crypto-specific indicators as the year progresses.
Bitcoin Technical Analysis
Looking at the longer-term chart, Bitcoin remains firmly in a downtrend from the October 2025 peak. Since topping out, the cryptocurrency has continued to form a pattern of lower highs and lower lows, interrupted only by periodic consolidation phases and short-lived relief rallies.
As we highlighted three months ago, there is still little technical evidence suggesting that the broader downtrend has ended. If Bitcoin breaks below the year-to-date lows around $60K, the next major support zone begins in the mid-$50K area. Such a move would imply an approximate 60% decline from the cycle peak, consistent with the pattern of progressively smaller bear-market drawdowns seen as Bitcoin has matured over time — roughly -93%, -86%, -84%, and -78% during the 2011, 2014, 2018, and 2022 bear markets, respectively.
On the upside, bulls would likely need to reclaim former support-turned-resistance near the $66K region before confidence in a longer-term trend reversal can improve meaningfully. Beyond that, the May high near $83K remains the next major hurdle. Until those levels are decisively broken, long-term investors may continue to benefit from patience while waiting for clearer confirmation of a more sustainable bullish trend heading into the 2028 halving cycle.
After the latest price action, markets are nearing a key inflection point.
The U.S. dollar is pressing against a significant resistance area, while precious metals are holding just above important support levels. The way today’s session closes could offer the confirmation traders have been waiting for and help define the next major directional move.
U.S. Dollar Index (DX.F)
As noted in the prior session:
“(…) The dollar remains confined within a relatively tight range, with recently reclaimed March highs acting as support, while a major resistance zone caps upside near the 38.2% Fibonacci retracement, the upper edge of the rising channel, and a bearish gap from late May 2025 (100.75–100.95). (…)”
From a current standpoint, buyers have successfully defended the reclaimed March highs, giving the dollar enough momentum to retest the highlighted resistance cluster.
At present, the index is trading above both the 38.2% Fibonacci retracement and the prior bearish gap from last year. However, the upper boundary of the rising channel remains a key barrier.
This level is important because today’s close could prove decisive not only for the dollar but also for the broader metals complex.
A daily close above the channel resistance would signal a potential breakout, opening the path toward the next resistance zone around 101.39–101.59, where the 127.2% Fibonacci extension aligns with the May 2025 highs. Such a development would likely weigh on precious metals.
Conversely, another failed breakout—similar to Friday’s rejection—could push the dollar back toward the March highs, offering relief to metals and easing downside pressure.
In short, today’s close may be one of the most consequential of the week.
Platinum (PL.F)
On the daily chart, one clear observation stands out.
Although platinum has not yet registered a daily close below the key 1641 level, buyers were unable to hold the June low—a technical signal that raises doubts about their commitment to sustaining higher prices.
The current low is now positioned within an important support zone, formed by two bullish gaps from late November, the lower boundary of the orange channel, and the 127.2% Fibonacci extension.
Put differently, support is still present.
However, support by itself is not sufficient.
If buyers fail to reclaim 1665 by today’s close—in effect losing the bullish gap from June 12—a move toward the 1600 area becomes increasingly probable, particularly if the U.S. dollar maintains upward momentum, consistent with Friday’s bearish scenario.
On the other hand, the first meaningful sign of recovery would be a daily close back above 1707, which would also reinforce the earlier invalidation of the break below the March low.
Palladium (PA.F)
To frame today’s session, it is useful to revisit yesterday’s outlook:
“(…) Palladium remains below the previously broken lower boundary of the orange consolidation. As long as price holds below 1305, a further decline toward the 1234 area cannot be ruled out. (…)”
From today’s perspective, palladium has largely followed that bearish roadmap, with the downside target now reached. Price is currently trading beneath the lower boundary of the June 12 bullish gap.
This is an unfavorable development for buyers.
The reason is straightforward: a sustained break below that gap threatens the validity of the previously discussed double-bottom structure.
At this stage, bulls need to act quickly to reclaim the gap. If they fail to do so, the market is likely to shift its focus toward the possibility of another downside extension.
Copper (HG.F)
Copper (HG.F) moved in line with yesterday’s technical expectations. As previously noted:
“(…) As long as Thursday’s price gap remains unfilled, the bearish outlook for Friday stays in place:
“(…) with the downside gap from Thursday still acting as overhead resistance, a retest of today’s low and a possible move toward the next support area around 617–619 remains on the table.”
The failed attempt to break back into the lower edge of Thursday’s bearish gap sparked renewed selling pressure, and price ultimately reached the projected downside target (well done to those who positioned for the move).
From here, the setup becomes more nuanced.
Copper has now entered a key support region defined by prior highs from February and April, along with the May 20 low. This zone previously stabilized price action in May and could again act as a base for buyers to step in.
However, given the strength and momentum of today’s bearish candle, any recovery may initially be limited, with a move toward the 38.2% Fibonacci retracement near 611 looking more likely than a full bullish reversal at this stage.
Today’s Takeaway
Dollar (DX.F)
Focus on the upper boundary of the rising channel
A daily close above it would open the path toward 101.39–101.59
Rejection would likely lead to a retest of the March highs
Today’s close is a key confirmation point
Platinum (PL.F)
Key level to watch: 1665
A close below this support keeps bearish pressure in place
Next major support lies near 1600
Bullish momentum only improves on a move back above 1707
Palladium (PA.F)
Trading below the June 12 bullish gap at 1249 raises the risk of further downside and a retest of recent lows
A recovery back above this level would weaken the bearish setup
Copper (HG.F)
Currently testing the 612.85–615 support zone
Next key level below is 611
A move back above 627.50 would invalidate today’s bearish breakdown
Stay disciplined, respect key levels, and let confirmation guide positioning.
The wave of selling that began in Seoul and swept through the semiconductor sector quickly extended beyond equities and into cryptocurrencies. Bitcoin (BTC-USD) fell to around $62,300, losing roughly 3% on the day after slipping below the $63,000 level as a broad risk-off mood pushed high-growth and high-volatility assets lower across the board. The decline was not driven by any crypto-specific catalyst—there were no exchange failures, protocol issues, or regulatory shocks. Instead, Bitcoin once again behaved as it has for much of the year, trading closely alongside the AI and technology sectors and weakening when those areas came under pressure.
That relationship has become a defining feature of the market. Once promoted as a form of digital gold and a hedge against traditional assets, Bitcoin has instead moved largely in tandem with risk assets throughout 2026. The cryptocurrency remains about 50% below its October 2025 peak near $126,200, with its decline mirroring the same concerns over interest rates, tightening liquidity conditions, and growing doubts surrounding AI-driven valuations that have weighed on the Nasdaq. When South Korea’s Kospi plunged 10% amid a memory-chip selloff and technology stocks came under pressure globally, Bitcoin followed the same downward path. Even though gold, a traditional safe-haven asset, also weakened, Bitcoin experienced a steeper drop because of its higher-risk profile.
The key focus is not the 3% decline itself, but where it leaves the price. Bitcoin is now testing the critical $62,500–$60,000 support zone that traders have been monitoring for weeks as the final major floor before a potentially deeper downturn. A decisive break below this range could signal substantially greater downside risk, while a successful defense would suggest the move is simply another sharp selloff within a broader consolidation phase. For now, the market’s next direction hinges on how Bitcoin reacts at this pivotal level.
Bitcoin’s Technical Position
Bitcoin is trading near $62,300, down roughly 3% on the day and more than 3% over the past week. The decline has pushed BTC below the $64,000 support area and under the psychologically important $63,000 level, both of which had recently provided a short-term floor. From its October 2025 record high near $126,200, Bitcoin has now lost approximately half of its value, leaving the February 2026 low around $60,062 as the next critical support level directly beneath current prices.
The broader trend has been characterized by a gradual decline interrupted by periodic sharp selloffs. Throughout the year, Bitcoin surrendered the $90,000, $80,000, and $70,000 thresholds before finding temporary stability in the $64,000–$66,000 range. That support zone has since failed, leaving the $62,500–$60,000 region as the final major cushion before the key $60,000 psychological mark. A decisive break below that area would significantly weaken the chart structure and expose the market to deeper downside risks.
Market volatility has increased alongside the recent equity-market correction. As is often the case during risk-off periods, alternative cryptocurrencies have suffered larger losses than Bitcoin. Although BTC has held up somewhat better than major rivals such as Ethereum and Solana, that relative strength offers limited reassurance while prices remain under pressure and support levels continue to be tested.
The Correlation Driving Bitcoin in 2026
The defining characteristic of Bitcoin in 2026 has been its growing sensitivity to broader risk sentiment, particularly within the technology and AI sectors. Today’s price action reinforced that relationship. A selloff in leading AI and semiconductor stocks triggered sharp declines across Asian equity markets, with weakness spreading from Seoul into Tokyo, Hong Kong, Europe, and the United States. Bitcoin fell alongside those markets, reflecting the fact that the same capital flows fueling AI-related investments have also been supporting crypto assets. When investors reduce risk exposure, both sectors tend to come under pressure simultaneously.
This marks a significant departure from Bitcoin’s original investment narrative as an uncorrelated asset or “digital gold.” While there have been periods since late 2025 when Bitcoin diverged from the Nasdaq, that divergence has often been unfavorable—underperforming during portions of technology rallies while still participating in equity-market declines. As a result, Bitcoin has increasingly behaved like a high-beta liquidity asset: among the first positions investors sell when reducing risk and among the last to recover when confidence returns.
Consequently, Bitcoin’s near-term outlook appears more dependent on macroeconomic forces than on crypto-specific developments. Factors such as Federal Reserve policy expectations, liquidity conditions, and sentiment toward AI and technology stocks are currently exerting greater influence on price action than blockchain adoption trends or traditional crypto cycle narratives. As long as risk appetite remains constrained and technology markets face headwinds, Bitcoin is likely to remain under pressure. A more durable recovery may require stabilization in broader financial markets before meaningful buying interest returns to the cryptocurrency sector.
The $62,500–$60,000 Zone Is Bitcoin’s Critical Line of Defense
From a technical perspective, nearly every major chart signal points to the same conclusion: the $62,500–$60,000 support region is now the most important battleground for Bitcoin. After the breakdown of the $66,000–$65,000 support area, BTC has fallen directly into this final major demand zone. Whether the current correction stabilizes or evolves into a deeper bearish phase will likely depend on how price behaves here. Liquidity is concentrated around $60,000 on the downside and roughly $68,400 on the upside, creating a clearly defined range. Holding above $60,000 preserves the broader consolidation structure, while a decisive break could expose a much larger downside vacuum.
The bearish case remains technically credible. A breakdown from a weekly bearish-flag formation projects a potential measured-move target near $52,000. Although that objective has not yet been confirmed, it remains a valid risk scenario while prices trade beneath key resistance levels. Below $60,000, market participants are increasingly focused on the $50,000 area as the next major support reference. Prediction markets and sentiment indicators have also reflected growing expectations that Bitcoin could revisit sub-$50,000 levels later in the year if macroeconomic conditions continue to deteriorate. While such outcomes are far from guaranteed, they represent the downside roadmap traders may follow if current support fails.
The significance of $60,000 extends beyond technical analysis alone. It served as the floor during the February 2026 selloff, when Bitcoin briefly touched approximately $60,062 before rebounding. Since then, the level has repeatedly acted as the psychological anchor of the correction. A sustained move below it would establish a new low for 2026 and signal that buyers have lost control of one of the market’s most closely watched support zones. Such a breakdown could trigger additional liquidation and capitulation from investors who have defended the area throughout the year. For that reason, the $62,500–$60,000 range is not merely another support level—it is arguably the last major support level that currently matters.
Moving Averages Continue to Cap Any Recovery Attempt
Bitcoin’s inability to generate a meaningful recovery is also reflected in its moving-average structure. The 50-day simple moving average sits near $72,450, while the 200-day simple moving average remains even higher around $76,911. Both trend indicators are well above current prices and have repeatedly acted as barriers to upside momentum. When price trades significantly below both medium- and long-term moving averages, rallies often encounter persistent selling pressure from investors looking to exit positions at more favorable levels.
Before Bitcoin can challenge those longer-term trend lines, it must first reclaim lower resistance zones. The $66,000–$68,000 region represents the initial hurdle and would need to be recovered to neutralize the immediate bearish structure. Beyond that, a move through $70,000–$71,000 would reopen the path toward the broader $76,000–$80,000 resistance area. Given Bitcoin’s current position near $62,300, such a recovery would require a significant improvement in market sentiment, potentially driven by softer inflation data, a more accommodative stance from the Federal Reserve, or renewed institutional demand.
Until such catalysts emerge, the technical picture remains tilted to the downside. The prevailing moving-average structure continues to reinforce bearish momentum, and many quantitative and algorithmic models still classify Bitcoin’s trend as negative. In practical terms, the market remains in a downtrend unless buyers can reclaim key resistance levels. At present, bulls are focused on defending support rather than launching a meaningful advance, leaving the burden of proof firmly on the upside.
ETF Outflows Continue to Pressure Bitcoin
One of the biggest headwinds for Bitcoin remains the persistent wave of capital leaving U.S. spot Bitcoin ETFs. The institutional demand that was expected to provide a long-term support base has instead become a source of selling pressure. During the first 18 trading days of June, spot Bitcoin ETFs recorded approximately $2.27 billion in net outflows, extending a broader withdrawal trend that had already removed roughly $4.4 billion over a 13-day stretch spanning late May and early June. These redemptions create direct selling pressure because ETF issuers must liquidate underlying Bitcoin holdings to meet investor withdrawals.
A significant portion of the recent outflows has been concentrated in iShares Bitcoin Trust (IBIT). The fund became the dominant vehicle for institutional Bitcoin exposure after attracting the majority of industry inflows thanks to the distribution network and market presence of BlackRock. During periods of strong demand, IBIT accounted for a substantial share of total ETF inflows. However, that same concentration now magnifies the impact of withdrawals. When IBIT experiences significant redemptions, the entire ETF sector often posts negative flow figures, making the fund a critical indicator of institutional sentiment.
As a result, investors are paying close attention to IBIT’s daily flow data rather than simply monitoring industry-wide totals. A sustained return of inflows exceeding $100 million per day would likely signal renewed institutional conviction. By contrast, small positive flow readings during periods of market weakness may reflect tactical positioning rather than meaningful demand. Until consistent inflows return, the ETF market is acting more as a source of supply than a source of support for Bitcoin prices.
There is, however, a notable development on the product side. BlackRock recently expanded its digital-asset offering with the launch of a new income-oriented Bitcoin ETF structure designed to appeal to yield-focused investors. While this demonstrates continued innovation and institutional interest in crypto-related investment products, expanding product offerings alone does not offset ongoing redemptions from existing spot Bitcoin ETFs. At present, the impact of outflows remains the dominant factor.
Leverage Remains a Major Vulnerability
Beyond ETF-related selling, Bitcoin continues to face risks associated with excessive leverage. Many of the sharpest declines throughout 2026 have followed a familiar pattern: a key technical support level breaks, leveraged long positions are liquidated, and the resulting forced selling pushes prices even lower, triggering additional liquidations in a self-reinforcing cycle.
This dynamic has been particularly evident during major selloffs, where liquidations have overwhelmingly affected bullish traders. When large numbers of leveraged long positions are forced to close, market declines can accelerate rapidly as selling pressure becomes disconnected from underlying fundamentals. The result is often a cascade that drives prices far beyond what spot-market activity alone would justify.
At the same time, heavy long-liquidation events can eventually create the conditions for stabilization. Historically, periods of aggressive deleveraging have sometimes marked local market bottoms because they remove speculative excess and reduce systemic risk. Once weaker leveraged participants have been forced out, the market can rebuild on a healthier foundation with less vulnerability to liquidation-driven declines.
For now, however, leverage remains more of a threat than a benefit. With Bitcoin trading near the crucial $62,500–$60,000 support zone, any decisive breakdown could trigger another round of forced selling. The liquidation mechanism that ultimately helps cleanse the market can also intensify downside volatility in the short term. While a completed deleveraging cycle may eventually lay the groundwork for a stronger recovery, the process itself can be painful, and there is no guarantee that the $60,000 support level survives before that reset is complete.
Market Sentiment Remains Deeply Bearish
Investor psychology currently reflects the weakness visible in Bitcoin’s price action. The widely followed Crypto Fear & Greed Index has remained near the 20–23 range, firmly within “Extreme Fear” territory. Such readings indicate that market participants are more concerned about preserving capital than chasing upside opportunities. Historically, extreme fear has often appeared near important market lows, but it can also characterize prolonged bearish periods where confidence remains absent and negative news triggers disproportionate selling pressure.
Prediction markets reinforce this cautious outlook. Traders are assigning a high probability to Bitcoin revisiting levels below $60,000 during 2026, while expectations for a return to six-figure prices have fallen substantially compared with earlier in the year. Confidence in Bitcoin reaching a new all-time high before year-end has also diminished sharply. Together, these forecasts suggest that market participants currently view downside risks as more likely than a rapid recovery.
Ironically, such pessimism can sometimes become a bullish signal. When sentiment becomes overwhelmingly negative, much of the bad news may already be reflected in prices. Combined with ongoing deleveraging and reduced speculative positioning, the conditions for a sharp relief rally can begin to emerge. However, extreme fear alone is rarely enough to reverse a trend. Markets typically require a catalyst capable of shifting expectations before a sustainable recovery can take hold.
Federal Reserve Policy Remains the Dominant Macro Driver
At present, the most influential factor affecting Bitcoin is not blockchain activity or crypto-specific developments, but monetary policy. Investors continue to focus on the actions of the U.S. Federal Reserve, whose policy stance has remained restrictive. Elevated interest rates increase the attractiveness of cash and fixed-income investments while reducing demand for non-yielding assets such as Bitcoin.
This relationship has been a defining theme throughout 2026. Bitcoin tends to perform best when liquidity is abundant and financial conditions are accommodative. Conversely, higher interest rates and tighter monetary policy often weigh on speculative assets by increasing financing costs and reducing overall risk appetite. Persistent inflation pressures and expectations that policymakers may maintain a restrictive stance have therefore created a challenging environment for cryptocurrencies.
The next major catalyst for markets is the release of U.S. Personal Consumption Expenditures (PCE) inflation data, the Federal Reserve’s preferred measure of inflation, alongside updated GDP figures. These reports could have significant implications for interest-rate expectations.
A stronger-than-expected inflation reading would reinforce concerns that policymakers may need to keep rates elevated for longer or even consider additional tightening. Such an outcome could strengthen the U.S. dollar, push bond yields higher, and increase pressure on Bitcoin as it tests critical support levels.
A softer inflation reading could ease concerns about further tightening, improve liquidity expectations, and provide risk assets with a potential catalyst for recovery. In that scenario, Bitcoin could attempt to reclaim resistance levels around $66,000 and stabilize above its current support zone.
Why the Next Few Days Matter
The convergence of several factors makes the current period particularly important for Bitcoin:
Price is sitting directly on the critical $62,500–$60,000 support area.
ETF outflows continue to create selling pressure.
Market sentiment remains entrenched in extreme fear.
Macro expectations are heavily dependent on incoming inflation data.
Taken together, these conditions suggest that Bitcoin is approaching an inflection point. If inflation data supports a more accommodative outlook and risk appetite improves, the combination of extreme pessimism and reduced leverage could fuel a meaningful rebound. Conversely, if inflation remains stubborn and rate-hike expectations strengthen, pressure on the $60,000 support zone could intensify, increasing the risk of a deeper decline toward lower technical targets.
For now, the market’s focus is less on crypto fundamentals and more on the broader macroeconomic environment. The fate of Bitcoin’s most important support level may ultimately depend on how investors interpret the next round of economic data.
The Iran Peace Dividend Failed to Gain Traction
A potential bullish catalyst emerged with the recent U.S.–Iran diplomatic breakthrough, but its positive impact on Bitcoin proved short-lived. The agreement signed in Switzerland on June 19, which included a halt to military operations and the reopening of the Strait of Hormuz, reduced geopolitical tensions that had unsettled markets throughout the spring. In the immediate aftermath, risk assets responded positively, and Bitcoin rebounded from levels near $59,000 as investors welcomed the easing of conflict-related uncertainty.
However, the relief rally quickly lost momentum. The reduction in geopolitical risk was overshadowed by more powerful macroeconomic concerns, particularly growing anxiety surrounding AI-sector valuations and expectations that the Federal Reserve may maintain a restrictive policy stance. While lower oil prices resulting from improved Middle East stability could eventually contribute to lower inflation and a more favorable interest-rate environment, those benefits are likely to materialize gradually. In contrast, the negative effects of tightening financial conditions and weakening risk appetite have had a much more immediate influence on markets.
Adding to the uncertainty is the fact that the agreement remains a framework rather than a fully implemented settlement. Disagreements over inspection procedures and implementation timelines have raised questions about how durable the arrangement will be. Any deterioration in negotiations could quickly reintroduce geopolitical risk into energy markets and broader financial assets.
The broader lesson for Bitcoin is that positive geopolitical developments alone are currently insufficient to drive a sustained recovery. At present, macroeconomic factors—particularly monetary policy expectations and technology-sector sentiment—remain far more influential than geopolitical headlines.
Alternative Cryptocurrencies Are Under Even Greater Pressure
While Bitcoin’s decline has attracted attention, the weakness across the broader cryptocurrency market has been even more severe. Major alternative cryptocurrencies have suffered larger losses, highlighting the risk-off environment currently dominating digital assets.
Ethereum has fallen more sharply than Bitcoin, dropping below key psychological support levels and extending a prolonged period of underperformance.
Solana has experienced some of the steepest losses among large-cap cryptocurrencies, reflecting its higher sensitivity to shifts in investor risk appetite.
XRP has shown relatively greater resilience but remains firmly in negative territory.
This pattern is typical of broad liquidity-driven selloffs. When investors reduce exposure to risk assets, capital tends to leave the most speculative segments first. As a result, alternative cryptocurrencies generally experience larger percentage declines than Bitcoin. The stronger relative performance of BTC is therefore less a sign of strength and more a reflection of its position as the most established and liquid asset within the crypto ecosystem.
What Altcoin Weakness Says About Bitcoin
The widespread decline across digital assets suggests that the current downturn is not driven by a problem unique to Bitcoin. Instead, it reflects a broader repricing of risk throughout the cryptocurrency market.
In some respects, that is mildly encouraging for Bitcoin because it indicates that the asset itself is not facing a specific structural issue. There has been no major protocol failure, regulatory shock, or Bitcoin-specific crisis driving the selloff. Rather, the entire crypto sector is responding to the same combination of tighter liquidity, weaker investor sentiment, ETF outflows, and macroeconomic uncertainty.
However, this also means Bitcoin is unlikely to stage a sustainable recovery in isolation. Historically, durable crypto bull markets require improving sentiment across the broader digital-asset landscape. As long as major altcoins continue to weaken and investors remain reluctant to take risk, Bitcoin’s upside potential may remain constrained.
The Bottom Line
Bitcoin currently sits at the intersection of several bearish forces:
Critical support near $60,000 is being tested.
ETF outflows continue to create selling pressure.
Leverage remains vulnerable to liquidation cascades.
Market sentiment is entrenched in extreme fear.
The Federal Reserve’s policy outlook remains restrictive.
Broader crypto markets continue to deteriorate.
Against that backdrop, positive developments such as easing geopolitical tensions have struggled to generate lasting momentum. For now, the market’s focus remains squarely on liquidity conditions, interest-rate expectations, and risk appetite. Until those factors improve, Bitcoin’s ability to sustain a meaningful recovery is likely to remain limited, regardless of isolated bullish headlines elsewhere.
The Structural Bid Beneath the Surface
Despite the heavy price pressure and persistent outflows in spot ETFs, there is an important countertrend emerging in the underlying on-chain data. While short-term flows have been dominated by ETF redemptions and leveraged positioning unwinds, long-term holder behavior has remained notably more constructive. In fact, during the same mid-2026 period when ETF products saw sustained outflows, long-term holder supply dynamics indicated net accumulation on a significantly larger scale. This divergence highlights a growing split between short-term speculative capital exiting the market and longer-horizon participants continuing to build exposure.
The contrast between these two flows is central to understanding the current phase of the cycle. ETF activity reflects relatively reactive, liquidity-driven capital—money that responds quickly to price declines, macro uncertainty, and risk-off conditions. By contrast, long-term holders tend to represent conviction-driven capital that is less sensitive to short-term volatility. The fact that these holders have continued to accumulate while ETF investors have been net sellers suggests that the current downturn may be more cyclical in nature rather than a structural rejection of Bitcoin as an asset.
Valuation Anchors and the Cyclical Debate
On-chain valuation metrics add further context to this debate. Bitcoin’s realized price, often used as a proxy for the aggregate cost basis of the network, is currently estimated around $54,000. Historically, bear market troughs have tended to form near or slightly below this level, with some prior cycles extending approximately 15–25% beneath realized price. That framework would imply a theoretical lower bound in the low-$40,000 range, though it is not a forecast—rather, it defines the historical range of downside observed in past cycles.
Importantly, trading above realized price suggests the market is not in a deep capitulation regime typical of major cycle lows. At current levels near $62,000, Bitcoin remains above this long-term valuation anchor, indicating that while sentiment is weak, the structural pricing framework is not yet consistent with extreme undervaluation.
This is why many on-chain analysts frame the current environment as a redistribution phase rather than a full structural breakdown. ETF outflows and short-term selling are viewed as cyclical positioning adjustments—profit-taking, deleveraging, and macro-driven risk reduction—rather than a wholesale exit of long-term capital from the asset class.
The Bull Case: Conviction Accumulation
From a bullish perspective, the key argument is that the market is undergoing a transfer of supply from weaker hands to stronger ones. Short-term participants, including ETF investors reacting to volatility and macro uncertainty, are supplying liquidity to long-term holders who are gradually increasing exposure. If sustained, this dynamic typically leads to a stronger foundation for future price appreciation once selling pressure exhausts itself.
In this view, the current drawdown functions as a reset mechanism: it flushes excess leverage, cools speculative excess, and redistributes coins into more stable hands. That process has historically preceded major recovery phases in previous Bitcoin cycles, where prolonged accumulation during periods of fear eventually gave way to renewed upward trends.
The Bear Case: Support Without Resolution
The counterargument is equally straightforward. Long-term holder accumulation has been present throughout much of Bitcoin’s decline from its prior peak near $126,000, yet it has not been sufficient to prevent lower highs and lower lows. Each stage of the downturn has featured some degree of accumulation behavior, but price has continued to trend downward regardless.
Moreover, while realized price provides a reference point, it does not function as a hard floor. Past cycles have indeed traded below it, sometimes meaningfully, before finding durable bottoms. That leaves open the possibility that further downside remains available if macro conditions worsen or if forced selling intensifies again.
The Core Tension in the Market
The current phase of Bitcoin can therefore be summarized as a tension between two competing forces:
Long-term structural support: ongoing accumulation by conviction holders and historically favorable on-chain valuation positioning.
At present, neither side has fully resolved the balance. The structural bid from long-term holders is real and meaningful, but it has not yet been strong enough to overpower cyclical selling pressure. Until that balance shifts decisively—either through exhaustion of sellers or a macro catalyst that restores risk appetite—the market remains in a contested state rather than a confirmed bottoming phase.
Bitcoin trades slightly above $64,000 on Tuesday after falling around 4% last week.
Bitcoin and Ethereum ETFs saw outflows of $226 million and $10 million last week, marking a sixth straight week of withdrawals.
Meanwhile, DeXe and Celestia continue to post gains despite weakness across the broader crypto market.
Bitcoin (BTC) trades above $64,000 on Tuesday, remaining stable after a nearly 4% decline last week. Recent data indicates institutional outflows are slowing, pointing to potential broader market recovery, while DeXe (DEXE) and Celestia (TIA) have led gains over the past 24 hours.
Bitcoin maintains a modest rebound as ETF outflows ease.
Bitcoin-focused Exchange Traded Funds (ETFs) saw more than $1 billion in outflows for four straight weeks during May and early June. However, institutional selling pressure has recently eased, with outflows slowing to $226 million last week after $315 million the week before.
Ethereum (ETH)-focused ETFs have also posted six consecutive weeks of outflows, totaling $10.05 million last week following $14.91 million in the previous week.
Bitcoin continues to show a mixed short-term outlook. The price remains below both the 50-day and 200-day Exponential Moving Averages (EMAs), currently near $68,889 and $78,623, respectively, though it is still holding above a short-term ascending support trendline.
Technical indicators also present a mixed picture on the daily chart. The Moving Average Convergence Divergence (MACD) remains positive with rising average lines, signaling some bullish momentum, while the Relative Strength Index (RSI) stays below neutral near 41, indicating that upward moves may still face selling pressure.
On the upside, the first key resistance level lies around the 50-day EMA near $68,889, followed by the reclaimed bearish trendline near $73,439. The 200-day EMA around $78,623 stands as a more significant longer-term resistance level.
On the downside, immediate support is located near the recent ascending trendline around $63,341. A stronger decline could shift attention toward the major psychological and structural support zone at $60,000, where buyers previously stepped in to defend the broader bullish trend.
DeXe and Celestia continue to regain bullish momentum.
DeXe (DEXE) surged more than 18% on Tuesday after rallying 32% the previous day. The token remains firmly above both the 50-day EMA near $16.13 and the 200-day EMA around $10.67, while moving closer to the June 3 peak at $24.49.
Technical indicators suggest strengthening momentum without signaling overbought conditions. The RSI is hovering near 60, while the MACD line is climbing toward a potential bullish crossover with its signal line, indicating that bullish momentum remains intact but may be moderating.
On the upside, key resistance is located near the Fibonacci level at $24.49. A decisive breakout above this zone could pave the way toward new cycle highs, with the 127.2% and 161.8% Fibonacci extension levels at $31.40 and $43.08 acting as the next major resistance targets.
On the downside, immediate support is seen at the 78.6% Fibonacci retracement near $20.14, followed by the 50% retracement level around $15.50.
Meanwhile, Celestia (TIA) gained more than 3% on Tuesday, building on the previous day’s 5% rebound from the 50-day EMA near $0.3738. Momentum has improved as the RSI climbs toward 56, while both the MACD and signal line have moved into positive territory, suggesting buyers continue to maintain short-term control as long as price holds above the 50-day EMA.
On the upside, initial resistance is located at the 50% retracement level of the decline from $0.6257 to $0.2693, near $0.4104. Stronger resistance is then seen between $0.4596 and $0.4722.
On the downside, immediate support remains near the 50-day EMA at $0.3738. A break below this level could expose the 23.6% retracement at $0.3285, while a deeper decline toward the $0.2693 swing low would weaken the improving bullish outlook.
Bitcoin Slides Below $63K as Hawkish Fed Crushes Rate-Cut Hopes and ETF Demand
The cryptocurrency market has received a stark reality check. For months, investors had pinned their hopes on the prospect of Federal Reserve rate cuts, expecting looser monetary policy to fuel another leg higher in Bitcoin (BTC). Those expectations helped support bullish sentiment earlier this week, with traders anticipating further gains if policymakers signaled a more accommodative stance.
Instead, the Federal Reserve delivered the opposite message. Under the leadership of Chair Kevin Warsh, the central bank left interest rates unchanged while adopting a distinctly hawkish tone. The decision has sent shockwaves through both traditional financial markets and digital assets, weighing heavily on institutional demand and pushing Bitcoin below the $63,000 level.
The shift stems not from the rate decision itself, but from the Fed’s outlook. Warsh abandoned the central bank’s traditional forward-guidance approach and issued a shorter policy statement, signaling greater uncertainty about future policy moves. More importantly, half of the Federal Open Market Committee (FOMC) now expects at least one additional rate increase before year-end.
Markets have rapidly adjusted to the new reality, with traders assigning a roughly 90% probability to another rate hike. The repricing has effectively erased expectations of imminent monetary easing, reinforcing the view that borrowing costs will remain elevated for longer. As hopes for cheaper liquidity fade, risk-sensitive assets such as Bitcoin have come under renewed pressure.
The hawkish policy outlook has also dampened enthusiasm for spot Bitcoin ETFs, which had previously benefited from expectations of lower interest rates and stronger capital inflows. With investors reassessing the macroeconomic landscape, institutional demand has weakened, adding another headwind for the world’s largest cryptocurrency.
ETF Outflows Accelerate as Institutions Retreat, but Bitcoin Whales Buy the Dip
Institutional investors have responded swiftly to the Federal Reserve’s hawkish shift by reducing their exposure to cryptocurrency investment products. The brief optimism that supported markets earlier in the week has largely disappeared, triggering renewed selling pressure across digital assets.
Spot Bitcoin ETFs recorded net outflows of $82.2 million in a single session, according to CoinGlass data. The withdrawals highlight growing caution among institutional participants as markets adjust to the prospect of higher interest rates and a longer period of restrictive monetary policy.
While a handful of funds managed to attract fresh capital, the inflows were insufficient to offset broader weakness. Fidelity’s FBTC was among the few ETFs to register positive flows, but overall sentiment remained negative as investors reassessed the appeal of risk assets in a higher-rate environment.
However, ETF outflows tell only part of the story. Beneath the surface, some of Bitcoin’s largest holders appear to be taking advantage of the price decline. On-chain data from Santiment shows that addresses holding at least 1,000 BTC now collectively control approximately 7.17 million coins, the highest level since March 14.
The number of these whale wallets has also climbed to 2,044, suggesting that large investors are accumulating while institutional ETF participants are reducing exposure. This divergence highlights a growing split within the market: traditional investors are becoming more defensive amid macroeconomic uncertainty, while long-term Bitcoin holders continue to view the pullback as a buying opportunity.
Bitcoin Falls Below $63K as Bearish Momentum Builds
Mounting institutional selling pressure has pushed Bitcoin lower, erasing much of the rebound seen earlier this week. The world’s largest cryptocurrency broke below the key $63,000 support level and was trading near $62,700, according to CoinMarketCap data.
The decline follows a sharp 4.5% daily loss, leaving Bitcoin significantly below several important valuation benchmarks. At current levels, BTC is trading roughly 17% beneath its on-chain True Market Mean of $77,200, a metric often used to gauge the average cost basis of market participants.
Recent buyers are feeling the strain of the downturn. On-chain data suggests that short-term holders are, on average, sitting on losses of around 10%, reflecting the pressure created by a stronger US dollar and fading expectations of near-term monetary easing. While long-term investors and whales continue to accumulate during the pullback, the broader spot market remains under pressure.
The technical outlook has also deteriorated. According to Investing.com indicators, Bitcoin has shifted into a strong sell zone as several key moving averages begin to trend lower, signaling that bearish sentiment is gaining control of the market.
Momentum indicators are reinforcing the negative outlook. The Relative Strength Index (RSI) and Commodity Channel Index (CCI) have both moved deeper into bearish territory, highlighting weakening buying interest and a lack of conviction among bulls. At the same time, capital flows appear to be rotating away from cryptocurrencies and toward high-growth artificial intelligence-related equities, limiting the prospects for an immediate recovery.
Unless Bitcoin can quickly reclaim the $64,000 region and re-establish upward momentum, technical conditions suggest that sellers are likely to retain the upper hand in the near term. For now, the path of least resistance remains tilted to the downside as traders navigate a stronger dollar environment and increasingly hawkish Federal Reserve expectations.
Ethereum is participating in the rebound, but it is not driving it. ETH traded near $1,650 on Thursday, gaining around 2% over the past 24 hours after opening at $1,620.37 and climbing to an intraday high of $1,665. The move mirrored the broader crypto market’s oversold recovery as Bitcoin rebounded toward $62,880. Daily trading volume hovered near $12 billion, while Ethereum’s market capitalization remained close to $201 billion, preserving its position as the second-largest cryptocurrency. Although the rebound is visible, it barely offsets the scale of the recent decline.
The broader context remains deeply bearish. Ethereum has dropped roughly 44% since the start of 2026 and continues to trade nearly 67% below its record high of $4,946.05, marking a steeper decline than Bitcoin over the same period. ETH entered the year above $2,500 before sliding into the $1,600 range under pressure from weak capital inflows, a restrictive macroeconomic environment, and a structural issue unique to Ethereum. Market sentiment remains extremely pessimistic, with the Fear and Greed Index sitting at 9, a level typically associated with capitulation.
Unlike Bitcoin, Ethereum faces an additional challenge tied to its own ecosystem design. While both assets are weighed down by higher interest rates, Federal Reserve hawkishness, and geopolitical uncertainty, Ethereum also struggles with a value-capture issue. Its scaling strategy increasingly shifts activity toward Layer-2 networks, reducing fee generation on the main chain and weakening the investment narrative even as adoption expands. This structural concern helps explain why ETH has underperformed Bitcoin, why the ETH/BTC ratio has fallen toward multi-year lows, and why the June low near $1,505 has become such a critical technical level.
The Tape: From a $1,620 Open to $1,665, With $1,505 Still Critical
Thursday’s trading reflected the broader market’s relief rally. Ethereum opened at $1,620.37, about 1.1% lower than the previous session, before strengthening through the day to touch $1,665 and later stabilize near $1,650. The price action closely tracked Bitcoin’s rebound from its own $61,456 opening level, reinforcing the idea that the move was driven by market-wide positioning rather than Ethereum-specific developments. Without a clear catalyst unique to ETH, the token continues to behave largely as a higher-beta extension of Bitcoin.
The recent losses remain severe. Over the past week, Ethereum has fallen around 7.5%, bringing prices dangerously close to the June low of $1,505, the support level that now defines the short-term outlook. Holding above that floor leaves room for a broader recovery bounce, while a decisive breakdown could trigger another leg lower. Although the rebound toward $1,650 created some distance from immediate danger, ETH still trades much closer to key support than to any major resistance zone.
Trading volume reflects the intensity of the recent selloff. Roughly $12 billion in daily turnover points to aggressive repositioning as leveraged positions were unwound across the crypto market amid nearly $1 billion in liquidations tied to renewed Iran-related geopolitical tensions. As one of the more volatile large-cap tokens, Ethereum absorbed a disproportionate share of the pressure. The current price action suggests an asset that has undergone heavy distribution and is now attempting to stabilize around a support level that remains vital to preserving any near-term bullish scenario.
Down 44% This Year and Severely Underperforming Bitcoin
Ethereum’s relative weakness becomes most apparent when compared directly with Bitcoin. ETH is down roughly 44% from its opening level in 2026 and remains nearly 67% below its all-time high, marking a steeper decline than Bitcoin over the same period. Bitcoin itself has fallen around 43% over the past year, but Ethereum’s deeper losses and prolonged underperformance against BTC highlight the broader shift in market preference. With Ethereum trading near $1,650 and Bitcoin around $62,880, the ETH/BTC ratio sits close to 0.026, a historically depressed level that reflects years of relative weakness.
That ratio has become one of the clearest indicators of investor sentiment toward Ethereum compared with Bitcoin, and the trend has consistently moved against ETH. As capital flows back into crypto markets, institutional demand has increasingly concentrated around Bitcoin, which has established itself as the preferred vehicle for large-scale exposure. The launch of spot Bitcoin ETFs created a straightforward institutional gateway that Ethereum-related products have struggled to replicate at the same scale. The result has been a persistent structural advantage for Bitcoin that the current bearish environment has only intensified.
Ethereum’s underperformance is not driven solely by sentiment. It also reflects a deeper debate about the token’s long-term value proposition. Bitcoin benefits from a simple and easily understood narrative as digital gold with a fixed supply and store-of-value characteristics. Ethereum, by contrast, derives its value from functioning as the settlement layer for a vast ecosystem of decentralized applications. That complexity has increasingly become a challenge, as investors question how much of the ecosystem’s economic activity ultimately benefits the ETH token itself. The sharp year-to-date decline reflects growing uncertainty around that question.
The Value-Capture Debate: Scaling Success Versus Token Economics
The central bearish argument surrounding Ethereum is structural. While the network continues to expand in usage, the economic value captured by the base-layer token may be weakening as activity migrates to Layer-2 solutions. Ethereum’s scaling roadmap intentionally moves transactions away from the main chain and onto faster, lower-cost rollups that later settle back onto Ethereum in batches. Although this design improves efficiency and lowers transaction costs, it also reduces the amount of fee revenue flowing directly through the base layer.
That dynamic has become a major concern for investors. Ethereum’s ecosystem can continue growing while the ETH token itself captures a smaller share of the value being generated. Network activity may remain robust, but the direct relationship between adoption and fee generation has weakened because scaling solutions absorb more of the transactional economics. This issue is relatively unique to Ethereum among major cryptocurrencies and remains one of the most frequently cited explanations for its persistent underperformance against Bitcoin.
Ethereum’s roadmap continues to emphasize scaling improvements, which reinforces both sides of the debate. Upcoming upgrades, including the Glamsterdam release focused on proposer-builder separation, scalability, and lower transaction costs, alongside the later Hegotá upgrade aimed at improving state management and node efficiency, demonstrate the network’s accelerating development pace. Supporters view these upgrades as strengthening Ethereum’s long-term resilience and competitiveness. Critics argue that continued scaling efforts may further dilute fee capture at the base layer. Until the market reaches a clearer consensus on which interpretation is correct, that uncertainty is likely to remain a major overhang for ETH.
ETF Flows: Extended Outflows With Only Limited Recovery
Institutional demand for Ethereum exposure has remained weak, reflecting the broader risk-off environment across crypto markets. Spot Ethereum funds recently endured a 17-day streak of net outflows before finally posting a modest $19.3 million inflow in early June. Notably, that entire inflow came from a single major Ethereum fund, while most competing products recorded no meaningful activity. Total assets under management across Ethereum funds now sit near $9.78 billion, approximately $2 billion below their peak levels earlier in the year. Since launch in 2024, cumulative inflows into these products have reached roughly $11.21 billion.
Fund flows have remained a consistent source of pressure. Weekly outflows recently approached $168 million, contributing to nearly $880 million in redemptions over a four-week period as investors reduced exposure amid broader market volatility. Like Bitcoin, Ethereum increasingly depends on regulated investment products as part of its marginal demand structure. When flows reverse, they create additional selling pressure on a market that is already under stress.
Ethereum’s ETFs also face a structural disadvantage compared with holding ETH directly. Due to regulatory limitations, spot Ethereum funds are currently unable to stake their holdings, meaning investors miss out on the staking rewards available through direct ownership of ETH. For an asset whose appeal partly depends on yield generation, that limitation significantly weakens the attractiveness of the ETF structure. Although fund flows have occasionally stabilized, the market has yet to see the kind of sustained institutional demand necessary to support a durable reversal in Ethereum’s broader trend.
Extreme Fear at 9 and a Market Deep in Capitulation
Market sentiment around Ethereum has deteriorated to levels that often coincide with major washouts, though not necessarily with immediate reversals. The Fear and Greed Index currently sits at 9, firmly within extreme-fear territory, reflecting a market that has been heavily punished and psychologically exhausted. Over the past month, ETH has closed higher in only about one-third of trading sessions, while volatility has remained above 10%, reinforcing the picture of a highly stressed asset trapped in a sustained downtrend.
Extreme fear cuts both ways. Historically, deeply pessimistic sentiment can create the conditions for sharp relief rallies once aggressive selling pressure fades and marginal sellers are exhausted. The rebound toward $1,650 carries elements of that dynamic, with oversold conditions sparking a short-term recovery across the crypto market. At the same time, prolonged bear markets can sustain extreme fear for far longer than traders expect. A low sentiment reading alone does not signal a bottom; it simply confirms that fear remains dominant.
Supporters of the bullish interpretation argue that the recent collapse has flushed out excessive leverage and forced weak hands from the market, leaving behind a more resilient holder base. On-chain data showing Ethereum balances on centralized exchanges falling to record lows reinforces that argument, since coins leaving exchanges are typically associated with reduced near-term selling pressure and increased long-term holding or staking activity. Combined with reports of accumulation from large holders, the blockchain data suggests that selling pressure may be closer to exhaustion than acceleration. Whether that translates into a sustained recovery, however, still depends heavily on macroeconomic conditions and a stabilization in capital flows.
Corporate Treasury Exposure and Billions in Unrealized Losses
Ethereum has increasingly developed its own version of the corporate treasury strategy previously associated with Bitcoin, and it is now facing similar vulnerabilities. Following the model pioneered by Bitcoin treasury companies, several publicly traded firms adopted ETH as a reserve asset, attracted by Ethereum’s ability to generate staking yield in addition to offering exposure to crypto markets. The strategy gained momentum throughout 2025 as companies sought both balance-sheet diversification and yield generation through staking rewards.
The current bear market has exposed the risks embedded in that approach. One of the largest corporate holders of Ethereum is reportedly carrying unrealized losses approaching $9 billion, despite continuing to accumulate aggressively, including a purchase of roughly 126,000 ETH near this year’s lows. The company has also explored preferred-share issuance to finance its Ethereum position, highlighting the same balance-sheet pressures and leverage concerns that have emerged across crypto treasury structures. The leverage that amplified gains during the bull market is now magnifying downside stress during the decline.
For Ethereum, the implications are mixed. On one side, treasury firms became an important source of demand during the accumulation phase, and financial stress within that cohort raises concerns about whether that demand can continue. On the other side, continued purchases during periods of severe weakness suggest that some large holders still view current prices as attractive long-term value opportunities. Treasury companies therefore represent both a potential source of risk, if financing pressure triggers forced selling, and a possible source of support, if conviction buying persists. Which side ultimately dominates will likely depend on whether Ethereum can maintain critical support levels.
The Macro Pressure: Higher Rates, Stronger Dollar, and Bitcoin Weakness
Ethereum also remains trapped within the broader macroeconomic environment pressuring global risk assets. Consumer inflation running near 4.2% and wholesale inflation around 6.5% year-over-year have reinforced expectations for continued Federal Reserve hawkishness, with markets pricing in another quarter-point rate increase by December. For speculative assets that do not inherently provide traditional cash flow, that environment remains highly unfavorable. With cash yields above 5% and the U.S. 10-year Treasury yielding around 4.52%, the opportunity cost of holding cryptocurrencies has risen sharply, while a stronger U.S. dollar near the 100 level adds further pressure across dollar-denominated assets.
Ethereum’s relationship with Bitcoin amplifies that challenge. ETH continues to trade as a higher-beta extension of Bitcoin, meaning it tends to exaggerate Bitcoin’s moves in both directions. As long as Bitcoin remains constrained near the $62,800 region by ETF outflows and restrictive monetary policy, Ethereum faces even greater downside sensitivity. When Bitcoin rallies modestly, ETH typically rebounds more aggressively, but when Bitcoin weakens, Ethereum tends to decline even faster. The same macro headwinds weighing on Bitcoin are therefore exerting an even stronger impact on Ethereum.
Geopolitical tensions have added another layer of pressure. Escalating conflict involving U.S. strikes on Iran triggered another wave of deleveraging across crypto markets, driving liquidations and intensifying the broader risk-off move. The resulting demand for safe-haven assets has strengthened the dollar while reducing appetite for speculative investments such as cryptocurrencies. At the same time, energy-driven inflation tied to geopolitical instability reinforces the Federal Reserve’s hawkish stance, creating a feedback loop that pressures Ethereum from multiple directions simultaneously. For ETH to establish a more durable recovery, broader macro conditions likely need to improve first, and current economic data does not yet point toward that shift.
The Bullish Thesis: Tightening Supply, Staking, and Long-Term Upgrades
Despite the weak price action, the bullish argument for Ethereum remains centered on structural developments that may not yet be reflected in the market. One of the strongest points is supply dynamics. Ethereum balances held on centralized exchanges have fallen to historic lows, reducing the amount of immediately available supply that can be sold into the market. Historically, shrinking exchange reserves have often preceded stronger rallies once demand returns. Continued growth in staking participation strengthens this dynamic further by locking additional ETH out of circulation.
Another major pillar of the bullish case is Ethereum’s staking yield. Unlike Bitcoin, ETH can generate native yield through staking, transforming it from a purely passive asset into a productive one. That yield-generating capability remains a core reason why corporations, institutional investors, and long-term holders continue accumulating Ethereum despite the ongoing drawdown. The ability to earn staking rewards provides a structural incentive to hold and lock up ETH regardless of short-term price fluctuations.
The final component of the bullish narrative revolves around Ethereum’s ongoing development roadmap. Upcoming upgrades such as Glamsterdam and Hegotá are designed to improve scalability, reduce transaction costs, strengthen efficiency, and expand the network’s long-term capacity. Supporters argue that the accelerated pace of development demonstrates Ethereum’s continued adaptability and strengthens its position as the dominant smart-contract platform.
Long-term bullish projections are built almost entirely around these structural themes, with some valuation models targeting ranges between $4,000 and $8,000, while more aggressive forecasts project significantly higher prices if institutional adoption accelerates meaningfully. Critics, however, maintain that none of these long-term advantages will matter unless Ethereum resolves its value-capture concerns and macro conditions improve. A tightening supply and staking yield may not be enough if investors continue questioning whether the ETH token itself captures sufficient value from the ecosystem it supports. In many ways, the bullish thesis remains a multi-year argument, while the current market continues to trade according to near-term macro and liquidity realities.
The Bitcoin ecosystem continues to face mounting challenges, with another major setback emerging from the Layer-2 sector. In a surprising development, Botanix, a prominent Bitcoin Layer-2 network, has announced that it will cease operations, giving users until July 9 to withdraw their assets.
The shutdown comes amid a sharp downturn in the cryptocurrency market. Bitcoin has fallen to around $61,000 during the latest wave of selling pressure, raising concerns that the current correction could evolve into a more prolonged bearish phase.
Botanix confirmed a phased closure of its EVM-compatible Layer-2 network, warning users to remove their funds before the July 9 deadline. Any assets left on the platform after that date will be transferred to the custody of a validator group known as the Federation, making direct withdrawals no longer possible.
The closure marks a disappointing end for a project that previously secured $11.5 million in funding from leading venture capital firms, including Polychain Capital and Placeholder Capital.
In an unusually candid post-mortem, the Botanix team acknowledged that limited user adoption ultimately led to the project’s downfall. According to the developers, demand for Bitcoin-based programmability and decentralized finance remains underdeveloped. Most DeFi participants continue to favor wrapped Bitcoin on Ethereum and other established platforms, while many Bitcoin holders still view BTC primarily as a long-term store of value rather than an asset for active on-chain trading.
As a result, the network struggled to generate sufficient transaction fees to support its operational and infrastructure costs, leading to the decision to shut down the platform.
Bitcoin Price Plunge
The shutdown of Botanix comes at a particularly difficult time for the cryptocurrency market, which is already facing intense selling pressure. Bitcoin has experienced a sharp decline this week, falling below several key psychological support levels and dropping to around $61,600, according to market data from CoinMarketCap.
The latest sell-off has further weakened investor sentiment, triggering concerns that the market could be entering a deeper correction phase. As Bitcoin struggles to regain momentum, risk assets across the crypto sector—including smaller Layer-2 networks and DeFi projects—have come under increased pressure.
For emerging ecosystems such as Botanix, the unfavorable market environment has only amplified existing challenges. With declining trading activity, weaker user engagement, and reduced fee generation, many smaller blockchain projects are finding it increasingly difficult to sustain operations during the downturn.
The sharp decline has significantly weakened retail investor sentiment and sparked a wave of liquidations across major cryptocurrency exchanges. The rapid correction highlights deteriorating market liquidity, creating a more challenging environment for smaller blockchain networks and emerging ecosystems. As capital flows out of riskier assets, projects with limited adoption and weaker financial foundations become increasingly exposed to market stress.
Analysts Predict Bitcoin Bear Market Could Persist
Several well-known cryptocurrency analysts argue that the current downturn may have further room to run. Influential market commentators on X, including Ash Crypto and 0xChiefy, suggest that prevailing macroeconomic conditions and historical Bitcoin market cycles indicate the potential for additional downside pressure.
According to their analysis, a combination of economic uncertainty, tightening liquidity conditions, and recurring bearish patterns from previous market cycles could lead to deeper corrections before a sustainable recovery takes hold. As a result, traders and investors are closely monitoring key support levels and broader market developments for signs of stabilization.
Analysts believe the current bearish momentum could continue to weigh on Bitcoin prices, potentially driving the market lower before a durable macroeconomic bottom is established. Their outlook is further reinforced by a significant wave of institutional selling, with reports indicating that more than 52,500 BTC have been liquidated through spot Bitcoin ETFs.
The large-scale distribution by institutional investors has added considerable selling pressure to the market, creating a supply overhang that may limit the prospects for a near-term recovery. As long as this excess supply remains in circulation, upward price movements could face substantial resistance.
Nevertheless, historical market data offers a more optimistic longer-term perspective. According to CoinMetrics, deeper declines during Bitcoin bear markets have often been followed by stronger and more explosive recoveries. While the current environment remains challenging, past cycles suggest that periods of extreme weakness can ultimately lay the foundation for powerful bullish reversals once market sentiment and liquidity conditions improve.
The chart provides Bitcoin investors with a reason for cautious optimism. Historical market cycles suggest that while bear markets can be painful and prolonged, they have often been followed by powerful recoveries. As a result, many investors believe that once the current downturn reaches its macro bottom, Bitcoin could stage a significant rebound and potentially climb to new all-time highs.
Past performance indicates that deeper corrections have frequently laid the groundwork for stronger bull runs, driven by renewed investor confidence, improving liquidity conditions, and growing institutional participation. Although short-term risks remain elevated, long-term market participants continue to view the current weakness as part of Bitcoin’s broader cyclical pattern.
BTC Technical Indicators Signal Continued Weakness
A review of Bitcoin’s technical indicators reinforces the prevailing bearish sentiment across the market. According to live technical data from Investing.com, Bitcoin is currently generating a strong sell signal on the daily, weekly, and monthly timeframes, suggesting that downward pressure remains firmly in control.
The 14-day Relative Strength Index (RSI) is hovering around 34.8, a level that reflects weakening buying interest and sustained selling activity. While not yet in deeply oversold territory, the indicator points to a market where bears continue to hold the upper hand.
Adding to the negative outlook, key moving averages—from the short-term 5-day MA to the long-term 200-day MA—remain above Bitcoin’s current trading price. This bearish alignment indicates that major trend indicators continue to act as resistance, limiting the potential for a near-term recovery.
As long as Bitcoin trades below these critical moving averages, technical momentum is likely to remain tilted to the downside, with sellers maintaining control of the broader market trend.
The crypto market came under heavy pressure this week, with Bitcoin falling more than 12% over seven days, sliding from above $70,000 to an intraweek low near $61,500. Total cryptocurrency market capitalization dropped to approximately $2.18 trillion on June 4, approaching its February lows and standing nearly 48% below the record peak above $4.2 trillion reached last year.
The weakness stood in sharp contrast to traditional financial markets. U.S. equities continued to climb to new all-time highs, driven largely by enthusiasm surrounding artificial intelligence and large-cap technology stocks. Meanwhile, cryptocurrencies and crypto-related equities moved decisively in the opposite direction.
The divergence highlights a growing liquidity challenge within digital assets. Persistent ETF outflows, the first disclosed Bitcoin sale by Strategy since 2022, and a lack of fresh stablecoin inflows have weighed on investor sentiment and reduced buying power across the market. At the same time, Bitcoin exchange netflow data suggests more coins are being transferred onto exchanges, increasing the potential for additional selling pressure.
Leverage has also become a concern. Although approximately $1.76 billion in crypto positions were liquidated on June 2—with nearly 90% of those liquidations coming from long positions—speculative activity remains elevated. Bitcoin-denominated open interest climbed to a record high of roughly 784,000 BTC the following day, indicating that leverage has been reduced but not fully flushed from the system.
With U.S. stocks attracting capital and the highly anticipated SpaceX IPO potentially drawing even more investor attention and liquidity, crypto markets currently lack a clear catalyst for a sustained recovery. Until fresh capital returns and selling pressure eases, Bitcoin may remain vulnerable to further downside despite improving risk sentiment elsewhere in financial markets.
Why Crypto Is Decoupling from Equities
While U.S. equities continue to advance on the back of strong AI-driven earnings growth and investor optimism, crypto markets are facing a unique combination of external macroeconomic headwinds and internal structural weaknesses. As a result, digital assets have decoupled to the downside even as traditional risk assets remain resilient.
Crypto-Specific Pressures
ETF outflows have emerged as one of the most significant drags on sentiment. U.S. spot Bitcoin ETFs recorded 13 consecutive trading sessions of net withdrawals between May 15 and June 3, with total outflows reaching $4.33 billion. The streak marked the longest period of sustained redemptions since the ETFs launched in 2024 and represented a sharp reversal from the $1.97 billion of net inflows seen in April. The shift has weakened one of the key demand drivers behind Bitcoin’s rally earlier this year.
Adding to the pressure, Strategy’s first disclosed Bitcoin sale since 2022—although limited to just 32 BTC—challenged the long-standing perception that major institutional holders would never reduce their positions. The transaction was economically insignificant but symbolically important, undermining a narrative that had supported investor confidence for years.
Meanwhile, Mt. Gox transferred 10,422 BTC, valued at roughly $739 million, ahead of its October creditor repayment deadline. The move revived concerns that a wave of previously locked-up Bitcoin could eventually enter the market, creating additional supply pressure.
Macro Headwinds Affecting All Risk Assets
Crypto is also contending with the same macroeconomic challenges facing broader financial markets.
Inflation remains stubbornly elevated, with April CPI rising 3.8% year-over-year, the highest reading since May 2023. Higher energy prices have added to concerns that inflation could remain above central bank targets for longer than expected.
At the same time, interest-rate expectations have shifted significantly. Prediction markets now imply roughly a 69% probability that the Federal Reserve will leave rates unchanged throughout 2026, a notable departure from the aggressive easing expectations that prevailed at the beginning of the year.
Adding to the challenge, the U.S. dollar has remained firm while Treasury yields have moved higher. The 10-year Treasury yield approached 4.5% on June 3 as stronger labor-market data and elevated oil prices reinforced expectations that monetary policy could remain restrictive. Higher yields increase the opportunity cost of holding non-yielding assets such as Bitcoin and tend to tighten financial conditions across risk markets.
Why Equities Are Holding Up Better
The key difference is that equities still possess a powerful internal growth narrative. Capital continues to flow into AI-related companies, supporting earnings expectations and offsetting some of the macroeconomic pressure. Crypto, by contrast, is experiencing a simultaneous erosion of its own demand base through ETF outflows, weak stablecoin liquidity growth, and renewed concerns about future supply.
In short, equities are managing to absorb macro headwinds because investors remain focused on growth opportunities. Crypto, however, is being squeezed from both directions—facing the same macro pressures as stocks while simultaneously navigating a deterioration in its own liquidity and demand dynamics.
Will Bitcoin Keep Grinding Lower?
For Bitcoin, the near-term outlook revolves around two critical price levels.
The Downside: $60,000
The $60,000 area represents the next major psychological support zone and broadly aligns with estimates of miners’ average production costs. A decisive break below this level would suggest that sellers remain firmly in control, increasing the likelihood that Bitcoin continues searching for a lower cycle bottom.
From a historical perspective, such a move would not be inconsistent with previous four-year market cycles, where prolonged periods of weakness and consolidation often occurred before a sustainable recovery emerged.
The Upside: $70,000
On the other hand, a recovery above $70,000 would be the first meaningful signal that the worst of the correction may already be priced in. Until either level is decisively breached, Bitcoin is likely to remain trapped in a volatile trading range, with price action heavily influenced by macroeconomic developments and shifts in investor sentiment.
With tensions around the Strait of Hormuz still unresolved and geopolitical risks continuing to support inflation concerns, the market currently lacks a clear bullish catalyst. Investors will therefore be closely watching the June 10 CPI release for clues about the future path of monetary policy.
Why the SpaceX IPO Matters
The planned SpaceX listing on June 12 could become an additional headwind for crypto markets. Expected to raise approximately $75 billion at a valuation of around $1.77 trillion, the offering would be the largest IPO on record, with roughly 30% of shares allocated to retail investors.
While the IPO is not directly related to digital assets, it could influence capital flows across risk markets.
Several factors make this possibility noteworthy:
Powerful return narrative: SpaceX’s valuation grew from roughly $500 million in its early years to around $800 billion by late 2025, creating a compelling growth story that may attract significant investor demand.
Fragile crypto sentiment: With Bitcoin under pressure and no obvious catalyst for a near-term rebound, some investors may choose to reallocate capital from crypto into one of the most anticipated equity listings in history.
Limited appeal of fixed income: Elevated yields and bond-market volatility may encourage investors seeking higher returns to favor equities over traditional safe-haven assets.
Portfolio rotation within equities: Capital could rotate from weaker sectors and underperforming stocks into the new listing, further concentrating market attention on a handful of high-profile growth opportunities.
The Bigger Picture
The broader consequence may be an increase in market concentration.
For crypto, any further diversion of capital could intensify liquidity pressures at a time when ETF flows, stablecoin growth, and market sentiment are already deteriorating. Under those conditions, digital assets may remain vulnerable to additional downside.
For equities, the situation is different but not without risk. Market performance has become increasingly dependent on a small number of AI-driven companies, and the addition of another mega-cap growth story could further concentrate investor flows. Historically, highly concentrated markets tend to be less resilient when sentiment eventually shifts.
Unless Bitcoin can reclaim key resistance levels or attract a fresh source of demand, the path of least resistance in the near term remains sideways to lower, with macroeconomic data, liquidity conditions, and cross-market capital flows likely to dictate the next major move.
Liquidity Is Missing, Selling Pressure Is Not
The current Bitcoin market faces a simple but significant problem: demand is weakening while supply continues to rise.
ETF Demand Remains Negative
The most important institutional demand source of the current cycle continues to deteriorate. U.S. spot Bitcoin ETFs recorded 13 consecutive trading sessions of net outflows between May 15 and June 3, with cumulative withdrawals reaching approximately $4.33 billion.
This persistent selling indicates that the primary channel responsible for absorbing large amounts of Bitcoin supply throughout much of the rally is no longer providing meaningful support. As long as ETF flows remain negative, the market loses one of its strongest structural demand drivers.
Stablecoin Liquidity Is Not Replacing Lost Demand
Normally, weakening ETF demand could be offset by rising stablecoin balances on exchanges, which often signal fresh capital waiting to enter the market.
That is not happening.
Data tracking aggregate stablecoin reserves across exchanges shows little evidence of meaningful accumulation since early June. In fact, reserves have generally trended lower since mid-May.
In practical terms, declining stablecoin reserves suggest that fresh buying power is not entering the market. Instead, capital appears to be moving away from exchanges, reducing the amount of liquidity available to absorb selling pressure when prices decline.
Bitcoin Supply Is Moving Onto Exchanges
At the same time, Bitcoin exchange netflow data points to increasing spot-market selling pressure.
Since roughly May 24, netflows have remained predominantly positive, meaning more Bitcoin has been transferred onto exchanges than withdrawn. Historically, this pattern is associated with rising sell-side activity, as investors typically move assets to exchanges when preparing to sell rather than hold them in long-term custody.
An expanding exchange supply base, combined with weakening demand, creates an unfavorable balance for price stability.
A Market Searching for Equilibrium
Taken together, the message from liquidity indicators is clear.
ETF demand has turned negative. Stablecoin reserves are not growing. Bitcoin continues to flow onto exchanges. In other words, the market is losing buyers while gaining potential sellers.
Until fresh liquidity returns or selling pressure eases, Bitcoin is likely to remain in a price-discovery phase as it searches for a level where demand is once again strong enough to absorb available supply. Without that rebalancing, downside risks remain elevated despite periodic relief rallies and short-term technical rebounds.
Leverage Was Hit, But Not Cleared
This week’s market correction triggered a sharp liquidation wave, but it did not fully reset speculative positioning.
Longs Were Heavily Liquidated
As Bitcoin declined, forced deleveraging was concentrated almost entirely on the long side. On June 2, total crypto liquidations reached approximately $1.76 billion, with nearly 90% of that amount coming from long positions.
This indicates that the downturn primarily punished leveraged bullish positioning rather than reflecting a broad-based reduction in risk exposure across both sides of the market.
Open Interest Remains Elevated
Despite the size of the liquidation event, derivatives positioning did not meaningfully reset.
Bitcoin open interest, measured in BTC terms, actually increased after the sell-off, climbing to a record level of roughly 784,000 BTC on June 3. This suggests that while some leverage was flushed out during the decline, speculative exposure quickly rebuilt, keeping overall market leverage structurally high.
In practical terms, the market experienced a liquidation shock without a full deleveraging cycle. That leaves conditions in place for continued volatility if price moves trigger another wave of forced liquidations.
Week Ahead: Key Macro and Market Events
Several high-impact events over the coming days may shape liquidity conditions across both crypto and broader risk assets:
June 10: U.S. CPI (May inflation data)
June 11: U.S. PPI (producer inflation data)
June 11: SpaceX IPO pricing
June 12: SpaceX Nasdaq debut
The SpaceX listing is expected to raise approximately $75 billion at a valuation near $1.77 trillion, making it the largest IPO on record. Two factors are particularly relevant for crypto markets.
1. Price Discovery and Risk Appetite
Private secondary market indications ahead of the IPO have been trading roughly in the $129–$137 range, suggesting limited discount to expected pricing. This means the first trading sessions will likely serve as the true test of demand, revealing how aggressively investors are willing to allocate capital into a highly concentrated growth story.
2. Potential Liquidity Siphon
More importantly for digital assets, the IPO could act as a significant liquidity magnet. Large-scale capital rotation into a single high-profile equity listing may temporarily reduce flows into alternative risk assets, including crypto.
If that occurs during a period of already weak ETF inflows, soft stablecoin liquidity, and elevated derivatives positioning, it could amplify downside pressure on Bitcoin.
At the same time, such concentration of capital into one name can reduce broader market resilience, as fewer assets share investor attention and liquidity. In that environment, smaller shocks can have outsized effects across remaining risk markets.
Overall, the combination of elevated leverage, fragile liquidity, and upcoming macro catalysts sets up a sensitive trading window where Bitcoin’s direction will likely depend less on narrative and more on actual capital flows and forced positioning dynamics.
The recent wave of selling in US spot Bitcoin ETFs has emerged as one of the clearest signs that institutional investors are becoming more cautious toward risk assets.
The BlackRock iShares Bitcoin Trust (IBIT) experienced net outflows totaling approximately $2.43 billion across nine consecutive trading sessions in May 2026. The streak culminated on May 26 with a $1.26 billion dark-pool block transaction, the largest single-day redemption recorded since the fund launched in January 2024.
Blockchain data reinforced the scale of the withdrawal activity. Roughly 6,005 BTC—worth about $403 million at the time—was transferred from custody wallets associated with IBIT to Coinbase Prime, offering direct evidence of the redemption process behind the reported fund outflows.
The sustained withdrawals effectively erased much of the nearly $3 billion that flowed into IBIT during April, a month that marked one of the strongest periods of spot Bitcoin ETF demand since October 2025.
The sharp reversal in investor flows, coupled with the sizable movement of Bitcoin to an exchange-linked custody platform, intensified risk-off sentiment across crypto markets. It also contributed additional sell-side liquidity to spot markets during a period already characterized by macroeconomic uncertainty.
Understanding the IBIT Redemption Trend
At the time of the outflow cycle, IBIT held an estimated 660,000–670,000 BTC, representing roughly $44–46 billion in assets under management. Against that backdrop, the $2.43 billion withdrawal equates to around 5–5.5% of total fund assets, suggesting a meaningful portfolio reallocation rather than routine redemption activity.
The magnitude of the May 26 event was particularly notable. The previous record for a single-session outflow stood at approximately $649 million in January, making the latest redemption nearly twice as large.
Data from CoinGlass also showed that selling pressure extended beyond IBIT. Comparable outflows were recorded across other major spot Bitcoin ETFs, including Fidelity’s FBTC, ARK Invest’s ARKB, and Grayscale’s GBTC. The synchronized withdrawals point to a broader institutional de-risking trend rather than concerns tied to any individual fund.
Longer-Term Context Remains Constructive
Despite the weakness seen in May, the broader flow picture remains positive. US spot Bitcoin ETFs still entered June with nearly $2 billion in net inflows year-to-date, while cumulative inflows since launch remained in the region of $58–59 billion.
As a result, although the recent redemption wave represents a significant short-term shift in sentiment, it has not fundamentally altered the larger institutional positioning that was built throughout 2024 and 2025. The data suggests a period of risk reduction and portfolio adjustment rather than a wholesale abandonment of long-term Bitcoin exposure.
Macro Conditions and Institutional Positioning: The Risk-Off Shift Driving Bitcoin ETF Outflows
The nine-session streak of Bitcoin ETF outflows unfolded against a backdrop of elevated US Treasury yields and a Federal Reserve policy stance that investors viewed as restrictive for risk assets. As financial conditions tightened, Bitcoin slipped below key consolidation levels, reinforcing bearish sentiment across digital asset markets.
Institutional investors responded by scaling back exposure to higher-volatility assets, including Bitcoin ETFs. The trend was not confined to the United States. Between May 25 and May 29, European crypto exchange-traded products recorded approximately $1.67 billion in net outflows, highlighting a broader global shift toward risk reduction.
The coordinated withdrawals across multiple regions suggest that the recent selling pressure reflects a wider institutional portfolio reallocation rather than concerns tied solely to BlackRock’s IBIT or other US-listed Bitcoin ETFs.
Interestingly, capital has not been exiting the crypto sector altogether. Newly launched XRP spot ETFs attracted roughly $132 million in net inflows without registering a single day of net redemptions during the same period. This divergence points to a rotation within digital assets, as investors selectively reallocate capital toward alternative crypto exposures rather than abandoning the asset class entirely.
$63,000 Emerges as Bitcoin’s Key Inflection Point
Bitcoin continues to trade just above the $63,000 level, a threshold increasingly viewed as the dividing line between a healthy consolidation phase and a more pronounced corrective move.
Should the market break decisively below this support zone, downside momentum could accelerate toward the $60,000 area, where longer-term investors have historically demonstrated stronger buying interest. Such a bearish outcome would likely be driven by continued institutional outflows, persistently high real yields, and Bitcoin’s inability to reclaim resistance around $65,000.
On the other hand, the bullish case remains intact if ETF redemptions begin to stabilize after the recent wave of selling. A softer-than-expected inflation report or a more accommodative tone from the Federal Reserve could improve risk sentiment and encourage fresh institutional allocations. Given that assets held by spot Bitcoin ETFs remain historically elevated despite recent withdrawals, a shift in macro expectations could provide the catalyst for Bitcoin’s next upward move.
For now, the $63,000 region represents the market’s most important near-term battleground, with the interplay between ETF flows and Federal Reserve policy likely determining Bitcoin’s next major directional trend.
According to Swissblock, Bitcoin (BTC) has entered a high-risk zone as institutional demand continues to weaken and spot Bitcoin ETFs record rising outflows. The growing selling pressure comes amid broader market uncertainty, pushing BTC into a more vulnerable position.
Against this backdrop, Bitcoin price has fallen toward the $76,000 level following the latest U.S. military strike on Iran. Several key market indicators are now flashing warning signals as BTC struggles to regain momentum above the $78,000 resistance area.
Swissblock’s Risk Index Signals Rising Market Stress
Swissblock has warned that Bitcoin is slipping further into a high-risk zone, with its proprietary risk index highlighting increasing pressure across the broader crypto market. According to the firm, bullish momentum is fading rapidly, while institutional demand — including purchases from major players such as Strategy — has largely stalled.
At the same time, Bitcoin’s volatility remains elevated, adding to concerns over market stability. Swissblock noted that BTC is now entering a fragile phase that could be vulnerable to sharp and sudden price declines. The firm also emphasized that weakening institutional participation and deteriorating investor confidence are contributing to the growing downside risk.
Analysts also noted that current market conditions differ sharply from the strong rally seen earlier this year. At that time, steady spot Bitcoin ETF inflows helped fuel bullish momentum and supported higher prices. Now, however, the market is witnessing the opposite trend, with persistent outflows weighing on sentiment and weakening demand. As a result, caution has grown among both short-term traders and long-term Bitcoin holders.
Glassnode Reports Continued ETF Outflows
On-chain analytics firm Glassnode has reported persistent outflows from Bitcoin investment products, signaling weakening institutional appetite. According to the firm, spot Bitcoin ETFs have experienced several consecutive days of sizable withdrawals, adding further pressure to the broader crypto market.
Glassnode noted that institutional demand for Bitcoin has weakened significantly compared with previous months, with spot Bitcoin ETFs recording near-daily outflows over the past two weeks. Investors appear to be reducing their exposure as global financial markets become increasingly uncertain and volatile.
These persistent ETF outflows are particularly important because institutional inflows were a major driver behind Bitcoin’s powerful rally earlier this year. Strong demand from spot Bitcoin ETFs helped BTC climb to fresh highs, reinforcing bullish market sentiment. However, if ETF demand continues to deteriorate, analysts warn that Bitcoin could face additional selling pressure in the near term.
Bitcoin Slides After U.S. Strikes on Iran
The crypto market came under renewed pressure this week as escalating geopolitical tensions weighed heavily on investor sentiment. Bitcoin (BTC) declined amid expectations and subsequent reports of U.S. military strikes targeting Iranian assets in the Middle East. As global risk appetite deteriorated, investors shifted capital toward traditional safe-haven assets, triggering fresh selling across risk-sensitive markets.
Geopolitical uncertainty often sparks sharp reactions in the cryptocurrency market, and the latest developments have intensified caution among traders. With investors reducing exposure to risk assets such as Bitcoin, BTC price came under significant pressure and moved lower as market uncertainty deepened.
Bitcoin Struggles to Reclaim $78,000
Bitcoin (BTC) remains under pressure below the key $78,000 resistance zone, with multiple recovery attempts failing throughout the week. Each time BTC approached higher levels, sellers quickly regained control as market sentiment weakened amid reports of U.S. military strikes in the Middle East.
The continued risk-off mood has limited bullish momentum, keeping Bitcoin trapped in a fragile technical position. According to CoinMarketCap, BTC recently fell toward the $76,500 area as traders reacted to rising geopolitical uncertainty and persistent ETF outflows.
For Bitcoin to regain bullish momentum, analysts believe stronger institutional buying will be necessary to offset the recent wave of ETF outflows and weakening market sentiment. Without renewed demand from large investors, BTC could continue trading sideways or extend its decline in the near term.
Market watchers also note that Bitcoin’s support in the mid-$75,000 region remains critical for short-term price stability. A sustained break below that area could trigger additional downside pressure, while holding above it may help BTC stabilize as traders assess broader macroeconomic and geopolitical risks.
Technical indicators currently suggest that bearish pressure remains dominant for Bitcoin (BTC). Data from Investing.com shows that most major moving averages are still flashing “Strong Sell” signals, reflecting weak market sentiment and continued downside momentum.
The Relative Strength Index (RSI) also remains below neutral territory, indicating that bullish momentum has yet to recover. Meanwhile, MACD indicators continue to generate sell signals, reinforcing the negative short-term outlook for BTC.
Both short-term and long-term moving averages continue to point toward further downside risk, while several Bitcoin oscillators are gradually moving into oversold territory. Analysts believe stronger buying activity from Bitcoin bulls will be needed to stabilize the market and prevent BTC price from extending its decline further.
Bitcoin has retreated from $82K to $76K over the past two weeks, not in the form of a sharp capitulation event, but through a gradual and persistent decline. At the same time, both ETF inflows and derivatives leverage have begun to weaken in tandem, prompting a key question: where is capital rotating next? This report tracks the outflows, explores the underlying catalysts, and analyzes the technical outlook for BTC’s next potential move.
Current Market Position
Bitcoin recently fell toward the $76K region, marking an approximate 7.5% decline from the early-May local peak near $82K. The market has now posted five consecutive daily red candles, reinforcing the impression of a slow but steady deterioration in price action rather than panic-driven selling.
Meanwhile, the Fear & Greed Index stood at 40 on May 20, hovering at the threshold between neutral sentiment and fear. While the market has not yet entered extreme fear territory, investor confidence is clearly softening as downside momentum continues to build.
The clearest warning sign this week emerged from ETF flows:
On May 18, U.S. spot Bitcoin ETFs posted $649 million in net outflows, marking the third-largest single-day withdrawal of 2026. Over the May 11–15 trading week, cumulative outflows surpassed $1 billion, representing the largest weekly capital exodus since February.
Meanwhile, spot Ethereum ETFs continued to weaken as well, extending their streak of net outflows to six consecutive trading sessions.
Where Is the Capital Rotating?
The most likely destination is equities. On May 14, the S&P 500 climbed above 7,500 for the first time, while the Dow Jones Industrial Average surpassed the 50,000 mark, fueled largely by strong megacap technology earnings. Roughly 84% of S&P 500 companies exceeded Q1 earnings expectations, reinforcing investor appetite for traditional risk assets.
At the same time, hotter-than-expected U.S. inflation data — with CPI at 3.8% and PPI at 6% — forced markets to reassess the likelihood of near-term Federal Reserve rate cuts. The shift in expectations contributed to broader risk-off positioning across crypto markets.
In derivatives, Bitcoin open interest remains elevated at roughly $56.5 billion. The sharp decline between May 13–14 triggered a wave of long liquidations, with additional leverage flushes continuing through May 18–19. While some excess positioning has already been cleared, persistently high open interest suggests the deleveraging process may not be over yet.
Bitcoin perpetual funding rates have remained negative since early March, marking the longest sustained period of negative funding since 2023. This indicates that short positions have dominated the market for months, with bearish traders consistently paying funding fees to maintain exposure.
At the same time, repeated waves of long liquidations have continued to erode buy-side confidence. When combined with persistent ETF outflows, the picture becomes increasingly clear: both on-chain liquidity and off-chain institutional capital are weakening simultaneously.
That said, not all negative funding should be interpreted as outright bearish speculation. A significant portion likely reflects institutional hedging activity, including hedge fund redemptions, MicroStrategy arbitrage structures, and mining firms hedging exposure while pivoting toward AI infrastructure strategies. Still, the more crowded short positioning becomes, the greater the probability of a sharp and aggressive short-covering unwind once market sentiment reverses.
What Is Driving the Decline?
Bitcoin’s recent weakness is not being caused by a single catalyst, but rather by the convergence of several reinforcing forces acting simultaneously across macro, institutional, and derivatives markets.
ETF outflows remain the dominant driver behind the current decline. More than $1 billion exited spot Bitcoin ETFs during mid-May, including a massive $649 million single-day withdrawal, signaling that institutional de-risking is accelerating. A large portion of ETF holders are now sitting below their average entry prices, increasing the risk of additional redemption pressure if sentiment continues to weaken.
Geopolitical uncertainty is another major overhang. President Donald Trump’s May 18 reversal on potential Iran strike rhetoric has kept binary geopolitical risk elevated, weighing broadly on global risk assets, including cryptocurrencies.
Structural pressure from miners is also intensifying. Bitcoin mining difficulty has declined 10.7% year-to-date following six consecutive negative difficulty adjustments. Publicly listed mining companies collectively sold a record 32,000 BTC during Q1 — exceeding their total sales throughout all of 2025. At the same time, many miners are redirecting capital toward AI infrastructure initiatives, creating additional incentives to liquidate holdings. The estimated production-cost zone for next-generation S21 miners, roughly between $69K and $74K, is increasingly viewed as a critical physical support range. A sustained move below that band would likely trigger further difficulty reductions and eventually relieve some sell-side pressure.
From a cycle perspective, bears still have a strong macro argument. The historical halving-to-cycle-top structure appears intact once again: the April 2024 halving was followed by a peak near $126K in October 2025, roughly 18 months later. However, the current maximum drawdown of approximately 52% remains relatively shallow compared with previous bear-market declines of 77%–87%, leading cycle-focused analysts to argue that the true capitulation phase may not have occurred yet.
On-chain data, however, continues to provide the clearest bullish counterargument. Whale wallets holding more than 1,000 BTC accumulated approximately 270,000 BTC over a 30-day period through late April, marking the largest monthly accumulation since 2013. Meanwhile, exchange reserves have fallen to a seven-year low near 2.2 million BTC, suggesting long-term holders are aggressively absorbing the supply being sold by leveraged traders and weaker hands.
Key Levels to Watch
Rather than assigning fixed probabilities to bullish or bearish outcomes, a more practical framework is to focus on the technical levels that will determine how this correction ultimately resolves.
Looking Higher: The $82K–$85K Resistance Zone
The 200-day moving average is currently positioned around the $82K–$82.5K range. Last week, Bitcoin climbed to roughly $82.4K before facing an immediate rejection, reinforcing the 200 DMA as a key resistance level.
Further strengthening this resistance is an unfilled CME futures gap from early February, which extends between approximately $80K and $85K. Although last week’s rally toward $82K managed to partially close the gap, a full fill would require sustained bullish momentum through an area where the 200 DMA aligns with significant overhead supply.
Bitcoin needs to break back above $84K and maintain support there to validate a meaningful trend reversal. Until that happens, any upward move below that level is likely to be viewed as a sell-the-rally opportunity.
Looking Down: Two Key Support Zones Before a Deeper Breakdown
If current levels fail to hold, the first major area of support comes from the weekly Bollinger Band lower boundary, which is currently near $71K. A move into this zone would imply roughly a 7% drop from current prices and would coincide with the S21 miner shutdown range of $69K–$74K, where mining difficulty adjustments could begin easing sell-side pressure.
Beneath that lies the 200-week moving average (200 WMA), estimated around $63K–$65K, which remains a critical long-term structural support level. A revisit of this area would create a textbook H1 2026 double-bottom formation alongside February’s $59.9K low.
If Bitcoin loses the $71K support region, the next significant floor sits at the 200 WMA between $63K and $65K. Holding that zone would strengthen the double-bottom thesis and could pave the way for the next major upward move. However, a decisive break below it would signal a far more bearish downside scenario.
Modern portfolios are no longer forced to choose between stability and rapid growth — investors now expect both.
In mid-January, gold climbed above 4,600 USD per ounce while bitcoin slipped below 92,000 USD, remaining volatile yet still resilient on a year-to-date basis. Both assets continue to attract capital. While they are often portrayed as opposing trades, the reality is becoming more complex. Investors are no longer choosing between gold and crypto — they are allocating to both. The key question is no longer which asset will outperform, but why capital is flowing into both simultaneously, and what that says about global markets in 2026.
Why gold is reaching record highs
Gold’s rise beyond 4,600 USD per ounce reflects more than short-term fear. Central bank behavior has undergone a structural shift. For the first time in decades, gold now accounts for a larger share of global reserve allocations than US Treasuries, highlighting changing views on long-term monetary stability among sovereign institutions.
Institutional demand has followed the same trend. Exchange-traded funds experienced renewed inflows throughout 2025, while central banks continued purchasing gold at elevated levels. This is not simply momentum-driven buying — it is strategic positioning. Against a backdrop of geopolitical tension, concerns over fiscal sustainability, and uncertainty surrounding the future path of interest rates, gold is increasingly viewed as both a hedge and a reserve asset free from counterparty risk.
Expectations of lower interest rates have also strengthened gold’s appeal. Falling yields reduce the opportunity cost of holding non-yielding assets, making gold comparatively more attractive. Meanwhile, a weaker US dollar mechanically supports gold demand outside the United States, reinforcing its role as a global store of value rather than merely a defensive asset.
In this environment, gold is no longer seen solely as an inflation hedge. It has evolved into a broader indicator of policy uncertainty and systemic risk — a form of protection against scenarios that traditional fixed-income assets may no longer hedge effectively.
Why crypto continues to attract demand despite volatility
Bitcoin’s volatility has not stopped capital from returning to the market. Although still trading well below its late-2025 peaks, bitcoin remains structurally elevated, reflecting a different form of investor demand. Unlike gold, its appeal lies not in stability, but in responsiveness.
Crypto markets remain closely tied to liquidity conditions and investor risk appetite. Bitcoin does not consistently function as a safe haven. During periods of acute market stress, it can decline alongside equities. However, when liquidity expectations improve or risk sentiment recovers, bitcoin often rebounds more rapidly — and more aggressively — than traditional assets.
This dynamic positions crypto as a performance-oriented asset rather than a defensive hedge. Investors allocate capital to it when they anticipate improving financial conditions, seek exposure to volatility, or pursue asymmetric upside potential. Institutional access has expanded and market infrastructure has matured, but crypto still retains the high-risk, high-reward characteristics that continue to attract investors willing to tolerate significant fluctuations.
The rise of the mixed portfolio strategy
Perhaps the most important development is not gold’s rally or crypto’s resilience individually, but the fact that investors are increasingly holding both simultaneously. This reflects a portfolio strategy designed for a multi-regime market environment.
Gold acts as a stabilizer during periods of uncertainty, while crypto offers convex upside when conditions improve. Holding both is not contradictory — it reflects an acknowledgment that markets in 2026 are no longer driven by a single dominant narrative. Risk can escalate quickly, but liquidity conditions can also improve just as rapidly. Portfolios positioned for only one outcome risk being exposed to the other.
This blended approach suggests investors are managing not only volatility, but also regime uncertainty. They are hedging against systemic risks while remaining positioned for performance opportunities. It represents a more sophisticated style of portfolio construction — one that balances defensive and offensive exposure dynamically rather than statically.
According to Terence Hove, senior market analyst at Exness, execution quality becomes increasingly important when trading assets with vastly different volatility profiles. He notes that cross-asset strategies depend on reliable trading conditions, especially during macro-driven market events, where spreads, execution precision, and slippage control become critical for traders moving between gold and crypto.
This dual-allocation approach also highlights a practical issue that is often overlooked: switching between defensive and performance assets only works efficiently if trading conditions remain stable across both markets. Otherwise, the transition itself becomes an additional cost. In this sense, broker execution quality becomes part of portfolio construction.
For instance, Exness reported that BTCUSD spreads remained at minimum levels 99.98% of the time, while ETHUSD spreads were reduced by 67%. In highly volatile markets, such consistency can help traders adjust exposure without execution risk becoming the dominant variable.
What this says about market psychology
Simultaneous demand for gold and crypto points to a fragmented macro environment. Markets are neither fully risk-on nor fully risk-off. Instead, investors are positioning for multiple possible outcomes at the same time.
Demand for gold reflects concerns over policy credibility, currency stability, and geopolitical tensions. Demand for crypto reflects expectations that liquidity cycles and structural adoption trends can still drive strong performance. These narratives coexist because the current macro backdrop supports both caution and opportunism.
In that sense, markets are not choosing between fear and growth — they are pricing both simultaneously. The combination of strong gold demand and persistent crypto interest suggests investors are building portfolios capable of absorbing shocks while still participating in upside opportunities when conditions improve.
As 2026 progresses, the relationship between gold and crypto will likely remain fluid, shaped by changes in liquidity conditions, policy expectations, and market stress. Investors who understand the distinct role each asset plays — and who operate within trading environments capable of maintaining stability across asset classes — may be better equipped to navigate the volatility ahead.
A Bitcoin investor regained access to almost $400,000 worth of BTC after leveraging Claude AI to unlock a wallet that had remained inaccessible since 2015.
The recovery process involved AI-assisted analysis of legacy wallet files and mnemonic information to help identify the correct password.
Blockchain records later confirmed the transfer of the recovered funds, fueling broader conversations about the expanding role of artificial intelligence in cryptocurrency recovery efforts.
A Bitcoin (BTC) holder reportedly regained access to around 5 BTC — valued at nearly $400,000 — after recovering a forgotten wallet password, according to a viral post on X shared Wednesday.
The user, known on X as cprkrn, said the breakthrough came with the help of Claude AI after years of unsuccessful attempts to recover the wallet.
Crypto community reacts to AI-assisted wallet recovery
According to the post, the wallet became inaccessible after the owner changed the password and later forgot the updated credentials. Over the years, he allegedly tested countless password combinations, hired several recovery experts, and searched through old notes in an effort to regain access to the funds.
The turning point came when the user uploaded files from an old college computer into Claude AI. By combining the data with a recovered mnemonic seed phrase, he was ultimately able to decrypt the wallet and recover the Bitcoin.
“Tried ~3.5 trillion passwords + none worked, ended up matching an old seed phrase found in a college notebook with an old wallet file,” he wrote.
The user later publicly disclosed the forgotten password, triggering widespread reactions throughout the crypto community. In a follow-up post, he admitted he “would’ve been too dumb to figure it out” without the AI’s help.
Blockchain activity appears to support the claim. Wallet records linked to the address show BTC deposits dating back to April 2015, along with recent transactions consistent with a recovery and transfer of the funds to a new wallet, according to data from Blockchair.
The story quickly attracted attention from several notable figures in the crypto space, including Nic Carter, Laura Shin, and Jesse Pollak.
Importantly, the recovery depended on AI-assisted analysis of files and credentials already owned by the wallet holder, helping ease concerns about broader threats to Bitcoin wallet security.
The incident highlights an emerging use case for artificial intelligence in crypto recovery efforts. However, it does not suggest that AI can crack Bitcoin’s encryption, as the recovery relied on existing seed phrases and legacy wallet data rather than bypassing cryptographic protections.
The case also contrasts with other high-profile stories involving lost Bitcoin holdings, including the 2025 attempt by James Howells to recover a hard drive containing thousands of BTC from a landfill.
Bitcoin’s recovery pauses while the $80,000 support level remains intact, as optimism surrounding a final US-Iran peace deal begins to fade.
Market participants are also staying cautious ahead of key US economic data releases, particularly Tuesday’s CPI report.
Meanwhile, the US Senate Banking Committee is scheduled to conduct its markup hearing on the Clarity Act this Thursday.
On the supply side, roughly $159 million worth of token unlocks — led by Solana’s $40 million and Pump.fun’s $21 million — may add further volatility to the crypto market.
The cryptocurrency market started the week on a subdued note, with Bitcoin (BTC) finding it difficult to maintain support above $80,000 as optimism over a final US-Iran peace agreement weakened due to growing complications in the negotiations.
Altcoins also showed signs of fading momentum, with Ethereum (ETH) retreating from its weekly peak of $2,375, while Ripple (XRP) revisited support around $1.45 after facing rejection near the $1.50 resistance zone.
Trump rejects Iran’s peace proposal
US President Donald Trump has rejected Iran’s latest proposal to end the conflict, calling it “totally unacceptable.” The proposal, reportedly delivered to the White House through Pakistani mediators, was presented as a counteroffer to a one-page US memorandum outlining a phased framework for ending the war — a conflict that has severely disrupted the Strait of Hormuz, one of the world’s most strategically important shipping routes.
Under the proposal, Iran demanded the complete removal of US sanctions, an immediate end to the military blockade around the Strait, and concessions related to its nuclear program, including a shorter moratorium on uranium enrichment. Tehran also sought sovereignty rights over the Strait of Hormuz, including authority to coordinate maritime traffic passing through the route.
Trump has continued to maintain a firm stance on Iran’s nuclear ambitions, insisting that the country’s nuclear program must be fully dismantled.
Meanwhile, global markets remain tense as hopes for a lasting peace agreement continue to weaken amid the fragile diplomatic environment. Oil prices also remain elevated, with West Texas Intermediate (WTI) crude holding near the $95.00 level.
Caution ahead of US macroeconomic data
The US Bureau of Labor Statistics (BLS) is scheduled to release the Consumer Price Index (CPI) report on Tuesday. The CPI is the US’s main inflation gauge, tracking changes in the average prices consumers pay for goods and services such as food, housing, and transportation over time.
For investors, CPI data plays a critical role in shaping expectations for interest rates. A stronger-than-expected inflation reading could further reduce hopes for Federal Reserve rate cuts in 2026, while softer inflation data may strengthen the bullish outlook for risk assets like Bitcoin, as markets anticipate a more accommodative monetary policy stance from the Federal Reserve.
March inflation data came in above expectations, with headline CPI rising to 3.3% year-over-year, compared to 2.4% in February. Core CPI — which excludes volatile food and energy prices — increased to 2.6% in March from 2.5% previously.
Markets are now forecasting April CPI to climb further to 3.7% YoY, while Core CPI is expected to edge up to 2.7%.
Investors will also closely monitor Wednesday’s Producer Price Index (PPI) release, which measures inflation from the producer side by tracking changes in the prices businesses receive for goods and services.
Clarity Act advances to US Senate markup hearing
The Senate Banking Committee is expected to hold its long-awaited markup hearing for the Digital Asset Market Clarity Act of 2025 — commonly known as the Clarity Act — on Thursday.
The legislation had remained largely stalled after Coinbase CEO Brian Armstrong announced in January that the exchange was withdrawing its support over concerns related to stablecoin yield provisions and other aspects of the bill.
However, momentum appears to have returned following the release of a compromise draft by Senators Thom Tillis and Angela Alsobrooks. The revised text reportedly proposes banning crypto firms from offering yield on static stablecoin reserve holdings, while still permitting rewards tied to stablecoin assets actively used in certain activities. The compromise helped move the legislation forward to the next stage of the process.
At the same time, banking industry groups indicated that several concerns with the compromise proposal remain unresolved. According to a report from CoinDesk, industry representatives said they would continue providing feedback in an effort to reach a framework that supports digital asset innovation while also strengthening consumer protections.
Large token unlocks could fuel market volatility
Several cryptocurrency projects are set to unlock additional token supply into the market this week, potentially increasing short-term volatility. The schedule began on Monday with a notable $5 million unlock from Based.
According to data from DefiLlama, Tuesday’s unlocks are expected to be significantly larger, led by Solana with roughly $40 million in tokens entering circulation, followed by Pump.fun at around $21 million and Aptos with nearly $13 million.
Additional sizable unlocks later in the week include approximately $9 million from Sei on Thursday, around $18 million from Connex on Friday, and roughly $13 million from Arbitrum on Saturday.
Token unlocks often increase selling pressure as newly released assets become available for trading, which can lead to heightened price swings, particularly during periods of cautious market sentiment.
Technical outlook: Bitcoin rally loses momentum as support remains intact
Bitcoin is trading around $81,246, maintaining a cautious tone as price action remains below the 50-week and 100-week Exponential Moving Averages (EMAs), as well as the weekly SuperTrend indicator.
Despite the near-term weakness, the 200-week EMA near $68,125 continues to support the broader bullish structure. Momentum indicators also point to consolidation rather than a sharp bearish reversal.
The Moving Average Convergence Divergence (MACD) histogram remains in positive territory, signaling that bullish momentum has not completely faded. Meanwhile, the Relative Strength Index (RSI) on the daily timeframe is hovering near the neutral 50 level, indicating that momentum is stabilizing instead of showing a decisive move higher at this stage.
On the upside, the first major resistance level appears near the 100-week EMA at $82,381, while the 50-week EMA around $85,634 strengthens a heavy supply zone overhead. A stronger bullish recovery would likely require a weekly close above the SuperTrend resistance at $91,753.
On the downside, the 200-week EMA near $68,125 remains the key structural support level for Bitcoin’s broader trend. A sustained move below this area would significantly weaken the medium-term technical outlook.
Bitcoin resumes its upward move on Monday following a brief pause last week.
Ethereum is nearing its 200-day EMA, and a strong close above this level could pave the way for further gains.
XRP trades close to the $1.40 resistance area, with a breakout potentially sparking a new rally.
Bitcoin (BTC) climbs on Monday, trading above $80,000 and continuing its uptrend after a short consolidation last week. Ethereum (ETH) and Ripple (XRP) mirror BTC’s momentum, posting early-week gains as they approach key resistance levels, where a breakout could signal the start of another rally.
Bitcoin reaches the $80,000 milestone.
Bitcoin (BTC) is trading around $80,161 on Monday, maintaining a bullish tone as it holds above a strong support zone formed by the 50% Fibonacci retracement at $78,962 and the 100-day EMA near $75,903. The 50-day EMA around $74,448 further supports the ongoing uptrend.
Momentum indicators remain positive, with the RSI near 66 in bullish territory and the MACD crossing higher into positive ground, signaling continued buying interest despite nearby resistance levels.
On the upside, immediate resistance is seen at the 200-day EMA around $81,912, followed by the 61.8% Fibonacci level at $83,437 and a key horizontal barrier near $84,410. A decisive close above this zone could pave the way for a move toward the January high around $97,924.
On the downside, initial support lies at the $80,000 psychological level, with stronger support at $78,962. A deeper correction could target the broader support area between the 100-day EMA at $75,903 and the previous channel top near $75,680, where buyers are likely to step in as long as the overall bullish structure remains intact.
Ethereum may extend gains with a confirmed close above the 50-day EMA
Ethereum (ETH) is trading around $2,370 on Monday, holding a constructive short-term outlook as price remains above both the 50-day EMA (~$2,256) and the 100-day EMA (~$2,344). However, it is now testing a key resistance zone, with the 38.2% Fibonacci retracement at $2,380 acting as the first barrier, while a stronger supply cluster sits near $2,575, where the 50% retracement and the 200-day EMA converge.
Momentum is gradually improving. The RSI is rising toward 58, indicating strengthening bullish momentum without being overbought, while the MACD remains negative but is trending higher, suggesting fading bearish pressure.
On the upside, a break and daily close above $2,380 would expose the critical $2,575 confluence zone. Clearing this area decisively could open the path toward the 61.8% Fibonacci retracement at $2,770.
On the downside, immediate support lies at the 100-day EMA ($2,344), followed by the 50-day EMA ($2,256). A deeper pullback could test the channel resistance-turned-support near $2,148 and the 23.6% retracement at $2,138. Only a move toward the lower channel boundary near $1,747 would begin to threaten the broader bullish structure.
XRP tests key resistance near $1.40
XRP is trading around $1.41 on Monday, hovering just above the 50-day EMA at $1.40, which provides immediate support. However, it remains below the 100-day EMA near $1.50 and the upper boundary of a broader descending channel around $1.54, keeping the medium-term outlook constrained.
Momentum is modest. The RSI sits near 53, indicating mild bullish pressure without being overextended, while the MACD has dipped slightly into negative territory, suggesting that upward momentum may be losing strength as price consolidates.
On the upside, resistance is seen first at the 100-day EMA (~$1.50), followed by the channel ceiling near $1.55. A sustained breakout above this zone would be required to target the 200-day EMA at $1.74 and the longer-term resistance around $1.90.
On the downside, initial support lies at the 50-day EMA ($1.40), followed by a stronger floor at $1.30. If selling pressure intensifies, the lower boundary of the channel near $0.73 could come into focus as a major structural support level.
Is Bitcoin’s legendary boom-and-bust cycle truly breaking down, or are traders simply misinterpreting recent price action? After rallying to around $126,000 and then plunging nearly 50% within months, Bitcoin is putting one of its most enduring narratives—the four-year cycle—under serious scrutiny.
From 2024 to 2025, claims that “the four-year cycle is dead” spread widely across crypto circles as Bitcoin repeatedly set new all-time highs, peaking near $126,000 in October. Prominent voices like Bitwise’s Matt Hougan and ARK Invest’s Cathie Wood supported this view, pointing to shifting market dynamics such as spot BTC ETFs, evolving regulation, and increasing institutional and government participation.
Yet after the roughly 50% correction over the past six months, many who dismissed the cycle have reversed course, once again favoring the traditional pattern. Still, the question remains: what if the original argument—that the cycle is changing—was right all along?
The four-year cycle, explained
Bitcoin has historically moved in a repeating four-year rhythm, closely tied to its halving events. These cycles typically feature major bull market peaks and deep bear market bottoms spaced about four years apart. This pattern can be seen in Bitcoin’s record highs in November 2013, December 2017, November 2021, and October 2025—each occurring in the period following a halving.
A halving cuts the rate of new Bitcoin issuance by 50% roughly every four years, tightening supply and often fueling upward price momentum.
On the downside, Bitcoin has also followed a consistent pattern of steep corrections, with bear market lows marked by drawdowns of around 80% from prior highs—seen in January 2015, December 2018, and November 2022.
More recently, Bitcoin appears to be echoing this behavior, dropping about 50% from its $126,000 peak in October to around $63,000 by February. However, this could be one of the final instances where the market adheres so closely to the traditional four-year cycle.
Why calling the death of the four-year cycle in 2024 may have been premature
One of the main arguments for declaring the cycle “dead” was Bitcoin reaching a new all-time high before the April 2024 halving. This early surge was largely driven by strong inflows into newly launched spot BTC ETFs, which boosted demand ahead of schedule.
In previous cycles, Bitcoin typically set fresh record highs 16–18 months after a halving—not before it. So this unusual timing led many to believe that the traditional pattern had broken.
However, rather than signaling the end of the cycle, this shift may simply reflect front-loaded demand. The ETFs and rising institutional participation could have pulled forward the bullish phase, compressing or reshaping the cycle instead of eliminating it altogether.
Some argued that the arrival of traditional finance (TradFi) players via ETFs introduced entirely new market dynamics, since these participants don’t behave like native crypto investors. While there’s some truth to that, the argument overlooks a core driver of price action: supply and demand.
By the time ETF investors entered in January 2024, Bitcoin had already gone through about a year of bear market consolidation. During that phase, native crypto participants—long-time cycle followers, including whales and retail investors—had accumulated significant amounts of BTC, effectively becoming long-term holders (LTHs).
Sticking to the traditional cycle playbook, many of these holders maintained their positions, taking only partial profits, until around Q3 2025. This timing aligned with their expectations of a cycle peak. As a result, LTHs began distributing more heavily leading up to the final top on October 10.
In the months afterward, their holdings dropped sharply, with LTH supply falling to around 13.6 million BTC by December—the lowest level since 2021.
On the surface, the heavy distribution by long-term holders—combined with Bitcoin’s roughly 50% price drop—seemed to validate the familiar four-year cycle. However, it may instead signal a turning point, marking the beginning of that cycle’s breakdown and the rise of a new market structure.
Four-year cycle relevance may diminish over time
The current market reset suggests a gradual shift in Bitcoin ownership—from traditional cycle-driven participants to institutional players such as ETF investors and corporate treasuries like Strategy.
In just the past two months, US spot BTC ETFs have recorded net inflows of about $3.75 billion, while Strategy alone has accumulated over 100,000 BTC since the start of the year. The entrance of major financial institutions—highlighted by Morgan Stanley’s Bitcoin ETF launch in April—further signals that larger, more traditional players are taking a growing role in the market.
If this trend continues, and many crypto-native investors remain on the sidelines, the influence of the classic four-year cycle could steadily weaken. Price behavior already hints at this shift: the recent ~50% decline from Bitcoin’s all-time high is notably milder than the historical average of around 80% in past bear markets. If Bitcoin holds above $60,000, this would mark the shallowest drawdown in its history.
At the same time, halvings may carry less weight going forward. As Bitcoin’s total supply approaches its 21 million cap—with over 20 million already in circulation—the impact of reduced issuance naturally diminishes due to the law of diminishing returns.
As the market matures and institutional participation deepens, these structural changes could accelerate, pushing crypto-native investors to adapt their strategies to a new, less cycle-dependent environment.
Still, there’s room for error
To play devil’s advocate for the four-year cycle, recent behavior from ETF investors suggests the pattern may not be entirely gone.
Many ETF participants appeared to follow a familiar cycle-driven approach last year: strong inflows helped push Bitcoin to new all-time highs, but were later followed by significant outflows as investors rushed to lock in profits or limit losses after the October leverage flush.
This behavior mirrors the classic boom-and-bust rhythm seen in previous cycles, indicating that even newer institutional players may still be influenced—at least partially—by the same psychological and market forces that have historically shaped Bitcoin’s price action.
ETF investors, having now experienced a full boom-and-bust phase, may start factoring the four-year cycle into their strategies—potentially reinforcing it as a self-fulfilling pattern, much like crypto-native investors have done in the past.
At the same time, the true motivation behind ETF demand remains unclear. Unlike corporate holders such as Strategy, which openly embrace a long-term HODL approach, ETF investors represent a broad and diverse group with varying objectives.
Some may be drawn to Bitcoin as a store of value, others may be actively trading the familiar four-year cycle, and some—particularly hedge funds—could be exploiting arbitrage opportunities like the basis trade. This diversity makes it difficult to predict how their collective behavior will shape future market cycles.
So, is the four-year cycle dead?
A more balanced view is that Bitcoin’s cycle may weaken structurally, but still persist behaviorally. Going forward, price dynamics will likely depend less on halvings and more on how institutional capital chooses to act.
Bitcoin rebounds to trade above $76,000 on Friday after finding support near a key level the previous day.
Ethereum remains above its 50-day EMA at $2,244, signaling potential recovery momentum.
Meanwhile, XRP continues its decline after dropping below the key 50-day EMA at $1.41 earlier this week.
Bitcoin (BTC) and Ethereum (ETH) are attempting a recovery on Friday after rebounding from key support levels in the previous session. In contrast, Ripple (XRP) remains under pressure, having slipped below a crucial support zone. Overall, price action across the three leading cryptocurrencies reflects a cautious market sentiment, as traders watch whether BTC and ETH can sustain their rebound while XRP continues to underperform.
Bitcoin is trading around $76,600 on Friday, posting a modest rebound after finding support near a key zone in the previous session. The near-term outlook remains slightly bullish, with price holding above both the 50-day and 100-day EMAs, clustered just below $75,700 and aligned with a former channel top that now acts as immediate support around $75,680.
Momentum indicators paint a mixed picture. The daily RSI near 56 points to steady but not overbought strength, while the MACD remains below the zero line, indicating that the broader momentum backdrop is still somewhat weak despite the recent upside.
On the downside, immediate support lies near $75,680 and the 100-day EMA at $75,665. A deeper pullback could find demand around the 38.2% Fibonacci retracement at $74,487 and the 50-day EMA near $73,783.
On the upside, resistance is first seen at the 50% retracement level of $78,962, followed by the key psychological barrier at $80,000. Beyond that, a stronger supply zone emerges between the 200-day EMA near $82,326 and the 61.8% retracement around $83,437, just below a horizontal cap at $84,410, which could limit further gains.
Ethereum’s 50-day EMA remains firm, providing solid support.
Ethereum is trading around $2,265 on Friday, holding just above its 50-day EMA at $2,244, though still facing resistance below the 100-day EMA at $2,344 and the 38.2% Fibonacci retracement at $2,367. This setup points to a neutral-to-slightly capped outlook, with price maintaining position above the former channel top at $2,148 but lacking the strength to push into higher resistance zones.
Momentum signals remain mixed. The daily RSI sits near 49, reflecting neutral conditions, while the MACD stays in negative territory, suggesting fading bullish momentum despite the short-term support holding.
On the downside, immediate support is located at the 50-day EMA around $2,244. Further support lies near the previous channel ceiling at $2,148 and the 23.6% Fibonacci retracement at $2,130. A break below this zone could expose the lower boundary of the channel near $1,747.
On the upside, resistance begins at the 100-day EMA at $2,344, followed by the 38.2% retracement at $2,367. A sustained breakout above these levels could pave the way toward the 50% retracement at $2,558, then the 200-day EMA at $2,613, with the 61.8% retracement at $2,749 as a longer-term target.
XRP price action remains weak, signaling continued bearish pressure.
XRP is trading around $1.37 on Friday, continuing to show near-term weakness as it remains within a broader descending channel and below all major EMAs. The 50-day EMA at $1.40 acts as the closest resistance, with additional barriers at the 100-day EMA near $1.51 and the channel top around $1.56.
Momentum remains soft, with the RSI near 44 staying below the neutral level, while the MACD continues to trend deeper into negative territory—indicating that any short-term rallies may struggle to gain traction under current conditions.
On the downside, immediate support is seen around $1.30, a level that has previously attracted buyers. If selling pressure intensifies, the broader channel support near $0.75 could come into focus.
On the upside, a daily close above the 50-day EMA at $1.40 would be an early sign of stabilization. Further resistance lies at $1.51 and $1.56, and only a sustained breakout above these levels would begin to weaken the prevailing bearish trend, with $1.90 as a more distant resistance target.
Bitcoin trades just above $76,000 on Friday, maintaining support near its 100-day EMA. The Crypto Fear and Greed Index remains stuck in a neutral-to-bearish zone, signaling subdued market sentiment. Meanwhile, Terra Classic and Zcash are finding it difficult to sustain Thursday’s gains, raising the risk of a potential bearish reversal.
Bitcoin (BTC) holds above $76,000 at the time of writing on Friday, remaining stable despite subdued broader market sentiment. Meanwhile, Terra Classic (LUNC) and Zcash (ZEC) are under pressure, struggling to maintain the gains recorded in the previous session.
Market sentiment tilts toward a bearish bias.
Market sentiment tilts bearish as CoinMarketCap’s Crypto Fear and Greed Index reads 41 on Friday, lingering near the line between neutral and fear, signaling that risk-off sentiment is increasingly taking hold among investors.
Bitcoin steadies at a key support level.
Bitcoin holds near a key support level, with the 100-day EMA around $75,719 halting its recent three-day pullback and maintaining a short-term upward bias. However, the MACD remains in negative territory below its signal line, indicating that bullish momentum may be transitioning into a corrective phase. Meanwhile, the RSI at 56 stays above the midpoint, supporting a constructive outlook without signaling overbought conditions.
A break below the 100-day EMA at $75,719 could expose the 50-day EMA near $73,786 as the next support level, while the ascending trendline around $68,707 represents a more distant structural base.
On the upside, the 200-day EMA at 82,494.55 stands as the next key resistance, and a sustained move above this level could pave the way for a fresh advance within the broader bullish trend.
Will Terra Luna and Zcash hold gains?
Terra Classic (LUNC) is trading above $0.000070 on Friday, maintaining its footing after a strong 5% rally in the previous session. The token continues to hold above its 50-, 100-, and 200-day EMAs, signaling a constructive short-term outlook.
However, momentum indicators suggest caution. The RSI is elevated near 79, deep in overbought territory, indicating that the recent upside may be stretched. At the same time, the MACD is flattening around the zero line, pointing to fading bullish momentum following the latest surge.
For now, LUNC faces clear resistance at the $0.000081 swing high. A failure to break above this level could lead to consolidation or a short-term pullback, especially given the overheated conditions.
On the downside, the 78.6% and 61.8% Fibonacci retracement levels at $0.000070 and $0.000062, respectively, act as key support zones for Terra Classic.
Meanwhile, Zcash trades below $350 on Friday, continuing to consolidate within a triangle pattern. Despite this, the broader outlook remains constructive, with price action holding firmly above the 50-, 100-, and 200-day EMAs clustered between roughly $285 and $307.
Zcash also stays above a rising support trendline near $322, indicating that buyers still dominate the medium-term structure. However, the MACD slipping below its signal line points to fading upside momentum, while the RSI at 56 keeps the bias modestly tilted to the upside.
On the upside, immediate resistance lies at the descending trendline around $357, where previous rallies have stalled. A decisive daily close above this level could trigger a stronger recovery, potentially targeting the $400 psychological level.
On the downside, initial support emerges at the rising trendline near $322, followed by the 50-day EMA around $307 and the 100-day EMA near $301. The 200-day EMA at $284 serves as a deeper and more critical support level should selling pressure intensify.
The conflict involving Iran has disrupted many asset classes—except for Bitcoin. In recent weeks, the leading cryptocurrency has shown notable resilience, with far less volatility than other risk-sensitive assets like U.S. equities. While some argue that Bitcoin is becoming less sensitive to geopolitical events, other factors are also at play.
Last week, Bitcoin climbed to a two-month high above $78,000 and has largely maintained those gains, continuing its upward momentum.
Historically, Bitcoin hasn’t been insulated from geopolitical shocks. Its price has tended to drop during sharp escalations—such as the Iranian strikes on Israel in April 2024—and it still behaves like a risk asset, often moving in tandem with equities during periods of extreme market fear. Yet this pattern hasn’t played out in the current Middle East conflict.
That said, the US–Iran war began after Bitcoin had already undergone a steep correction of more than 50% from its all-time high prior to February 28.
This recent resilience could indicate that Bitcoin is in the process of forming a bottom, particularly if it continues to defend key support levels. Beyond the idea that the market had already priced in significant downside, Bitcoin’s stability during wartime may point to stronger underlying demand and a more robust market structure, driven by several supporting factors.
Institutional investors and corporations are increasing their exposure.
Institutional investors have poured more than $3 billion into spot Bitcoin ETFs from March to now, following a relatively modest $206 million outflow in February. This suggests that even after the conflict began at the end of February, net inflows stayed positive—helping support Bitcoin’s resilience as investors stick to a long-term outlook and continue building exposure.
On the corporate side, treasury heavyweight Strategy has maintained its aggressive accumulation strategy despite the geopolitical backdrop and an unrealized Q1 loss of $14.46 billion on its Bitcoin holdings. With its latest purchase, Strategy’s total holdings—now exceeding 815,000 BTC—have even surpassed those of major institutional player BlackRock.
Liquidity injection
Broader liquidity conditions have also been a key driver behind Bitcoin’s resilience, given that BTC remains highly sensitive to global liquidity cycles. Over the past six months, global M2 money supply has been on the rise. Historically, Bitcoin tends to follow this trend with a lag, as expanding liquidity often finds its way into risk assets. This backdrop of increasing global money supply helps explain—and support—Bitcoin’s recent strength.
Additionally, according to Barchart, the United States Department of the Treasury is expected to repurchase $15 billion of its own debt this week—marking the largest Treasury buyback on record. This broader backdrop of expanding liquidity, fueled by both Treasury buybacks and rising global M2, has created supportive conditions that help Bitcoin absorb war-related uncertainty more effectively than in earlier, less liquid market cycles.
Wall Street’s crypto presence keeps growing
Rising interest from major Wall Street banks is another factor underpinning Bitcoin’s resilience. Morgan Stanley launched its Bitcoin Trust (MSBT) on the New York Stock Exchange in early April, marking the first spot Bitcoin ETF introduced by a major U.S. bank. Meanwhile, Goldman Sachs has also entered the ETF race.
This expanding presence of traditional financial institutions in the crypto space strengthens the narrative that Bitcoin is gradually evolving from a purely speculative instrument into a more established asset class.
Iran considers using Bitcoin for toll payments
The Middle East conflict may also be enhancing Bitcoin’s real-world utility. Iran has reportedly proposed that shipping companies pay transit tolls in cryptocurrency for oil tankers passing through the Strait of Hormuz.
Under the plan, tanker operators would need to submit cargo details in advance for approval by Iranian authorities. Approved vessels would then pay a transit fee of roughly $1 per barrel, with payments accepted in Bitcoin, other cryptocurrencies, or the Chinese yuan. Empty vessels would be exempt.
Given Iran’s reliance on crypto to bypass U.S. sanctions, Bitcoin has already been used for import payments and trade settlement. This latest proposal signals a potentially expanding role for crypto in global commerce. If implemented, it could mark a meaningful step in adoption—especially in financially constrained regions—and may provide a near-term boost to demand, particularly as around 20% of global oil shipments pass through the Strait of Hormuz.
Technical Analysis: Is BTC bottoming out?
Bitcoin’s technical structure is starting to show constructive signals. The leading cryptocurrency gained 4.33% last week, reaching an 11-week high near $78,333, and has extended those gains by more than 5% this week. Price is այժմ approaching the key 61.8% Fibonacci retracement level around $78,490, measured from the August 2024 low (~$49,000) to the October 2025 all-time high (~$126,199).
A weekly close above this $78,490 resistance would be significant, opening the door for a move toward the 100-week Exponential Moving Average (EMA) near $82,568. Breaking and holding above that level would establish a higher high on the weekly chart—a strong signal that the broader trend may be turning bullish again.
Momentum indicators are also improving. The Relative Strength Index (RSI) sits at 46 on the weekly timeframe and is trending upward toward the neutral 50 level after rebounding from oversold conditions—suggesting that bearish pressure is fading. Meanwhile, the Moving Average Convergence Divergence (MACD) has just printed a bullish crossover, with a positive histogram reinforcing the case for continued upside.
Taken together, these signals point to a market that may be in the early stages of forming a bottom—though confirmation will depend on whether key resistance levels are decisively broken.
Bitcoin still behaves primarily as a risk asset, and its role as an “inflation hedge” or “digital gold” remains premature—at least until the market matures further. Rather than acting as a clear safe haven during geopolitical turmoil, its recent resilience likely reflects a convergence of factors: capital inflows, improving liquidity conditions, and growing adoption, alongside the aftermath of a deep correction and deleveraging phase.
While headlines will continue to influence Bitcoin—as they do all asset classes—the market, for now, appears to be driven more by liquidity dynamics than by geopolitical shocks.
Bitcoin climbed above $78,000 on Wednesday, supported by President Donald Trump’s extension of the Iran ceasefire and stronger institutional buying, lifting overall market sentiment.
The leading cryptocurrency was last up 2.7% at $78,018.4 around 02:49 ET (06:49 GMT), after touching a 24-hour high of $78,430.4. It was also on track for a third consecutive day of gains.
Trump announces an extension of the ceasefire with Iran
U.S. President Donald Trump announced an open-ended extension of the Iran ceasefire, noting the decision was partly influenced by requests from Pakistani officials seeking additional time for peace talks in Islamabad.
The extension remains unilateral, however, leaving uncertainty over whether Tehran will formally agree.
While the ceasefire is in place, tensions persist. The U.S. continues its naval blockade of Iranian ports, and disruptions in the Strait of Hormuz have yet to fully subside.
Even so, markets viewed the move as a sign of near-term de-escalation. Oil prices declined, and the U.S. dollar weakened after recent gains.
Analysts note that Bitcoin is increasingly behaving as both a risk asset and a hedge against geopolitical tensions, attracting inflows as investors balance easing risks with ongoing uncertainty.
Strategy snapped up roughly $2.5 billion worth of Bitcoin last week, marking one of its largest purchases to date.
Strategy snapped up $2.5 billion in Bitcoin last week, reinforcing market momentum amid a fresh wave of institutional demand.
The firm, Strategy Inc (NASDAQ:MSTR), revealed it purchased 34,164 BTC in the week ending April 19 at an average price of roughly $74,395 per coin. This brings its total holdings to around 815,000 bitcoins, acquired at a cumulative cost of approximately $61.6 billion—marking one of the largest buys in its history.
To finance the acquisition, Strategy leaned heavily on capital markets, raising about $2.18 billion through the sale of high-yield preferred shares and another $366 million via common stock issuance. These preferred instruments, offering yields near 11.5%, have become a central funding mechanism, enabling the company to expand its Bitcoin position while aiming to minimize shareholder dilution.
In the broader crypto market, most altcoins also moved higher on Wednesday, though gains remained modest. Ethereum, the second-largest cryptocurrency, climbed 3.2% to $2,391.53, while XRP added 1.3% to $1.46. Solana, Cardano, and Polygon each rose around 2.5%, and Dogecoin gained 2.3% among meme tokens.
Bitcoin, the largest cryptocurrency by market value, fell 2.02% to trade at 75,064.2 as of 5:46 ET (10:46 GMT), declining after Iran shut the Strait of Hormuz, which triggered a broader risk-off mood across global markets.
Often described as “digital gold,” the asset has struggled to retain its safe-haven status amid the uncertainty, contributing to a wider crypto sell-off as investors move to reevaluate their portfolio exposure.
Geopolitical pressures and institutional flows
Bitcoin’s recent drop is closely tied to escalating tensions in the Middle East. With the renewed closure of the Strait of Hormuz and rising concerns about a broader regional conflict, global markets have turned cautious, prompting investors to shift capital away from riskier, more volatile assets.
Even so, institutional activity tells a more layered story. Bitcoin ETFs have recently attracted $663.91 million in inflows, lifting total net assets in the segment beyond the $100 billion mark.
At the same time, Ether ETFs recorded $127.49 million in inflows, extending their streak to seven consecutive days and pointing to steady growth in institutional demand.
Wider fund participation also remains visible, as XRP saw $13.74 million in inflows while Solana drew $13.04 million, highlighting continued interest across a range of crypto ETF products.
Industry developments deepen the downturn
Beyond the immediate geopolitical shock, underlying structural challenges within the digital asset space have further weighed on investor sentiment.
Recent reports indicate continued regulatory uncertainty surrounding decentralized finance (DeFi) protocols, dampening enthusiasm across ecosystems like Ethereum and Solana. This lack of clarity has created a feedback loop of caution, indirectly pressuring Bitcoin as investors adopt a more defensive, wait-and-see approach.
The cautious mood is reinforced by thin market conditions. Data shows a noticeable decline in stablecoin liquidity across major centralized exchanges, reducing depth in order books. In such an environment, price swings tend to be more pronounced, leaving Bitcoin increasingly exposed to sharp drops and forced liquidations during periods of heightened stress.
Adding to the pressure, persistent inflation concerns and evolving interest rate expectations continue to weigh on risk assets. With yields on safer instruments remaining relatively high, the opportunity cost of holding non-yielding assets like Bitcoin increases, discouraging the kind of aggressive accumulation that previously supported its upward momentum.
Crypto prices today: altcoins decline after Strait closure
Altcoins also moved lower following Iran’s announcement, mirroring the broader market downturn triggered by renewed geopolitical tensions.
Ethereum, the second-largest cryptocurrency, dropped 2.89% to $2,307.42, while XRP, ranked third, fell 2.12% to $1.4198.
Meanwhile, Solana and Cardano recorded steeper losses of 3.40% and 3.54%, respectively.
Among meme coins, Dogecoin slid 3.40%, reflecting widespread weakness across the altcoin segment.
Bitcoin pulled back slightly on Tuesday, falling below $75,000 after briefly reaching a one-month high, but remained broadly higher as optimism over potential U.S.-Iran ceasefire talks lifted risk sentiment. A better-than-expected U.S. producer inflation report also supported the positive mood.
As of 17:35 ET (21:35 GMT), the leading cryptocurrency was up 1.2% at $74,127.8, after earlier climbing to $76,043.7 during the session.
Bitcoin climbs as a broader risk-on sentiment lifts markets.
Bitcoin climbed alongside a broader risk-on trend, mirroring a rebound in global markets as equities posted solid gains. S&P 500 rose over 1%, while Nasdaq Composite advanced as investors continued to favor technology stocks amid optimism around artificial intelligence.
Crypto sentiment was further supported by falling oil prices, which dropped below $100 per barrel after recent spikes, encouraging demand for riskier assets.
Markets were also reassured by ongoing diplomatic signals between the United States and Iran, despite a lack of progress in recent talks. Reports suggested both sides are considering another round of direct negotiations to extend a fragile ceasefire. Donald Trump noted that further discussions could take place within days in Pakistan.
Meanwhile, the U.S. blockade of the Strait of Hormuz entered its second day, with United States Central Command reporting that no vessels had passed through in the first 24 hours, as restrictions targeted ships linked to Iranian ports.
U.S. producer prices increased in March, but by less than expected.
U.S. producer prices increased in March, but not as much as expected. Alongside ongoing Middle East tensions, the inflation data gave investors some reassurance after a volatile period.
The producer price index (PPI) rose 0.5% compared to the previous month and 4.0% year-on-year, according to the Bureau of Labor Statistics—both below forecasts of 1.1% and 4.6%. Core PPI, which excludes food and energy, edged up 0.1% month-on-month and 3.8% annually.
The annual headline increase was the highest since February 2023, largely driven by a sharp 8.5% jump in energy prices during the month. This trend mirrored the consumer price index data released earlier, where rising oil prices linked to the Iran conflict lifted overall inflation, while core inflation remained relatively stable.
Deutsche Börse acquires a $200 million stake in the parent company of crypto exchange Kraken.
Deutsche Boerse has invested $200 million in Payward, the parent company of crypto exchange Kraken, by purchasing existing shares. This gives the German exchange operator a 1.5% fully diluted stake in the firm.
The move strengthens a strategic partnership between the two companies first announced in December 2025, which focuses on connecting traditional financial markets with the digital asset space.
According to Deutsche Boerse, the collaboration will cover areas such as trading, custody, settlement, collateral management, and tokenized assets—aiming to provide institutional clients with smoother, more integrated access to both traditional and crypto markets.
Strategy Inc purchases 13,927 BTC using proceeds from preferred stock sales.
Strategy Inc (NASDAQ:MSTR) announced Monday that it purchased 13,927 bitcoins last week for roughly $1 billion, partly financed through the sale of preferred shares, according to a U.S. SEC filing. The company issued about 10.03 million shares of its variable-rate Series A perpetual preferred stock, generating approximately $1 billion in net proceeds. These funds were used to acquire Bitcoin at an average price of around $71,902 per coin. With this latest purchase, Strategy’s total Bitcoin holdings increased to 780,897 BTC, acquired at a combined cost of $59.02 billion.
Crypto prices today: altcoins rally, with Ethereum surging 7%.
Most altcoins trimmed earlier gains on Tuesday.
The second-largest cryptocurrency, Ethereum, rose 2.6% to $2,319.42, while third-ranked XRP gained 0.7% to $1.3604.
Solana turned lower, slipping 0.3%, whereas Cardano edged up 0.4%.
Among meme coins, Dogecoin posted a modest 0.5% increase.
Bitcoin (BitfinexUSD) is under pressure this Sunday, falling 1.80% to $71,603.9 at 05:19 EST (10:00 GMT) after high-level U.S.–Iran peace talks in Islamabad ended without a breakthrough, adding fresh geopolitical uncertainty to global markets.
The collapse of the 21-hour negotiations has pushed traditional energy prices higher, while Bitcoin remains relatively resilient, staying above key technical support levels as investors reassess its role as a potential “digital hedge” amid risks of renewed tensions in the Persian Gulf.
Geopolitical stalemate vs. digital scarcity
The departure of Vice President JD Vance from Pakistan without securing a nuclear commitment from Tehran has effectively dashed hopes for an immediate “safe passage” deal for global energy flows.
Historically, spikes in geopolitical tension have often supported Bitcoin, as it operates beyond the reach of maritime chokepoints or sovereign sanctions. Analysts suggest that with the April 8 ceasefire still fragile, the so-called “war premium” is increasingly shifting toward decentralized assets.
“Whether we make a deal or not makes no difference to me,” President Trump said after the talks, signaling a potential pivot toward rearming regional allies.
Despite the diplomatic breakdown, market data indicates that BTC has avoided a panic sell-off, implying that much of the regional risk had already been priced in following the initial strikes in March.
ETF inflows and the “institutional floor”
While macro headlines continue to dominate, Bitcoin’s internal market structure is being reinforced by a strong վերադարձ of institutional demand. Recent exchange data highlights a notable surge in net inflows into spot Bitcoin ETFs.
This trend suggests that large investors are taking advantage of geopolitical uncertainty to build positions. The presence of an “institutional floor” has helped stabilize prices, even as traditional risk assets come under pressure from rising long-term Treasury yields.
At the same time, the crypto market is benefiting from increasing regulatory clarity across Asia. Newly introduced licensing frameworks for digital asset service providers in key financial hubs are enabling fresh capital inflows, helping to offset more cautious sentiment in Western markets.
With diplomatic efforts in Islamabad now stalled, attention for the rest of the quarter is shifting toward how sustained institutional inflows will interact with declining liquid supply on exchanges—potentially setting up a supply squeeze if Middle East tensions continue.
Crypto prices today: altcoins mostly decline
The broader crypto market showed mixed performance, with most altcoins moving lower even as Bitcoin held relatively steady.
The second-largest cryptocurrency, Ether, slipped 1.27% to $2,215.02, while XRP edged down 1.28% to $1.3306.
Among other major tokens, Solana dropped 2.70%, Cardano fell 3.95%, and BNB declined 2.06% to $594.30.
In the memecoin segment, Dogecoin lost 1.84%, while $TRUMP recorded a smaller dip of 0.69%.
Bitcoin advanced on Friday as crypto markets turned cautiously optimistic ahead of potential U.S.–Iran ceasefire talks, while expectations surrounding key inflation data kept sentiment restrained.
The world’s largest cryptocurrency gained 1.6% to $72,159.1 by 02:05 ET (06:05 GMT) and was on track for a 7.3% weekly rise, supported by improving risk appetite.
Bitcoin also drew support from hopes of more favorable U.S. crypto regulation, although progress on the CLARITY Act still appeared uncertain.
Ceasefire talks between the U.S. and Iran remained in sharp focus amid mixed and conflicting signals.
The discussions, reportedly scheduled to take place in Pakistan in the coming days, follow a conditional ceasefire agreement reached earlier this week. However, tensions quickly resurfaced as Iran accused the U.S. and Israel of violating the deal and called for Lebanon to be included in any broader peace framework.
Iranian state media also denied reports that its delegates had already arrived in Pakistan, saying negotiations would remain on hold until clearer assurances regarding Lebanon were provided.
Meanwhile, Iran’s continued restriction of shipping through the Strait of Hormuz drew criticism from U.S. President Donald Trump. Tehran has also floated the idea of imposing tolls on passage through the waterway, a proposal Washington has rejected.
The two sides remain deeply divided, with Iran resisting U.S. demands to halt its nuclear program and surrender uranium stockpiles. The ongoing uncertainty over the conflict and its economic implications has weighed on risk assets in recent weeks, though crypto markets have shown relative resilience compared to other sectors.
Crypto prices today: Altcoins gain as markets await CPI data
Broader cryptocurrency prices edged higher on Friday, mirroring Bitcoin’s gains, although upside was capped by caution ahead of key U.S. consumer price index (CPI) inflation data due later in the day.
Headline CPI inflation is expected to have accelerated in March, partly driven by rising global oil and gas prices amid the Iran conflict. Stronger inflation would reduce the Federal Reserve’s incentive to cut interest rates, a development typically negative for speculative assets.
Among major tokens, Ethereum (Ether), the world’s second-largest cryptocurrency, rose 0.1% to $2,184.32, while XRP gained 0.6% to $1.3411.
Meanwhile, Solana, Cardano, and BNB traded in a narrow range, alongside memecoins such as Dogecoin and $TRUMP, which also showed little movement.
Bitcoin edged higher on Tuesday, lifted by improved sentiment across risk assets amid renewed hopes of easing tensions in the Middle East. The world’s largest cryptocurrency was also on track to post a monthly gain for March, potentially ending a five-month losing streak. By 18:04 ET (22:04 GMT), Bitcoin had climbed 2.1% to $68,197.3.
Fighting in the U.S.-Israel conflict with Iran showed little sign of slowing, as exchanges of strikes continued across the Gulf region. However, reports suggested that President Donald Trump is weighing a potential reduction in U.S. military involvement, even if the Strait of Hormuz remains blocked. While such a move could hint at partial de-escalation, ongoing disruptions to energy supply are likely to persist, raising inflation risks and keeping global monetary policy tight—conditions that typically weigh on speculative assets like cryptocurrencies. Meanwhile, Iran signaled it could be open to ending the conflict if security guarantees are provided.
Separately, researchers at Google warned that advances in quantum computing may threaten current cryptographic systems sooner than expected. They noted that future quantum machines could potentially break elliptic curve cryptography—the foundation of blockchain security—using fewer resources than previously believed, urging the crypto industry to transition toward quantum-resistant solutions before such risks materialize.
Despite volatility, Bitcoin was still heading for a modest gain in March, although it remained well below its yearly highs and was down roughly 22% year-to-date. Performance across altcoins was mixed: Ether looked set to rise nearly 7% and end a six-month losing streak, while XRP, Solana, and Cardano posted declines, with the latter seeing the steepest drop. Meme tokens also underperformed, with notable losses across the segment.
Overall, digital assets appeared to close out a turbulent quarter on a steadier footing, with total market capitalization hovering around $2.3 trillion and signs of renewed institutional inflows offering some support to the market.
Bitcoin edged higher on Monday as investors digested mixed signals from both the U.S. and Iran regarding the ongoing Middle East conflict.
The world’s largest cryptocurrency had logged a two-week losing streak by Friday, with broader risk assets under pressure since the war began.
As of 18:13 ET (22:13 GMT), Bitcoin was up 1.4% at $66,734.8.
Iran escalation in focus
Markets on Monday signaled a worsening conflict in Iran, particularly after Yemen’s Iran-backed Houthi group entered the fray by launching missiles at Israel over the weekend.
Their involvement risks opening a new front, given their ability to carry out attacks in the Red Sea.
Separately, President Donald Trump warned he could target key Iranian energy infrastructure, including Kharg Island, if Tehran fails to reach an agreement with the U.S.
Trump said Washington was engaged in “serious discussions with a new, and more reasonable, regime,” though he added that failure to strike a deal—and reopen the Strait of Hormuz—could lead to sweeping attacks on Iran’s power plants, oil fields, and desalination facilities.
Iran has denied any direct negotiations. State media reported that while messages had been relayed through intermediaries, Tehran rejected U.S. demands as “excessive” and “illogical,” citing foreign ministry spokesperson Esmaeil Baqaei.
The White House later said public statements differed significantly from private communications, maintaining that talks were still ongoing.
Meanwhile, crypto markets began the week on a steadier note. Total market capitalization rose 1% over the past 24 hours to $2.32 trillion, despite renewed concerns over Middle East tensions, according to Dessislava Ianeva of Nexo Dispatch. She noted that geopolitical developments continue to drive short-term volatility and heighten the importance of upcoming macroeconomic data.
Strategy may pause Bitcoin buying streak
Strategy (NASDAQ:MSTR), the world’s largest corporate holder of Bitcoin, may have skipped adding to its holdings last week, according to a Coindesk report.
Executive Chair Michael Saylor typically hints at upcoming purchases in a Sunday post on X, followed by a formal announcement on Monday. This time, however, his post focused on promoting Strategy’s preferred equity offerings instead.
If confirmed, the pause would break a 13-week buying streak dating back to late December, during which the company accumulated a total of 90,831 Bitcoin, Coindesk said.
Crypto prices moved higher on Monday, with altcoins following Bitcoin’s upward trend.
The second-largest cryptocurrency, Ether, gained 3.1% to $2,034.71, while XRP rose 0.8% to $1.3282. BNB, Solana, and Cardano posted increases of 1.2%, 2.6%, and 2.7%, respectively.
Among meme coins, Dogecoin edged up 1.2%, and $TRUMP jumped 2.9%.
Bitcoin declined on Friday, capping a subdued week as heightened risk aversion tied to the Iran conflict and the looming $14 billion options expiry kept traders cautious on cryptocurrencies.
The world’s largest digital asset dropped 1.9% to $68,739.5 by 02:18 ET (06:18 GMT), putting it on track for a weekly loss of about 0.3%.
Conflicting signals surrounding the U.S.-Israel conflict involving Iran dampened Bitcoin’s earlier momentum, particularly as Washington and Tehran issued mixed messages about the prospects for a ceasefire.
Bitcoin is approaching a $14 billion options expiry on Friday, with most open positions set to settle on the Deribit exchange.
Market attention is firmly on potential price volatility before and after the expiry, particularly against the backdrop of heightened uncertainty driven by the Iran conflict.
According to Bloomberg, the “maximum pain” level—where the most options would expire worthless—is around $75,000. Large institutional players may try to steer prices toward this level to minimize payouts to option holders.
However, as contracts roll off, hedging activity in the near term is expected to decline, potentially leaving Bitcoin more vulnerable to external shocks, especially geopolitical tensions in the Middle East.
Although Bitcoin initially gained following the onset of the conflict nearly a month ago, it has struggled to break past the $75,000 mark. This comes after the cryptocurrency had already fallen by as much as 50% from its late-2025 peak near $126,000.
Much of the recent upward movement may also have been driven by hedging flows ahead of the options expiry.
Crypto price today
Cryptocurrency markets broadly moved lower on Friday, weighed down by mixed signals on a possible de-escalation in the Iran conflict, although prices stayed above their weekly lows.
Ether, the second-largest digital asset, fell 2.6% to $2,066.74, while XRP declined 1.7% to $1.3628. Solana and Cardano each dropped more than 3%, with BNB down about 1%.
Among memecoins, Dogecoin slipped 0.7%, while $TRUMP lost 1.1%.
Market sentiment improved slightly after U.S. President Donald Trump extended the deadline for potential strikes on Iran’s key energy infrastructure and signaled that talks with Tehran were ongoing.
Still, Iran said it was reviewing a 15-point ceasefire proposal from Washington and dismissed the prospect of direct negotiations.
Overall, the conflict showed few clear signs of easing as it entered its fifth consecutive week.
Bitcoin ticked down on Tuesday, giving back some of the previous session’s gains as investors weighed the chances of easing tensions in the U.S.-Israel conflict with Iran. The крупнейшая cryptocurrency slipped 0.4% to $70,475.6 by late afternoon trading.
According to Arthur Azizov of B2 Ventures, markets remain highly uncertain and need time to stabilize. He noted a growing perception that traditional assets are becoming more speculative than crypto—an unsettling signal for investors.
Reports suggest potential de-escalation underway
Reports after the U.S. market close suggested possible de-escalation efforts. Israeli Channel 12 said U.S. envoy Steve Witkoff and Jared Kushner were exploring a ceasefire framework alongside a 15-point negotiation plan, while The New York Times indicated Washington had already sent a proposal to Iran. Earlier, President Donald Trump said strikes on Iran’s energy sector were being delayed following what he called productive talks. However, Iranian officials denied any negotiations, and conflicting headlines kept markets on edge, with oil prices rebounding sharply.
Investors remain concerned that prolonged high oil prices could fuel global inflation and prompt tighter monetary policy, which typically weighs on non-yielding, risk-sensitive assets like Bitcoin and gold. Still, Bitcoin has held up better than gold since the conflict began, with the latter pressured by profit-taking after hitting record highs.
Bernstein says Bitcoin has likely hit its bottom
Bernstein analysts believe Bitcoin has already bottomed and is poised to move higher. They argue the recent pullback reflects a reset in sentiment rather than weakening fundamentals, noting the absence of systemic stress seen in previous downturns. The firm also highlighted Bitcoin’s roughly 25% outperformance versus gold since late February, reinforcing its appeal as a portable, censorship-resistant asset during geopolitical uncertainty.
Bernstein maintained an “outperform” rating and a $450 price target on Strategy, describing it as a high-beta proxy for Bitcoin exposure with a resilient balance sheet. The company, chaired by Michael Saylor, holds about 3.6% of total Bitcoin supply, worth around $53.5 billion.
Across the broader crypto market, prices mostly declined alongside Bitcoin. Ethereum edged down to $2,153.02, XRP fell 1.2%, and Solana dropped 1.1%, while Cardano rose 1.7%. Among memecoins, Dogecoin gained 0.4% and $TRUMP climbed 3.3%.
Bitcoin dropped sharply on Thursday, falling below $71,000 as investors reacted to a more hawkish Federal Reserve outlook and a spike in oil prices fueled by rising Middle East tensions.
The world’s largest cryptocurrency slid 4.2% to $70,817.4 by early trading, retreating from levels above $74,000 in the previous session and nearly $76,000 earlier in the week.
Fed outlook weighs on markets
Pressure on digital assets intensified after the Federal Reserve kept interest rates unchanged but flagged ongoing inflation risks, particularly from rising energy costs. Officials cautioned that higher oil prices could slow the disinflation process and push back expected rate cuts. The Fed also raised its 2026 inflation forecast to 2.7% from 2.4%, signaling concern over persistent price pressures.
Oil prices surged past $110 per barrel on Wednesday and continued climbing in Asian trading Thursday after Iran launched attacks on energy facilities across the Middle East following a strike on its South Pars gas field.
As cryptocurrencies increasingly move in tandem with macroeconomic trends, they faced headwinds from rising bond yields and a stronger U.S. dollar driven by higher oil prices. U.S. stock markets closed lower बुधवार, while Asian equities also declined early Thursday.
Meanwhile, the Bank of Japan held rates steady and warned that developments in the Middle East conflict and oil prices could influence Japan’s inflation outlook.
Kraken delays IPO plans
Crypto exchange Kraken has reportedly paused its plans for a multibillion-dollar IPO due to unfavorable market conditions, according to CoinDesk. The firm, which had confidentially filed a draft S-1 with the U.S. SEC in November, is now expected to delay its listing until market sentiment improves.
The decision reflects a broader downturn in crypto markets since late 2025, with weaker prices and trading volumes dampening valuations and investor demand. Kraken was last valued at $20 billion after raising $800 million.
Altcoins extend losses
Most altcoins also declined on Thursday. Ethereum, the second-largest cryptocurrency, fell 6% to $2,193.41, while XRP dropped 3.5% to $1.47. Solana and Polygon each lost about 4%, and Cardano slid 6%. Among meme coins, Dogecoin fell 5%.
Bitcoin climbed above $74,000 on Monday, reaching its highest level in roughly six weeks as a wave of short liquidations supported the rally, although investors stayed cautious amid rising geopolitical tensions in the Middle East.
The largest cryptocurrency was last up 3.4% at $73,892.4 by 02:21 ET (06:21 GMT), after touching an intraday high of $74,336.9 earlier in the session.
Bitcoin gained about 6% last week even as global equity markets declined, with surging oil prices fueling concerns about inflation.
Crypto rallies on short liquidations
Cryptocurrency markets posted broad gains as traders who had bet on further price declines rushed to close their short positions.
Data from CoinGlass showed about $344 million in crypto liquidations over the past 24 hours, with short positions making up roughly 83% of the total.
Liquidations occur when leveraged traders are forced to close their positions after prices move against them, often intensifying price swings.
Despite the rebound, sentiment remained cautious as the conflict in the Middle East entered its third week, raising worries about global energy supply and inflation pressures.
Donald Trump, the U.S. president, has urged allies to help safeguard the Strait of Hormuz, a critical route for global oil shipments, as hostilities in the region continue.
Oil stays above $100 amid Iran war concerns
Reports indicated that despite repeated statements from U.S. officials claiming Iran’s military capabilities had been destroyed, drone attacks continued in Gulf states on Monday.
Oil prices remained supported above $100 per barrel amid fears of potential supply disruptions around the Strait of Hormuz, a key shipping route for global crude exports.
U.S. stock futures moved slightly higher in Asian trading on Monday as investors looked ahead to the upcoming policy meeting of the Federal Reserve, where policymakers are widely expected to keep interest rates unchanged while evaluating inflation risks.
Analysts noted that geopolitical uncertainty and broader macroeconomic risks could keep cryptocurrency markets volatile in the near term, even as short covering supports prices.
Stablecoins are transitioning from a niche cryptocurrency instrument into a macro-relevant component of the financial system, connecting global payment activity with U.S. dollar liquidity and short-term Treasury markets, according to a report from BCA Research.
The firm noted that the rapid growth of stablecoins could gradually alter parts of the global financial landscape as their use expands beyond crypto trading into areas such as payments, remittances, and tokenized assets.
Stablecoins are blockchain-based digital tokens designed to maintain a stable value by referencing another asset, most commonly the U.S. dollar. Their circulation has increased significantly in recent years, with total supply now exceeding $300 billion, compared with about $30 billion in 2020.
Because issuers must hold reserves to back the tokens they create, those funds are typically placed in highly liquid and low-risk assets such as U.S. Treasury bills, reverse repurchase agreements, and bank deposits. As the market expands, stablecoin issuers are becoming increasingly important marginal buyers of short-term U.S. government debt.
According to BCA, this development establishes a new channel linking worldwide payment demand to the U.S. Treasury market. Rising stablecoin issuance could boost demand for Treasury bills and potentially influence short-term interest rates, especially if new inflows represent additional capital rather than funds shifting from existing investors.
Adoption is also spreading geographically, particularly in emerging economies dealing with inflation, currency depreciation, or capital controls. In such environments, digital dollar tokens can function as a store of value and provide access to dollar-based financial services outside traditional banking channels.
This dynamic may further strengthen global demand for the U.S. dollar while creating policy challenges for governments where the growing use of digital dollars accelerates currency substitution and capital outflows.
Stablecoins may also pose competitive pressure for banks. The report highlighted that expanding digital dollar balances could divert funds from traditional bank deposits—especially non-interest-bearing transaction accounts—forcing banks to compete more aggressively to attract funding.
Despite their rapid growth, BCA emphasized that stablecoins still account for a relatively small portion of global payments and financial assets. However, continued expansion, clearer regulation, and broader institutional adoption could significantly increase their economic influence over the next decade.
Bitcoin climbed on Friday, marking its fifth consecutive day of gains as expectations for more supportive cryptocurrency regulation in the United States helped counter lingering worries surrounding the Iran conflict.
The world’s largest cryptocurrency rose 1.4% to $71,113.1 by 18:00 ET (22:00 GMT).
Bitcoin on track for weekly gains amid regulatory optimism
Bitcoin was heading for a weekly advance of nearly 6%, outperforming broader risk-sensitive assets despite the uncertainty stemming from the ongoing Iran war.
The rally in the leading digital asset was largely fueled by an announcement on Wednesday that the U.S. Securities and Exchange Commission and the Commodity Futures Trading Commission will cooperate to develop a clearer and more comprehensive regulatory framework for U.S. crypto markets.
Through the agreement, the two agencies signaled plans to jointly craft a federal policy that would introduce a “fit-for-purpose regulatory framework for crypto assets and other emerging technologies.”
The initiative, known as the Joint Harmonization Initiative, seeks to establish structured data-sharing practices, simplify reporting requirements, and reduce overlapping enforcement actions between the two regulators.
Although the arrangement is non-binding, the announcement boosted investor confidence that U.S. authorities may move toward clearer and more coordinated regulation for the cryptocurrency sector.
The initiative also aligns with promises by Donald Trump to provide greater regulatory clarity for the crypto industry, with the administration appointing leaders at both agencies viewed as supportive of digital assets.
Bitcoin has climbed about 6.1% since the United States and Israel launched attacks on Iran in late February. Meanwhile, the second-largest cryptocurrency, Ether, has gained roughly 6.2% during the same period.
According to David Morrison, senior market analyst at Trade Nation, both Bitcoin and Ether have demonstrated notable resilience despite growing negative sentiment toward risk assets.
He noted that the two cryptocurrencies have held up well even as global equities—particularly technology stocks—faced significant selling pressure. At the same time, Bitcoin has been rising alongside the U.S. dollar and crude oil, while traditional safe-haven metals such as gold and silver have struggled.
Morrison added that the rebound may partly reflect technical factors. After reaching an all-time high above $126,000 six months ago, Bitcoin lost more than half of its value, dropping to around $60,000 in early February. That sharp correction left the market technically positioned for renewed buying interest. Whether the recovery proves temporary or develops into a more sustained trend remains uncertain.
Despite the recent gains, broader investor appetite for risk remains subdued, as equity markets have experienced sharp declines amid concerns about the economic consequences of the U.S.–Israel conflict with Iran.
One major concern is the war’s potential inflationary impact. Prolonged disruptions to oil supply could push crude prices higher and contribute to global inflation. Such pressures may force major central banks to adopt a more hawkish policy stance, which could weigh on cryptocurrencies and other speculative assets.
Iliya Kalchev, analyst at Nexo Dispatch, said Bitcoin’s rebound from the mid-$60,000 range to above $72,000 suggests the market has stabilized after a brief period of deleveraging. Open interest has recovered to 687,200 BTC—its highest level since late February—while funding rates and trading volume indicators have turned positive. Meanwhile, implied volatility has dropped to a two-week low of 55%.
Inflation data meets expectations
U.S. inflation figures released earlier showed price pressures broadly in line with forecasts but still above the level preferred by the Federal Reserve.
The Personal Consumption Expenditures (PCE) price index, the Fed’s preferred inflation gauge, rose 0.4% month-on-month in January, matching expectations. On an annual basis, core PCE increased 3.1%, also in line with estimates and still well above the central bank’s 2% target.
The Fed closely monitors the core PCE index because it reflects a broader range of consumer spending than the Consumer Price Index and captures shifts in purchasing behavior.
Earlier data from the U.S. Department of Labor showed that February’s headline CPI rose 2.4% year-on-year, while core CPI increased 2.5%—the lowest reading since March 2021, though still above the Fed’s target.
The Federal Reserve is scheduled to announce its next interest-rate decision on Wednesday, with markets currently pricing in an almost certain probability that the Federal Open Market Committee will keep rates unchanged.
Altcoins mostly higher, $TRUMP token surges
The broader cryptocurrency market also moved higher on Friday in line with Bitcoin.
Ether gained 1.3% to $2,089.11, while XRP rose 1.2% to $1.3950. BNB, Cardano, and Solana increased 0.6%, 0.8%, and 2.2%, respectively.
Among memecoins, Dogecoin added 1.4%, while the $TRUMP token surged 30%. The rally followed news of an exclusive cryptocurrency and business conference at Mar-a-Lago, where President Donald Trump is expected to deliver a keynote speech, prompting traders to accumulate the token ahead of an April 25 gala luncheon.
Despite the recent rebound, most altcoins—like Bitcoin—remain significantly below their highs from recent months, with overall sentiment toward the crypto sector still fragile.
Bitcoin rebounded above the $70,000 mark during Asian trading on Tuesday as risk appetite improved after Donald Trump said the ongoing U.S.–Israel conflict with Iran could soon come to an end.
The world’s largest cryptocurrency was last up 3.4% at $70,201.3 as of 01:02 ET (05:02 GMT), after earlier rising to an intraday high of $70,558.4.
Bitcoin had briefly dropped to around $65,000 over the previous 24 hours as investors moved away from riskier assets amid a sharp surge in oil prices, which heightened concerns over global inflation.
Risk appetite improves after Donald Trump signals Iran war may soon end.
Market sentiment improved after Donald Trump said the war involving Iran could end soon, helping ease tensions in financial markets that had been unsettled by fears of a prolonged regional conflict.
Trump said the situation could ultimately be resolved, although he cautioned that it was unlikely to conclude this week. He also warned that the United States would respond “20 times harder” if Iran attempted to block the strategically critical Strait of Hormuz, a vital route for global oil shipments.
Oil prices fell to around $90 per barrel on Tuesday after surging close to $120 a barrel on Monday. The pullback helped ease worries about a sharp spike in global inflation that had weighed on markets earlier in the week.
Asian stock markets rebounded on Tuesday, with major regional benchmarks recovering part of the heavy losses recorded in the previous session after Monday’s sharp selloff. The improved mood followed gains on Wall Street overnight.
Cryptocurrency markets also moved higher in line with the broader recovery in risk appetite. Still, traders remain cautious as developments in the Middle East continue to influence commodity prices and global market sentiment.
Investors are now turning their attention to upcoming U.S. inflation data, including the January consumer price index due on Wednesday and the February personal consumption expenditures price index— the preferred inflation gauge of the Federal Reserve — scheduled for release on Thursday.
Crypto prices today: Altcoins gain as markets trade within a narrow range.
Most altcoins posted gains on Tuesday, although trading remained within relatively tight ranges.
Ethereum, the world’s No. 2 cryptocurrency, rose 1.8% to $2,046.92. XRP, ranked third by market capitalization, advanced 2.3% to $1.38.
Solana climbed 3%, while Cardano gained 1.2%. Polygon was largely unchanged. Among meme tokens, Dogecoin edged up 0.6%.
Bitcoin rebounded on Monday, recovering from losses triggered by U.S. strikes on Iran over the weekend. The cryptocurrency’s advance mirrored a broader recovery in equity markets.
The world’s largest digital asset was up 5.7% at $69,428.4 as of 16:40 ET (21:40 GMT).
Bitcoin rebounds after weekend selloff
Bitcoin had dropped sharply after coordinated U.S. and Israeli military operations in Iran reportedly resulted in the death of Supreme Leader Ayatollah Ali Khamenei, marking one of the most severe regional escalations in recent years.
Iran responded with several waves of missile attacks targeting Israeli and U.S. military facilities.
Following the initial strikes, Bitcoin tumbled to around $63,000 before stabilizing and beginning to recover.
According to Dessislava Ianeva, analyst at Nexo Dispatch, Bitcoin held relatively steady as markets evaluated the evolving U.S.–Iran situation. While prediction markets remain split on the likelihood of further escalation, the limited price reaction indicates investors currently see the conflict as a contained, short-term risk rather than the beginning of a sustained downturn.
President Donald Trump stated Monday that the military operation had four key goals: dismantling Iran’s missile capabilities, destroying its navy, preventing the country from acquiring nuclear weapons, and stopping Tehran from supporting and directing terrorist activities.
“We’re already well ahead of schedule, but whatever time is required, that’s fine. We’ll do whatever it takes,” Trump said, adding that although initial projections suggested four to five weeks, the U.S. has the capacity to extend operations significantly if necessary.
Strategy adds $204 million in Bitcoin
Michael Saylor’s company Strategy expanded its Bitcoin holdings last week, purchasing 3,015 BTC valued at approximately $204.1 million, at an average price of about $67,700 per coin.
Following the acquisition, Strategy’s total Bitcoin holdings increased to 720,737 BTC, accumulated at a total cost of roughly $54.77 billion — averaging about $75,985 per Bitcoin.
Strategy remains the largest publicly traded corporate holder of Bitcoin, having steadily built one of the most substantial corporate crypto treasuries.
Altcoins track Bitcoin higher
Most major altcoins also moved higher alongside Bitcoin.
Ethereum, the second-largest cryptocurrency, climbed 6% to $2,045.01. XRP gained 2.9% to $1.3936, while Solana and Cardano rose 5.7% and 2.2%, respectively.
Bitcoin declined on Friday, halting a recovery from its midweek lows as investor risk appetite stayed weak. The world’s largest cryptocurrency is now on track for a fifth straight month of significant losses.
The broader crypto market moved largely in line with Bitcoin and is also poised for steep losses in February, as both retail and institutional investors continued to avoid the sector.
By 00:48 ET (05:48 GMT), Bitcoin was down nearly 1% at $67,788.0.
Bitcoin on track for fifth straight monthly decline
Bitcoin was down nearly 14% in February, as the risk-off sentiment in the crypto market showed little sign of easing throughout the month.
Rising geopolitical tensions worldwide, uncertainty surrounding major global economies, and concerns over further disruptions from U.S. trade tariffs kept investors cautious and away from speculative assets like cryptocurrencies.
The digital asset dropped as much as 50% from its October record high earlier this month, though it has since staged a modest recovery from those lows.
Bitcoin has remained in a sustained downtrend since October, with purchases by major corporate holder Strategy doing little to stem the losses.
Strategy has also reportedly slowed its pace of Bitcoin acquisitions in recent months, amid mounting concerns that continued price declines could force the company to sell part of its holdings to service its debt.
MARA Holdings jumps as AI deal eclipses weak Q4 results
Shares of MARA Holdings — previously known as Marathon Digital (NASDAQ: MARA) — surged Thursday evening after the Bitcoin mining company revealed a partnership with Starwood Capital to repurpose several of its mining facilities into artificial intelligence data centers. The stock climbed as much as 17% in after-hours trading.
The announcement helped eclipse a steep $1.7 billion loss in the fourth quarter, driven by an extended slump in Bitcoin prices that severely pressured the firm’s mining profitability. Revenue also came in below expectations.
Amid continued weakness in Bitcoin and growing investor enthusiasm around AI, MARA has recently been shifting strategy, aiming to redeploy its computing infrastructure toward AI data center operations rather than focusing solely on cryptocurrency mining.
Crypto prices today: Altcoin recovery fades, February losses loom
Crypto markets retreated on Friday, giving back much of this week’s brief rebound, with most tokens on track to post steep declines for February.
The world’s second-largest cryptocurrency, Ethereum, slipped 1.2% to $2,038.21 and was heading for a monthly drop of nearly 17%. The token faced additional pressure after co-founder Vitalik Buterin sold more of his holdings, reinforcing cautious sentiment across the market.
XRP fell 2.3% and was poised to lose around 15% in February, while BNB held steady on Friday but remained down close to 20% for the month.
Solana was also nursing losses of roughly 17% in February, whereas Cardano traded largely unchanged. In the meme coin segment, Dogecoin declined 5.4% for the month, while Official Trump tumbled about 20% over the same period.
Bitcoin’s latest decline is unfolding amid mounting macroeconomic headwinds and crypto-specific pressures, fueling fears that the downtrend could deepen, with some analysts eyeing a potential floor near $45,000.
Trump’s 15% Global Tariff Weighs on BTC
On Saturday, February 21, US President Donald Trump unveiled a 15% blanket tariff on imports, jolting global financial markets — cryptocurrencies included. The move followed a decision by the US Supreme Court to overturn his earlier sweeping tariff measures. The revised levy, initially proposed at 10% before being lifted to 15%, officially comes into force today, February 24, 2026.
Activated under Section 122 of the Trade Act of 1974, the new tariff covers the majority of imported goods for an initial 150-day period, with any extension subject to congressional approval. Although intended to narrow trade imbalances, the measure has heightened economic uncertainty, triggering a widespread retreat from risk-sensitive assets.
Within the crypto market, the development has reinforced a risk-off mood, as investors rotate out of volatile positions into safer havens. Bitcoin holders are increasingly realizing losses, with on-chain figures indicating more than $2.3 billion in realized losses over the past week.
Crypto analyst IT Tech described the move as one of the most significant capitulation phases in Bitcoin’s history, comparing it to the 2021 market crash, the 2022 Luna/FTX collapse, and the mid-2024 correction. In a post on X, he noted that the scale of losses ranks among the top three to five worst drawdowns ever recorded, adding that only a few moments in Bitcoin’s history have witnessed such intense capitulation.
The reaction reflects mounting concerns that higher import costs could reignite inflationary pressures, potentially forcing the Federal Reserve to delay rate cuts and keeping financial conditions tighter for longer.
Markets sold off swiftly following the announcement, with Bitcoin sliding intraday to below the $63,000 mark.
Spot Bitcoin ETFs Extend Outflow Streak to Five Weeks
Adding to the tariff-driven volatility, U.S.-listed spot Bitcoin ETFs have now recorded five consecutive weeks of net outflows — the longest stretch of withdrawals since February 2025.
Data from SoSoValue shows that nearly $3.8 billion has exited these funds over the five-week period, including $316 million in redemptions last week alone.
BlackRock’s iShares Bitcoin Trust (IBIT) accounted for the largest share of the withdrawals, losing roughly $2.1 billion during the streak. Fidelity Investments’ Fidelity Wise Origin Bitcoin Fund (FBTC) and several other products also saw notable outflows.
The sharp reversal from the strong inflows seen in late 2024 highlights a cooling in institutional appetite, as portfolio managers trim crypto exposure amid heightened macro uncertainty and broader market turbulence.
The persistent ETF withdrawals are intensifying sell-side pressure on Bitcoin, as fund managers are forced to offload underlying BTC holdings to satisfy investor redemptions.
With total net outflows reaching $4.5 billion so far in 2026, much of the earlier inflow momentum has been erased. Analysts describe the environment as a “risk-off stress test,” where macro headwinds — including tariffs and geopolitical tensions — are discouraging fresh allocations into crypto.
Sentiment indicators reflect the strain. The Crypto Fear & Greed Index has plunged to one of its most extreme fear readings on record, reinforcing the ongoing wave of liquidation. Unless ETF flows stabilize or reverse, downside momentum may continue, particularly if institutional distribution remains dominant.
Bear Pennant Signals $45K Target for Bitcoin
From a technical perspective, Bitcoin’s chart structure remains bearish, with a well-defined bear pennant forming on the daily timeframe.
A bear pennant is a continuation pattern that follows a steep decline (the flagpole), then consolidates within a tightening symmetrical triangle before typically breaking lower.
The BTC/USD pair fell below a major support level at $80,117 — its November 2025 low — and slid to $60,000 on February 6, forming the flagpole. A rebound toward $72,000 followed, before price retreated again to around $63,100.
The pattern confirmed on Monday when Bitcoin broke beneath the pennant’s lower trendline near $67,000. Based on the measured-move technique — projecting the height of the flagpole from the breakout point — the downside target falls in the $45,000–$50,000 range.
A drop toward $45,000 would imply roughly a 28% decline from current levels, underscoring the risk of further capitulation if macro and flow dynamics fail to improve.
The bearish outlook is reinforced by strengthening downside momentum, with the RSI sliding from overbought territory near 70 on January 15 to around 29 currently — signaling growing selling pressure and near-oversold conditions.
Bitcoin continues to trade below key moving averages, keeping the broader technical structure fragile. A decisive break beneath the $60,000 threshold could intensify losses, opening the door toward the $52,450 realized price level — a historically significant support area.
On the other hand, a sustained move above $72,700 would invalidate the bear pennant setup and could shift momentum back in favor of the bulls, paving the way for a broader recovery.
Bitcoin fell again on Tuesday, deepening its recent slide and now trading roughly 50% below its October record high, as uncertainty surrounding U.S. tariff policy dampened risk appetite for digital assets.
The world’s largest cryptocurrency slipped 0.9% to $64,169.6 by 17:35 ET (22:35 GMT), after touching an intraday low of $62,650.1.
Broader crypto markets also remained under pressure, with both institutional and retail investors continuing to reduce exposure. Escalating geopolitical tensions involving Iran, along with an AI-driven selloff on Wall Street, further weighed on sentiment.
Bitcoin down 50% from peak
With Tuesday’s losses, Bitcoin is now trading about half below its early-October all-time high of $126,186.
The cryptocurrency has been in a sustained downturn since that peak, as fresh U.S. regulatory measures and ongoing purchases by major corporate holder Strategy failed to meaningfully support prices.
On Monday, Strategy revealed it had acquired an additional 592 Bitcoin. However, the firm is currently facing significant unrealized losses, as Bitcoin trades below its reported average purchase price of $76,020.
On-chain data from CryptoQuant and Coinglass indicated that large holders—commonly known as “whales”—continued transferring substantial amounts of Bitcoin to exchanges, suggesting further selling pressure.
Meanwhile, major buyers appear scarce. Data from Glassnode showed institutional investors recorded a fifth straight week of net outflows from U.S. spot Bitcoin ETFs as of Monday.
Iliya Kalchev of Nexo Dispatch noted that U.S. spot Bitcoin ETFs saw around $203 million in net outflows on Monday alone. At the same time, derivatives markets still show demand for downside hedging, while long-term holders have not signaled broad capitulation—leaving Bitcoin in what he described as a fragile balance between visible pressure and underlying structural conviction.
He highlighted the $60,000–$72,000 range as the key near-term zone. If ETF flows stabilize and macro volatility subsides, the range could form a base. But if outflows continue, focus may shift toward the realized price area near $55,000 as the next major reference point.
Tariff uncertainty adds pressure
Bitcoin’s latest weakness was largely driven by renewed uncertainty over U.S. trade policy after the Supreme Court struck down much of President Donald Trump’s tariff framework.
In response, Trump announced new universal tariffs of 15% under a different legal authority, though the initial rate implemented at midnight Tuesday was 10%. The president now faces additional legal hurdles in expanding tariffs but has shown little intention of retreating from his trade agenda, even warning that countries seeking to renegotiate trade deals could face higher duties.
Although cryptocurrencies are not directly tied to trade flows, they are highly sensitive to shifts in global risk sentiment. The uncertainty surrounding U.S. tariffs has triggered broader risk aversion across financial markets, spilling over into digital assets.
Altcoins follow Bitcoin lower
Most altcoins tracked Bitcoin’s decline, with the broader market showing little sign of relief from the ongoing downturn.
Ethereum slipped 0.1% to $1,857.78, hovering near early-February lows. XRP and BNB fell 0.2% and 1.9%, respectively, while Cardano declined 1.4%. Solana bucked the trend, rising 0.9%.
Among meme tokens, Dogecoin dropped 1.1%, while TRUMP gained 1.3%.
Bitcoin falls beneath the lower boundary of its consolidation range on Monday, and a decisive close below this level could open the door to a more pronounced correction.
Ethereum drops under $1,900, marking a continuation of its six-week decline.
XRP dips below $1.40, unable to hold support at the lower edge of its trendline channel.
Bitcoin (BTC), Ethereum (ETH), and Ripple (XRP) continue to weaken on Monday after posting modest losses last week. BTC has slipped beneath the $65,000 consolidation floor, while ETH has fallen under $1,900, both marking a sixth consecutive week of declines. Meanwhile, XRP drops below $1.40, failing to hold support at its lower trendline — collectively signaling the risk of a deeper correction across the top three cryptocurrencies.
Bitcoin breaks below consolidation support
Bitcoin had been trading within a sideways range between $65,729 and $71,746 since February 7. On Monday, BTC moved below the lower boundary of this range, changing hands near $64,700.
A confirmed daily close beneath $65,729 would strengthen the bearish case and could open the path toward the next major support around $60,000.
On the daily chart, the RSI stands at 31, hovering close to oversold territory and reflecting strong downside momentum. Meanwhile, the MACD lines are tightening, suggesting growing indecision in the market.
BTC/USDT
However, if BTC manages to reclaim and hold above the $65,729 level, a rebound toward the upper boundary of the range at $71,746 remains possible.
Ethereum extends its correction
Ethereum continued to edge lower last week, prolonging its slide that began in mid-January. As of Monday, ETH is down 4.77%, trading around $1,864.
A daily close beneath the lower consolidation boundary at $1,747 would reinforce the bearish outlook and could drive prices toward the next key support at $1,669.
Similar to Bitcoin, Ethereum’s RSI points to strengthening downside momentum, while the MACD lines are narrowing, reflecting growing uncertainty among market participants.
ETH/USDT
On the flip side, a recovery from current levels could see ETH rebound toward the upper end of its consolidation range near $2,149.
XRP deepens its pullback after breaking below key lower trendline support.
XRP is hovering below $1.40 on Monday after slipping beneath the lower boundary of a falling wedge pattern.
Should the pullback persist, the token may slide further toward the weekly support around $1.30.
Similar to Bitcoin and Ethereum, XRP’s RSI points to building bearish pressure, while the MACD lines are tightening, signaling trader uncertainty.
XRP/USDT
On the other hand, if price manages to reclaim and hold the lower trendline as support, a rebound toward the psychological $1.50 level could follow.
Cryptocurrency markets moved within a tight range late in the week as traders remained cautious ahead of important U.S. inflation and growth releases. According to Nexo analyst Iliya Kalchev, broader macro uncertainty continues to guide investor sentiment.
Bitcoin held just above the $68,000 mark, while Ethereum struggled to push past $2,000, signaling selective positioning rather than a broad return to risk appetite. A more guarded macro tone has emerged in recent days, with hawkish cues from the Federal Reserve’s January meeting minutes pressuring risk assets and strengthening the view that interest rate cuts may come later than previously anticipated.
Geopolitical concerns have further shaped market behavior. Heightened tensions involving the U.S. and Iran have driven demand for traditional safe havens such as the U.S. dollar and gold, while capping gains in liquidity-driven assets like cryptocurrencies.
Kalchev highlighted that U.S.-listed Bitcoin ETFs posted around $165 million in net outflows, and Ethereum ETFs saw roughly $130 million withdrawn. These flows reflect a broader sense of institutional caution as investors recalibrate exposure amid persistent macro volatility.
Bitcoin remains in a consolidation phase following its early-February pullback, even as underlying network metrics improve. Mining difficulty has risen notably, and hashrate levels have recovered, pointing to structural strength despite muted price action. Still, analysts note that the asset remains highly responsive to macro signals—particularly inflation data that could influence Federal Reserve policy expectations.
Outside of crypto, financial markets have displayed uneven risk appetite. Gold is trading near record highs, and the dollar is on course for a strong weekly advance as investors hedge against geopolitical instability and interest rate uncertainty.
Looking ahead, market participants are closely watching upcoming U.S. Core PCE inflation data and GDP figures. These releases could determine whether digital assets break out of their current consolidation range or continue moving sideways. While regulatory progress on stablecoin legislation may serve as a longer-term structural driver, Kalchev emphasized that near-term price movements will likely remain tied to macro developments and investor positioning.
Sui remains under pressure near $0.96 as its technical outlook continues to weaken. The upcoming launch of the Grayscale Sui Staking ETF on Wednesday will give investors exposure to the Sui Network’s native token. However, subdued retail participation — with futures Open Interest hovering just above $500 million — could restrain any meaningful breakout attempt.
Sui (SUI) has extended its decline for a second straight session, trading around $0.95 at the time of writing on Wednesday. The Layer-1 token has dropped more than 16% in February and is down roughly 34% year-to-date, mirroring the broader bearish tone across the crypto market.
Technically, Sui risks prolonging its downtrend amid weak retail engagement. While support at $0.87 remains intact for now, a decisive break below this level could open the door for a pullback toward the $0.79 demand zone.
Grayscale’s Sui Staking ETF begins trading
Grayscale Investments has confirmed the launch of its Sui Staking Exchange-Traded Fund (ETF), set to start trading Wednesday. The fund is listed on NYSE Arca under the ticker GSUI, following the conversion of the former Grayscale Sui Trust. The ETF is expected to hold SUI tokens and incorporate staking.
According to Grayscale, while purchasing shares does not constitute direct ownership of SUI, the product is structured to offer a cost-efficient and accessible way for investors to gain exposure to the token.
The Bank of New York Mellon will act as the trust’s transfer agent and administrator. Coinbase, Inc. will serve as prime broker, while Coinbase Custody Trust Company will function as custodian.
Investors can purchase shares only in creation blocks of 10,000 units or more.
Despite the ETF debut, retail demand for Sui remains muted. Futures Open Interest has slipped to $512 million on Wednesday from $554 million on Sunday, signaling limited appetite for new positions. The stagnation suggests traders remain unconvinced about the token’s ability to sustain a meaningful recovery, opting instead to scale back exposure.
Technical outlook: Sui’s downtrend remains intact
Sui is trading around $0.95, still capped below the declining 50-day Exponential Moving Average (EMA) at $1.28, maintaining a bearish medium-term outlook. The 100-day EMA at $1.58 and the 200-day EMA at $2.02 are also trending lower, continuing to limit recovery attempts.
On the daily chart, the Relative Strength Index (RSI) sits at 36, below the neutral 50 level, signaling persistent weakness. A sustained pickup in buying pressure could help improve momentum. However, if the RSI drifts further into oversold territory, the decline may accelerate toward support near $0.78 — in line with the February 6 low.
A decisive break above descending trendline resistance would create scope for a move toward the 100-day EMA at $1.58. Conversely, failure to extend any rebound would leave the broader downtrend firmly in control.
Meanwhile, the Moving Average Convergence Divergence (MACD) histogram has turned positive and is gradually expanding, showing the MACD line above the signal line near the zero threshold — an early sign of strengthening momentum. The Parabolic SAR, positioned at $0.86 below the current price, also suggests a tentative stabilization attempt.
Four months ago, the digital asset market experienced what I consider its most significant liquidation event to date. On October 10, 2025, more than $19 billion in leveraged positions were erased within a matter of hours. Bitcoin tumbled from around $122,000 to $105,000, and over 1.6 million trader accounts were forced into liquidation.
The so-called “10/10” crypto crash did more than shake prices—it reshaped the psychological backdrop of crypto investing.
As I mentioned on PreMarket Prep last week, from a technical perspective Bitcoin is currently trading about two standard deviations below its 20-day average—a condition that has appeared only three times in the past five years. Historically, such stretched readings have tended to precede short-term rebounds over the following 20 trading sessions.
The unwinding of the Japanese carry trade—estimated at roughly $500 billion—likely added to the weakness seen in January and again this month. Still, I believe much of that pressure has now run its course.
With Bitcoin still trading below $70,000—about 45% off its all-time high—some investors may be asking whether the events of October 10 are the reason the downturn has lingered.
The short answer is yes. But the deeper explanation is more complex—and, in my view, more relevant for portfolio positioning going forward.
What Really Happened
To put it in context, the 10/10 crash surpassed the FTX collapse in absolute dollar losses. It effectively overshadowed the failure of what had been the world’s second-largest crypto exchange. Binance alone reportedly drew $188 million from its insurance fund to cover bad debt, while several other trading platforms faced comparable strains.
As for the catalyst, many point to President Donald Trump’s announcement of a 100% tariff on Chinese imports, layered on top of an existing 30% levy.
That geopolitical jolt rattled global markets. But in crypto—where leverage is deeply embedded in the system—it transformed what might have been a routine correction into a cascading liquidation event.
The crash laid bare deep structural flaws in how exchanges were managing risk, with one platform in particular drawing scrutiny.
The Binance Factor
Star Xu, founder and CEO of OKX, recently posted a detailed breakdown on X outlining his view of how the 10/10 meltdown unfolded.
According to Xu, Binance rolled out an aggressive user acquisition push offering 12% APY on USDe, a synthetic dollar built on Ethereum. At the same time, the exchange permitted USDe to be posted as collateral under the same terms as established stablecoins such as Tether (USDT) and USD Coin (USDC).
Xu argues this created a distorted incentive structure. Users were enticed to swap USDT and USDC for USDe in pursuit of higher yields, often without fully appreciating the added risk profile.
A leverage loop soon followed. Traders converted USDT into USDe, pledged USDe as collateral to borrow more USDT, then recycled the borrowed funds back into USDe—repeating the process. Xu claims this dynamic drove advertised yields as high as 24%, 36%, and even above 70%.
When volatility surged, USDe quickly lost its peg, unleashing cascading liquidations. The market entered a classic doom loop: forced selling triggered margin calls, which in turn sparked further forced selling.
For its part, Binance has denied responsibility. Speaking at a crypto conference last week, co-CEO Richard Teng attributed the turmoil entirely to President Donald Trump’s tariff announcement. Still, allowing heavily leveraged positions in a market where stop-losses can be gamed and safeguards are thin creates systemic fragility. In such an environment, even a minor shock can ignite a chain reaction.
The Psychological Fallout
October 10 erased more than leveraged trades—it shattered investor confidence. The event coincided with Bitcoin peaking near $126,000 and sparked a wave of fear that continues to weigh on sentiment.
In the weeks that followed, ETFs saw meaningful outflows. Retail traders—many of whom had piled into futures and margin positions as Bitcoin hit record highs—were hit hardest. More than 1.6 million accounts were liquidated, a large share belonging to smaller participants.
This month’s follow-on decline, which marked Bitcoin’s largest realized loss on record as prices slid from $70,000 to $60,000, was described by one analyst as a “textbook capitulation.” The drop was swift, volume-heavy, and flushed out holders with the weakest conviction.
Why I’m Still Constructive
Despite persistent volatility, I remain long-term bullish because the underlying fundamentals remain intact.
Institutional participation continues to expand. Corporate Bitcoin treasuries—often referred to as Digital Asset Treasury (DAT) firms—now collectively control more than 1.1 million BTC, about 5.7% of total supply, valued near $90 billion. MicroStrategy (now operating as Strategy) alone holds roughly 3.5% of Bitcoin’s circulating supply.
Notably, institutions added around 43,000 BTC in January, even amid adverse price conditions—suggesting that long-term capital remains engaged despite the market’s recent turbulence.
The U.S. Strategic Bitcoin Reserve now reportedly holds more than 325,000 BTC—about 1.6% of total supply—making it the largest sovereign holder globally. At the same time, other nation-states are building positions, much as they do with gold, and major corporations continue to add to their allocations.
The Bottom Line
I’ve long described Bitcoin as “digital gold,” but I don’t believe it has fully evolved into a true safe-haven asset. For now, institutions largely categorize it as a risk-on asset rather than risk-off. That suggests it is still carving out its place within diversified portfolios.
Was October 10 the root cause of Bitcoin’s prolonged weakness? In my view, yes. The event delivered a structural shock that obliterated leveraged positions and forced a sweeping—if painful—deleveraging across the digital asset ecosystem.
Did aggressive marketing and flawed incentive structures at certain platforms worsen the fallout? Again, I would argue yes. Encouraging investors to treat what was effectively a tokenized hedge strategy as if it were a stablecoin—while layering on substantial leverage—inevitably magnified systemic risk.
As severe as the collapse was, it may ultimately prove constructive. Excess leverage often needs to be purged before a sustainable advance can resume. My sense is that we are nearing the final phase of that cleansing process.
Bitcoin declined on Monday, deepening its downturn after crypto markets posted four consecutive weeks of heavy losses, as interest-rate uncertainty continued to dampen appetite for riskier assets.
The largest cryptocurrency briefly touched $70,000 over the weekend before retreating. By 00:58 ET (05:58 GMT), Bitcoin was down 2.7% at $68,409.7.
Strategy says liquidation unlikely unless Bitcoin drops to $8,000
Strategy Inc (NASDAQ:MSTR), the biggest corporate holder of Bitcoin, said Sunday it can meet its debt obligations even if Bitcoin tumbles to $8,000. In a social media update, the company stated it could “withstand a drawdown in $BTC price to $8K and still have sufficient assets to fully cover our debt.”
The firm owns 714,644 Bitcoins, financed through a combination of equity issuance and long-term borrowing. Led by prominent Bitcoin advocate Michael Saylor, Strategy has continued accumulating coins in recent weeks despite the broader market slide.
Bitcoin has now erased about half its value since peaking near $126,000 in October, leading declines across speculative assets as traders grew cautious amid U.S. rate uncertainty.
Extended losses had fueled speculation that Strategy might be forced to sell part of its holdings to service debt, though Saylor has repeatedly downplayed such concerns. Earlier this month, the company reported a $12.4 billion loss for the December quarter, compared with a $670.8 million loss a year earlier. Aside from its substantial Bitcoin position, Strategy generates relatively limited operating revenue.
Broader digital assets also moved lower Monday in line with Bitcoin’s sustained slump. Ethereum fell 6.1% to $1,958.63, while XRP dropped 7.7% to $1.4575.
BNB declined about 4%, with Solana and Cardano sliding 5.4% and 6.2%, respectively.
Among meme tokens, Dogecoin tumbled 11.4%, while TRUMP slipped 2.4%.
Crypto sentiment has remained fragile since October, as both retail and institutional inflows slowed sharply. Meanwhile, a surge in gold prices amid speculative enthusiasm in precious metals has drawn attention away from Bitcoin, with investors favoring tangible assets.
Bitcoin snapped a four-session slide on Friday, climbing nearly 4%, though it remained on course for its first four-week losing streak since November 2025. The leading cryptocurrency was up 3.7% at $68,776.1 by 17:15 ET (22:15 GMT), after dropping close to $65,000 in the prior session.
Bitcoin pressured by tech slump as U.S. inflation eases.
While Friday’s rebound trimmed some weekly losses, Bitcoin was still headed for a roughly 0.6% decline, struggling to build lasting upside momentum after bouncing from earlier lows and drifting back toward last week’s $60,000 support zone.
Risk appetite has been fragile amid a prolonged selloff in technology stocks, driven by renewed concerns that artificial intelligence could disrupt traditional software and office-service business models. Those fears resurfaced on Thursday as investors questioned how automation and emerging AI tools might erode established revenue streams.
At the same time, fresh U.S. inflation data showed price pressures eased more than anticipated in January. According to the U.S. Bureau of Labor Statistics, headline CPI rose 2.4% year-over-year, down from 2.7% in December, while core CPI increased 2.5%, matching forecasts.
On a monthly basis, headline CPI gained 0.2% and core CPI 0.3%, with the softer headline figure boosting expectations that the Federal Reserve could move toward policy easing. However, strong labor market data earlier in the week—highlighting solid payroll growth and a lower unemployment rate—had dampened hopes for near-term rate cuts.
Dessislava Ianeva of Nexo Dispatch noted that crypto markets appear to be stabilizing after the softer CPI reading, even as ETF outflows continue, with positioning data suggesting lower leverage and consolidation rather than a fresh directional breakout.
Crypto leaders appointed to CFTC Innovation Advisory Committee.
Separately, the U.S. Commodity Futures Trading Commission appointed several prominent crypto executives to its new Innovation Advisory Committee, including Brian Armstrong of Coinbase, Brad Garlinghouse of Ripple, Vladimir Tenev of Robinhood, and Hayden Adams of Uniswap Labs.
The committee will advise on emerging technologies such as blockchain and AI in derivatives and crypto markets, as regulators clarify oversight of digital assets, with the CFTC expected to take a leading role.
Elsewhere in the market, altcoins also advanced. Ethereum jumped 5.4% to $2,049.07, XRP rose 2.8% to $1.40, Solana surged 8.3%, Cardano gained 4.1%, and Dogecoin added 4.7%.
Bitcoin has fallen roughly 50% from its October 2025 peak near $126,000 and is now trading around $65,000, marking a far deeper retracement than a routine correction. This downturn reflects not just price volatility but a broader shift in the macro backdrop and crypto’s structural dynamics.
Macro Pressures Reshape the Cycle
As institutional participation has increased, Bitcoin has become more tightly linked to global financial conditions. Rather than acting as “digital gold,” it has moved in closer correlation with U.S. equities—especially technology stocks. Ongoing uncertainty about the pace of disinflation, combined with renewed tariff measures from the Trump Administration targeting Europe and Asia, has strengthened the U.S. dollar and dampened overall risk appetite. Concerns that the artificial intelligence boom may be maturing have further pressured growth assets, including crypto.
Miner Stress and Institutional Retreat
On-chain and industry data reveal mounting supply-side pressure. With the estimated average mining cost around $87,000, many miners are operating below breakeven at current price levels. To stay solvent, some have been liquidating reserves, adding persistent sell-side pressure to the market.
Institutional flows tell a similar story. Roughly $5 billion has exited Bitcoin ETFs in recent weeks, signaling a rotation into safer assets. Meanwhile, reports of operational pauses at certain established crypto platforms have revived memories of the 2022 bankruptcy wave, further unsettling sentiment.
The Crypto Fear and Greed Index remains entrenched in the 5–8 range—classified as “extreme fear”—highlighting the depth of caution across the market.
The Technical Road Ahead
For sentiment to meaningfully reset, Bitcoin must reclaim the $70,000–$78,000 zone, which now represents a critical resistance band. A sustained move above that range would signal renewed confidence and potentially mark the beginning of a recovery phase. Until then, macro headwinds, miner capitulation risks, and fragile investor psychology are likely to continue defining the tone of this cycle.
Bitcoin Technical Outlook
On the daily chart, Bitcoin is attempting to stabilize in a critical technical zone. After sliding to roughly $60,000 last week, price rebounded, but the recovery stalled near $70,000 as sellers re-emerged. Over the past week, Bitcoin has remained below its 8-day EMA, signaling short-term weakness and keeping the broader technical bias cautious.
The $62,800 area—aligned with the Fibonacci 1.272 extension—now stands out as key support. The earlier bounce from $60,000 suggests buyers are active in this region and view it as a potential base. However, a daily close below that level could accelerate downside pressure, exposing the next major support near $55,000, around the Fibonacci 1.414 extension.
One constructive signal comes from momentum indicators. On the daily timeframe, the Stochastic RSI is showing positive divergence: while price has continued to drift lower, the indicator has turned upward from oversold territory. This often signals waning downside momentum and can precede sharp countertrend rallies, including short squeezes or bear traps. Still, for a rebound to evolve into a durable recovery, Bitcoin must reclaim key resistance levels and short-term moving averages. Until then, the market remains delicately balanced between support and renewed selling.
Critical Resistance Levels for a Trend Reversal
A sustained recovery would first require a decisive break above the psychological $70,000 level, ideally accompanied by strong trading volume. Without volume confirmation, upside moves may lack conviction.
A more robust trend reversal signal would come from breaking the descending trendline and reclaiming the Fibonacci 1.0 level near $76,350. The broader $76,000–$78,000 band represents a major technical barrier. Unless Bitcoin can firmly establish itself above this zone, rallies are likely to remain corrective within a broader medium-term downtrend.
Is a Short Squeeze Setup Building?
Bitcoin futures funding rates are hovering around -0.006%, indicating short positioning dominates. When leverage becomes skewed heavily to one side, sharp counter-moves often follow as liquidity is cleared. Combined with the positive Stochastic RSI divergence, this creates the potential for a swift spike toward $70,000.
Zooming out, Bitcoin appears to be navigating a capitulation phase marked by ETF outflows, miner pressure, and macro uncertainty. At the same time, some technical signals hint at a cleansing process that could reset positioning.
A conservative stance would wait for weekly closes above $78,000 before declaring a structural recovery. More tactical traders may view the Stoch RSI divergence as an opportunity for a move toward $70,000, with $62,800 serving as a clear risk threshold.
As the crypto sector enters what looks like a period of corporate restructuring in early 2026, the $55,000 region could eventually be seen as a longer-term base—if stabilization holds. Until stronger confirmation emerges, disciplined risk management remains critical: reduced leverage, smaller position sizing, and strict stop-loss levels are essential in this highly volatile environment.
Bitcoin remained under pressure on Thursday as investors stayed cautious and its divergence from the rallying stock market widened. The BTC/USD pair slipped below 68,000, a sharp decline from its year-to-date peak of 126,300.
The pullback came even as US equities extended their strong advance, with the Dow Jones reaching a record high. The decline followed the release of solid US labor market data. According to the Bureau of Labor Statistics, the economy added more than 130,000 jobs, while the unemployment rate eased to 4.3%. However, some analysts cautioned that the figures could be revised lower, as has happened previously.
Indeed, revisions to last year’s employment data revealed that job growth averaged 15,000 per month, significantly below the initially reported 49,000 average.
Bitcoin also weakened amid a continued drop in futures open interest, which has fallen to $45 billion from last year’s peak of over $95 billion—an indication that market participation and demand have cooled.
Additional pressure followed warnings from the Congressional Budget Office (CBO) about the US government’s unsustainable fiscal trajectory. The deficit is projected to rise by $4.7 trillion over the next decade. Increased immigration-related spending, estimated at more than $500 billion, is cited as one contributing factor, while Trump’s tariffs are expected to generate approximately $3 trillion in revenue.
BTC/USD Technical Analysis
On the daily chart, BTC/USD remains in a pronounced downtrend, sliding from its October high of 126,300 to around 67,665. The decline persists despite continued accumulation by large holders.
Technically, Bitcoin is trading below both the 50-day and 100-day Exponential Moving Averages, as well as the Supertrend indicator, reinforcing the bearish bias. The MACD has crossed below the zero line, while the Relative Strength Index hovers near 30, suggesting weak momentum and near-oversold conditions.
The most probable scenario is a continued decline toward the key support level at 60,000. Conversely, a break above the major resistance at 72,000 would negate the bearish outlook and signal the potential for renewed upside momentum.
Bitcoin hovered around $67,000 during Thursday’s Asian session, showing little movement as investors weighed stronger-than-expected U.S. jobs data that reduced hopes for an imminent Federal Reserve rate cut. The leading cryptocurrency edged up 0.4% to $67,102.8 but remained below the crucial $70,000 threshold, with trading subdued amid thinner liquidity conditions.
After bouncing back from a steep drop toward $60,000 earlier this month, Bitcoin has struggled to rebuild bullish momentum.
Robust U.S. jobs data tempers rate-cut expectations; CPI in focus
Figures released Wednesday showed U.S. nonfarm payrolls rose more than anticipated in January, highlighting ongoing strength in the labor market. The unemployment rate stayed near multi-month lows, and wage growth remained solid—reinforcing expectations that the Fed may keep interest rates elevated for longer.
In response, traders scaled back bets on a near-term rate cut, with market pricing now suggesting lower chances of easing before June. Prolonged higher rates tend to pressure risk-sensitive assets like cryptocurrencies.
Market participants are now looking ahead to weekly jobless claims data due later Thursday for additional insight into labor conditions. Friday’s U.S. Consumer Price Index (CPI) report will also be closely watched for signals on inflation and the Fed’s policy path.
Bitcoin’s continued failure to break above $70,000 underscores cautious sentiment and lingering volatility following its recent decline, keeping prices largely range-bound.
Crypto liquidity provider BlockFills has reportedly paused client withdrawals amid a sharp downturn in digital asset prices, according to multiple media outlets on Wednesday.
The Financial Times and other sources said the suspension, which began last week, aims to safeguard both clients and the company during turbulent market conditions while restoring liquidity on the platform.
Clients are reportedly still able to trade spot and derivatives under certain restrictions.
BlockFills serves over 2,000 institutional clients and processed more than $60 billion in trading volume in 2025, the FT noted. The move echoes similar steps taken by crypto firms during previous market slumps.
Crypto prices today: Altcoins edge higher in sideways trade
Most major altcoins posted modest gains Thursday amid range-bound trading.
Ethereum, the second-largest cryptocurrency, rose 1.1% to $1,972.92, while XRP gained 1.6% to $1.38. Solana traded flat, whereas Cardano and Polygon each climbed 2.5%. Among meme coins, Dogecoin advanced 2.2%.
The total cryptocurrency market capitalization has fallen about 10% over the past week to roughly $2.36 trillion. Paradoxically, this also marks a 10% rebound from Friday’s lows. Despite that uptick, near-term prospects remain uncertain, as the recovery stalled over the weekend and met selling pressure around the $2.4 trillion level. This suggests the move may have been a temporary bounce within a broader decline that has yet to fully run its course.
The sentiment index dropped to 6 over the weekend, matching the lows seen on June 18–19, 2022, and only falling lower once before, on August 22, 2019. By Monday, it had rebounded to 14 in line with market prices, but this remains an extremely depressed level and does not yet support confident buying.
Bitcoin recovered steadily on Friday after an early sharp sell-off, but from Saturday onward it encountered strong resistance around the $71,000 level. Significant supply remains in the market from investors looking to exit on rebounds, suggesting persistent selling pressure. Under these conditions, the possibility of a fresh test of the 200-week moving average in the near term should not be ruled out.
The decline in Bitcoin prices has been accompanied by shrinking liquidity, heightened volatility, weaker risk appetite, and a stronger correlation with equity markets. CryptoQuant suggests BTC could drop to around $54,600, a level at which the market may shift from capitulation toward accumulation.
Amid the broader crypto sell-off, Strategy reported a net loss of $12.6 billion for the fourth quarter, with operating losses totaling $17.4 billion. CEO Fong Le said the company would only face debt-servicing risks in the event of an extreme Bitcoin collapse to about $8,000.
Cardano founder Charles Hoskinson disclosed unrealized losses exceeding $3 billion, while emphasizing that he has no plans to liquidate his holdings even if market conditions deteriorate further.
Bitcoin miners are increasingly shutting down operations as losses mount. Mining profitability has fallen to record lows due to declining crypto prices and higher electricity costs, with JPMorgan estimating the average cost of mining at roughly $87,000 per BTC.
Following the latest adjustment, Bitcoin’s mining difficulty dropped 11.16% to 125.86 trillion, marking the steepest decline since 2021, when China banned cryptocurrency mining.
Despite the prevailing pessimism, JPMorgan remains constructive on Bitcoin’s long-term outlook, forecasting that it could eventually reach $266,000. The bank has also recently lifted its long-term gold price forecast to $8,000–8,500.
Bitcoin hovered above the $70,000 mark on Monday, stabilizing after a sharp rebound late last week from lows near $60,000, as investors reassessed risk appetite following widespread liquidations and shifted focus to key U.S. economic data due later in the week.
The world’s largest cryptocurrency was last up about 1.5% at $70,402.5 by 01:25 ET (06:25 GMT), moving further away from a roughly 16-month low of around $60,187 reached earlier in the week.
On Friday, Bitcoin surged back above $70,000, jumping more than 12% in a single session as rallies in technology stocks and precious metals lifted risk assets more broadly. The rebound was supported by bargain hunting after the steep selloff, alongside signs of stabilisation across global markets.
Bitcoin’s sharp decline last week reflected a broader risk-off environment, driven by a selloff in U.S. technology shares — especially AI-related stocks — and forced liquidations in crypto futures markets, which intensified downward pressure.
Ongoing outflows from Bitcoin spot ETFs and a pullback from leveraged positions were also seen as key contributors to the heightened volatility.
Japan election reinforces the shift in risk sentiment
Japanese Prime Minister Sanae Takaichi’s decisive election victory on Sunday reinforced her mandate to push ahead with fiscal stimulus and tax reductions. The landslide result lifted regional equities and was linked to a renewed appetite for risk across some global markets.
Although the yen initially weakened ahead of the vote, it later steadied alongside equity gains, helping to support broader market sentiment.
Attention is now turning to a series of important U.S. economic releases later this week, including delayed employment data due on Wednesday and the consumer price index report on Friday.
These figures are expected to shape expectations for the Federal Reserve’s policy path, with markets currently factoring in potential rate cuts later in 2026 should inflation cool and labour market momentum slow.
Crypto prices today: altcoins remain subdued after rebounding from recent lows
Most major altcoins moved within narrow ranges on Monday, showing limited follow-through after their recent rebound.
Ethereum, the world’s second-largest cryptocurrency, traded largely unchanged at $2,076.41. XRP, ranked third, edged 1.1% higher to $1.43.
Solana slipped marginally, while Cardano and Polygon were little changed on the day.
In the meme-token space, Dogecoin underperformed, falling about 2%.
Over the past year, market attention has largely centered on bitcoin’s price volatility and shifting investor sentiment. Headlines were dominated by discussions around regulation, adoption, and inflation. Meanwhile, a more subtle but potentially significant risk has been developing in the background: advances in quantum computing. Bitcoin has recently come under pressure as investors begin to factor in these concerns, prompting renewed debate over the cryptocurrency’s long-term security and durability.
Introduction
Rapid progress in quantum computing is raising fresh questions about the future security of blockchain-based systems. Bitcoin’s network depends on cryptographic algorithms to protect transactions and verify ownership, and researchers are increasingly examining whether sufficiently powerful quantum computers could one day compromise these safeguards.
These worries are no longer confined to academic circles. Christopher Wood, Jefferies’ global head of equity strategy, recently removed bitcoin from his model portfolio, citing the risk that breakthroughs in quantum computing could erode the cryptographic foundations underpinning the asset. He cautioned that any successful attack would call into question bitcoin’s credibility as a long-term store of value.
The Quantum Computing Threat
Quantum computing is widely viewed as the next major leap in computational technology. Traditional computers process information using binary bits—either a 0 or a 1. Quantum computers, by contrast, rely on quantum bits, or qubits, which can exist in multiple states simultaneously due to a phenomenon known as superposition. When combined with other quantum effects such as entanglement and interference, this capability allows quantum systems to solve certain classes of problems far more efficiently than classical machines.
Timothy Hollebeek, Industry Standards Strategist at DigiCert, offers a helpful analogy: classical computing is like navigating a maze by testing one route at a time, while a quantum computer can explore all possible paths simultaneously. This parallelism is what makes quantum computers especially powerful for tasks involving complex mathematics, including factoring large numbers and uncovering patterns within massive datasets.
Recent breakthroughs highlight the promise of quantum technology. Google’s quantum processor, Willow, reportedly completed a specialized computation in under five minutes—an exercise that would take classical supercomputers an impractically long time to finish. The chip is estimated to be roughly 13,000 times faster than the world’s most powerful traditional systems for that task. Achievements like this help explain why quantum computing is drawing growing interest across sectors such as healthcare, logistics, and materials research.
Still, despite the enthusiasm, quantum computing remains in its early developmental phase. Current systems face significant technical limitations. Qubits are highly fragile, must operate at temperatures close to absolute zero, and are extremely sensitive to environmental noise, which can introduce errors. Even in tightly controlled settings, sustaining a stable quantum state for more than a short duration remains challenging. For instance, Google’s Willow chip uses 105 qubits, whereas practical, fault-tolerant quantum computers would likely require thousands of reliably connected and stable qubits.
The rapid progress of quantum computing has prompted renewed scrutiny of the long-term security of cryptography-dependent digital systems, including cryptocurrencies. Because bitcoin’s architecture rests on assumptions about the limits of computational power, any transformative advance in computing naturally warrants closer evaluation.
The Real Threats That Could Undermine Bitcoin’s Value
“Quantum computers are not a matter of if, but when,” said Timothy Hollebeek, Industry Standards Strategist at DigiCert—a sentiment that helps explain why quantum advancements are increasingly viewed as a potential long-term risk to bitcoin’s security and valuation.
The most significant risk centers on Shor’s algorithm, a quantum method capable of compromising the elliptic curve digital signature algorithm (ECDSA) that bitcoin relies on to verify ownership of funds. Under today’s classical computing constraints, deriving a private key from a public key is computationally infeasible. However, in a future with sufficiently powerful quantum computers, this assumption may no longer hold. In theory, an attacker could extract a private key from its corresponding public key in a relatively short period, enabling unauthorized transfers of funds.
The quantum risk is not evenly spread across the bitcoin network. Roughly 25% of all bitcoins—more than 5 million BTC—are held in so-called “vulnerable” addresses, including early P2PK addresses and reused P2PKH addresses. This category also encompasses the estimated 1.1 million BTC attributed to Satoshi Nakamoto. These holdings are more exposed because their public keys are already visible on the blockchain, making them potential targets for quantum-enabled attacks. If even a fraction of these coins were moved by a quantum adversary, the resulting supply shock could be severe, shaking confidence in bitcoin’s ownership framework and placing significant downward pressure on prices.
Even newer address formats are not entirely risk-free under extreme assumptions. One commonly cited theoretical vulnerability involves transactions sitting in the mempool—the queue of unconfirmed transactions shared across network nodes. In this scenario, a sufficiently advanced quantum computer could detect a transaction before it is confirmed, derive the corresponding private key in real time, and submit a competing transaction that redirects the funds. Although highly speculative, this example illustrates how execution speed could become as critical as raw computational power.
Beyond outright theft, quantum computing could also erode trust in bitcoin’s neutrality and privacy. Through Grover’s algorithm, quantum-capable miners could gain a disproportionate advantage in proof-of-work mining, increasing the risk of mining centralization. If a single entity accumulated enough influence, it could censor transactions or reorganize blocks, undermining bitcoin’s decentralised ethos.
Another frequently cited risk is the concept of “harvest now, decrypt later,” where encrypted blockchain data is collected today with the expectation that future quantum computers could decrypt it. While this would not alter historical transactions, it could reveal identities behind pseudonymous wallets or expose past activity, weakening perceived privacy guarantees.
These technical risks are increasingly showing up in market behavior. By early 2026, quantum-related concerns had moved beyond abstract theory and begun to affect investor positioning. Bitcoin, for instance, lagged gold by roughly 6.5% year-to-date, while gold advanced about 55% over the same period. As a result, the bitcoin-to-gold ratio fell to around 19 BTC per ounce, signaling a more cautious stance toward bitcoin among investors.
Bitcoin Relative to Gold
How Bitcoin Could Be Compromised—and Why It Remains Resilient
At present, Bitcoin depends on elliptic curve cryptography (ECC)—specifically the secp256k1 curve—to generate public and private keys. Transactions are authenticated using ECDSA signatures, a system that is secure against classical computers but could be vulnerable to sufficiently advanced quantum machines. If that were to happen, both fund ownership and transaction integrity could be at risk.
One practical solution is the adoption of post-quantum cryptography (PQC), which is designed to withstand quantum attacks. Rather than requiring a complete overhaul of the network, PQC could be introduced incrementally, allowing vulnerable cryptographic components to be replaced over time.
Under a PQC framework, security would be reinforced through a three-layer defense. Kyber would protect communications between nodes and wallets, preventing interception or eavesdropping. Dilithium would handle transaction verification and safeguard private keys against quantum-enabled attacks. SPHINCS+ would ensure the integrity of transaction records, effectively giving each transaction a unique, tamper-resistant cryptographic fingerprint.
Bitcoin is not a static system. In January 2026, the first “Bitcoin Quantum” testnets began experimenting with post-quantum cryptography using NIST-standardised algorithms such as ML-DSA (formerly Dilithium). These trials demonstrated that quantum-resistant upgrades can be tested safely before any network-wide rollout. Such technologies strengthen transaction validation, data transmission, and record integrity, helping ensure bitcoin’s durability in a future shaped by quantum computing. Previous upgrades—including SegWit and Taproot—illustrate that bitcoin can evolve without disrupting network operations.
Resilience is not purely technical; it is also economic and social. A visible quantum-related attack would pose an immediate threat to bitcoin’s value, creating strong incentives for miners, developers, exchanges, and large holders to coordinate a rapid response. Historically, the network has shown an ability to converge quickly on practical solutions when facing systemic risks. Moreover, quantum computing is advancing incrementally, giving bitcoin ample time to prepare, test, and deploy defensive measures before the threat becomes acute. In this context, resilience is about managing technological change carefully rather than attempting to stop it outright.
Bitcoin’s robustness is rooted in both its architecture and its incentives. The network has no central authority, physical headquarters, or kill switch. Its ledger is maintained by thousands of independent nodes globally, eliminating single points of failure. A fixed supply cap of 21 million coins guards against monetary inflation, while the proof-of-work mechanism—secured by vast computational resources—makes large-scale attacks prohibitively expensive.
Widespread adoption further reinforces this resilience. By 2024, an estimated 500 million people held bitcoin or other cryptocurrencies, while institutional participation expanded through ETFs, hedge funds, pension funds, and even sovereign entities. As bitcoin becomes increasingly embedded in the global financial system, the economic and political costs of attempting to disrupt it continue to rise. Major stakeholders now have strong incentives to preserve long-term stability rather than undermine it.
Some observers, including Michael Saylor, have argued that a shift to quantum-resistant addresses could materially affect bitcoin’s market dynamics. If the network were to establish a migration deadline, coins held in legacy addresses—whose owners have lost access or passed away—could become permanently inaccessible. This would effectively remove millions of bitcoins from circulation, tightening supply and increasing scarcity. While the timing and market response remain uncertain, such a transition underscores the intricate relationship between technological evolution and bitcoin’s economic framework.
Conclusion
Quantum computing poses challenges that extend well beyond bitcoin, as many digital platforms and internet communications depend on the same public-key cryptographic systems that could eventually be vulnerable to quantum attacks. Nvidia CEO Jensen Huang has suggested that truly practical quantum computers may still be 15 to 30 years away, providing a meaningful window for industries to prepare and adapt.
In the meantime, leading technology firms are already moving to address these risks. Microsoft, for instance, is incorporating post-quantum cryptography (PQC) into its core software libraries and working alongside global standards organizations to develop quantum-resistant protocols for secure communications.
Together, these initiatives indicate that both the broader technology sector and the cryptocurrency ecosystem are actively planning for a post-quantum future, testing and deploying safeguards well ahead of the arrival of commercially viable quantum computers.
Bitcoin may be extended and capable of sharp countertrend bounces, but the broader signal is clearly weakening. When market leaders begin to roll over and assets start moving in lockstep, liquidity is usually the underlying issue.
When risk assets move together, it’s rarely intentional. Dispersion has collapsed, leadership is breaking down, and liquidity is retreating to the sidelines. Volatility is no longer being absorbed—it’s being amplified.
The extent of the damage matters. The very assets that led the risk rally are now suffering the most, not because the narrative has shifted, but because capital is being withdrawn rather than reallocated. That’s how selloffs become disorderly.
Signs of stress are already emerging in rates markets. Expectations for Federal Reserve easing this year have surged from 41 basis points to 61 basis points in just a few days—nearly a full rate cut being priced in within a week. Markets don’t make that kind of adjustment unless financial conditions are tightening rapidly.
Bitcoin is deeply stretched and prone to sharp countertrend rallies, but being oversold does not mean the downside is finished. This feels like the phase where correlations converge, risk assets move as one, and capital preservation takes precedence.
BTC/USD Price Action Deteriorates Sharply
My long-held view is that bitcoin’s price is ultimately driven by its own price action. Whatever the underlying catalysts, the market repeatedly failed to break above the $123,600 level in the second half of last year, with four separate weekly rejections at that resistance. That ceiling capped the advance and set the stage for a pullback toward the $99,800 support area, before price eventually slipped below the 50-week moving average—a level that had consistently provided support throughout last year’s uptrend.
From there, downside momentum intensified. Bitcoin broke decisively through the $99,800 support and then consolidated within a rising wedge, a bearish continuation pattern, before breaking down last week on a clear surge in volume. The move below $74,400 triggered a sharp acceleration lower, pointing to forced liquidations of long positions rather than orderly selling.
So far, price has rebounded from around $60,000, which is not surprising given how stretched conditions have become. Bitcoin remains well below the lower Bollinger Band, RSI is deeply oversold, and MACD is at extreme levels by historical standards. A rebound toward $74,400 is therefore quite possible, but unless that level is decisively reclaimed, any rally is likely to be sold into.
On the downside, there is limited meaningful support below $60,000 until roughly $49,400—a level that served as both support and resistance during parts of 2024.
Bitcoin plunged on Thursday to its lowest level since mid-October 2024, as thinning liquidity and a broad selloff in global technology stocks renewed pressure on risk assets. The world’s largest cryptocurrency was last down 12.4% at $63,539.4 by 17:28 ET (22:28 GMT).
The token has fallen in seven of the past eight sessions and is now down nearly 50% from its record high of around $126,000 reached in October 2025. Interactive Brokers chief strategist Steve Sosnick said the scale of the decline suggests the crypto market has moved beyond a normal cycle, describing it as a full-blown bear market given drawdowns of 40% to 50% or more.
Tailwinds that once boosted crypto now turning into headwinds
Bitcoin’s sharp selloff has intensified in recent days amid a broader rout in technology stocks, as investors rotate out of high-risk assets. According to Interactive Brokers strategist Steve Sosnick, several of the forces that fueled bitcoin and other cryptocurrencies’ rapid ascent in 2025 have now turned into headwinds.
Strong inflows following the launch of bitcoin ETFs in January 2024, the Trump administration’s supportive stance toward digital assets, and substantial purchases by crypto-focused treasury firms all helped drive prices higher, Sosnick said. He added that crypto also benefited during the rally from minimal margin constraints, as many exchanges and dealers offered extremely high leverage. Unlike stocks and ETFs, which are limited by Regulation T and similar rules, this leverage allowed investors to amplify gains—an effect that is now accelerating losses as prices fall.
After bitcoin surged to a record high above $126,000 on October 6, the broader cryptocurrency market experienced a sharp selloff just four days later. Analysts later described the move as a “flash crash,” attributing it to heavily leveraged dealers being forced to unwind positions amid margin-related losses.
Interactive Brokers strategist Steve Sosnick said that as market momentum shifted, several of the factors that had previously supported cryptocurrencies began to turn into headwinds. He noted that while leverage can significantly amplify gains during rallies, it can also sharply magnify losses during downturns. Sosnick added that progress on anticipated crypto regulation stalled in Congress, while equity-focused investors rotated toward other opportunities as momentum faded. He also pointed out that although exchange-traded funds made it easy for investors to gain crypto exposure, they also enabled swift exits when sentiment turned.
According to Sosnick, what began as a routine correction ultimately snowballed into a full-blown rout, mirroring selloffs seen in other assets that had posted outsized gains, including software stocks and precious metals.
Dwindling liquidity
Reports indicated that market liquidity was particularly thin, magnifying price swings and triggering a wave of forced liquidations as bitcoin fell through closely watched technical levels. The selloff was intensified by aggressive unwinding of leveraged positions—especially in derivatives markets—after bitcoin’s slide below $75,000 activated a series of stop-loss orders. Data from crypto analytics firm CoinGlass showed that nearly $770 million worth of cryptocurrency positions were liquidated over the past 24 hours.
Most major altcoins also moved sharply lower on Thursday. Ethereum, the world’s second-largest cryptocurrency, fell 11.5% to $1,878.11, while XRP, the third-largest token, plunged 21% to $1.19. Solana and Cardano recorded steep losses as well, sliding 11.9% and 11.1%, respectively. Meme coins were also hit hard, with Dogecoin down 12.1% and the $TRUMP token sinking more than 14%.
In our Ethereum (ETHUSD) update from three weeks ago, we noted that ETH had been forming an ascending triangle since 2020—characterized by higher lows and relatively equal highs—signaling that the long-term uptrend remained intact. We also highlighted that a pullback toward the ~$2,200 support area, followed by a breakout, could open the door for a move toward ~$6,190.
Today, Ethereum is trading near that trend line at around $2,150. At the same time, the daily RSI(30) has declined to 32. Historically, aside from the 2018 bear market, this zone has provided attractive low-risk, high-reward opportunities for investors with a long-term horizon or those employing a dollar-cost averaging (DCA) strategy (see Figure 1).
Figure 1: Ethereum’s daily price action since 2015.
More on the RSI is discussed below. In the meantime, what would be the downside risk if the trend line fails to hold, allowing for some short-term whipsaw action? That scenario is illustrated below using the Elliott Wave Principle (EW). Under this framework, ETH’s price action suggests it may be unfolding within a larger, higher-degree fourth wave—labeled as the black Wave 4. See Figure 2.
Figure 2: Ethereum’s monthly price action since 2015.
In this scenario, Ethereum would gravitate toward the lower black dotted trend line, which has acted as key downside support since 2021 and is currently near $1,450. From that level, the second-largest cryptocurrency by market capitalization could still resume its advance, unfolding a (black) fifth wave that ideally targets around $6,200 (4,865 − 1,08? + 1,450). This aligns closely with the breakout objective from our original analysis, where we noted: “If Ethereum drops to ~$2,200 support first and then breaks out, we can expect ~$6,190.”
Lastly, it is worth noting that the monthly RSI(5) has now fallen below 30. Similar to the daily RSI(30), historical data shows that this level has typically provided low-risk, high-reward opportunities for investors with a long-term horizon and/or those employing a dollar-cost averaging (DCA) approach.
Stellar continued its corrective move on Thursday after failing to reclaim a previously broken trendline. Derivatives data points to mounting weakness, with short positions increasing even as open interest declines. The technical picture remains bearish, suggesting sellers retain control and could push the price into a deeper correction.
Stellar (XLM) continued its corrective decline on Thursday, trading below $0.167 at the time of writing after facing rejection at a key resistance level. Derivatives indicators signal growing weakness, with short positions increasing even as open interest declines. From a technical perspective, bearish momentum remains dominant, leaving XLM vulnerable to further downside and potential new lows.
Derivatives data signals downside bias for XLM
CoinGlass data shows XLM’s long-to-short ratio at 0.85 on Thursday, close to its lowest level in a month. A reading below one indicates a bearish skew in market positioning, with a greater share of traders betting on further price declines.
Stellar’s futures open interest fell to $95 million on Thursday, marking its lowest level since November 2024 and continuing a steady decline seen since the start of the year. The reduction in open interest signals diminishing trader participation and reinforces the broader bearish outlook for XLM.
Stellar Price Forecast: XLM deepens correction after slipping below key support
Stellar fell more than 13% last week, closing below the lower boundary of a falling wedge pattern on Saturday. Since then, XLM has repeatedly faced rejection near the broken trendline through Wednesday, extending losses by more than 5%. As of Thursday, the token is trading around $0.169.
If the corrective move continues, XLM could slide further toward its 2025 yearly low at $0.160, recorded on October 10.
Momentum indicators continue to point lower. The daily Relative Strength Index (RSI) stands at 26, signaling oversold conditions and strong bearish pressure. Meanwhile, the Moving Average Convergence Divergence (MACD) has remained in a bearish crossover since mid-January, with expanding red histogram bars below the zero line reinforcing the negative technical bias.
Alternatively, a recovery in XLM could see prices push higher toward the lower boundary of the trendline, near the $0.180 level.
Bitcoin on Tuesday wiped out all of the gains it had made since President Donald Trump’s election victory in early November 2024. Selling pressure continued into Wednesday, briefly dragging the world’s largest cryptocurrency below the $72,000 level.
The digital asset has now plunged roughly 42% from its record high above $126,000 reached last October, firmly placing it in bear-market territory.
Bitcoin surged through 2025 on expectations of a more crypto-friendly regulatory environment under the Trump administration, strong inflows into spot exchange-traded funds, and growing institutional adoption. Since peaking, however, prices have fallen sharply, with losses accelerating in 2026.
Citi Research analyst Alex Saunders said downside sensitivity to equity markets, heightened geopolitical risks, and long-position liquidations have weighed heavily on bitcoin and the broader crypto market.
Saunders also noted a clear slowdown in inflows to U.S. spot bitcoin ETFs since Oct. 10 last year, which he views as a key source of incremental demand. The drop in new money has coincided with increased caution among long-term holders, who have grown more concerned about cyclical weakness in bitcoin.
Nearing critical levels
Bitcoin slid as much as 5% on Wednesday to an intraday low of $71,913.4, marking its weakest level since early November 2024.
Citi Research analyst Alex Saunders said bitcoin is now nearing critical price thresholds. He noted that prices have fallen below Citi’s estimated average U.S. spot ETF entry level of $81,600 and are approaching the roughly $70,000 level that prevailed ahead of the U.S. presidential election.
Saunders pointed to U.S. legislation passed by the House in July 2025—currently stalled in the Senate—as a potential catalyst for renewed investor interest. He said there has been some progress early this year, with the Senate Finance Committee releasing a draft bill intended to be reconciled with the House-approved CLARITY Act, although the proposal has yet to gain broad support and a committee vote has been delayed. The Senate Agriculture Committee has also advanced its own version of the legislation.
According to Saunders, positive developments on the regulatory front could provide a meaningful boost to market sentiment and capital inflows, citing past examples such as stronger ETF demand following the U.S. election and the passage of the GENIUS Act in July 2025.
No signs of structural stress in crypto markets
Analysts say bitcoin’s latest selloff does not signal deeper structural problems, but rather reflects the normal ebb and flow of bull and bear cycles.
“Recent price movements in bitcoin don’t suggest that anything has broken in the crypto market—they simply mirror the current stage of the broader macroeconomic cycle,” said Gil Rosen, co-founder of the Blockchain Builders fund, in comments to Investing.com. He noted that earlier gains had overshot reality, with markets pricing in an unrealistically smooth rally. The subsequent decline, Rosen added, was not driven by crypto-specific factors, but by external pressures including geopolitics, tariffs, and policy uncertainty. As institutional investors now play a larger role, bitcoin increasingly trades like a risk asset, making it more vulnerable when macro conditions deteriorate.
Nicholas Motz, CIO of Soil.co and CEO of ORQO.digital, echoed this view, arguing that the sharp unwinding of precious metals positions late last week triggered a broader risk-off move across asset classes.
“When investors face pressure in traditional safe havens, they often sell their most liquid and profitable holdings—such as bitcoin—to offset losses elsewhere,” Motz said. He characterized the recent decline as a forced deleveraging episode rather than a fundamental change in long-term crypto adoption.
Bitcoin hovered just above 15-month lows on Wednesday after a sharp sell-off drove the world’s largest cryptocurrency down toward the $73,000 level amid a wave of liquidations and heightened risk aversion. The token was last trading 2.8% lower at $76,509.1 as of 01:56 ET (06:56 GMT), having earlier touched $73,004.3—its weakest level since November 2024.
Following the weekend’s slump, Bitcoin fell nearly 12% last week, building on a roughly 10% decline in the prior week. The latest drop marks its lowest point since Donald Trump’s U.S. election victory, wiping out gains that had previously been supported by optimism around potential regulatory easing for the cryptocurrency sector.
Bitcoin sinks to a 15-month low as mass liquidations accelerate
The downturn was accompanied by widespread liquidations of leveraged long positions. According to data from crypto analytics firm CoinGlass, nearly $740 million in bullish bets were erased over the past 24 hours, as falling prices triggered margin calls and forced traders to close positions.
Bitcoin’s latest weakness represents a sharp reversal from the strong rally seen late last year, when prices surged in the wake of Donald Trump’s election victory. At that time, investors poured into cryptocurrencies on expectations that a new U.S. administration would adopt a more supportive regulatory approach to digital assets. Additional tailwinds came from Federal Reserve rate cuts starting in December 2024, which helped fuel demand for higher-risk assets.
Gold and other traditional safe-haven assets rebounded on Wednesday as geopolitical tensions between the United States and Iran intensified.
At the same time, cryptocurrency markets remain under pressure amid uncertainty surrounding U.S. monetary policy following President Trump’s nomination of former Federal Reserve Governor Kevin Warsh as the next Fed chair. Warsh is widely regarded as a policy hawk, raising concerns over tighter liquidity conditions.
Most altcoins remained under pressure on Thursday, posting steeper losses than Bitcoin. Ethereum, the world’s second-largest cryptocurrency, slipped 2.3% to $2,268.92, while XRP, ranked third, edged 1.1% lower to $1.59.
Solana dropped 6%, while Cardano also moved lower and Polygon declined 3.5%. Among meme tokens, Dogecoin was marginally weaker, down 0.2%.