- Bitcoin rebounds to trade above $76,000 on Friday after finding support near a key level the previous day.
- Ethereum remains above its 50-day EMA at $2,244, signaling potential recovery momentum.
- Meanwhile, XRP continues its decline after dropping below the key 50-day EMA at $1.41 earlier this week.
Bitcoin (BTC) and Ethereum (ETH) are attempting a recovery on Friday after rebounding from key support levels in the previous session. In contrast, Ripple (XRP) remains under pressure, having slipped below a crucial support zone. Overall, price action across the three leading cryptocurrencies reflects a cautious market sentiment, as traders watch whether BTC and ETH can sustain their rebound while XRP continues to underperform.
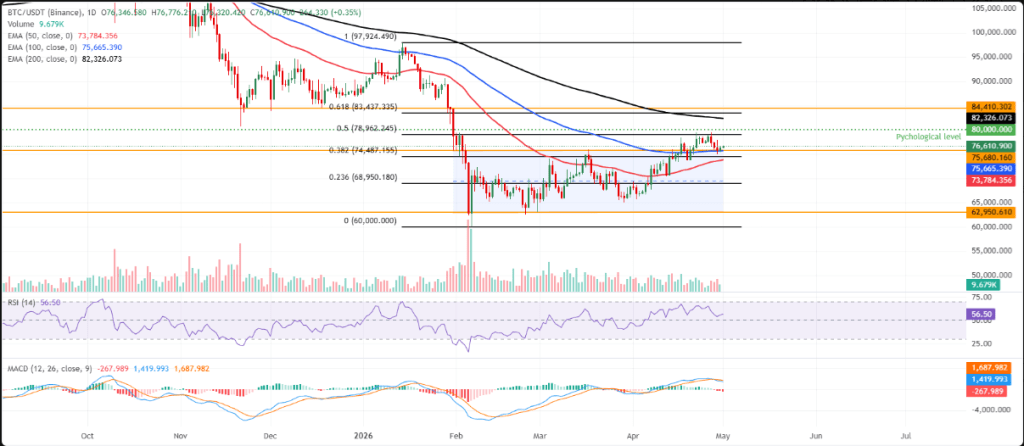
Bitcoin is trading around $76,600 on Friday, posting a modest rebound after finding support near a key zone in the previous session. The near-term outlook remains slightly bullish, with price holding above both the 50-day and 100-day EMAs, clustered just below $75,700 and aligned with a former channel top that now acts as immediate support around $75,680.
Momentum indicators paint a mixed picture. The daily RSI near 56 points to steady but not overbought strength, while the MACD remains below the zero line, indicating that the broader momentum backdrop is still somewhat weak despite the recent upside.
On the downside, immediate support lies near $75,680 and the 100-day EMA at $75,665. A deeper pullback could find demand around the 38.2% Fibonacci retracement at $74,487 and the 50-day EMA near $73,783.
On the upside, resistance is first seen at the 50% retracement level of $78,962, followed by the key psychological barrier at $80,000. Beyond that, a stronger supply zone emerges between the 200-day EMA near $82,326 and the 61.8% retracement around $83,437, just below a horizontal cap at $84,410, which could limit further gains.
Ethereum’s 50-day EMA remains firm, providing solid support.
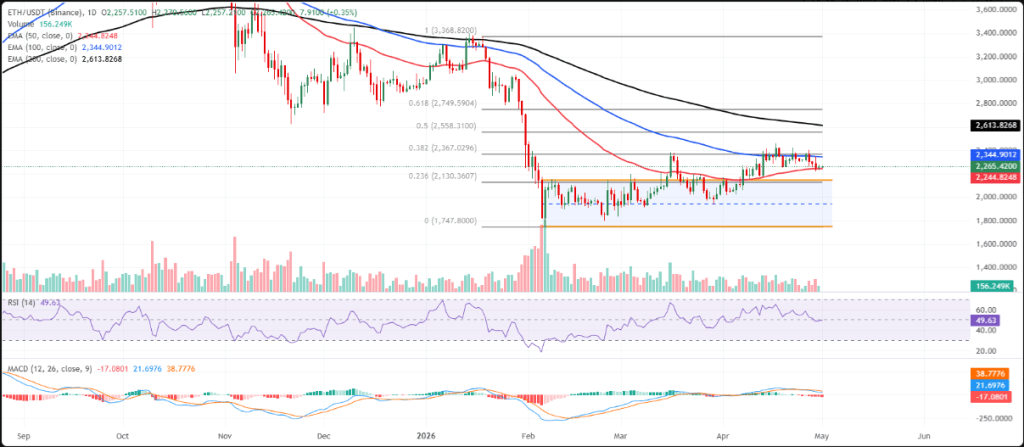
Ethereum is trading around $2,265 on Friday, holding just above its 50-day EMA at $2,244, though still facing resistance below the 100-day EMA at $2,344 and the 38.2% Fibonacci retracement at $2,367. This setup points to a neutral-to-slightly capped outlook, with price maintaining position above the former channel top at $2,148 but lacking the strength to push into higher resistance zones.
Momentum signals remain mixed. The daily RSI sits near 49, reflecting neutral conditions, while the MACD stays in negative territory, suggesting fading bullish momentum despite the short-term support holding.
On the downside, immediate support is located at the 50-day EMA around $2,244. Further support lies near the previous channel ceiling at $2,148 and the 23.6% Fibonacci retracement at $2,130. A break below this zone could expose the lower boundary of the channel near $1,747.
On the upside, resistance begins at the 100-day EMA at $2,344, followed by the 38.2% retracement at $2,367. A sustained breakout above these levels could pave the way toward the 50% retracement at $2,558, then the 200-day EMA at $2,613, with the 61.8% retracement at $2,749 as a longer-term target.
XRP price action remains weak, signaling continued bearish pressure.
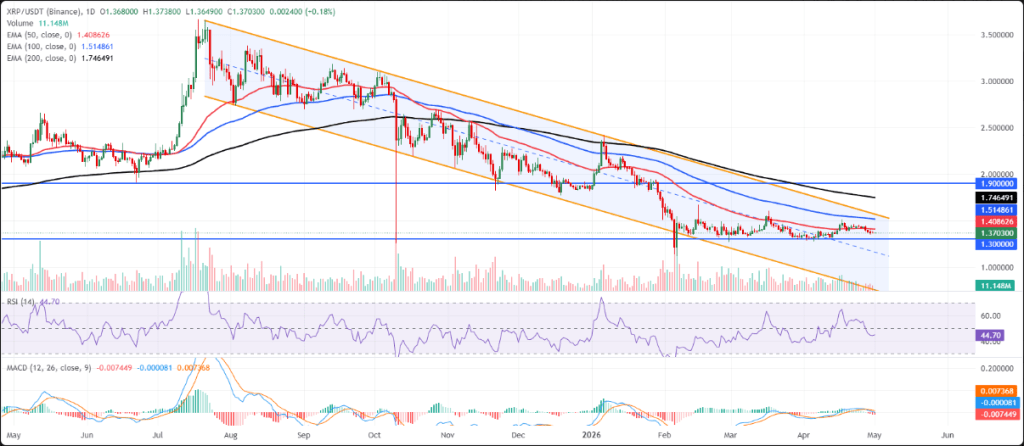
XRP is trading around $1.37 on Friday, continuing to show near-term weakness as it remains within a broader descending channel and below all major EMAs. The 50-day EMA at $1.40 acts as the closest resistance, with additional barriers at the 100-day EMA near $1.51 and the channel top around $1.56.
Momentum remains soft, with the RSI near 44 staying below the neutral level, while the MACD continues to trend deeper into negative territory—indicating that any short-term rallies may struggle to gain traction under current conditions.
On the downside, immediate support is seen around $1.30, a level that has previously attracted buyers. If selling pressure intensifies, the broader channel support near $0.75 could come into focus.
On the upside, a daily close above the 50-day EMA at $1.40 would be an early sign of stabilization. Further resistance lies at $1.51 and $1.56, and only a sustained breakout above these levels would begin to weaken the prevailing bearish trend, with $1.90 as a more distant resistance target.

Leave a comment