Bitcoin Reclaims Key Resistance as ETF Demand Returns
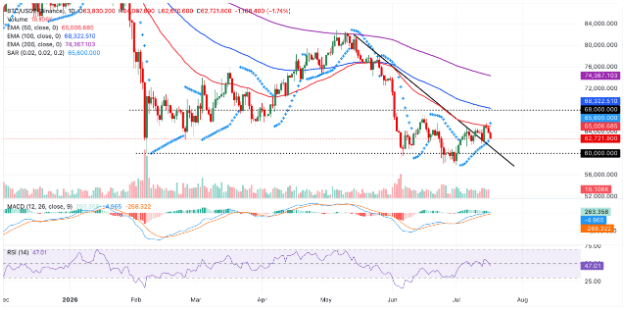
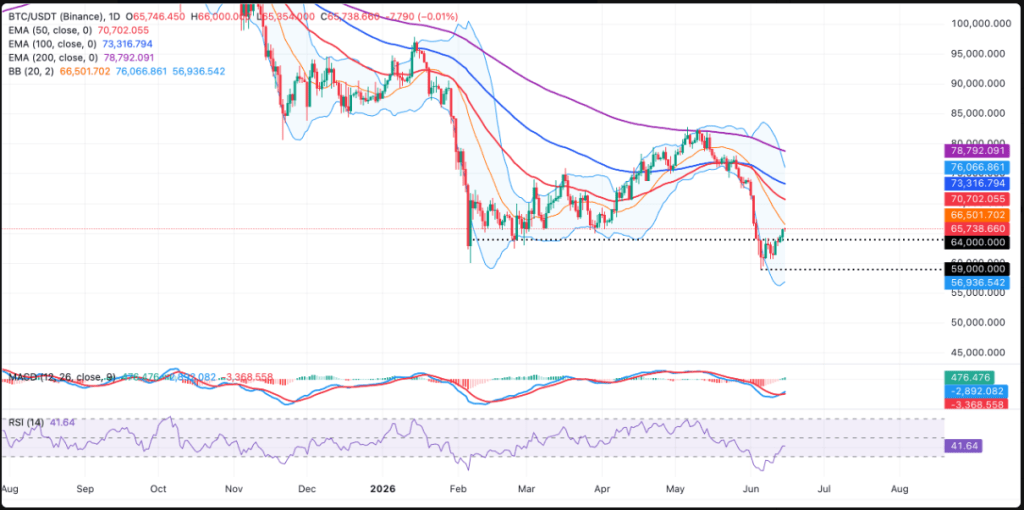
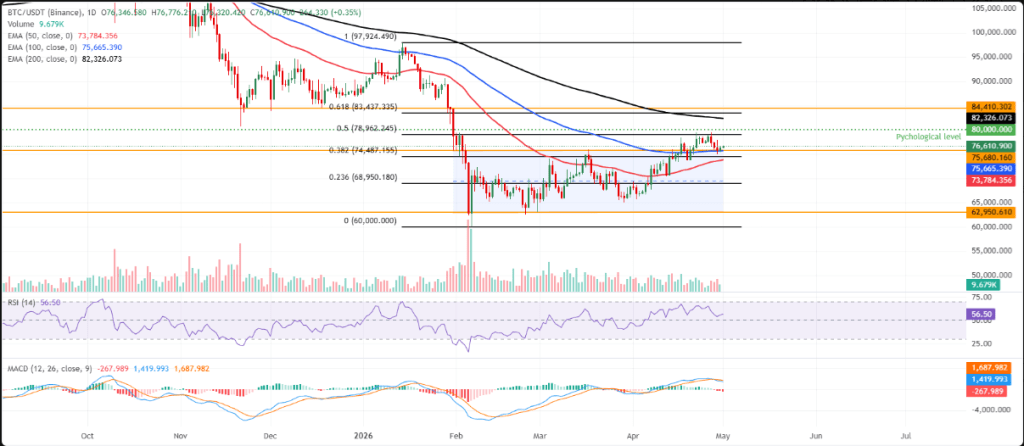
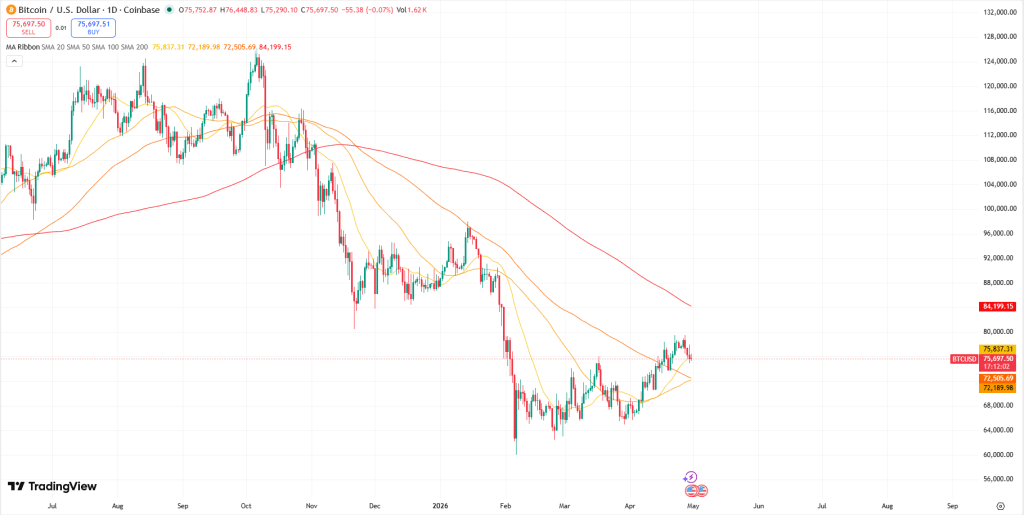
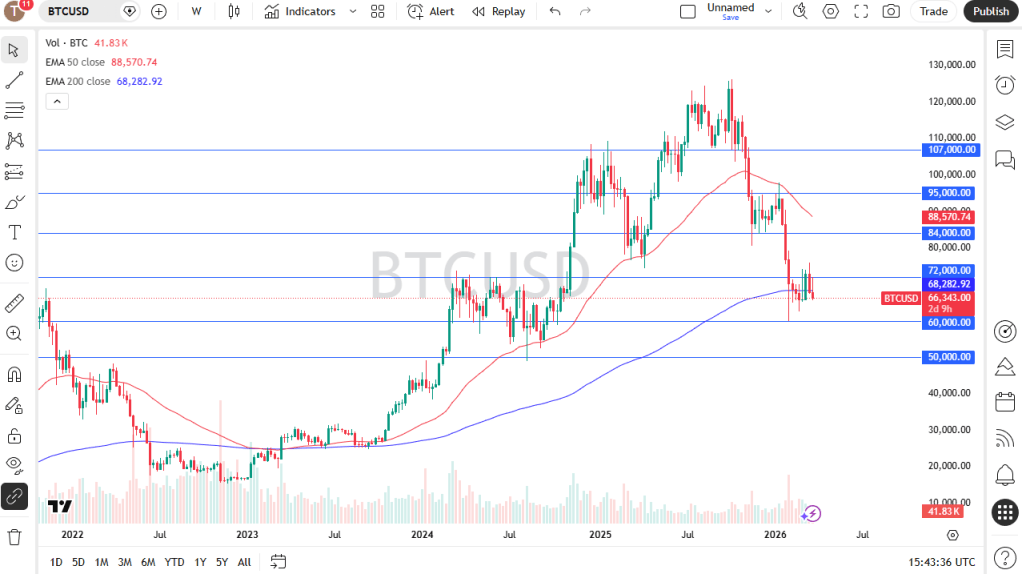
Bitcoin surged back above a critical resistance level that has defined trading over the past month, climbing to around $65,800, up 2.55% over the previous 24 hours after briefly topping $66,000. Trading volume exceeded $31 billion, helping extend its seven-day gain to 5% and pushing its 30-day return into positive territory at 2.44%. This marks Bitcoin’s first positive monthly performance since plunging to a 21-month low near $57,800 in late June.
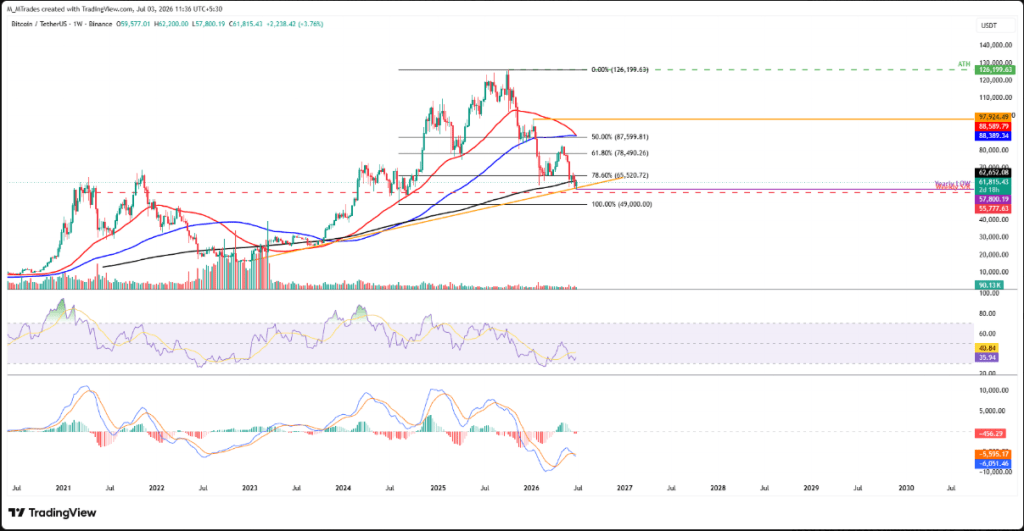
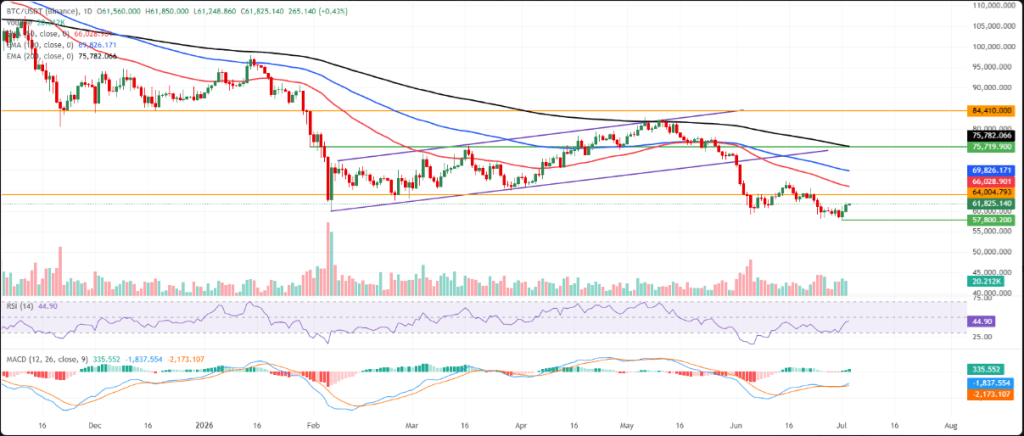
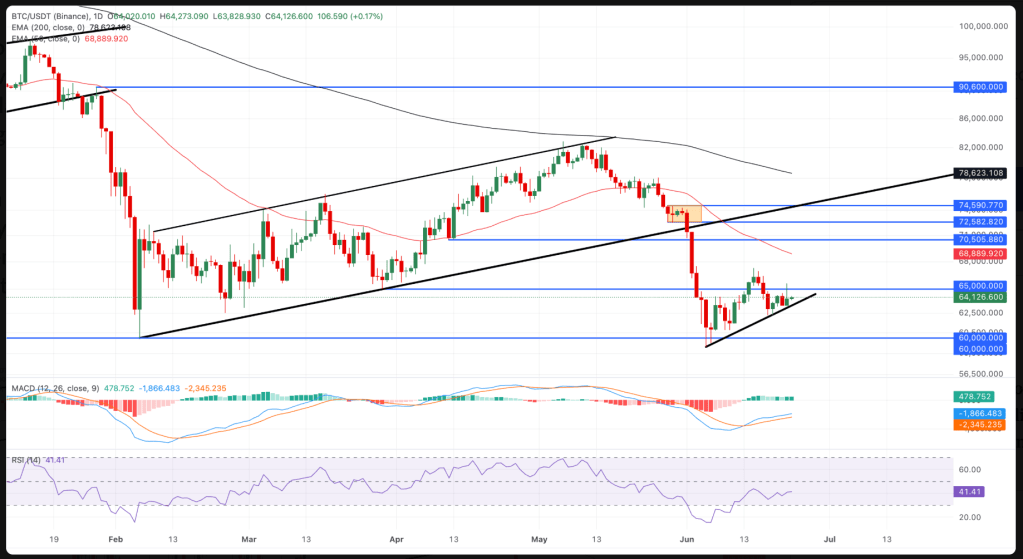
The recovery above $65,000 is significant because the level has acted as a major technical barrier throughout the month. Bitcoin spent weeks trading below its 50-month EMA around $65,150, with repeated rebound attempts failing to break through. Moving above this resistance and maintaining gains on stronger volume suggests that the intense selling pressure that drove prices lower may be fading. As a result, Bitcoin’s market capitalization has rebounded to approximately $1.3 trillion.
The rally was not driven by a single event but rather a combination of supportive factors. Spot Bitcoin ETFs recorded five consecutive sessions of net inflows, geopolitical tensions between the United States and Iran showed signs of easing, and exchange balances continued to decline as large holders reduced selling activity. Together, these developments created Bitcoin’s strongest 24-hour performance in more than a month.
A key theme behind the rebound is the return of demand through spot Bitcoin ETFs. Throughout much of 2026, weak ETF inflows limited Bitcoin’s ability to sustain rallies. The recent five-day buying streak has effectively reversed part of June’s sharp decline and could pave the way for a move toward $68,000, provided support levels hold.
However, risks remain. The Federal Reserve’s July 28–29 meeting could introduce fresh volatility, and Bitcoin is still down roughly 25% year-to-date. Earlier ETF inflow recoveries this year were often followed by renewed outflows after major macroeconomic events. While the breakout above $65,000 is encouraging, the next several trading sessions will determine whether it becomes a solid foundation for further gains or merely another temporary recovery.
ETF Inflows Provide the Fuel
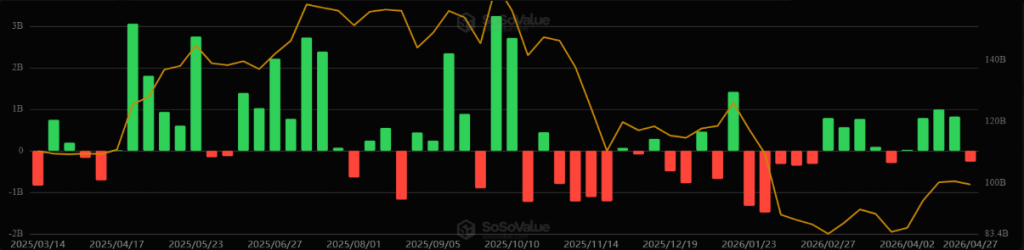
The main catalyst behind Bitcoin’s rebound has been the return of institutional demand through spot Bitcoin ETFs. The sector has now recorded its first five-day inflow streak since April, signaling renewed accumulation after months of persistent redemptions. For many market participants, the lack of ETF demand was the primary reason Bitcoin struggled to gain momentum throughout 2026.
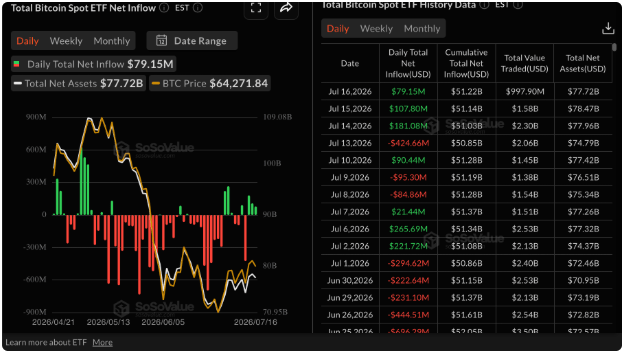
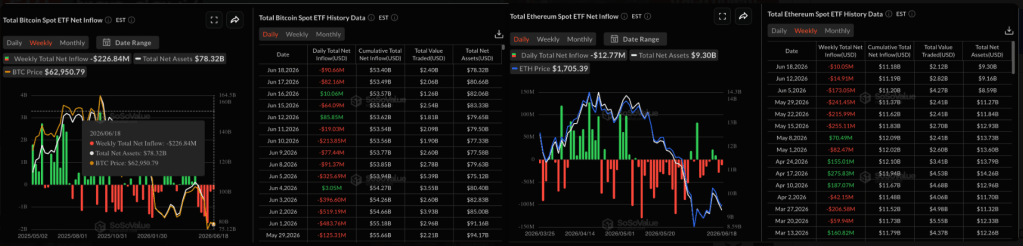
On Monday alone, US spot Bitcoin ETFs attracted approximately $227 million in net inflows. These inflows directly impact the spot market because ETF issuers must purchase physical Bitcoin to back newly created shares. As a result, ETF flow trends have become one of the most important drivers of Bitcoin’s price action.
The latest inflow streak also represents an important psychological shift. Earlier in July, a brief three-day inflow period totaling $510 million interrupted a damaging 10-day outflow streak of $2.73 billion. While that provided initial stabilization, the current five-day run has delivered enough buying pressure to push Bitcoin decisively above the key $65,000 resistance level.
Assets held across US spot Bitcoin ETFs have recovered toward $79 billion, while cumulative net inflows since their launch in January 2024 have risen to $51.63 billion. These figures highlight a recovery in investor confidence rather than a continuation of the previous downturn.
Since their introduction, spot Bitcoin ETFs have become one of the most influential sources of demand for the cryptocurrency, offering regulated access for institutional investors such as pension funds, wealth managers, and financial advisors. When ETF inflows are strong, Bitcoin benefits from a consistent source of buying pressure. When flows weaken, prices often struggle to find support. The recent five-day inflow streak has restored that demand, helping Bitcoin reclaim a level that had repeatedly capped previous rallies. The market’s focus now shifts to whether this momentum can survive upcoming macroeconomic events, particularly the Federal Reserve meeting.
IBIT Takes the Lead, Signaling Institutional Demand Is Back
Among all spot Bitcoin ETF flow metrics, the most closely watched indicator is which fund attracts the most capital. On Monday, the answer was clear: BlackRock’s IBIT led the market with $116 million in net inflows, a development widely viewed as a sign of renewed institutional participation rather than short-term speculative buying.
The distinction is important. IBIT is considered the strongest proxy for institutional positioning within the spot Bitcoin ETF market. Given its massive asset base, each dollar flowing into the fund typically translates into larger underlying Bitcoin purchases compared with smaller ETF competitors. When IBIT leads inflows, it suggests that long-term investors are accumulating exposure rather than traders simply buying a temporary dip.
The broader ETF picture also reflected widespread buying interest. IBIT attracted $116.5 million, while ARK 21Shares added $72.7 million, Fidelity brought in $24.1 million, Bitwise gained $8.8 million, Morgan Stanley’s offering received $6.9 million, and VanEck collected $1.8 million. Meanwhile, the two Grayscale products moved in opposite directions, with the legacy trust losing $45.4 million while the lower-fee version gained $41.4 million. Combined, these flows produced approximately $227 million in net inflows, helping Bitcoin break above the crucial $65,000 level.
The composition of the inflows matters as much as the total. Earlier in July, sessions led by Fidelity or ARK while IBIT continued to experience outflows were viewed as tactical positioning or retail-driven activity. In contrast, when IBIT became the leading recipient of inflows—such as the $209.4 million inflow on July 6 and the $116 million gain on Monday—the market interpreted it as a much stronger signal of institutional accumulation.
IBIT itself posted a 1.55% increase in net asset value during Monday’s session, reflecting Bitcoin’s rise in the spot market. Its influence on the ETF ecosystem is substantial. The fund accounted for nearly 79% of June’s record ETF outflows, making its return to positive flows particularly meaningful. Because of its size, IBIT has the ability to drive sentiment and liquidity across the entire ETF complex. For now, that influence is working in Bitcoin’s favor, although investors remain focused on whether the trend can continue through the upcoming Federal Reserve meeting.
June’s Selloff Created the Foundation for the Recovery
To appreciate why a $227 million inflow day is attracting so much attention, it is important to understand the scale of June’s decline. June 2026 became the worst month ever for spot Bitcoin ETFs, with approximately $4.5 billion leaving the sector, surpassing the previous record outflow of $3.56 billion recorded in February 2025. IBIT alone accounted for nearly 79% of those redemptions.
The asset decline was dramatic. Total assets held by spot Bitcoin ETFs fell from more than $104 billion in mid-May to roughly $77 billion at the height of the June selloff. At the same time, Bitcoin dropped from above $93,000 at the start of 2026 to around $60,000 by the end of June, briefly touching a 21-month low near $57,800.
Unlike previous crypto bear markets, this downturn was not triggered by failures within the digital asset industry. There were no major exchange collapses, stablecoin de-peggings, or systemic credit crises. Instead, the decline was largely driven by macroeconomic pressures, including a hawkish Federal Reserve and heavy institutional ETF outflows.
This difference is crucial because recoveries from macro-driven selloffs tend to be faster than recoveries from structural crises. The underlying infrastructure remained intact throughout the downturn; only investor positioning changed. As a result, the return of ETF inflows has the potential to reverse the damage more quickly than in previous cycles.
That is why the recent five-day inflow streak is viewed as more than just a short-term rebound. It suggests that capital which exited due to macroeconomic concerns may now be returning as those concerns begin to ease. Compared with a backdrop of record outflows and a 21-month price low, Bitcoin’s move back above $65,000 appears to be the early stages of a mechanical recovery driven by the same flows that fueled the selloff.

Bulls and Bears Remain Divided
The institutional outlook for Bitcoin remains sharply split. One camp has become increasingly cautious, with at least one major financial institution cutting its 12-month Bitcoin target from $112,000 to $82,000 on July 1. The bank also projected zero net ETF inflows over the next year, citing stalled cryptocurrency legislation in Washington and concerns about weak institutional demand.
This bearish view argues that the ETF demand engine that powered Bitcoin’s rise in 2024 and 2025 has fundamentally weakened. If that assessment is correct, then every inflow streak seen this year—including the current one—would represent a temporary bounce rather than the start of a sustained bull market.
The opposing camp believes the June correction effectively flushed out weak holders and that the return of IBIT-led inflows marks the beginning of a more durable recovery. Supporters of this view argue that the recent inflow streak has already halted the systematic selling pressure that drove Bitcoin to its lows.
A more moderate perspective compares Bitcoin ETF adoption to the historical development of gold ETFs. Under this framework, periods of strong gains are naturally followed by significant corrections before long-term growth resumes. From this viewpoint, Bitcoin’s recent volatility may simply be part of a broader maturation process rather than a sign of structural weakness.
Ultimately, the debate will be decided by ETF flows. If inflows continue beyond the Federal Reserve meeting and develop into a sustained multi-week trend, confidence in a stronger recovery could grow and higher price targets may return. If flows weaken again, the bearish argument that institutional demand remains fragile will gain credibility. For now, however, the recent five-day inflow streak has shifted momentum back toward the bullish side of the market.
Exchange Outflows and Whale Activity Strengthen the Bullish Narrative
Beyond ETF inflows, on-chain data is also providing evidence that Bitcoin’s recovery may have stronger foundations. In a single day, roughly $686 million worth of Bitcoin was withdrawn from Binance, Coinbase, and Bybit, a substantial exchange outflow that is typically interpreted as investors moving coins into long-term storage rather than keeping them on exchanges for potential sale. When exchange balances decline, the amount of Bitcoin readily available for selling decreases, creating a more supportive supply environment.
Another encouraging signal comes from whale activity. The Momentum Whale Inflow Ratio, which measures the amount of Bitcoin large holders transfer to exchanges, turned negative for the first time in 2026 after remaining positive for five consecutive months. A positive reading generally suggests whales are preparing to sell by moving coins onto exchanges, while a negative reading indicates reduced selling intent and fewer coins entering the market.
The shift is particularly notable because it breaks a pattern that persisted throughout most of the 2026 downturn. During the decline, large holders consistently supplied Bitcoin to exchanges, creating selling pressure that repeatedly capped recovery attempts. The recent negative reading suggests that major investors have become less active sellers, removing a key source of overhead supply.
When viewed together, ETF inflows and exchange outflows create a favorable supply-demand dynamic. ETF issuers continue purchasing Bitcoin in response to investor demand, while fewer coins remain available on exchanges for sale. This combination often creates conditions for stronger price advances, as reduced supply meets increasing demand. Such an environment likely contributed to Bitcoin’s ability to break above $65,000 and briefly test $66,000.
While these indicators remain constructive, they are not permanent. Whale behavior can change quickly, and exchange balances can rise again if investors decide to take profits. Nevertheless, current on-chain data points toward accumulation rather than distribution, supporting the possibility of a continued move toward $68,000 in the near term.
Improving Macro Conditions Helped Fuel the Rally
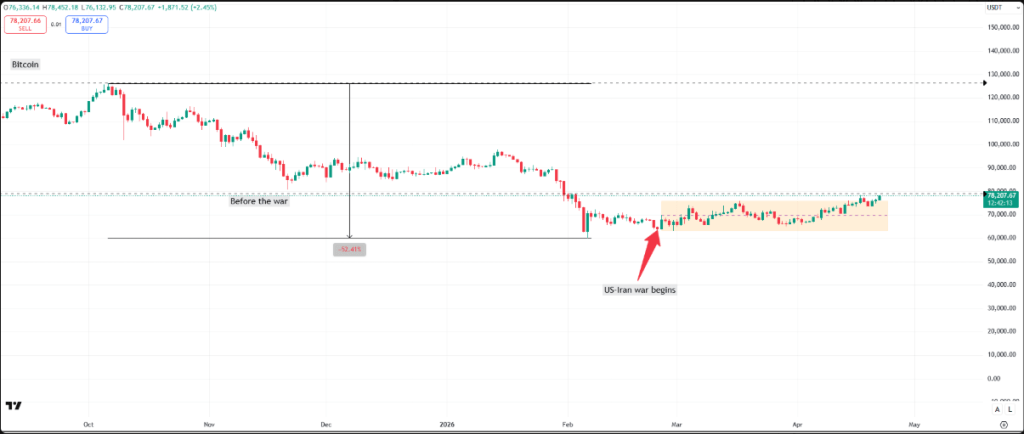
The broader macroeconomic environment also played an important role in Bitcoin’s recent rebound. Reports suggesting that diplomatic discussions between the United States and Iran could resume helped ease geopolitical concerns that had previously driven investors toward defensive assets. As tensions appeared to soften, capital flowed back into risk-sensitive markets, including equities, commodities, and cryptocurrencies.
The relationship between Bitcoin and traditional financial markets was evident during the rally. On the same day Bitcoin reclaimed $65,000, US equities also moved higher, supported by strong corporate earnings and renewed optimism in the technology sector. In risk-on environments, Bitcoin tends to behave similarly to high-growth assets, benefiting from improved investor sentiment.
The significance of this shift becomes clearer when compared with earlier periods of heightened geopolitical uncertainty. During previous escalations in US-Iran tensions, Bitcoin ETFs experienced substantial outflows, including a single-day withdrawal of approximately $424.7 million, highlighting how sensitive institutional flows have become to macro developments. As geopolitical risks eased, investor appetite returned and ETF inflows resumed.
This improvement in sentiment directly challenges one of the key bearish arguments for Bitcoin. Critics have maintained that institutional demand remains weak and that ETF inflows are unlikely to recover meaningfully. However, a sustained risk-on environment—supported by easing geopolitical tensions and resilient corporate earnings—could encourage institutions to reallocate capital toward risk assets, including Bitcoin.
At the same time, the geopolitical backdrop remains fragile. Any renewed escalation could quickly reverse the current trend, driving investors back toward traditional safe-haven assets and weakening demand for cryptocurrencies. As a result, the same macro conditions that have supported Bitcoin’s rebound also represent one of its greatest risks.
The Federal Reserve Remains the Biggest Near-Term Risk
Despite improving flows and sentiment, attention is increasingly turning to the Federal Reserve’s July 28–29 policy meeting, which many investors view as the most important event for Bitcoin’s near-term outlook.
Current market expectations suggest roughly a 70% probability that the Fed leaves interest rates unchanged, with only a small chance of a surprise policy move. While a rate cut appears unlikely, even a neutral decision could influence risk assets depending on the tone of the Fed’s communication.
The Fed has been a major factor behind Bitcoin’s weakness this year. June’s sharp decline occurred amid a combination of persistent ETF outflows and a central bank that showed little willingness to ease monetary policy. Higher interest rates generally reduce the appeal of speculative and growth-oriented assets, including cryptocurrencies.
The primary concern for investors is asymmetrical risk. A rate hold is largely priced into markets and may have a limited impact on its own. However, a more hawkish-than-expected message—or an unexpected rate increase—could trigger a sharp reaction across risk assets. Given Bitcoin’s high sensitivity to changes in investor sentiment, it would likely experience outsized volatility under such a scenario.
On the other hand, a more dovish tone could provide significant support. If the Fed acknowledges signs of moderating inflation and hints at a more accommodative policy outlook later in the year, the current risk-on momentum could accelerate. In that case, Bitcoin may have a clearer path toward $68,000 and potentially higher levels.
The period leading up to the Fed meeting is therefore critical. Bitcoin has already regained the important $65,000 threshold and briefly touched $66,000, supported by ETF inflows, improving macro sentiment, and favorable on-chain data. Whether those gains can be consolidated into a sustainable uptrend will likely depend on how markets position themselves ahead of the Fed decision and how policymakers ultimately shape expectations for the remainder of the year.
For now, ETF demand, declining exchange balances, and improving risk appetite provide support for the bullish case. However, the Federal Reserve remains the single most important variable that could either extend the rally or abruptly halt it.