Over the past two months, as highlighted in our previous update, Ethereum’s Elliott Wave structure has progressed in line with our long-term outlook, indicating that the broader fourth wave likely concluded earlier this year and that the fifth wave has now begun. Refer to Figure 1 below.
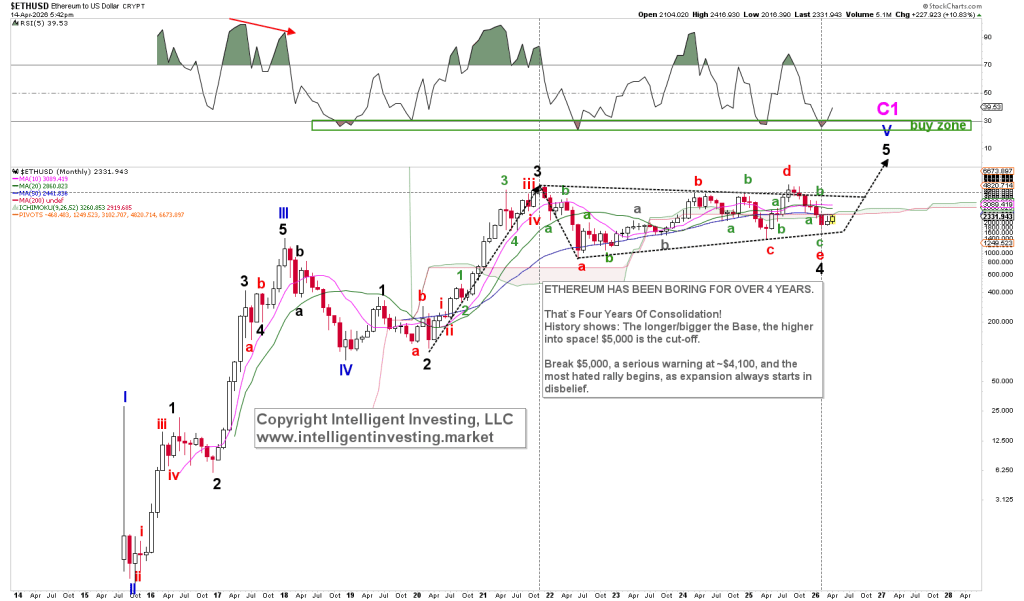
Figure 1. Ethereum’s Long-Term Elliott Wave Structure
In the near term, following the February low, the Elliott Wave structure points to the formation of a rare leading expanding diagonal as wave one—an uncommon yet bullish pattern that still needs a few more developments before it can be considered complete. Refer to Figure 2 below.
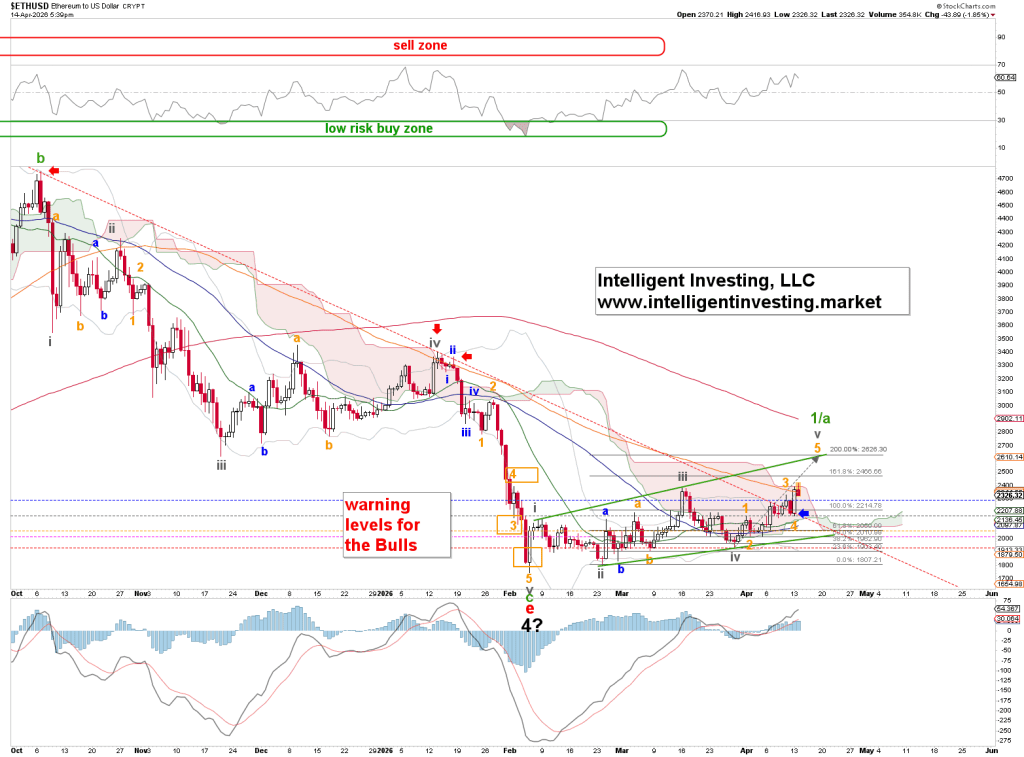
Furthermore, Ethereum has reclaimed its 20-day, 50-day, and 100-day Simple Moving Averages (SMA), while also breaking above the long-standing downtrend line that had limited gains since last October (blue horizontal arrow). This breakout adds confirmation to a strengthening bullish trend and boosts confidence in continued upside momentum.
Key resistance now lies at the upper boundary of the Ichimoku Cloud around $2,395. A decisive move above this level could open the path toward the gray 200% extension at $2,626, as well as the 200-day SMA, currently near $2,910 and declining by roughly $10 per day. At this pace, the 200-day SMA could converge with $2,626 within a month.
On the downside, bulls will want to see price remain above the former downtrend line, as a drop below it would signal a failed breakout. A further decline beneath the critical support at the March 29 low of $1,938 (marked as the red “final warning” level) would invalidate the developing bullish outlook.

Leave a comment