The BTC/USD pair has delivered several strong and technically reliable price swings in recent years, creating attractive trading opportunities for both investors and short-term traders.
As a result, market participants continue watching Bitcoin closely, anticipating another significant move ahead. However, Bitcoin’s recent climb to a fresh multi-month high lacked the strength and momentum seen in equities and other risk-sensitive assets during the same period. Combined with fading bullish momentum, this has raised questions about whether Bitcoin may be losing some of its long-standing market appeal, either temporarily or for a longer period.
One key reason traders are paying close attention now is that Bitcoin appears to be approaching a critical technical turning point. A closer examination of the chart shows bulls and bears are currently in near equilibrium. When price action compresses into a tightening consolidation phase like this, it often precedes a breakout that can trigger a stronger directional move, either continuing the existing trend or reversing it.
Additional factors adding to Bitcoin’s importance at the moment include:
- Uncertain price action in the US Dollar, suggesting Bitcoin’s own dynamics may drive the next move;
- Today’s US CPI inflation report, which could surprise markets and spark volatility.
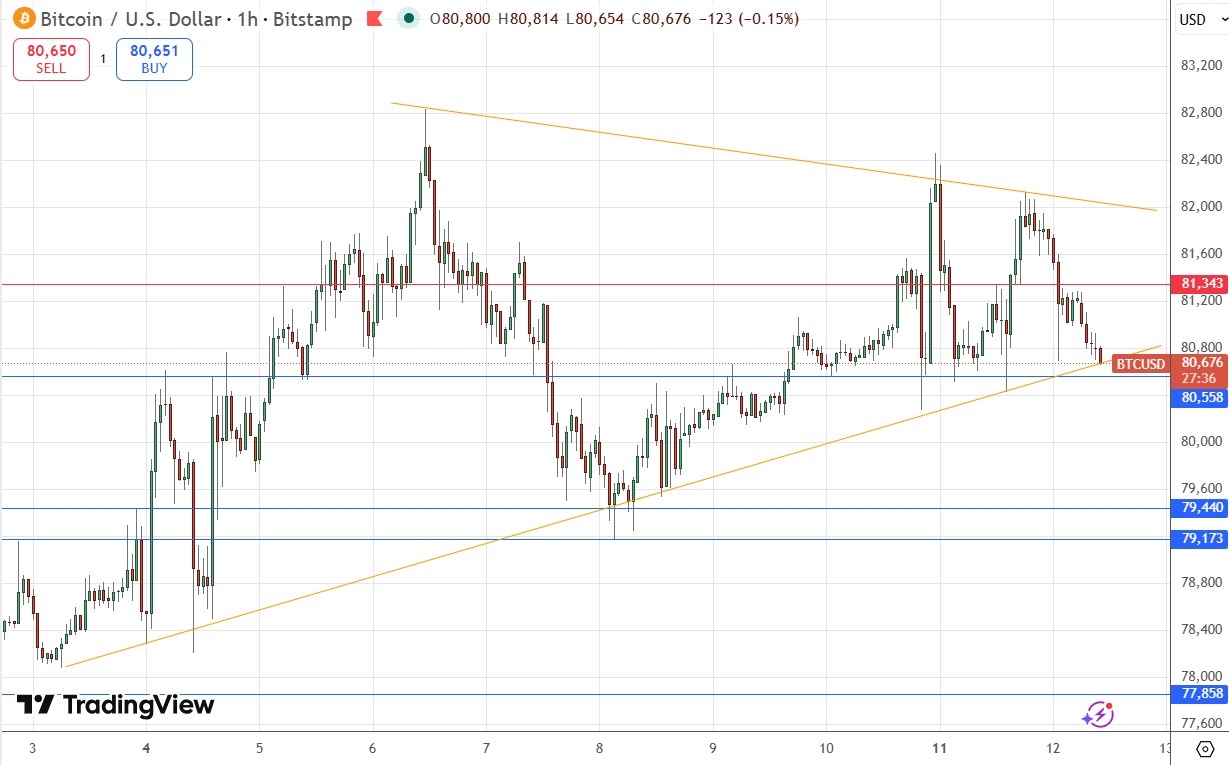
The clearest sign that Bitcoin may be nearing a decisive move is the formation of a narrowing triangle pattern on the chart. The converging trend lines connecting recent highs and lows indicate increasing indecision and the possibility of a breakout in either direction.
That said, the pattern is not perfectly symmetrical, which slightly weakens its reliability. The ascending support trend line is noticeably steeper than the descending resistance line, making the setup less balanced than a classic triangle formation.
Another technical aspect worth noting is that, despite some softness in the broader long-term uptrend, Bitcoin still maintains a meaningful bullish structure after recently reaching fresh multi-month highs. This could strengthen the argument for an upside breakout, particularly if the price manages to break above the recent swing highs and establish itself beyond the $82,500 level.
AUD/USD Technical Analysis
One of the clearest signs that AUD/USD may be approaching a pivotal move is the formation of a tightening triangle pattern on the chart. The converging trend lines connecting recent highs and lows highlight growing market indecision and suggest that a breakout in either direction could soon emerge.
While the pair has remained confined within this narrowing structure for several sessions, the setup is not a perfectly symmetrical triangle. The ascending support line is steeper than the descending resistance line, making the formation slightly uneven and therefore somewhat less reliable as a classic consolidation signal.
Another technical factor worth monitoring is the broader trend structure. Although the longer-term bullish momentum remains relatively modest, AUD/USD has still managed to post fresh multi-month highs recently. This underlying strength may increase the probability of an upside breakout, particularly if buyers succeed in pushing the pair above nearby swing highs and sustaining momentum beyond key resistance levels.
At the same time, traders should remain cautious ahead of major macroeconomic catalysts, especially US inflation data and broader US Dollar movements, as these could determine whether the pair breaks higher or reverses lower from the current consolidation zone.
Watch Closely for US CPI Inflation Data
The primary risk for USD-related currency pairs today is the release of the US Consumer Price Index (CPI) data, widely regarded as one of the most influential monthly indicators in the Forex market.
This inflation report has the potential to trigger sharp volatility, particularly if the figures differ significantly from market expectations. Current forecasts suggest annual inflation could rise from 3.3% to 3.7%. Any meaningful deviation from that estimate is likely to have a direct impact on the US Dollar’s direction.
For instance, if inflation prints at 3.9% or higher, traders may anticipate a more hawkish Federal Reserve stance, which could strengthen the US Dollar and push this currency pair sharply lower. On the other hand, a softer reading of 3.5% or below could weaken the Dollar and fuel a strong upside move in the pair.
During major economic releases like this, market sentiment can shift rapidly, often overpowering existing technical setups and making chart patterns temporarily less reliable.
Could the Triangle Pattern Lose Its Importance?
Today’s analysis is largely based on the expectation that a breakout from the current triangle formation could trigger a decisive — or at least tradable — move in Bitcoin. However, there are several reasons why this pattern may ultimately prove less significant than expected.
First, the broader market trend still leans bullish. For traders who prefer to follow the prevailing trend, or at least avoid trading aggressively against it, a downside break from the triangle could turn into a false breakout that quickly reverses higher.
In addition, the triangle itself is not an especially convincing formation. As noted earlier, the structure lacks the balance and symmetry typically associated with stronger consolidation patterns, which reduces confidence in its predictive value.
There are also major macroeconomic and geopolitical risks that could easily overpower technical signals. Today’s US CPI inflation data has the potential to create sharp volatility across financial markets, while any unexpected developments involving tensions between the United States and Iran could rapidly shift investor sentiment.
In situations like these, strong fundamental catalysts can drive price action straight through technical levels and chart patterns, making formations such as the current triangle temporarily irrelevant.
Outlook on BTC/USD
The key focus for Bitcoin today is likely to be the direction of the eventual breakout from the tightening triangle formation. The first trend line tested could become the market’s main decision point for the session.
If price reacts positively from the ascending support trend line with a strong bullish rebound, it may present an attractive long opportunity — particularly if the nearby support level around $80,558 is also firmly defended. Such a move would suggest buyers are still in control despite recent consolidation.
On the other hand, a rejection from the upper resistance trend line could create a favorable short setup, especially if the psychologically important $82,000 level is rejected at the same time. That combination would reinforce the possibility that bullish momentum is fading near resistance.
As price action remains compressed within the triangle, traders will likely watch closely for confirmation signals before committing to a directional move.
Today’s BTC/USD Trading Signals
- Risk per trade: 0.50%
- Trade validity: Positions should be opened before 5:00 PM Tokyo time on Wednesday.
Long Trade Setups
Consider long positions after a bullish price action reversal on the H1 chart following a test of the following support levels:
- $80,558
- $79,440
- $77,858
For risk management:
- Place the stop loss $100 below the most recent swing low.
- Once the trade gains $100 in profit, move the stop loss to breakeven.
- Secure partial profits by closing 50% of the position after the first $100 gain, while allowing the remaining portion to continue running.
Short Trade Setup
Consider short positions after a bearish rejection or reversal signal on the H1 timeframe following a test of:
- $81,343
Trade management guidelines:
- Set the stop loss $100 above the latest swing high.
- Move the stop loss to breakeven once the trade reaches $100 profit.
- Take profit on half the position after a $100 favorable move and leave the rest open for a larger potential move.
Identifying Price Action Reversals
Common reversal confirmations on the hourly chart include:
- Pin bars
- Doji candles
- Outside candles
- Engulfing candles with a stronger close
These candlestick formations can help traders confirm whether support or resistance levels are being respected before entering a position.
Key Events to Watch
There are no major Bitcoin-specific events scheduled today. However, broader market volatility could increase due to important US economic developments, including:
- US CPI inflation data release at 1:30 PM London time
- Later remarks and developments involving the Federal Reserve Chair
These events could significantly influence US Dollar strength and indirectly impact Bitcoin price action.

Leave a comment