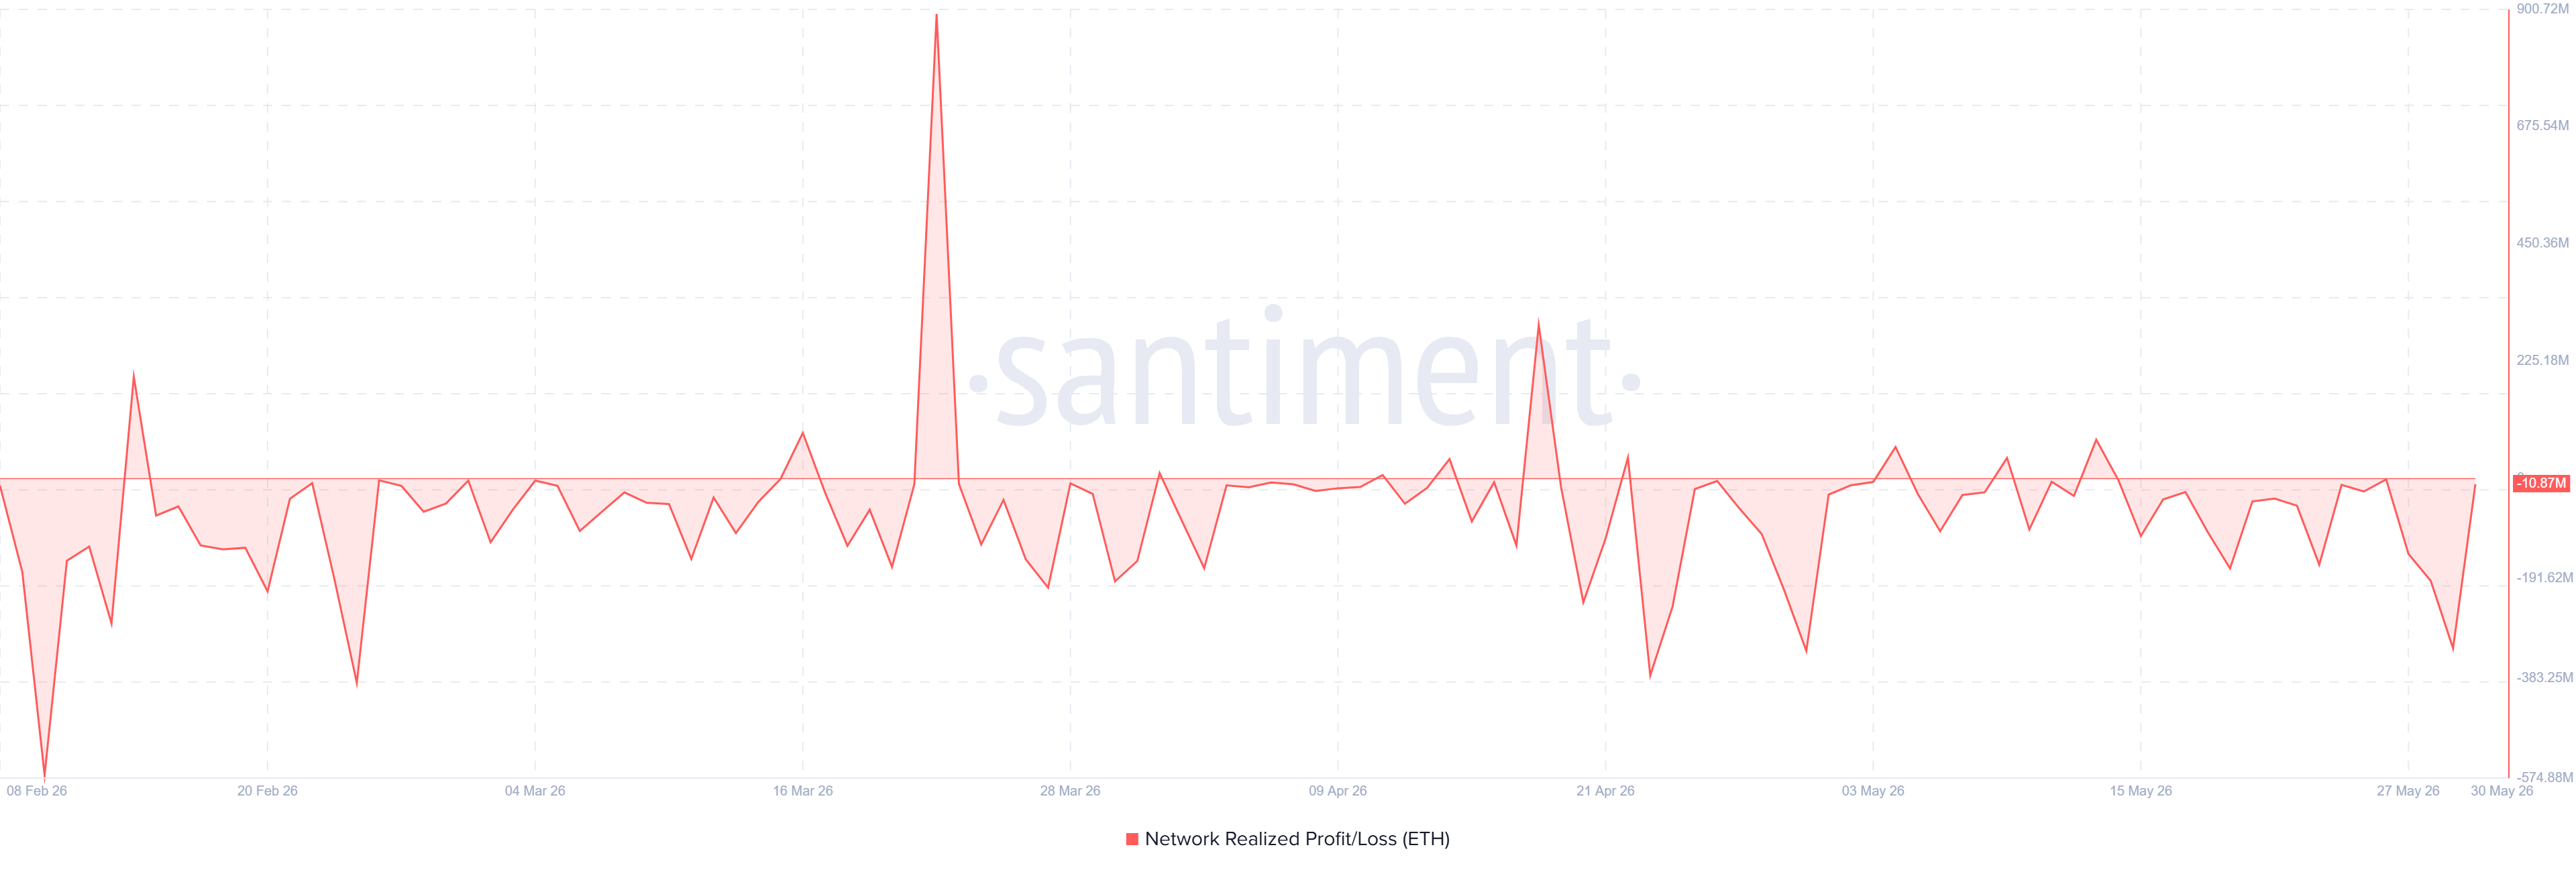
- Investors have continued to exit positions amid market weakness, realizing approximately $667 million in losses over the last three days.
- Risk reduction by institutional investors in the United States remains evident, with US spot Ethereum ETFs recording net outflows for 14 straight trading days.
- Although ETH has reclaimed the $2,000 mark, buying momentum remains subdued, suggesting that the recovery lacks strong conviction.
Following Ethereum’s (ETH) drop toward the key psychological support level of $2,000 in recent days, investors have increasingly realized losses.
Market participants have locked in approximately $667 million in losses over the past three days, marking the highest level of loss realization since early May.
This trend suggests that investors are continuing to sell amid market weakness, a sign of deteriorating sentiment that could increase the risk of further downside pressure on ETH prices.
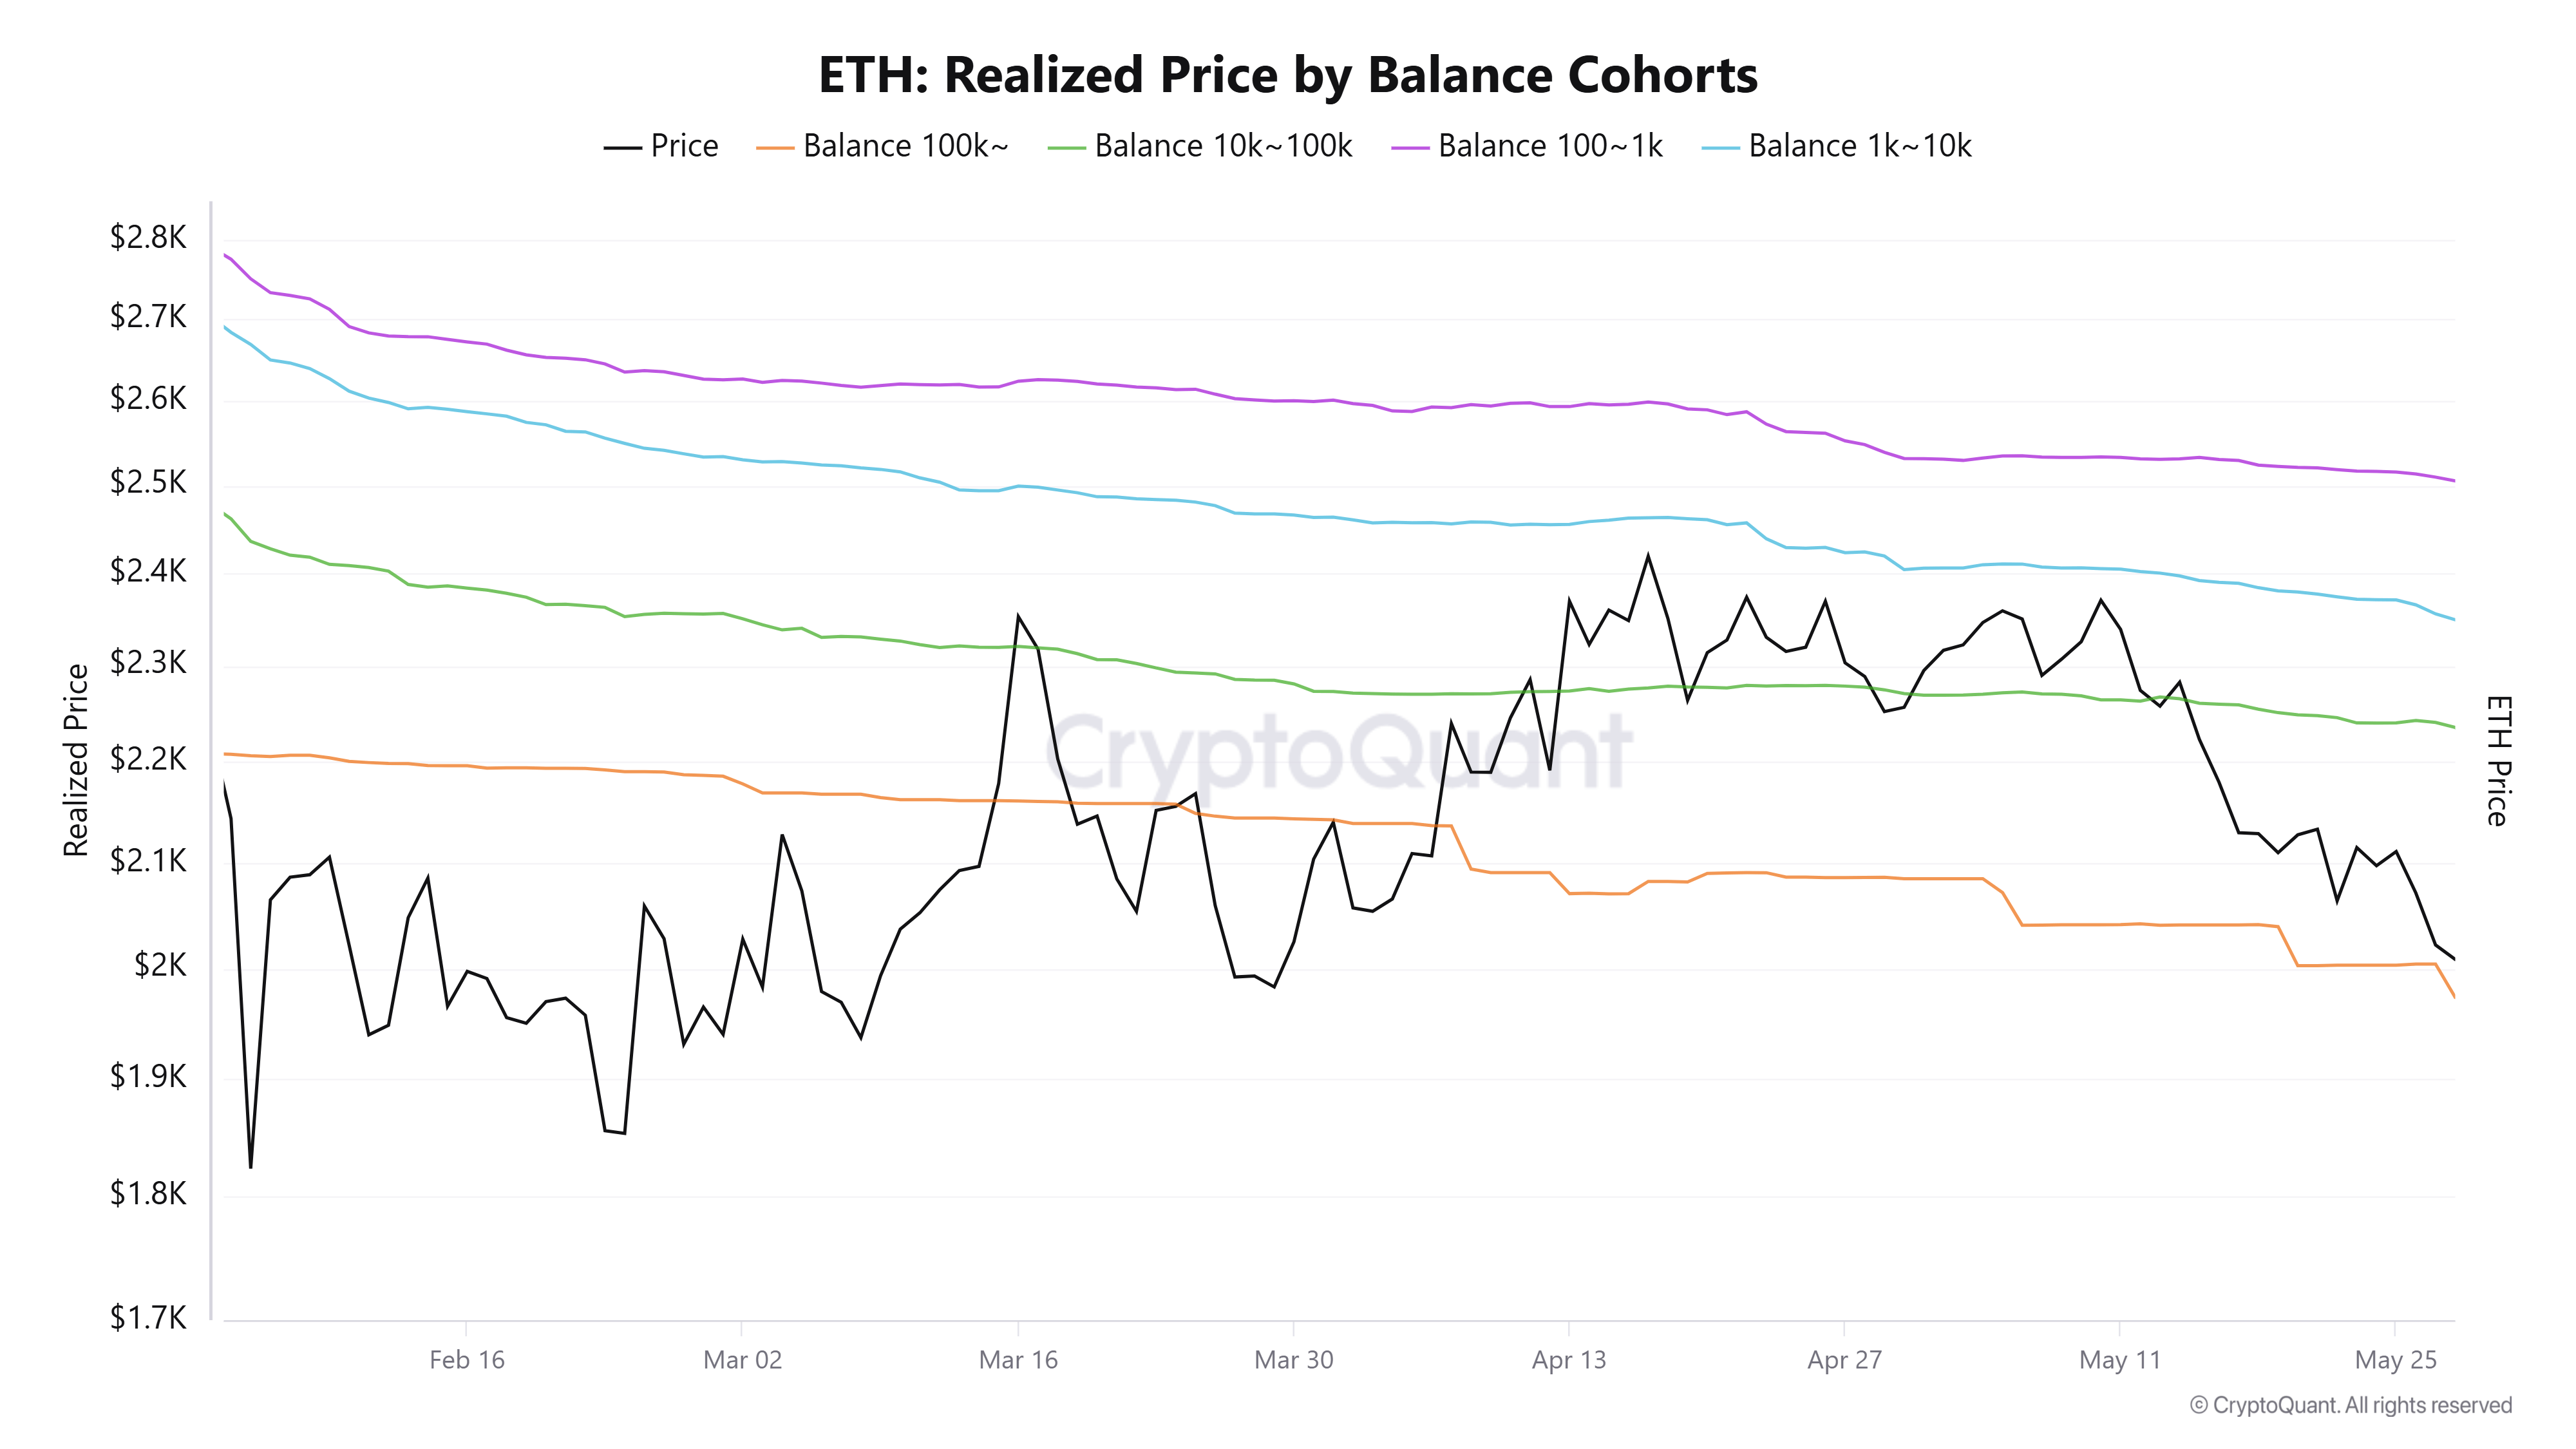
Notably, selling pressure intensified after buyers were unable to drive Ethereum above the realized price, or average on-chain cost basis, of retail investors. This level has acted as a major resistance zone over the past three months, highlighting a recurring pattern in which retail holders tend to sell when prices approach their break-even point. As a result, the failure to break above this threshold has reinforced bearish sentiment and contributed to the recent wave of selling.
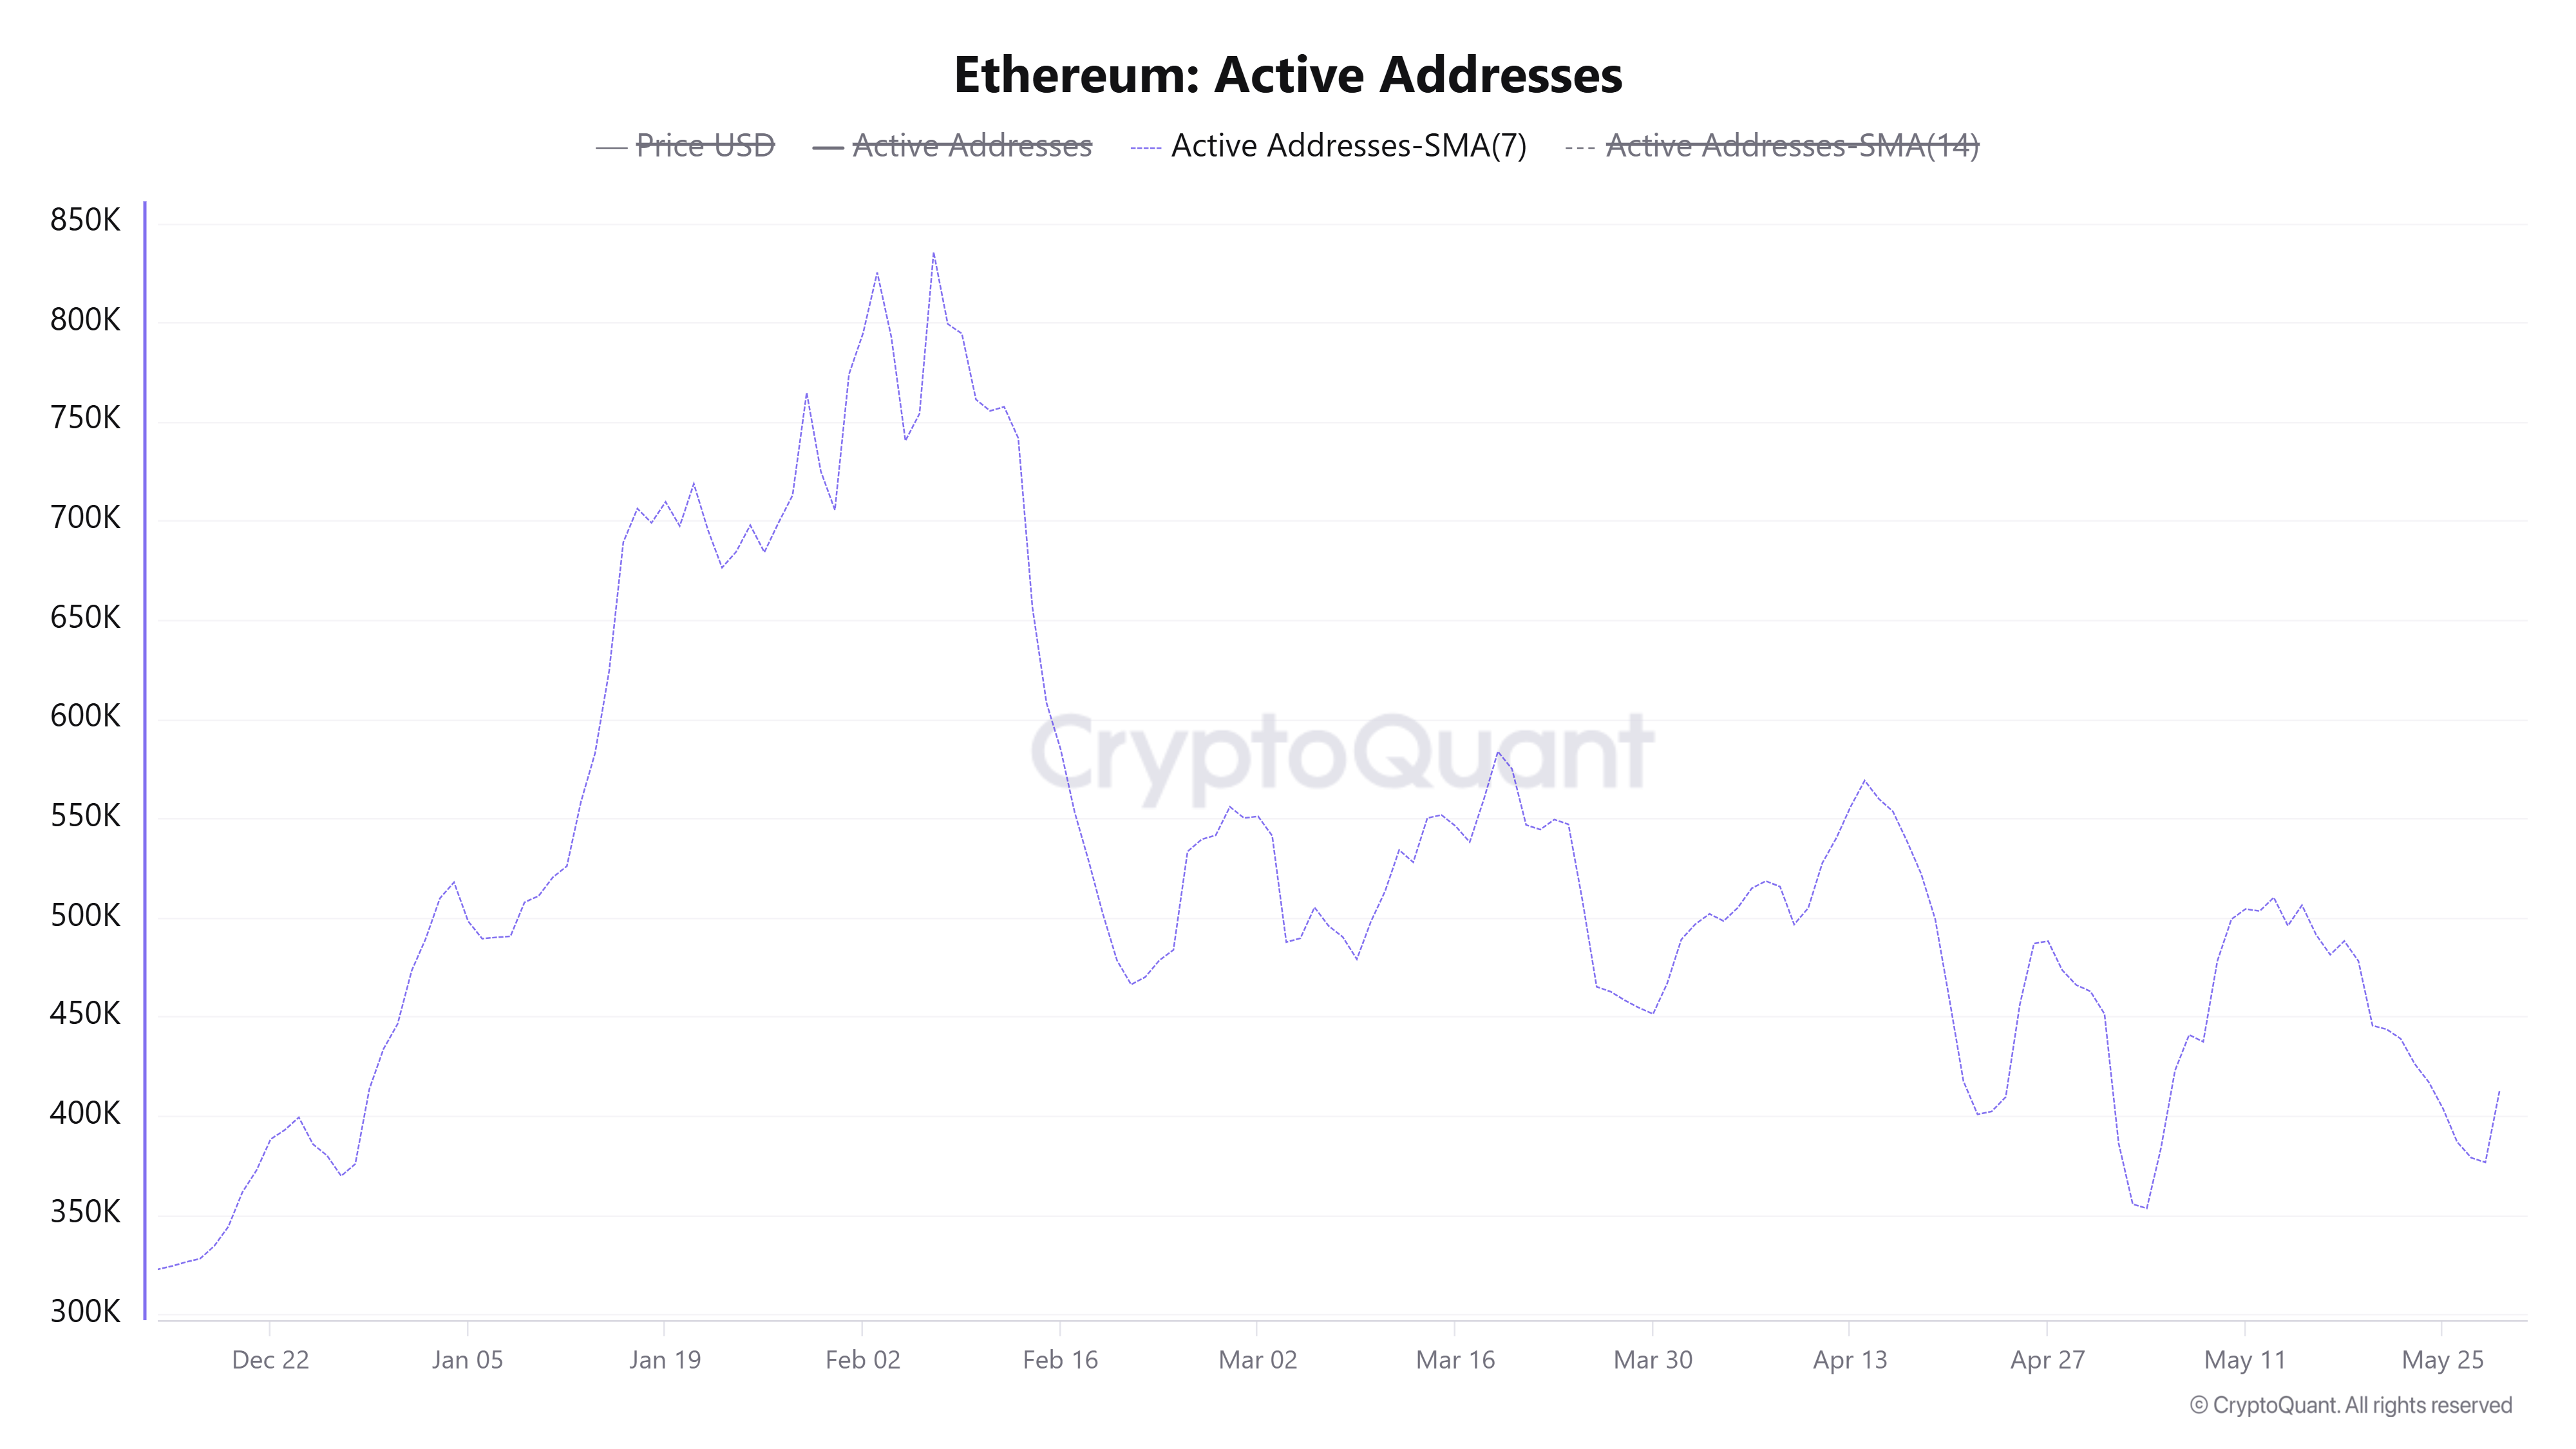
At the same time, network activity has continued to decline, with the number of active addresses nearing levels last recorded in early May. More significantly, this metric has fallen by nearly 50% since February, indicating a sharp slowdown in on-chain participation and weakening user engagement across the leading Layer 1 blockchain.
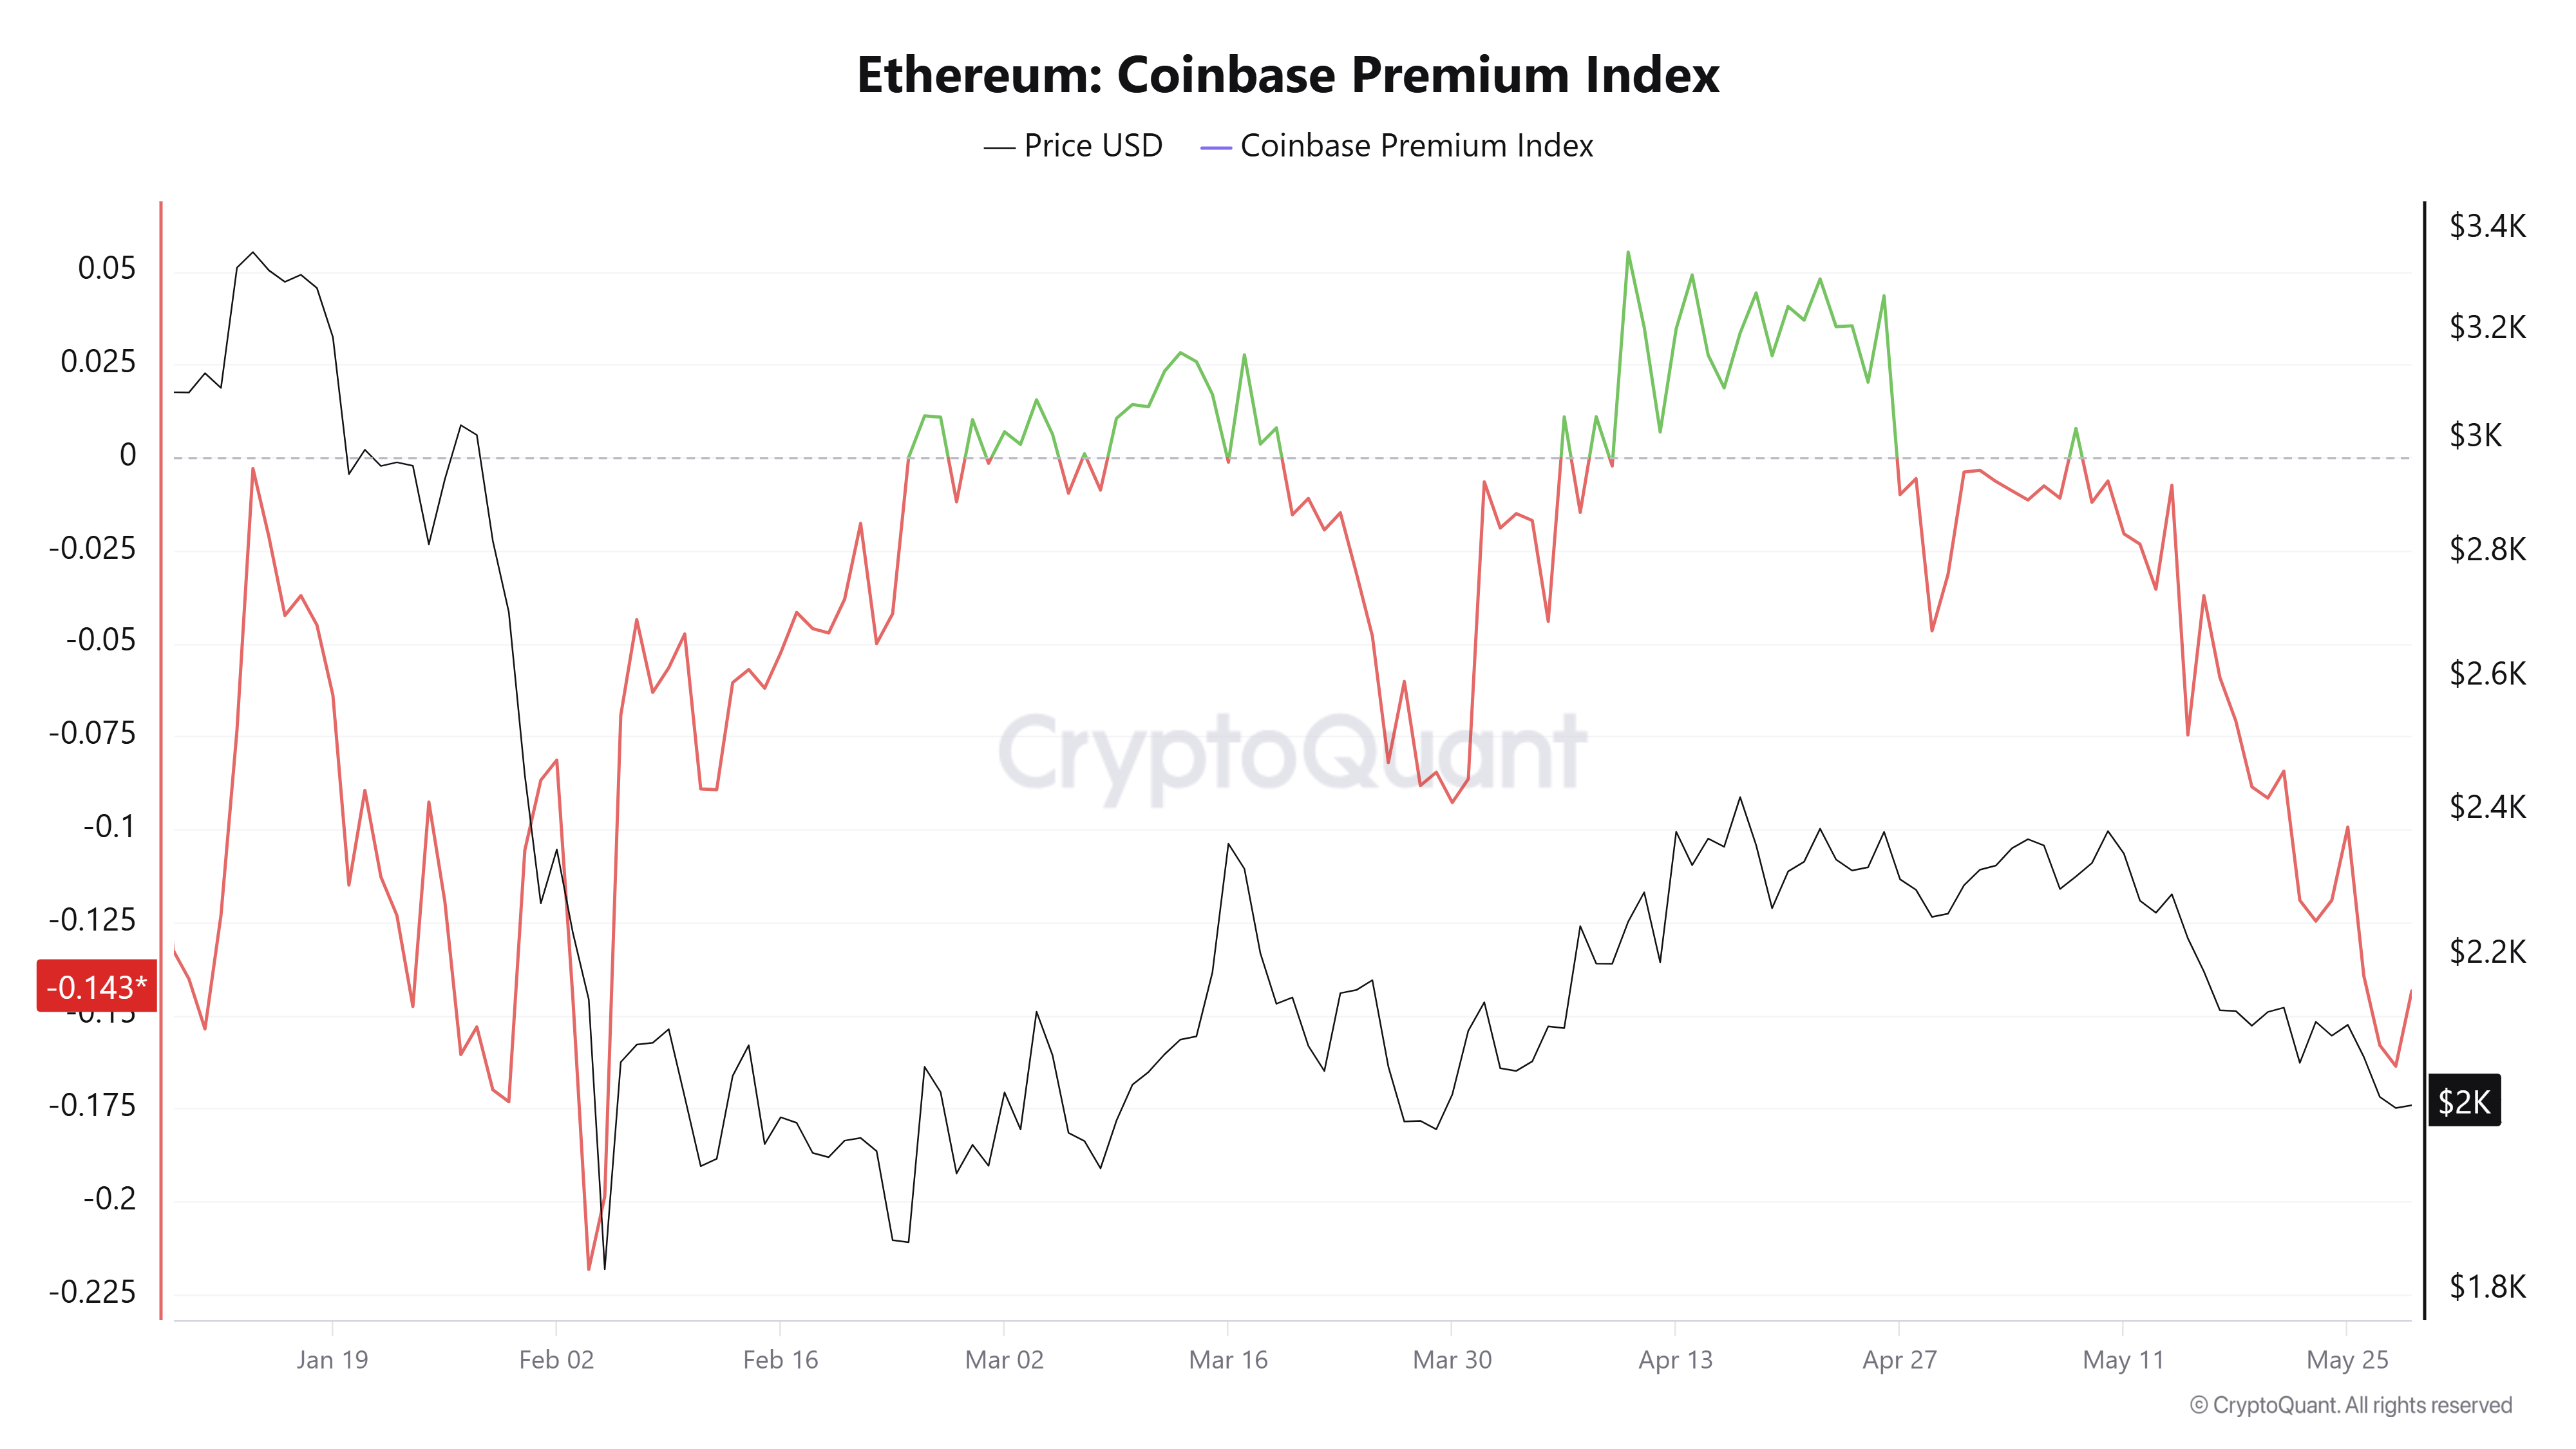
From a regional perspective, selling pressure has been largely driven by US investors, who continue to play a key role in influencing overall market sentiment. This trend is reflected in the Coinbase Premium Index—a gauge of US investor demand and sentiment—which has been on a steady decline since late April, signaling weakening buying interest and growing caution among American market participants.
Adding to the bearish outlook, US spot Ethereum ETFs recorded their 14th consecutive day of net outflows, underscoring a persistent risk-off stance among institutional investors in the United States.
One notable exception has been BitMine, which has continued to accumulate Ethereum, increasing its holdings to 5.39 million ETH.
In the derivatives market, open interest has kept rising and reached a new record high of more than 16 million contracts during the week, while funding rates have remained in positive territory. Despite these seemingly bullish signals, ETH prices have continued to decline, suggesting that a significant portion of the growing open interest may be coming from newly opened short positions. At the same time, some bullish traders appear to be either buying the dip or maintaining losing long positions, creating a divergence between derivatives activity and spot market performance. This combination points to growing speculative pressure and increases the likelihood of further volatility in the near term.
Ethereum Price Forecast: ETH Reclaims $2,000, but Upside Momentum Remains Limited
On the daily timeframe, Ethereum continues to exhibit a bearish short-term outlook, with the price trading below its 20-day, 50-day, and 100-day Exponential Moving Averages (EMAs). These indicators are clustered between $2,122 and $2,281, creating a strong resistance zone that is likely to limit any recovery attempts.
Momentum indicators suggest selling pressure is easing but remain far from signaling a bullish reversal. The 14-day Relative Strength Index (RSI) is hovering around 34, slightly above oversold levels, while the Stochastic Oscillator is gradually rebounding after reaching deeply oversold conditions.
On the downside, Ethereum’s first key support lies near $2,018. A decisive move below this level could open the door for a decline toward the next demand area around $1,909. If bearish pressure intensifies, additional support levels can be found near $1,741, followed by $1,524 and $1,404.
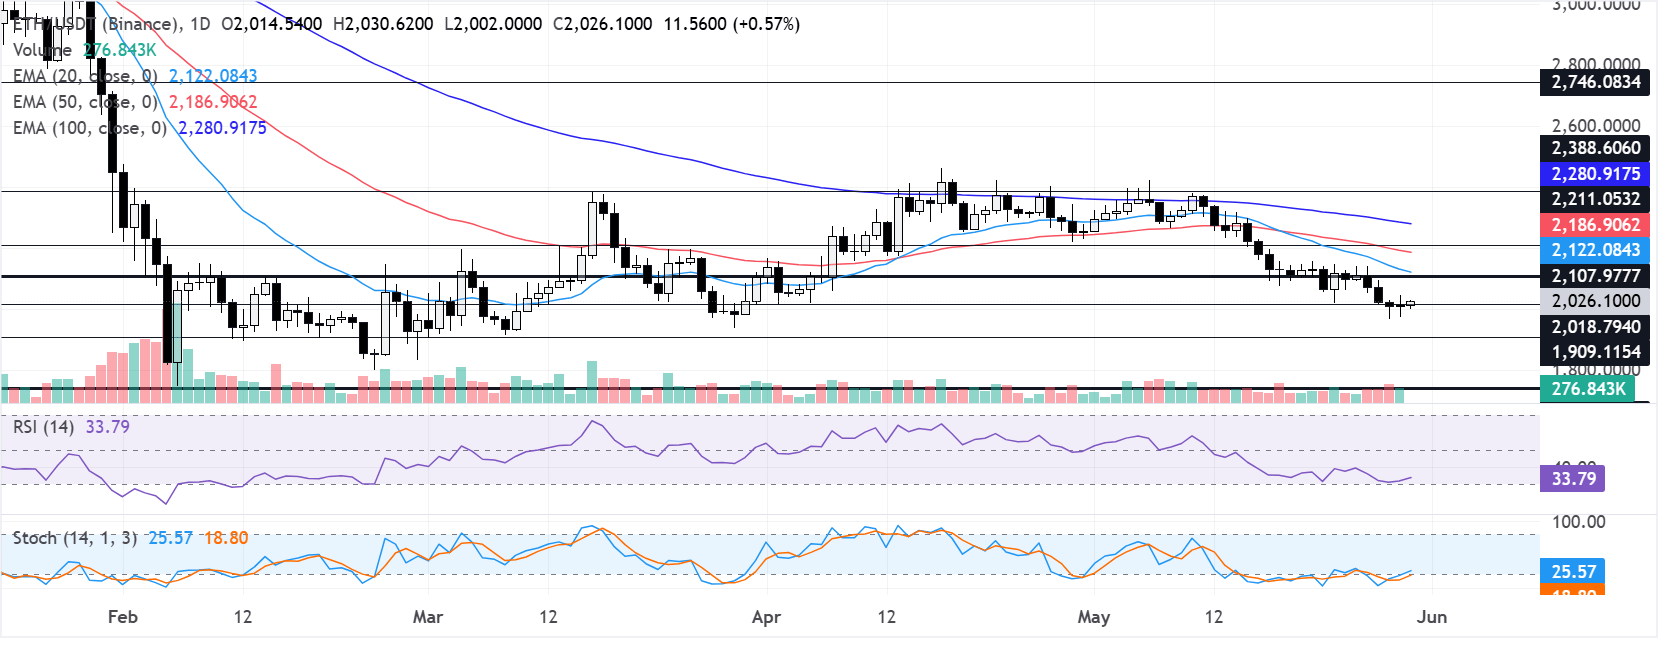
On the upside, Ethereum faces immediate resistance around $2,107, followed by the 20-day EMA at $2,122 and the 50-day EMA near $2,186. A decisive and sustained break above these levels would help reduce the current bearish bias and signal improving market sentiment.
Should buyers regain control, the next upside targets are located near $2,211, followed by the 100-day EMA at $2,280. Beyond that, ETH could challenge stronger resistance zones at $2,388, $2,746, and eventually $3,411, provided bullish momentum continues to build.

Leave a comment