DXY bulls remain cautious, avoiding aggressive positioning as they await greater clarity on evolving geopolitical risks.
Higher oil prices are stoking inflation concerns and reinforcing expectations of additional Federal Reserve rate hikes, providing support for the US Dollar.
The favorable fundamental environment indicates that any near-term pullbacks are likely to attract fresh buying interest.
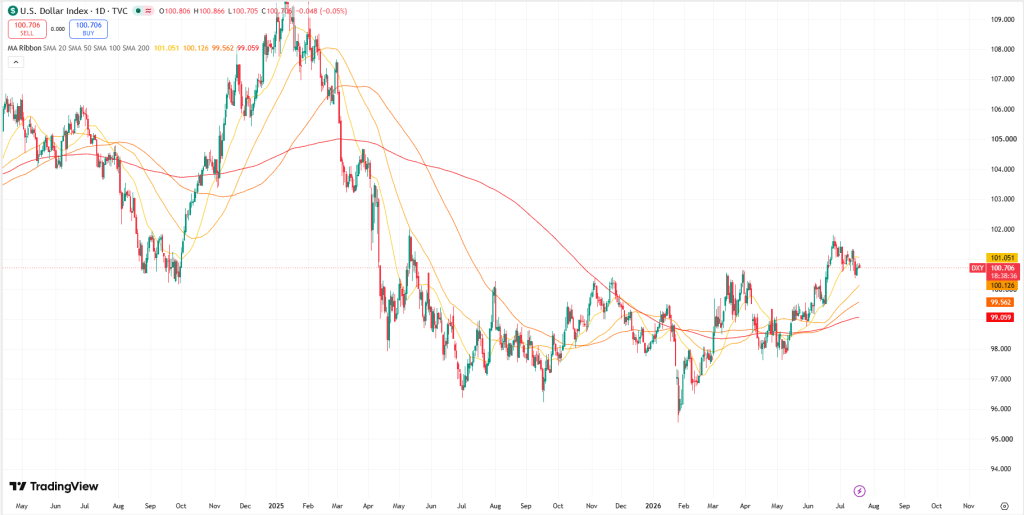
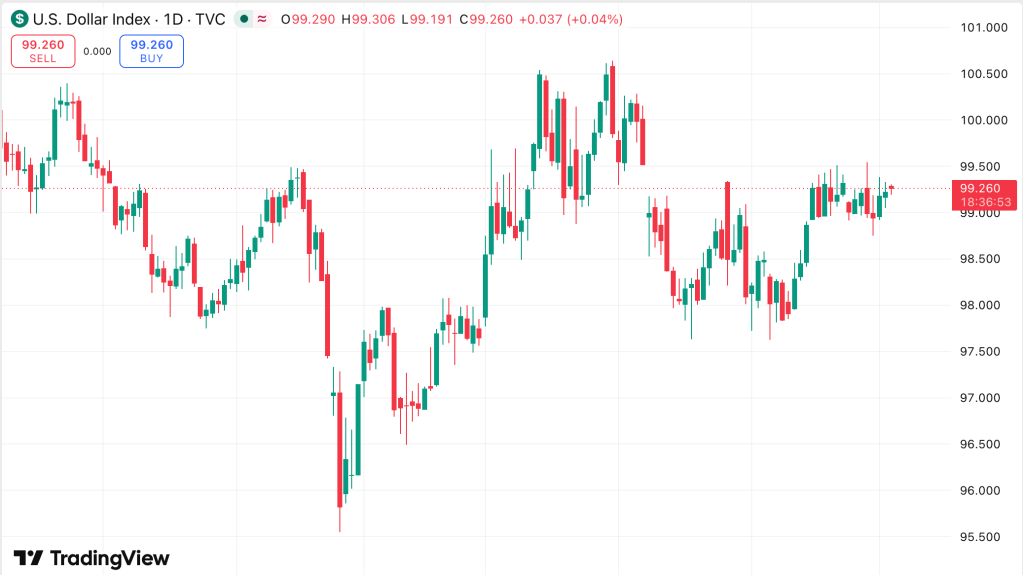
The US Dollar Index (DXY), which measures the Greenback against a basket of major currencies, is struggling to build on a modest uptick during Monday’s Asian session and is hovering near the 100.80–100.75 area, little changed on the day. Despite the subdued price action, the broader outlook remains supportive for the US Dollar as escalating US-Iran tensions and expectations of a more hawkish Federal Reserve continue to underpin sentiment.
The Middle East conflict intensified over the weekend after the United States carried out a ninth consecutive night of strikes against Iran, following reports of another American service member being killed in Iraq. President Donald Trump stated that the operation was conducted in response to recent US military casualties. Iran retaliated by launching ballistic missiles and attack drones at targets in Bahrain, Jordan, Kuwait, and Iraq, heightening fears of a wider regional conflict. The growing geopolitical uncertainty is encouraging investors to maintain a risk premium in markets, boosting demand for the US Dollar as a traditional safe-haven asset.
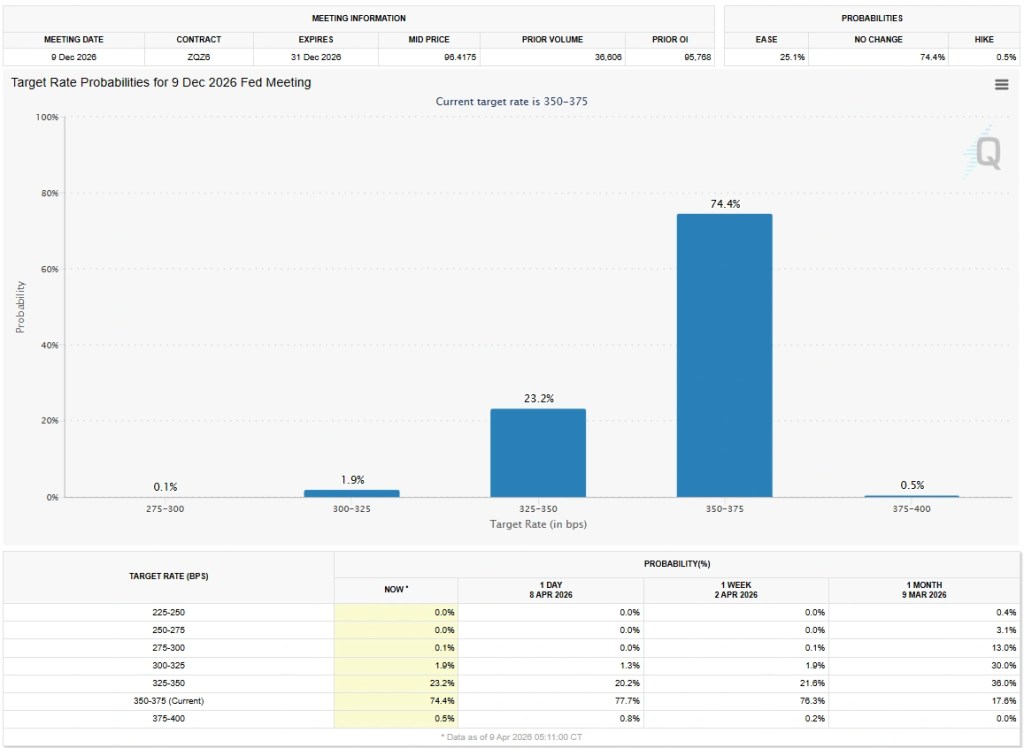
At the same time, crude oil prices have surged to their highest levels since June 12, driven by concerns over supply disruptions linked to the closure of the Strait of Hormuz and a US naval blockade of Iranian ports. The sharp rise in energy costs is reviving inflation worries and increasing expectations that major central banks, including the Fed, may need to keep monetary policy tighter for longer. Market pricing reflected in the CME FedWatch Tool continues to indicate the possibility of at least one Fed rate hike in 2026, reinforcing the constructive outlook for the Greenback and limiting downside risks for the DXY.
Looking ahead, the US economic calendar is relatively quiet on Monday, leaving the Dollar largely influenced by remarks from Federal Open Market Committee (FOMC) officials and developments in the Middle East. While geopolitical headlines are likely to remain a key source of volatility, the overall fundamental backdrop continues to favor the bulls, suggesting that any notable pullbacks in the DXY are likely to attract fresh buying interest.
Silver remains under pressure as escalating US-Iran tensions drive oil prices higher, stoking inflation concerns and reinforcing expectations of further Fed tightening.
Overnight US military strikes on Iran led Tehran to declare the ceasefire void, raising the risk of significant disruptions to global energy supply routes.
Cleveland Fed President Beth Hammack reiterated on Friday that inflationary pressures continue to persist.
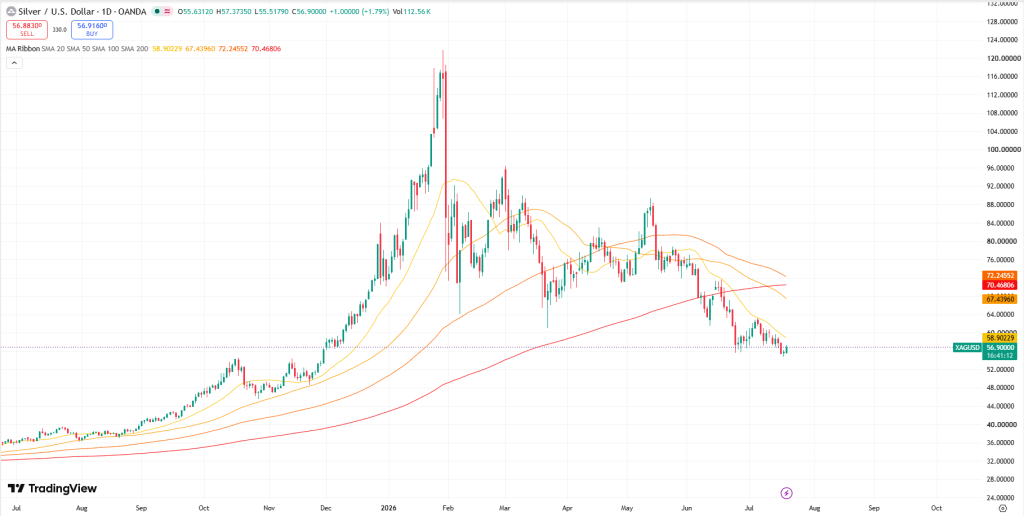
Silver prices (XAG/USD) extended their advance for a second straight session, trading near $56.80 per troy ounce during Monday’s Asian session. Despite the recent rebound, the precious metal may encounter headwinds as escalating tensions between the United States and Iran continue to push crude oil prices higher, reviving inflation concerns and strengthening expectations that the Federal Reserve could tighten monetary policy further.
The US has carried out a ninth consecutive night of strikes against Iranian-linked targets. In response, Tehran announced that the ceasefire arrangement between the two countries is effectively over, raising concerns about potential disruptions to key energy transit routes across the Middle East.
Regional tensions intensified further after Iran launched a new barrage of ballistic missiles and one-way attack drones targeting locations in Bahrain, Jordan, Kuwait, and Iraq, triggering air raid warnings across parts of the Gulf. At the same time, the US military confirmed the death of another service member, bringing the total to three casualties within two days.
The conflict has increasingly affected civilian infrastructure, with reports of damage to bridges, utility networks, and port facilities. Adding to concerns over energy security, Kuwait Petroleum Corp. stated that one of its oil installations was struck by an Iranian attack over the weekend.
Although investors largely expect the Federal Reserve to leave interest rates unchanged at its next policy meeting, market expectations for tighter monetary policy have increased. According to CME FedWatch data, traders are now pricing in a 61.4% chance of a rate hike in September, reflecting growing concerns that higher energy prices could reignite inflationary pressures.
Hammack highlights widespread inflation risks, supporting a hawkish Fed outlook
Cleveland Fed President Beth Hammack delivered a notably hawkish message, earning a 7.2/10 FXS SpeechTracker score, comfortably above the historical average of 6.6/10. Her remarks reflected growing concern that inflationary pressures remain entrenched across the economy. By stressing calls from businesses for stronger measures to contain rising prices and noting that many households continue to struggle financially despite solid economic growth and resilient consumer spending, Hammack underscored the disconnect between healthy economic activity and increasing cost-of-living challenges.
She also pointed to several sources of inflation pressure, including elevated energy costs, supply-chain constraints, rising insurance expenses, and growing demand linked to AI infrastructure and data-center investments. By identifying persistent inflation as the primary risk facing policymakers, Hammack’s comments reinforced expectations that the Federal Reserve may maintain a restrictive policy stance for longer, providing underlying support for the US Dollar.
Meanwhile, the FXS Fed Sentiment Index climbed 2.06 points to 128.64, signaling that overall Fed communication remains firmly tilted toward tightening and well above the neutral threshold of 100. Combined with Hammack’s above-average hawkish score, the increase suggests that policymakers continue to prioritize inflation control over concerns about economic growth, a backdrop that generally favors the Dollar against lower-yielding currencies.
Gold’s $4,000 Test Signals Interest Rates Are Overriding Safe-Haven Demand
Gold futures dropped to $4,008.80, down $43.00 (1.06%), after opening at $4,068.90, slightly above Wednesday’s close. Spot gold weakened even further, falling to $4,010.33 by 11:03 EDT, a daily loss of $57.22. After trading near $4,041 early in the session, bullion came under steady selling pressure throughout the day.
Gold’s recent performance reflects a sharp reversal in momentum. Prices have declined 5.25% over the past month, although they remain 20.89% higher than a year ago. Since reaching $4,121.05 on July 10, the metal has steadily retreated, ending that week around $4,100 before sliding to $4,013.64 on July 13 as it tested the $4,000 level. Today’s move marks yet another return to that critical support, with the June low resting at $4,002.
The repeated tests of $4,000 suggest the market’s focus has shifted. Rather than responding primarily to geopolitical uncertainty, gold is increasingly trading in line with interest rate expectations. Rising tensions between the United States and Iran have lifted oil prices, reinforcing inflation concerns and increasing expectations that the Federal Reserve could keep monetary policy tighter for longer. Higher real yields raise the opportunity cost of holding non-yielding assets such as gold, limiting the metal’s appeal despite heightened geopolitical risks.
The broader precious metals market reflects the same trend. Silver fell to $56.90, while August Comex silver futures declined more than 3% to $57.095. Platinum slipped to $1,656.30, and palladium dropped to $1,295.75, highlighting broad-based selling across the sector as markets reassessed the outlook for inflation and interest rates.
Although softer-than-expected U.S. inflation data briefly supported gold by reducing expectations of an imminent Fed rate hike, the relief proved short-lived. As oil prices surged on renewed Middle East tensions, inflation concerns quickly resurfaced, sending gold back toward $4,000. The swift reversal from a CPI-driven rally to an oil-driven selloff illustrates the dominant theme shaping the 2026 gold market: interest rate expectations now carry more weight than traditional safe-haven demand.
War Is Hurting Gold Through Oil, Not Supporting It as a Safe Haven
The current weakness in gold reflects a market driven more by interest rate expectations than traditional safe-haven demand. The transmission mechanism is straightforward: military escalation raises concerns over crude oil supply, pushing energy prices higher. More expensive oil feeds into headline inflation, strengthening the case for the Federal Reserve to keep interest rates elevated—or tighten further. Higher real yields increase the opportunity cost of holding non-yielding assets like gold, encouraging institutional investors to reduce exposure.
Rather than acting as a catalyst for safe-haven buying, geopolitical tensions are being interpreted primarily through their impact on inflation and monetary policy.
That dynamic explains why gold has continued to decline despite intensifying conflict in the Gulf. Investors are viewing the risk surrounding the Strait of Hormuz as an interest-rate story: higher oil prices support higher bond yields and a firmer U.S. dollar, reducing gold’s appeal. The conflict itself remains significant, but the market is responding through the inflation channel instead of the traditional flight-to-safety narrative.
Oil prices continue to reinforce that view. Brent crude trades around $84.63, up 6.39% over the past month and 21.74% from a year ago, while WTI crude remains above $80 after rallying more than 11% in three sessions. Recent U.S. strikes on Iranian targets and Iran’s retaliation against American military bases across the Gulf have heightened concerns over energy supplies.
The sequence of events also helps explain the sharp swings in sentiment. A Memorandum of Understanding signed by Iran and the United States on June 17 had raised hopes for improved relations, including the easing of sanctions on Iranian oil exports and reduced disruption around the Strait of Hormuz. Those expectations unraveled on July 6, when attacks on commercial shipping prompted military retaliation, placing the agreement under severe strain.
The contrast with earlier in the year is notable. Gold rallied during the February escalation but has fallen during the July conflict because the macro backdrop has changed. Earlier, geopolitical risks boosted demand for defensive assets. Today, the same risks are reinforcing expectations of tighter monetary policy, fundamentally altering the market’s response.
A reversal remains possible but would likely require either a prolonged disruption to shipping through the Strait of Hormuz that sparks a genuine flight to safety or a deterioration in global growth severe enough to drive bond yields lower. Reports that Tehran remains open to renewed negotiations reduce the likelihood of either scenario in the near term, leaving interest rate expectations as the dominant force weighing on bullion.
Gold Has Fallen 28% From Its Record High
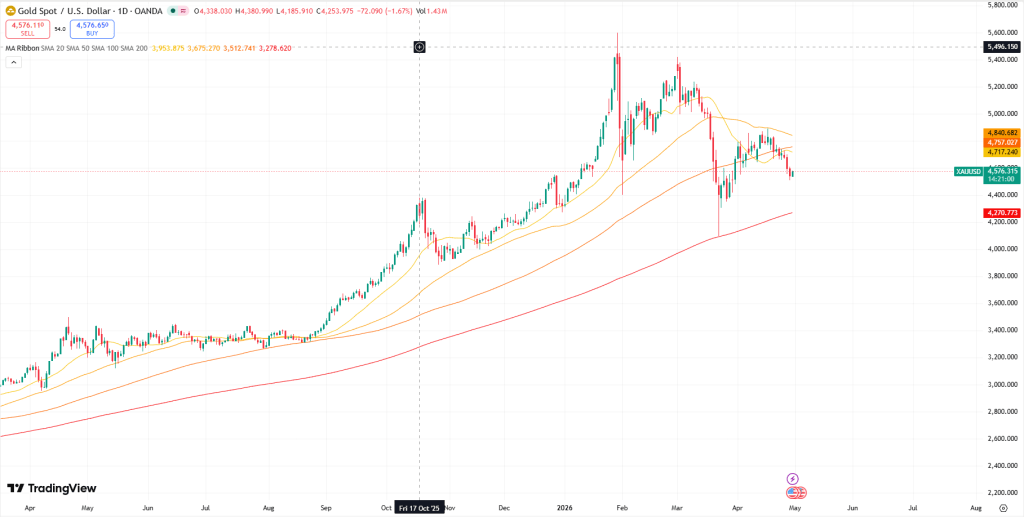
Gold has retreated dramatically from its January 29 record of $5,589 per ounce to approximately $4,008.80, a decline of 28.3%, or $1,580, in less than six months.
The rally earlier this year was extraordinary. Gold surged above $5,000 for the first time, briefly touched $5,595 intraday, and established multiple all-time highs before suffering a historic reversal. After peaking in late January, prices traded sideways through much of the first quarter before breaking sharply lower in March. A modest rebound in April eventually gave way to another steady decline toward the $4,000 area, with June’s low at $4,002.
Despite the correction, the longer-term picture remains relatively resilient. Gold is down roughly 7% year-to-date but still trades nearly 21% above year-ago levels and remains about $578 above its 2025 year-end close of $3,431. In that context, the decline represents a significant retracement of an exceptionally rapid rally rather than the complete breakdown of the longer-term bullish trend.
However, the technical landscape has changed. Analysts previously viewed the $4,550 region—formed by late-December highs and early-2026 support—as a major floor. That level failed during March’s selloff and now sits roughly $460 above current prices, removing an important layer of technical support.
Heavy Liquidation Intensified the Selloff
The decline was amplified by two major liquidation waves rather than a gradual reassessment of gold’s long-term value.
The first came immediately after January’s record highs, when gold plunged nearly $1,200 in just two trading sessions, marking its steepest two-day decline since 1983. The second occurred in March, when prices fell roughly 13%, producing the worst monthly decline since 2009. In both cases, rising interest-rate expectations linked to higher energy prices overshadowed gold’s traditional role as a defensive asset.
Despite the sharp correction, Wall Street remains broadly constructive. A Reuters survey of analysts projects a 2026 median gold price of $4,746.50 per ounce, the highest consensus forecast since the poll began in 2012. With gold currently near $4,009, prices remain roughly 15.6% below that consensus estimate.
Liquidity dynamics also played an important role. During periods of market stress, institutional investors often sell their most liquid holdings to meet margin calls or raise cash quickly. Gold’s liquidity makes it a frequent source of funding, creating a paradox in which a traditional safe-haven asset can come under heavy selling pressure precisely when uncertainty rises.
That behavior was evident on March 4, when the SPDR Gold Shares (GLD) experienced approximately $2.91 billion in net outflows in a single session—the largest daily withdrawal in more than a decade. Combined with profit-taking from investors who benefited from gold’s rapid rise earlier in the year, those outflows accelerated the correction. As momentum traders exited, ownership shifted toward longer-term investors whose buying tends to be steadier but less aggressive, leaving the market without the speculative demand that previously fueled the rally.
Rising Real Yields Continue to Undermine Gold
The surge in U.S. Treasury yields has become one of the primary headwinds for gold. The 10-year Treasury yield climbed to 4.60% on Thursday, approaching the two-month high of 4.62% reached on July 13, as investors increasingly positioned for another Federal Reserve rate hike.
The key driver is real yields—bond yields adjusted for inflation expectations—rather than nominal interest rates alone. As expectations for tighter monetary policy increase, real yields rise, making income-generating assets more attractive relative to gold, which offers no yield. Conversely, when markets anticipate fewer rate hikes or eventual easing, real yields typically decline, improving gold’s relative appeal.
That dynamic briefly supported bullion after June’s softer inflation data. Consumer prices fell 0.4% month over month, the largest monthly decline since April 2020, while annual CPI eased to 3.5% and core inflation held at 2.6%. Producer prices also slipped 0.3%, marking their first monthly decline in nearly a year as energy costs retreated. Gold initially benefited from the weaker inflation readings.
However, the rally proved short-lived as stronger economic data quickly shifted attention back to the Fed. Retail sales remained resilient despite lower fuel prices, while initial jobless claims fell to 208,000, a two-month low, reinforcing confidence in the labor market. Those developments strengthened expectations that the Federal Reserve could still tighten policy later this year. Interest-rate futures currently imply roughly a 44% probability of a September rate hike, down from 50% a day earlier but still keeping additional tightening firmly on the table.
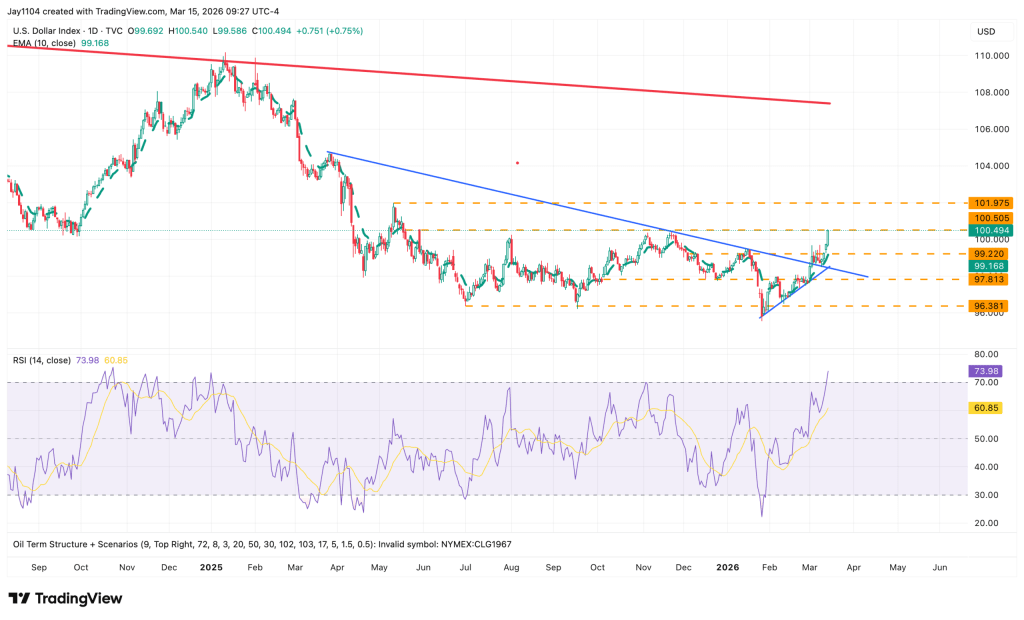
A stronger U.S. dollar has added further pressure. Supported by higher Treasury yields and a resilient U.S. economy, the Dollar Index remains near 100.49. Earlier in 2026, a weaker dollar helped propel gold to its record high of $5,589, but the recent rebound in the greenback has reversed that tailwind.
History, however, offers a note of caution. Gold has often performed well after Federal Reserve rate increases, averaging gains in the month following a 25-basis-point hike during several previous tightening cycles. The decisive factor is not the hike itself but whether tighter policy ultimately slows economic growth enough to push yields lower.
A More Hawkish Federal Reserve Has Increased Uncertainty
Since taking office as Federal Reserve Chair in May 2026, Kevin Warsh has adopted a notably less predictable communication strategy. During congressional testimony in mid-July, he followed a June Federal Open Market Committee meeting that left rates unchanged but shifted the policy outlook in a more hawkish direction.
One notable feature of the June meeting was Warsh’s decision not to publish his own interest-rate projection in the Fed’s dot plot. Combined with the removal of explicit forward guidance, the move increased uncertainty around future monetary policy and made it more difficult for markets to anticipate the Fed’s reaction function.
Markets currently expect the July 28–29 FOMC meeting to end with rates unchanged, assigning roughly a 90% probability to a hold. Nevertheless, investors continue to see September as a realistic opportunity for another rate increase.
The broader policy backdrop also remains restrictive. The World Gold Council (WGC) expects at least one Federal Reserve rate hike in 2026 while anticipating additional tightening by the Bank of England, Bank of Japan, and European Central Bank. Simultaneous tightening across several major central banks reduces the currency-diversification advantages that previously supported gold.
The macroeconomic outlook remains relatively stable, with global growth projected around 2.9%, U.S. growth near 2.1%, U.S. inflation peaking around 3.9%, and global inflation averaging 4.3% during 2026. Under those conditions, elevated real yields continue to reduce the incentive to hold gold.
The primary upside risk for bullion would be a sharper-than-expected economic slowdown. According to Bank of America’s June fund manager survey, 58% of respondents expect stagflation. Should tighter monetary policy significantly weaken growth, declining yields could eventually restore support for gold.
The World Gold Council Sees Gold Near Fair Value
The World Gold Council’sMid-Year Outlook 2026, titled Point Break, values gold using a framework based on real yields, inflation expectations, the U.S. dollar, and central-bank demand. Under its baseline macroeconomic scenario, the model estimates fair value near $4,100 per ounce, with a tolerance range of roughly ±5%, implying a second-half trading band between $3,895 and $4,305.
With gold trading around $4,008.80, prices remain comfortably within that projected range. The implication is that current valuations broadly reflect consensus expectations of one additional Fed rate hike and inflation peaking near 3.9%, suggesting the market is neither significantly overvalued nor deeply undervalued.
That assessment limits both bullish and bearish arguments. It weakens expectations of a sharp collapse because the WGC’s framework identifies fundamental support near $3,895, but it also challenges forecasts of a rapid return to $5,200–6,000 unless the macroeconomic outlook changes substantially.
Future price direction will largely depend on shifts in economic growth, geopolitical developments, and the U.S. dollar. The WGC notes that while geopolitical tensions drove much of gold’s volatility during the first half of the year, currency movements could become an equally important variable in the months ahead.
Central-Bank Buying Provides Support—but Not Momentum
Central banks continue to accumulate gold despite the recent correction. The People’s Bank of China (PBoC) purchased 15 tonnes in June—its largest monthly acquisition since October 2023—marking the 20th consecutive month of reserve accumulation. China’s official gold holdings have now reached 2,346 tonnes, representing roughly 9% of its total foreign-exchange reserves.
Worldwide, central banks acquired an estimated 244 tonnes during the first quarter of 2026, with countries such as Poland also continuing to expand their holdings.
While these purchases provide an important source of structural demand, they have not prevented prices from falling. Central banks typically allocate reserves based on long-term diversification strategies rather than short-term market movements. As a result, they tend to absorb supply steadily instead of aggressively chasing prices higher.
The scale of recent buying also illustrates its limitations. China’s 15-tonne purchase represents roughly 482,000 ounces, equivalent to approximately $1.9 billion at current prices. By comparison, the SPDR Gold Shares (GLD) experienced $2.91 billion in outflows in a single trading session during March. One day of ETF liquidation outweighed an entire month of China’s purchases.
Many longer-term bullish forecasts assume central-bank buying will remain robust, with total official-sector purchases exceeding 800 tonnes in 2026. Even if that pace is achieved, however, official demand is more likely to establish a long-term price floor than trigger another powerful rally.
The broader structural arguments for gold—including reserve diversification, fiscal expansion, de-dollarization, and limited mine-supply growth—remain intact. What has weakened is private investment demand. Because marginal private buyers typically determine short-term price movements, their retreat has had a much larger impact on prices than continued sovereign accumulation.
Gold attracts fresh selling pressure on Thursday as energy-led inflation concerns revive expectations of additional Fed rate hikes.
Escalating tensions between the US and Iran underpin demand for the safe-haven US Dollar, weighing on the precious metal.
The technical outlook remains bearish, suggesting the path of least resistance is tilted toward further downside.
Gold (XAU/USD) came under renewed selling pressure during Thursday’s Asian session, retreating toward the $4,025 area near the previous day’s swing low. Although recent US inflation data pointed to easing price pressures, elevated crude oil prices continue to fuel expectations that the Federal Reserve could still raise interest rates later this year. The prospect of tighter monetary policy lends support to the US Dollar (USD) and weighs on non-yielding Gold.
Data released by the US Bureau of Labor Statistics showed that the Producer Price Index (PPI) unexpectedly fell 0.3% in June following a revised 0.6% increase in May, while annual producer inflation slowed to 5.5% from 6.0%. The report followed a sharp decline in the Consumer Price Index (CPI), reinforcing signs that inflation pressures are moderating. As a result, traders reduced expectations for an imminent Fed rate hike, sending the USD to its weakest level since June 18 and helping Gold recover on Wednesday.
However, persistent energy-driven inflation risks continue to cloud the outlook. Crude oil prices remain near one-month highs as escalating US-Iran tensions and ongoing disruptions in the Strait of Hormuz raise concerns about global energy supplies. The US launched another wave of airstrikes against Iranian military targets on Wednesday, prompting retaliatory drone and missile attacks by Iran on US-linked facilities across the region. President Donald Trump also warned that additional Iranian infrastructure could be targeted if hostilities intensify.
Meanwhile, Iran’s Islamic Revolutionary Guard Corps threatened to broaden the conflict by targeting key regional energy routes, including shipping lanes near the Bab el-Mandeb Strait through its Houthi allies in Yemen. These developments continue to support oil prices, rekindling inflation concerns and strengthening the argument for at least one 25-basis-point Fed rate hike in 2026. Consequently, USD weakness may remain limited, while the broader outlook for Gold continues to favor further downside.
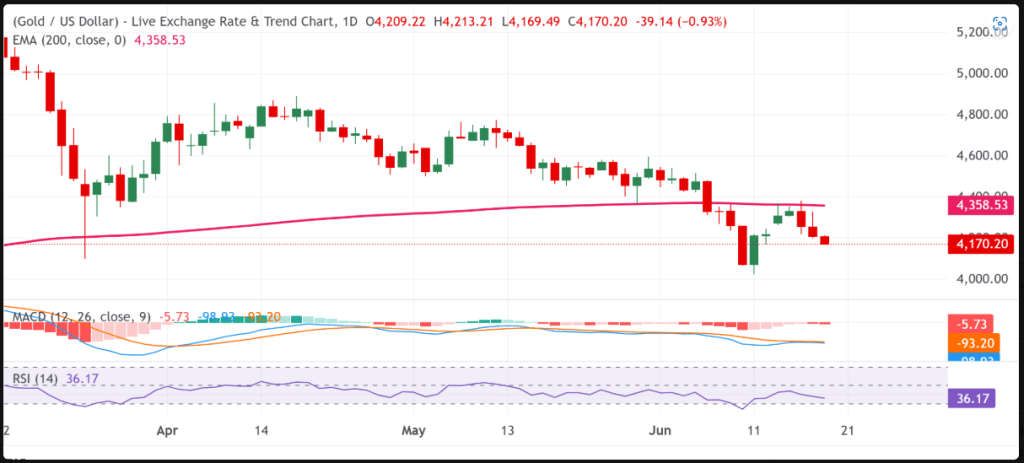
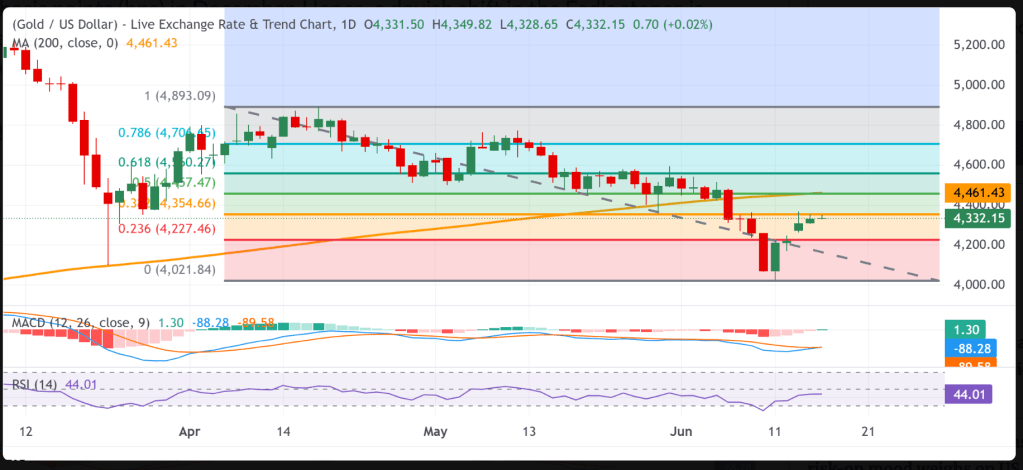
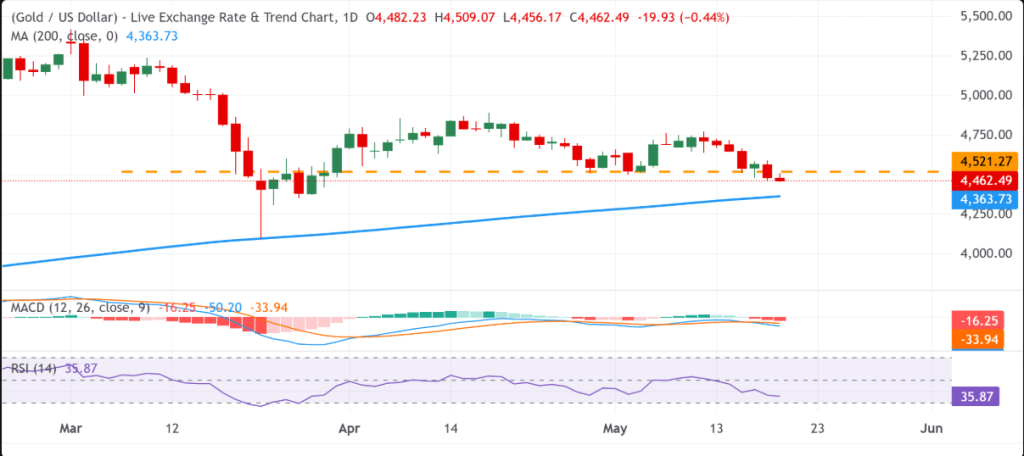
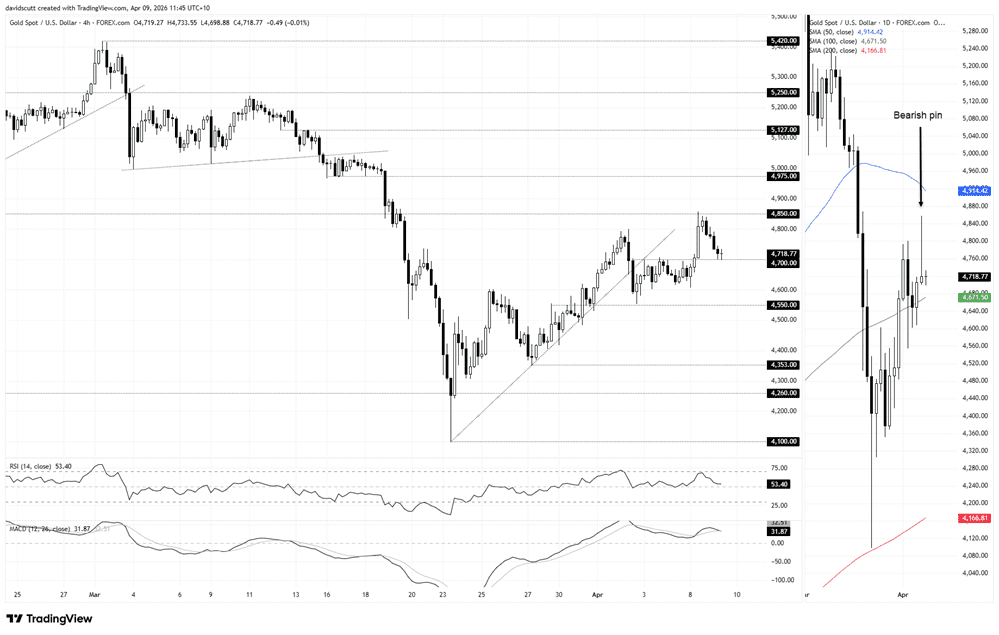
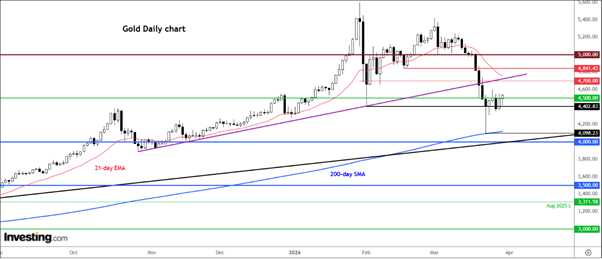
Gold Daily Chart
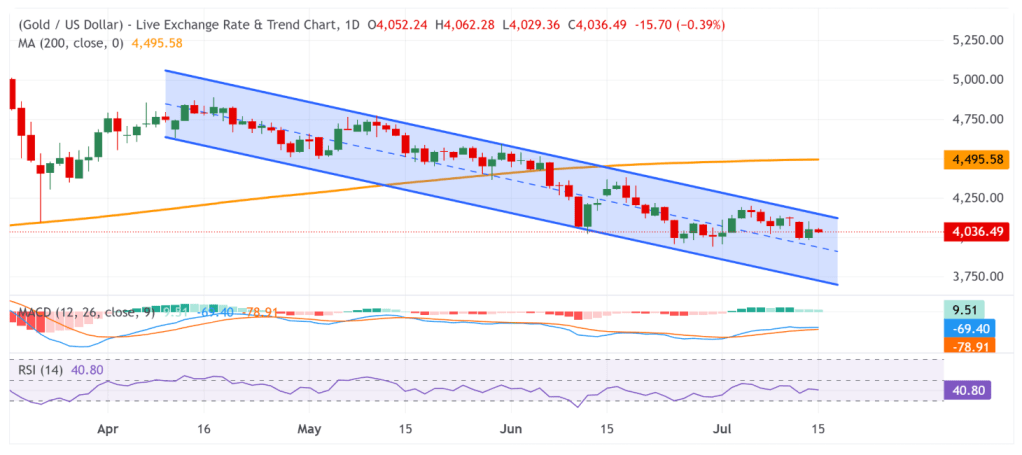
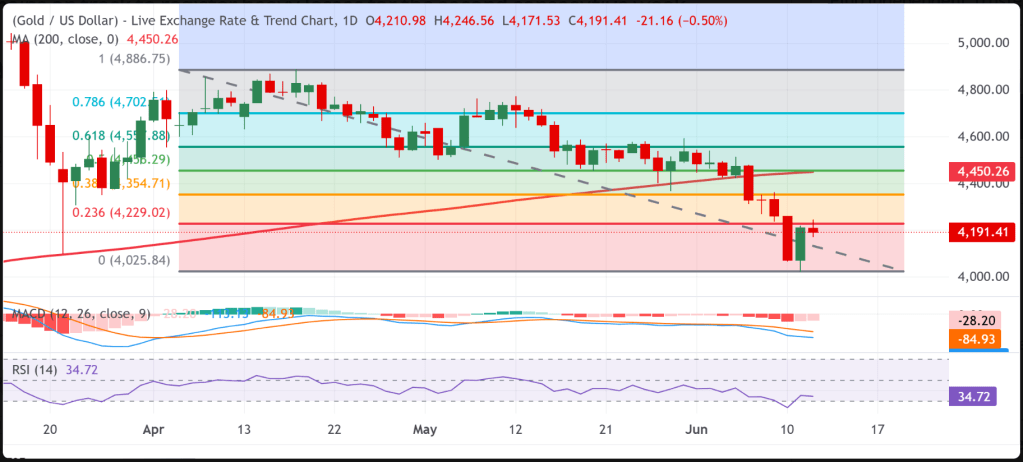
Gold remains under bearish pressure as XAU/USD continues to trade below its 200-day Simple Moving Average (SMA) and within a well-defined descending channel. While momentum indicators show signs of stabilization, they have yet to signal a meaningful bullish reversal. The Moving Average Convergence Divergence (MACD) remains slightly positive at 9.43, while the Relative Strength Index (RSI) hovers near 40.77, suggesting weak buying interest rather than a sustained recovery.
A confirmed break and daily close below the key psychological support at $4,000 could trigger a fresh wave of selling. Such a move would bring the June year-to-date low around $3,943–$3,942 into focus. Further downside pressure could then drive Gold toward the channel’s lower boundary near $3,675.71, a major structural support level. A decisive violation of this zone would strengthen the broader bearish outlook and open the door to deeper losses.
On the upside, immediate resistance is located near $4,093.63, corresponding to the upper boundary of the descending channel. Any recovery attempt is likely to encounter renewed selling interest in this region. A sustained breakout above this barrier would improve the technical picture and pave the way for a move toward the 200-day SMA around $4,495.94, which remains the next major resistance level.
Silver remains under pressure as escalating US-Iran tensions in the Strait of Hormuz drive oil prices higher, raising concerns that the Federal Reserve may keep interest rates elevated for longer. Softer-than-expected June CPI and PPI data have helped ease near-term rate-hike concerns. Meanwhile, markets have reduced the probability of a September Fed rate increase to 44%, although the impact of recent military developments has yet to be fully reflected in asset prices.
Silver (XAG/USD) extends its decline for a second consecutive session, trading near $57.00 per troy ounce during Thursday’s Asian session. The precious metal remains under pressure as escalating tensions between the United States and Iran drive oil prices higher, raising inflation risks and reinforcing expectations that the Federal Reserve could maintain elevated interest rates for longer.
According to reports, the US Central Command (CENTCOM) launched additional operations aimed at keeping the Strait of Hormuz open, a critical route for global energy supplies. In a significant escalation, US forces reportedly targeted an oil tanker in the strategic waterway, heightening concerns over further disruptions to oil markets. Meanwhile, President Donald Trump declined to provide a timeline for potential future actions against Iranian infrastructure, adding to geopolitical uncertainty.
Despite these developments, investors are also weighing softer US inflation data. Consumer inflation eased to 3.5% year-over-year in June from 4.2% in May, coming in below the consensus forecast of 3.8%. The weaker CPI reading initially reduced expectations of an imminent Fed rate increase.
Producer inflation data reinforced the disinflationary trend. The annual PPI rate slowed to 5.5% in June from 6.0% previously, missing expectations of 6.2%, while monthly PPI fell 0.3% after a 0.6% rise in May, outperforming forecasts for a flat reading.
As a result, market expectations for a September Fed rate hike eased, with implied odds declining to roughly 44% from 50% a day earlier. However, analysts note that June inflation figures do not yet reflect the economic consequences of the renewed US-Iran conflict, leaving markets cautious about the potential inflationary effects of the latest military escalation.
The U.S. Dollar Index remains under pressure as cooling inflation signals reduce expectations of additional Fed rate hikes. However, concerns over energy-driven price pressures and rising tensions between the United States and Iran help cushion the Greenback’s downside. Market participants now await upcoming U.S. economic releases for fresh direction amid mixed fundamental signals.
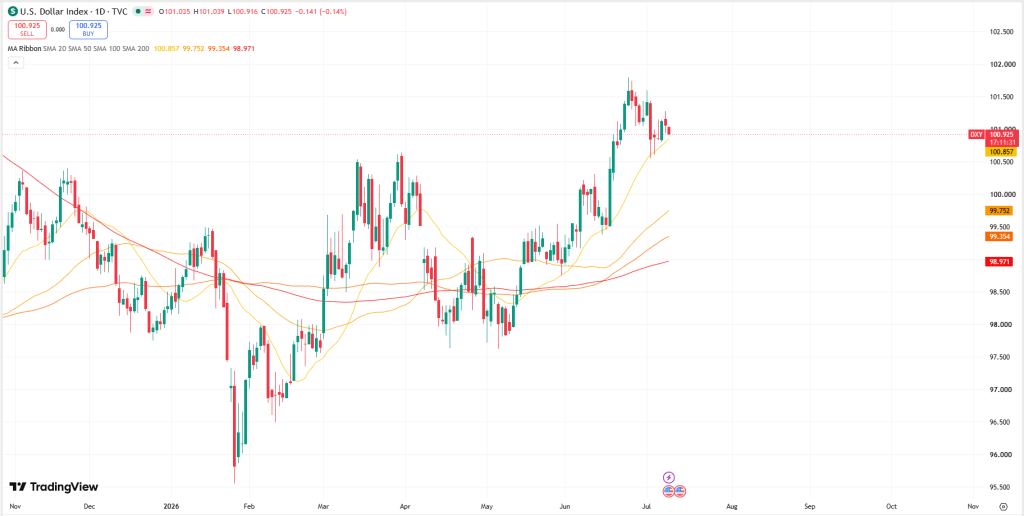
The US Dollar Index (DXY), which measures the Greenback against a basket of major currencies, traded in a narrow range near 100.50 during Thursday’s Asian session, hovering close to the almost four-week low reached the previous day. While declining expectations of further Federal Reserve rate hikes continue to weigh on the dollar, concerns over energy-driven inflation and rising geopolitical tensions between the United States and Iran are helping to limit downside pressure.
Fresh economic data released on Wednesday showed that the US Producer Price Index (PPI) fell 0.3% in June, following a revised 0.6% increase in the previous month. The weaker PPI reading came after Tuesday’s softer-than-expected Consumer Price Index (CPI) report, reinforcing expectations that inflationary pressures are easing. As a result, investors have become less concerned that the Federal Reserve will need to maintain higher interest rates for an extended period, creating a bearish backdrop for the US dollar in the near term.
Geopolitical developments, however, continue to provide some support for the Greenback. Tensions between the United States and Iran have intensified significantly this week, with both countries carrying out additional military operations. On Wednesday, US forces conducted airstrikes targeting Iranian missile and drone facilities, while Tehran responded with retaliatory attacks against US-linked military assets across the region, signaling a worsening conflict.
US President Donald Trump further heightened tensions by warning that key Iranian infrastructure, including power stations and bridges, could become targets if hostilities escalate further. In addition, a US aircraft reportedly engaged an empty oil tanker attempting to breach the naval blockade around Iranian ports. At the same time, Iran has effectively restricted access through the Strait of Hormuz and threatened to disrupt shipping in the Bab el-Mandeb Strait.
These developments raise concerns about global trade flows and energy supplies, helping to keep oil prices elevated and maintaining a geopolitical risk premium in financial markets. Furthermore, market expectations for at least one additional 25-basis-point Federal Reserve rate hike remain intact, discouraging traders from aggressively selling the dollar. Investors are now awaiting upcoming US economic data releases for clearer direction on monetary policy and the next move in the currency markets.
Gold stays under selling pressure as a firmer US Dollar and higher oil prices strengthen expectations of a hawkish Federal Reserve.
The upcoming US CPI report and the Fed Chair’s testimony are expected to provide the next key catalyst for gold prices.
Mounting bearish momentum leaves gold vulnerable to a break below the $4,000 mark.
Gold and silver came under heavy selling pressure during the first half of Monday’s trading session. Gold extended last week’s weakness after failing to build on the modest rebound seen the previous week. The broader trend remains bearish. Although the precious metal is still marginally positive for the month, it plunged more than 11% in June, marking its fourth straight monthly decline.
As a result, downside risks continue to dominate, with gold increasingly vulnerable to a break below the key $4,000 support level in the near term.
Rising Oil Prices Keep Pressure on Gold
Renewed geopolitical tensions in the Middle East have driven crude oil prices higher at the start of the week, weighing on global equity markets. While geopolitical uncertainty would typically increase demand for safe-haven assets such as gold, the metal has increasingly moved alongside US equities in recent years, reflecting its growing sensitivity to broader market sentiment rather than its traditional defensive role.
If oil prices continue to climb, inflation concerns are likely to intensify, reinforcing expectations that the Federal Reserve will maintain a restrictive monetary policy. Such a scenario would further weaken gold’s near-term outlook.
Stronger US Dollar Adds to Headwinds
Gold is also facing pressure from a strengthening US Dollar. With the Fed emphasizing its commitment to keeping inflation under control, another surge in energy prices could strengthen expectations that US interest rates will remain elevated for longer. Even if upcoming economic data shows some moderation, persistently high energy costs would likely discourage policymakers from shifting toward a more dovish stance.
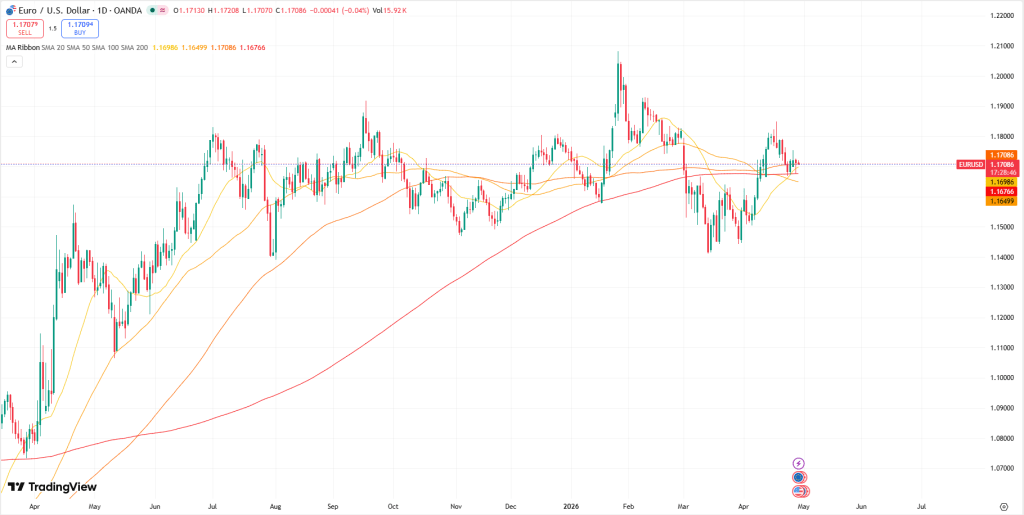
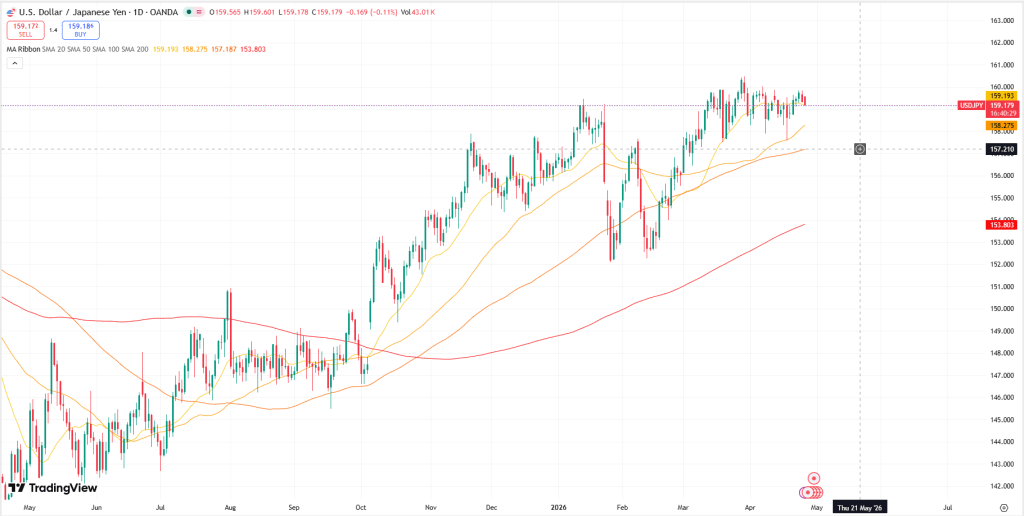
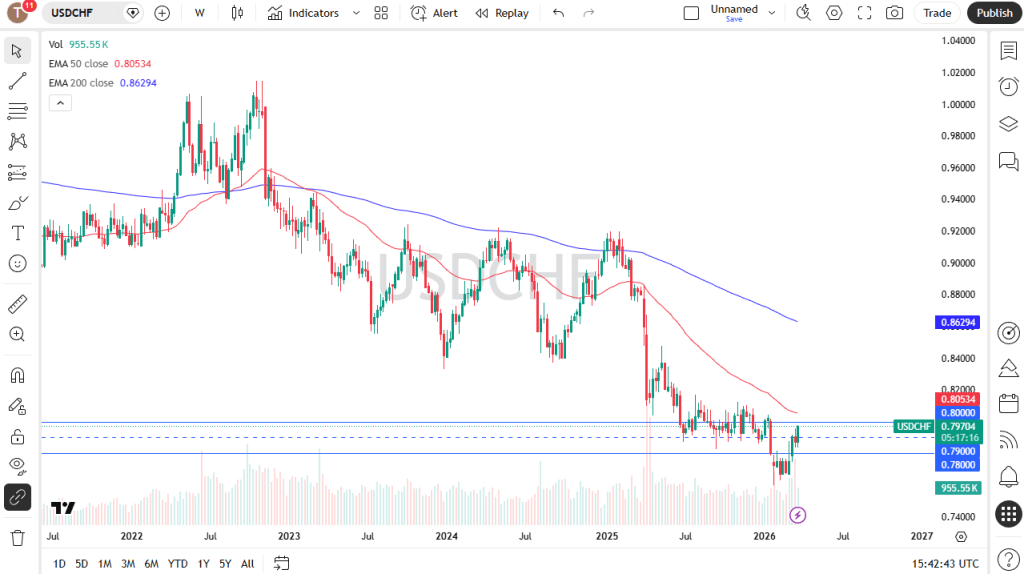
This backdrop has helped the US Dollar regain momentum, particularly against currencies such as the euro and Japanese yen, whose economies are more vulnerable to rising energy import costs.
Focus Turns to CPI and Fed Chair Testimony
As oil and natural gas prices remain elevated, markets have become less willing to dismiss the possibility of additional Fed tightening, providing further support for the Greenback while reducing gold’s appeal.
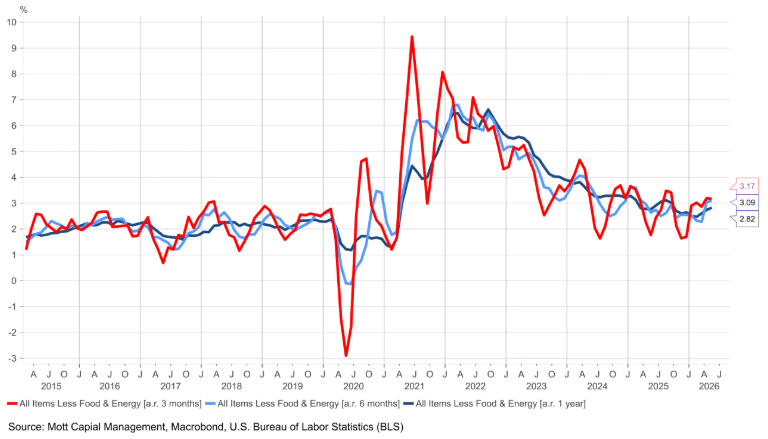
Investor attention now shifts to a busy US economic calendar. Tuesday’s Consumer Price Index (CPI) report is expected to show softer monthly headline inflation, but firm energy costs and stubborn core inflation—still around 2.8% to 2.9% year-over-year—suggest the Fed could still consider another rate increase before year-end.
Markets will also closely monitor Fed Chair Kevin Warsh’s two-day congressional testimony for fresh guidance on the policy outlook. Additional releases, including producer prices, import prices, and retail sales, could further influence market expectations.
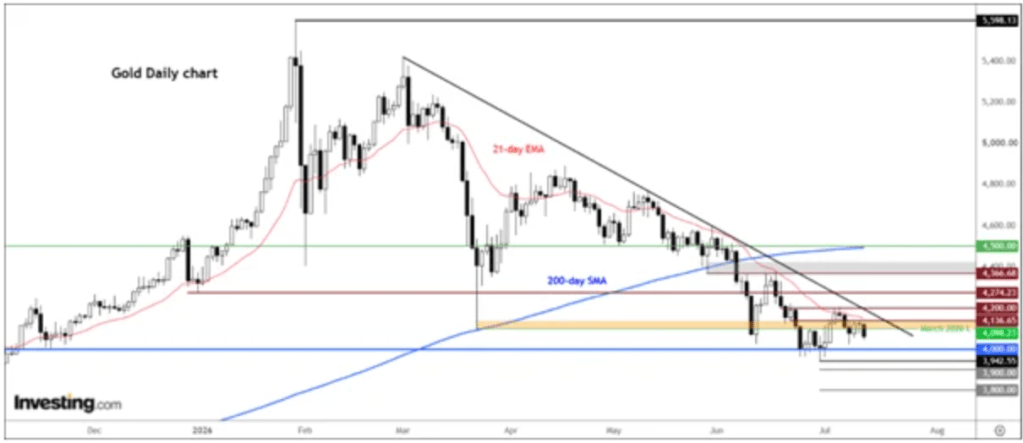
Gold Technical Outlook
Technically, gold has repeatedly failed to reclaim the $4,100 level, remaining below both a descending trendline and the 21-day Exponential Moving Average (EMA). The metal is now approaching the critical $4,000 support zone ahead of the US CPI release.
A decisive daily close below $4,000 would likely confirm a bearish breakdown, opening the door toward $3,900, with $3,800 emerging as the next major downside target.
On the upside, initial resistance is located near $4,136, followed by $4,200 and then $4,275.
With energy prices remaining elevated and the US economy showing limited signs of slowing enough to ease inflation concerns, the broader macro backdrop continues to favor the US Dollar. Consequently, non-yielding and low-yielding assets—including gold, the Japanese yen, and the Swiss franc—remain exposed to further downside pressure.
The US Dollar Index trades lower against its major counterparts as markets scale back expectations for a more hawkish Federal Reserve.
US inflation softened in June, with both headline and core CPI easing to 3.5% and 2.6% year-over-year, respectively.
Fed Chair Kevin Warsh reiterated that the central bank remains firmly committed to bringing inflation under control, emphasizing zero tolerance for persistently elevated price pressures.
The US Dollar (USD) weakens against its major peers as investors scale back expectations for further Federal Reserve (Fed) rate hikes this year after softer-than-anticipated US inflation data for June. The US Dollar Index (DXY), which tracks the Greenback against a basket of six major currencies, is trading around 100.80, down roughly 0.12% on the day.
Data released by the US Bureau of Labor Statistics (BLS) on Tuesday showed headline Consumer Price Index (CPI) inflation eased to 3.5% year-over-year in June from 4.2% in May, coming in below the market forecast of 3.8%. Meanwhile, core CPI, which strips out food and energy prices, rose 2.6% annually, undershooting both the 2.8% consensus estimate and May’s 2.9% reading.
Following the inflation report, market expectations for another Fed rate increase this month dropped sharply. According to the CME FedWatch Tool, the probability of a rate hike has fallen to 16.6%, down from 41.7% a day earlier.
Despite the softer inflation figures, Fed Chair Kevin Warsh maintained a firm stance on price stability during his congressional testimony on Tuesday, stressing that policymakers have “no tolerance for persistently elevated inflation.” He added that if monetary policy remains on the right path, the inflation surge seen over the past five years will eventually become a thing of the past.
Market participants now await the release of June’s US Producer Price Index (PPI), scheduled for 12:30 GMT, for additional insight into wholesale inflation trends and the Fed’s policy outlook.
Meanwhile, rising tensions between the United States and Iran could continue to support demand for the Greenback, as investors seek the safety of the world’s reserve currency amid growing geopolitical uncertainty.
Gold drifts lower as the market’s initial response to Tuesday’s softer-than-expected US inflation data loses momentum. Persistently high oil prices continue to fuel expectations of at least one additional Federal Reserve rate hike, weighing on the non-yielding metal. Meanwhile, escalating tensions between the US and Iran could boost demand for the safe-haven US Dollar, adding further downside pressure to XAU/USD.
Gold (XAU/USD) comes under renewed selling pressure after failing to sustain gains above the $4,100 level in the previous session, though it continues to hold above the key $4,000 psychological support during Wednesday’s Asian trading hours. While softer-than-expected US Consumer Price Index (CPI) data initially weighed on the US Dollar (USD), persistent concerns over energy-driven inflation continue to dominate sentiment. Escalating tensions between the US and Iran, along with the closure of the Strait of Hormuz, have kept crude oil prices elevated, reinforcing inflation fears. Meanwhile, Federal Reserve (Fed) Chair Kevin Warsh reaffirmed the central bank’s commitment to restoring price stability during his first congressional testimony, signaling that another rate hike remains possible before year-end. The hawkish tone largely offsets the impact of a weaker USD and limits demand for the non-yielding precious metal.
Data released by the US Bureau of Labor Statistics showed headline CPI fell by 0.4% in June, marking the steepest monthly decline since April 2020 and falling short of expectations for a 0.1% decrease. Core CPI, which excludes food and energy prices, was unchanged during the month, well below the expected 0.3% increase. On an annual basis, headline inflation eased to 3.5%, while core inflation slowed to 2.6%, both undershooting market forecasts. The softer inflation figures briefly dragged the USD to its weakest level in nearly four weeks as traders pared back expectations for additional Fed tightening. However, the Greenback quickly recovered after Warsh emphasized that the Fed remains firmly committed to combating inflation and highlighted the resilience of the US economy.
At the same time, crude oil prices have climbed to their highest level in nearly a month, increasing concerns that higher energy costs could reignite inflationary pressures and justify further monetary tightening. Reflecting this outlook, the CME FedWatch Tool indicates that markets continue to price in the possibility of one additional Fed rate hike, potentially in September or December. Geopolitical tensions also continue to underpin the USD’s safe-haven appeal. The US carried out another wave of airstrikes on Iranian targets, while Tehran responded by attacking US military facilities across Gulf nations. In addition, President Donald Trump warned that Washington could target Iranian bridges and power infrastructure if Tehran refuses to resume nuclear negotiations.
Overall, the prevailing fundamental backdrop remains supportive of the US Dollar and suggests that downside risks for Gold persist. Investors now await the release of the US Producer Price Index (PPI) and the second day of Fed Chair Kevin Warsh’s congressional testimony for fresh clues on the interest rate outlook. Meanwhile, any new developments in the Middle East conflict are likely to remain a key driver of market sentiment and could trigger heightened volatility across financial markets, particularly in Gold.
Technical Analysis
From a technical perspective, Gold continues to trade within a descending parallel channel and remains firmly below the 200-day Simple Moving Average (SMA), indicating that the broader trend remains tilted to the downside despite the recent recovery. The Moving Average Convergence Divergence (MACD) has crossed into positive territory and continues to improve, signaling a modest pickup in bullish momentum, while the Relative Strength Index (RSI) hovers near the neutral 40.80 mark, suggesting limited buying conviction.
The upper boundary of the descending channel, located around $4,140.69, represents the first significant resistance level. A sustained break above this barrier would be required to weaken the prevailing bearish outlook and open the door for additional gains. On the downside, immediate support is seen near the channel’s lower boundary at $3,718.03. A decisive rebound from this level would be needed to indicate that bearish momentum is fading and that sellers are beginning to lose control of the short-term trend.
Silver prices declined as escalating tensions in the Middle East drove oil prices higher, fueling inflation concerns and reinforcing expectations that the Federal Reserve will keep interest rates elevated for longer.
According to the CME FedWatch Tool, markets now assign a 51% probability to a Fed rate hike in September, compared with a 23% chance that policymakers leave rates unchanged.
Meanwhile, U.S. President Donald Trump reinstated a blockade targeting Iranian vessels and introduced a 20% transit fee on non-Iranian ships using the Strait of Hormuz under U.S. protection.
Silver prices (XAG/USD) extended their decline for a third straight session, trading near $57.60 per troy ounce during Tuesday’s Asian session. The non-yielding precious metal remained under pressure as intensifying tensions in the Middle East pushed crude oil prices higher, raising concerns that stronger energy-driven inflation could keep the Federal Reserve on a restrictive policy path for longer.
Rate expectations have turned increasingly hawkish. According to the CME FedWatch Tool, traders now see a 51% chance of a Fed rate increase in September, while the probability of policymakers leaving rates unchanged has dropped to 23%.
Geopolitical risks escalated after US President Donald Trump reinstated a naval blockade targeting Iranian vessels and ships linked to Iran passing through the Strait of Hormuz. He also announced a 20% transit fee on all other commercial cargo vessels using the strategic shipping route.
Investors are now focused on two key US events scheduled for Tuesday. The June Consumer Price Index (CPI) report is expected to show headline inflation falling 0.1% month-over-month, while core CPI is forecast to remain firm with a 0.3% monthly increase, highlighting persistent underlying price pressures.
Attention will also turn to Federal Reserve Chair Kevin Warsh, who is set to testify before Congress. Market participants will closely scrutinize his remarks for clues on whether Fed officials share the market’s increasingly hawkish outlook and are prepared to keep monetary policy tighter for longer.
Gold extends its losses, falling more than 1% toward the $4,050 level during Monday’s Asian session as escalating tensions between the United States and Iran boost demand for the safe-haven US Dollar. At the same time, concerns that higher Crude Oil prices could fuel inflation are reinforcing expectations of a Federal Reserve rate hike in 2026, strengthening the Greenback further and adding pressure on the non-yielding precious metal.
Fundamental Analysis
Gold remains under heavy selling pressure at the beginning of the week as the US Dollar strengthens, supported by a sharp rebound in Oil prices and renewed inflation concerns that reinforce expectations of a hawkish stance from the Federal Reserve.
The move follows a fresh escalation of tensions in the Middle East after the United States launched additional strikes against Iran on Sunday. In response, Iran reportedly targeted US facilities across Gulf states and reiterated the closure of the strategically important Strait of Hormuz.
Rising inflation worries have also contributed to Gold’s weakness after the Fed highlighted increasing price pressures in its semi-annual Monetary Policy Report released on Friday. The central bank noted that inflation accelerated further this spring, driven by the combined effects of tariffs, higher energy costs linked to the conflict, and continued investment in artificial intelligence infrastructure.
Market participants remain cautious ahead of Tuesday’s release of the US Consumer Price Index (CPI) report and Federal Reserve Chair Kevin Warsh’s first semi-annual testimony before Congress.
For now, traders are expected to keep a close eye on developments surrounding the US-Iran conflict and fluctuations in Oil prices for fresh market direction. From a technical perspective, the bearish outlook for Gold remains intact, with downside risks continuing to dominate the near-term picture.
Technical Analysis
On the daily timeframe, Gold (XAU/USD) is trading near $4,069, maintaining a bearish short-term bias as it remains below both the 21-day SMA at $4,128 and the 50-day SMA at $4,344. The longer-term technical outlook also continues to favor sellers, with the 200-day SMA at $4,495 and the 100-day SMA at $4,583 positioned well above current market levels. Meanwhile, the RSI near 41 suggests bearish momentum is still present, although selling pressure appears to be moderating rather than reaching oversold territory.
On the upside, the first resistance zone is located around the 21-day SMA at $4,128. A sustained move higher could then target the 50-day SMA near $4,344, followed by the 200-day SMA around $4,495 and the 100-day SMA near $4,583. With no significant moving-average support levels immediately beneath the current price, any rebound attempt remains fragile while Gold continues to trade below this cluster of resistance levels. Unless buyers can regain control above the 21-day SMA, the broader risk profile remains tilted toward further downside pressure.
The US Dollar Index (DXY) moved higher as investors sought the safety of the US dollar amid escalating geopolitical tensions in the Middle East. Tehran has rejected further negotiations, insisting that Washington first fulfill earlier commitments regarding transit security and Iranian oil exports. Meanwhile, market participants continue to anticipate one final interest-rate hike from the Federal Reserve before the end of the year, providing additional support for the greenback.
The US Dollar Index (DXY), which tracks the US Dollar against a basket of six major currencies, extended its gains for a second consecutive session, hovering around 101.10 during Monday’s Asian trading hours.
The Greenback continued to attract safe-haven flows as geopolitical tensions in the Middle East intensified. According to Bloomberg, the US Central Command (CENTCOM) carried out additional strikes on Sunday aimed at reducing Iran’s ability to threaten civilian vessels transiting the strategic waterway.
Reuters reported that US forces have struck more than 300 Iranian targets over the past three days, including approximately 140 targets on Saturday alone, while Washington and Tehran offered conflicting assessments regarding the status of maritime traffic through the strait. The latest escalation has further diminished prospects for diplomatic progress, with Tehran insisting that the US must first honor previous commitments related to shipping security and the normalization of Iranian oil exports before negotiations can move forward.
The US Dollar also found support from rising concerns that the intensifying US-Iran conflict could drive energy prices higher, fueling inflationary pressures and potentially keeping Federal Reserve policy restrictive for longer. Investors are now focused on Tuesday’s release of the US Consumer Price Index (CPI) report for fresh signals on the Fed’s policy path. Economists expect headline CPI to decline by 0.1% month-over-month in June, while core CPI is forecast to increase by 0.3%.
Market participants continue to price in one additional Federal Reserve rate hike before year-end. Attention will also turn to Fed Chair Kevin Warsh, who is scheduled to make his first official appearance before Congress on Tuesday, with traders looking for further guidance on the outlook for monetary policy.
The US Dollar Index remains under pressure after the FOMC Minutes failed to deliver a more hawkish signal. Still, expectations for a Fed rate hike later this year and renewed tensions between the US and Iran are helping to limit downside momentum.
The US Dollar Index (DXY), which measures the Greenback against a basket of major currencies, remains under mild selling pressure for a second consecutive day. However, the decline has been limited, with the index trading within Wednesday’s range during Thursday’s Asian session and hovering just below the 101.00 level, down roughly 0.1% on the day.
Demand for the US Dollar has softened following the release of the latest FOMC Minutes, which failed to deliver a significantly more hawkish policy signal. The minutes from the June 16–17 meeting showed policymakers remained divided on the future path of interest rates, with many officials suggesting the federal funds rate could finish the year at or slightly below its current level.
Despite this, Federal Reserve officials continued to highlight persistent upside inflation risks, indicating that additional policy tightening may still be necessary to bring inflation back toward the 2% target. Markets continue to price in approximately a 70% probability of a 25-basis-point rate increase in September. At the same time, renewed geopolitical tensions between the US and Iran have provided support for the Greenback by reinforcing safe-haven demand and fueling expectations of higher inflation.
The latest escalation in the Middle East followed fresh US military strikes against Iran in response to attacks on commercial shipping in the Strait of Hormuz. Tehran retaliated with ongoing attacks targeting US military facilities and assets in Bahrain and Kuwait. Further adding to uncertainty, US President Donald Trump stated on Wednesday that the memorandum of understanding intended to ease regional tensions had effectively collapsed. Against this backdrop, traders are reluctant to initiate aggressive bearish positions on the Dollar ahead of the release of US Weekly Jobless Claims data, which could offer fresh direction for the market.
Gold remains under pressure as buyers stay cautious despite a weaker US Dollar. Escalating US-Iran tensions, persistent inflation concerns, and expectations of further Fed tightening continue to support the greenback, while the technical outlook suggests bullion could face additional downside.
Gold (XAU/USD) extends its decline for a fourth consecutive session on Thursday, hovering near the one-week low around $4,020 reached the previous day. Renewed conflict between the United States and Iran has reignited inflation concerns and strengthened expectations that the Federal Reserve could resume tightening policy in 2026, weighing on the non-yielding precious metal during Asian trading. However, a softer US Dollar, pressured by the absence of a strongly hawkish signal in the latest FOMC Minutes, is helping to cushion gold’s losses.
The minutes from the Federal Reserve’s June 16–17 meeting, released Wednesday, showed policymakers remain divided on the future path of interest rates. Several officials suggested that the federal funds rate could end the year at or slightly below its current level. Combined with last week’s weaker-than-expected US Nonfarm Payrolls report, the minutes did little to significantly shift market expectations. Nonetheless, Fed officials emphasized that inflation risks remain skewed to the upside and acknowledged that further policy tightening may be necessary to bring inflation back toward the 2% target.
Market participants continue to assign roughly a 70% probability to a Fed rate hike in September. That outlook, together with escalating tensions in the Middle East, is preventing a deeper decline in the US Dollar. The latest developments saw US forces launch additional strikes against Iran following attacks on commercial vessels in the Strait of Hormuz. Tehran responded with continued strikes on US military assets in Bahrain and Kuwait, while President Donald Trump declared on Wednesday that the ceasefire with Iran had effectively ended.
Against this backdrop, the broader fundamental picture remains supportive of the US Dollar and suggests that any rebound in gold could face selling pressure. Investors are now awaiting US Weekly Initial Jobless Claims data and remarks from key Federal Reserve officials for fresh policy clues. Even so, market attention is likely to remain focused on developments in the Middle East, which could continue to drive volatility across global markets and create significant trading opportunities in gold.
Gold Daily Chart
Gold may continue to struggle in attracting significant buying interest as the technical outlook remains tilted to the downside.
From a chart perspective, XAU/USD retains a bearish near-term structure, trading below its 200-day Simple Moving Average (SMA) and remaining confined within a descending channel. Although the Moving Average Convergence Divergence (MACD) indicator has crossed into positive territory and the Relative Strength Index (RSI) has improved to 40.26 from previously oversold levels, momentum remains relatively weak. As a result, any recovery attempt could encounter stiff resistance near the upper boundary of the channel around $4,247.94.
For sentiment to improve meaningfully, gold would need to break decisively above the channel resistance, with the next major hurdle located at the 200-day SMA near $4,492.08. On the downside, immediate support is seen at the lower edge of the descending channel around $3,811.93. A move toward that area could attract renewed buying interest from longer-term bulls seeking to preserve the broader upward trend if the current corrective phase deepens further.
Silver is poised for a strong rebound amid a softer Fed outlook, easing inflation concerns, and weaker oil prices.
Silver gains momentum as signs of a slowing US labor market prompt investors to reassess the path of interest rates.
According to the CME FedWatch tool, the probability of a September rate hike fell to 52% from 66% following the latest data release.
Silver prices extended gains for a fourth straight session on Friday, with XAG/USD trading near $62.60 per troy ounce during Asian trading hours. A softer inflation outlook, weaker oil prices, and a less aggressive Federal Reserve are providing strong support for the non-yielding metal’s recovery.
Silver is attracting renewed buying interest as signs of a slowing US labor market prompt investors to sharply reassess the outlook for interest rates. The shift in sentiment followed Thursday’s June Nonfarm Payrolls (NFP) report, which showed the US economy added only 57,000 jobs, well below expectations of 110,000. Although the unemployment rate unexpectedly edged down to 4.2% from 4.3% in May, the weak hiring figures reinforced concerns about broader economic cooling.
In response, traders pared back expectations for tighter monetary policy. Data from the CME FedWatch tool showed the probability of a September rate hike falling to 52%, compared with 66% before the jobs report.
Additional support came from recent comments by Federal Reserve Chair Kevin Warsh at the ECB Sintra Conference, where he reiterated the Fed’s commitment to its 2% inflation target while noting that inflation pressures and expectations have eased in recent weeks.
Silver is also benefiting from declining energy prices, which are helping reduce inflationary pressures. Crude oil prices have weakened as shipping activity through the Strait of Hormuz continues to normalize following progress in US-Iran diplomatic negotiations in Doha. The easing geopolitical tensions have reduced the risk premium that had previously supported energy markets.
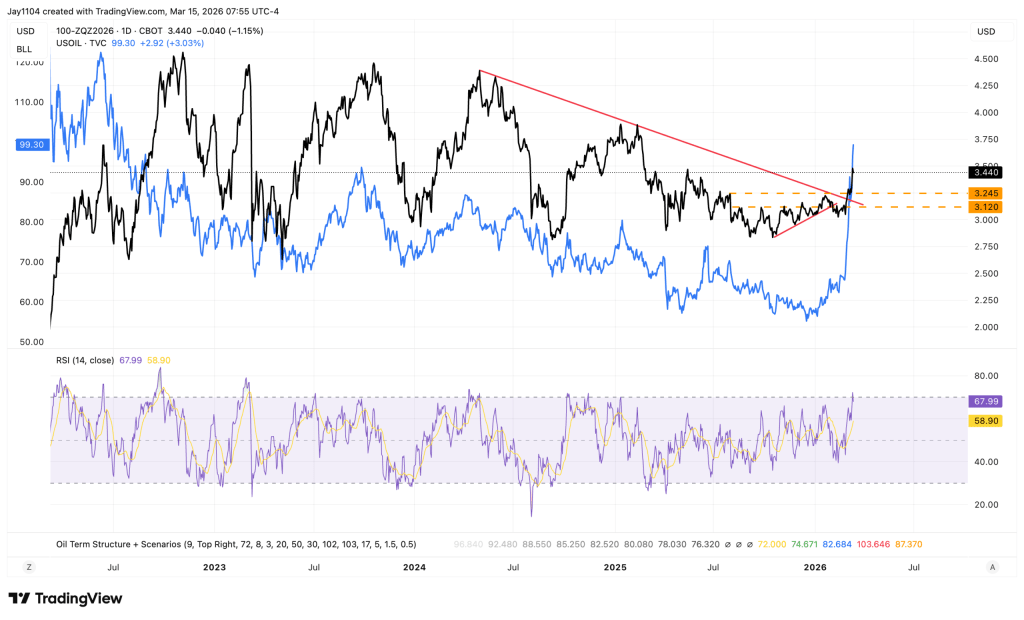
U.S. benchmark crude oil prices dropped below $70 per barrel on Wednesday, hitting their lowest point since the conflict with Iran erupted on Feb. 28. The decline is expected to reduce pressure on headline inflation in the months ahead. However, the key issue now is whether the bond market will also adjust by pricing in lower inflation expectations, as uncertainty surrounding the Federal Reserve’s interest-rate path remains unresolved.
Oil prices were pressured by a preliminary agreement aimed at ending the conflict with Iran, while shipping activity through the Strait of Hormuz has started to recover gradually. Even so, energy transport volumes are still significantly below levels seen before the war. “What shippers are looking for is consistency over days and weeks,” said Matthew Wright, a freight analyst at Kpler, a firm specializing in global shipping analysis.
The oil market is currently reflecting expectations of continued progress toward stability and a gradual recovery in global energy exports over the coming weeks and months. “Traders are pricing in a return to normality,” said Francis Osborne, head of oil analysis at Argus Media, a firm that monitors global oil prices. “They are not taking into account the risks further down the road, which still remain very real.”
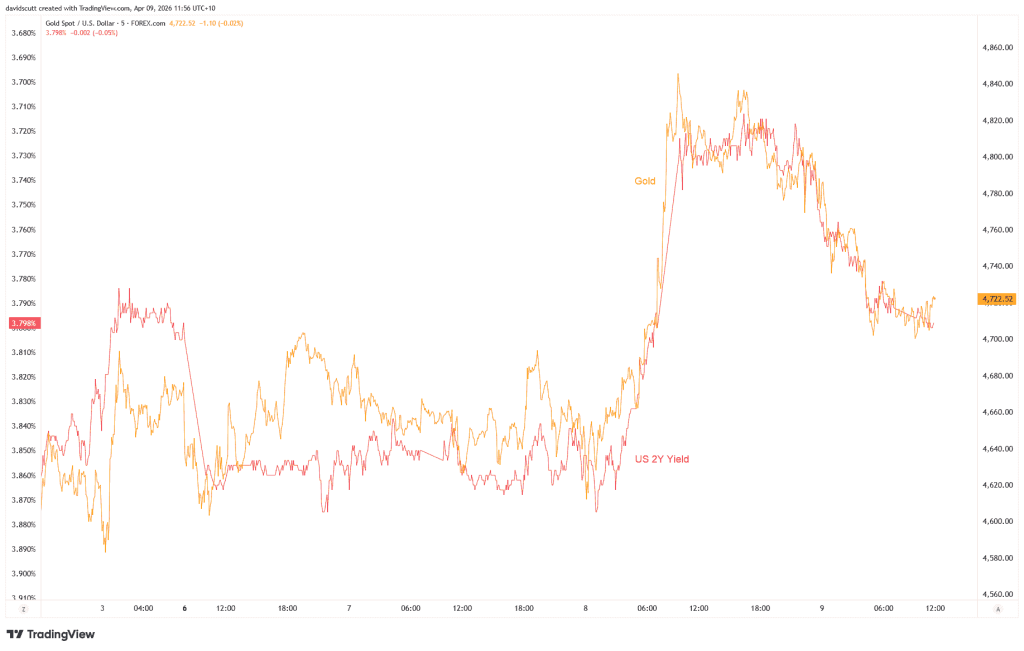
Despite ongoing uncertainty surrounding the Middle East, U.S. Treasury yields have started to retreat, though the decline has been uneven across maturities. The 30-year Treasury yield — typically the most sensitive to inflation expectations — dropped sharply yesterday to 4.84%, its lowest level in several months. Meanwhile, the benchmark 10-year yield also moved lower, reversing much of the increase seen over the past month.
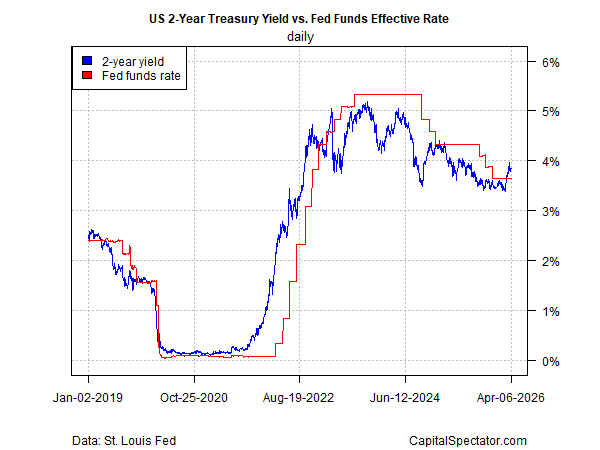
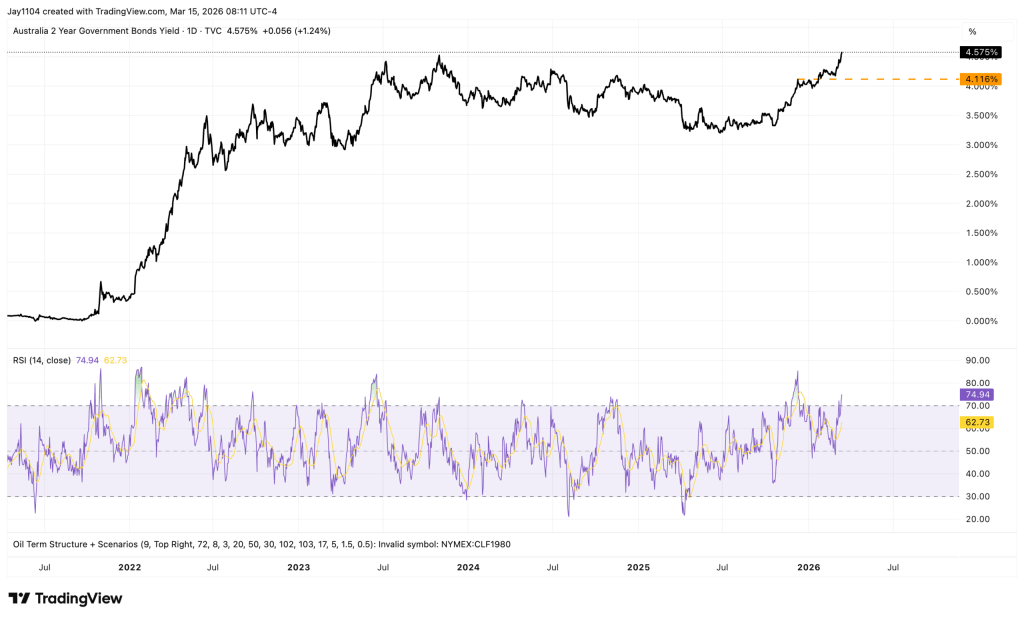
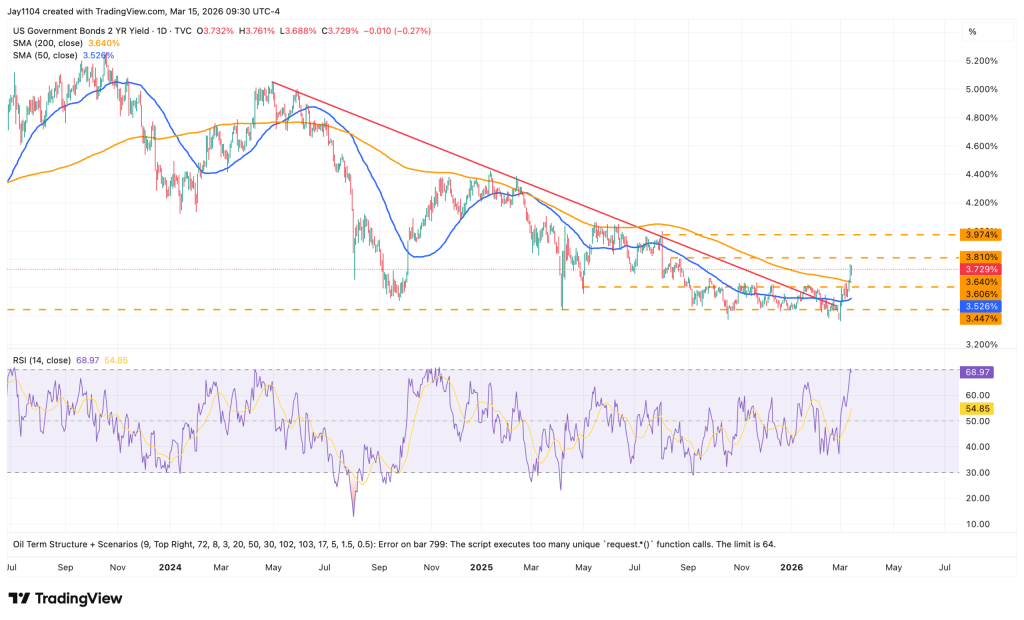
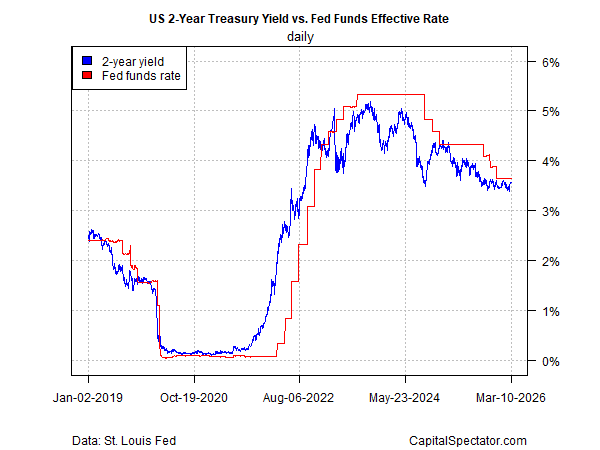
One key exception is the policy-sensitive 2-year Treasury yield. Although it edged lower yesterday, it remained near 4.16%, close to the recent high reached only days earlier. This suggests that investors are not yet fully convinced that inflation pressures have disappeared or that further Federal Reserve rate hikes are off the table.
Torsten Slok argues that lower oil prices could ultimately become inflationary, writing:
“The narrative in markets is changing from ‘lower oil prices mean lower inflation’ to ‘lower oil prices mean more demand in an already overheating economy, which means higher inflation.’ Driven by the strong April CPI, hot May non-farm payrolls, and a hawkish Fed, the market narrative now suggests that the reopening of the Strait of Hormuz will further overheat the economy, forcing the Fed to raise interest rates soon.”
Whether Slok’s view proves correct will take time to assess, as geopolitical tensions and broader macroeconomic uncertainty continue to cloud the outlook. In the near term, however, inflation pressures are still expected to ease somewhat.
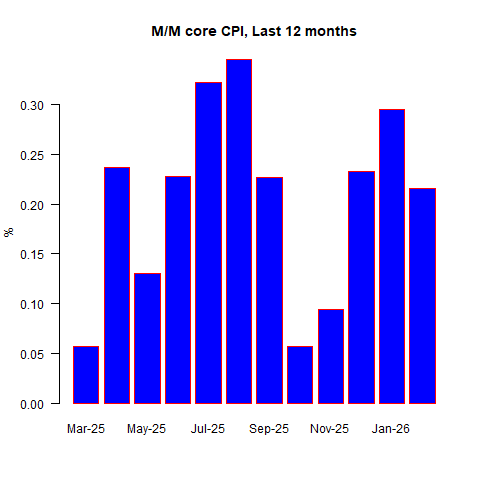
The Federal Reserve Bank of Cleveland’s inflation nowcast points to a modest slowdown in year-over-year CPI after several months of elevated readings. Meanwhile, Core CPI — which has remained relatively stable throughout the conflict, rising only slightly — is projected to increase 2.9% in the latest monthly update compared with a year earlier.
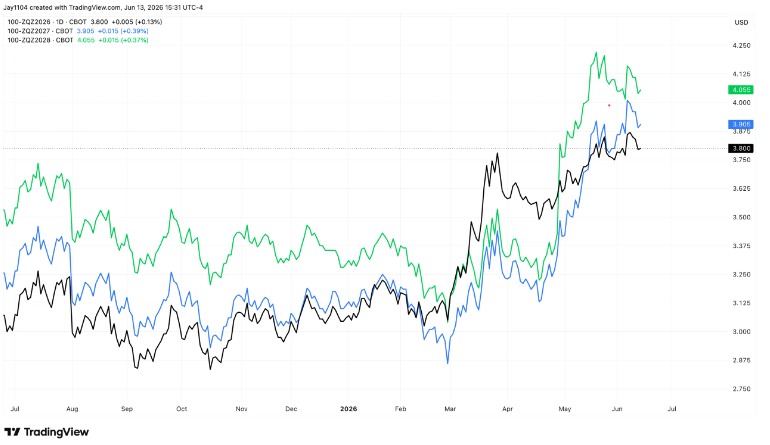
Fed funds futures markets are now assigning higher odds of near-term tightening, pricing in a 34% probability of a 25-basis-point rate hike at the next FOMC meeting on July 29, with expectations rising to around 67% in favor of further tightening by September.
Morningstar expects any near-term inflation persistence to gradually fade over time. The firm notes: “We expect inflation to fall in the coming years. Receding energy prices will be reflected in a negative impulse to inflation in 2027. The tariff impact should also cease going forward. Moreover, wage growth has slowed considerably, which should help push services inflation back to normal. Housing inflation also continues to trend down.”
Still, while the longer-term outlook points toward easing inflationary pressure, that horizon remains distant. In the immediate term, markets are taking comfort in signs of cooling prices, though uncertainty around the Federal Reserve’s policy path suggests that current stability may not last.
The United States Dollar Index remains supported as expectations for a Federal Reserve rate hike continue to build. Markets are now pricing in a 63.4% chance of a rate increase in September, according to the CME Group FedWatch tool. Meanwhile, US PCE inflation accelerated to 4.1% in May amid oil supply concerns linked to tensions in the Middle East, reinforcing expectations that the Fed could keep tightening policy.
The US Dollar Index (DXY), which tracks the performance of the US Dollar (USD) against a basket of six major currencies, recovers some of its previous session losses and trades near 101.50 during Friday’s Asian session. Investors now await the release of the Michigan Consumer Sentiment Index later in the day for fresh market direction.
The Greenback remains supported by increasing expectations that the Federal Reserve (Fed) could raise interest rates again. According to the CME FedWatch tool, markets are currently pricing in a 63.4% chance of a rate hike at the Fed’s September 15–16 meeting.
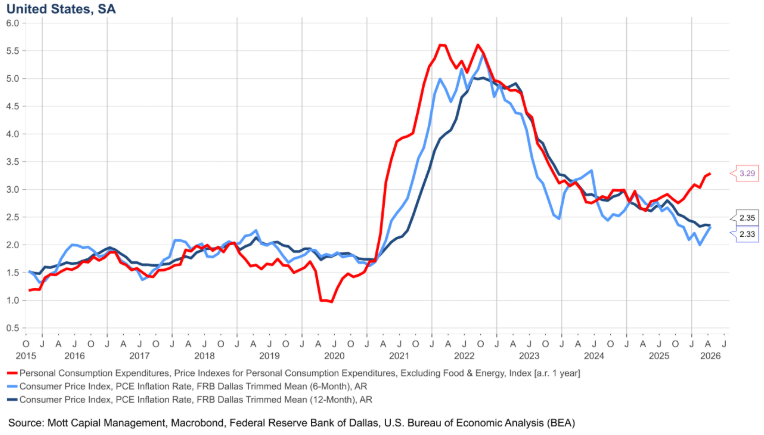
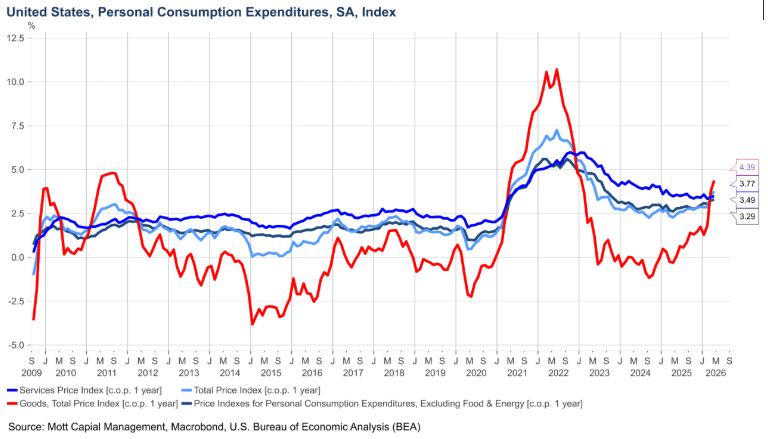
The hawkish outlook follows stronger inflation data, with the headline Personal Consumption Expenditures (PCE) Price Index rising to 4.1% year-over-year in May from 3.3% previously. The jump marks the first time in three years that headline PCE inflation has moved above the 4.0% threshold, largely driven by higher energy prices linked to tensions in the Middle East, keeping the possibility of additional Fed tightening alive.
Meanwhile, the core PCE Price Index, the Fed’s preferred measure of underlying inflation, climbed to 3.4% annually from 3.3% in April, marking the strongest core inflation reading since October 2023.
BMO Chief US Economist Scott Anderson stated that elevated PCE inflation is likely to keep the Fed cautious, with further rate hikes remaining a possibility. He added that persistent service-sector inflation may not ease quickly even if energy prices decline, suggesting continued policy debates between Fed hawks and doves.
The Australian Dollar remains under pressure versus the US Dollar as expectations for further Federal Reserve rate hikes stay firm.
Investors are now focusing on the US PCE Inflation data for fresh signals regarding the Fed’s future monetary policy direction.
Meanwhile, Australia’s labor market showed resilience, with employers adding 40.3K new jobs in May, surpassing market forecasts of 25K.
The AUD/USD pair edges slightly lower to around 0.6890 during Thursday’s European session as the Australian Dollar remains under mild pressure against the US Dollar. The Greenback continues to stay supported by expectations that the Federal Reserve’s next policy move could be another rate hike.
The US Dollar Index (DXY), which measures the USD against six major currencies, trades near 101.55 at the time of writing, remaining close to Wednesday’s more-than-one-year peak of 101.80.
Data from the CME FedWatch Tool shows markets are pricing in nearly an 82% probability of at least one Fed rate increase this year.
Traders are now turning their attention to the US Personal Consumption Expenditures (PCE) Price Index for May, scheduled for release at 12:30 GMT, as the report could provide fresh insight into the Fed’s future interest-rate path.
Meanwhile, Australia’s May labor market figures exceeded expectations. The Australian Bureau of Statistics reported that employers added 40.3K jobs during the month, well above forecasts of 25K. This follows April’s revised decline of 40.7K jobs, compared with the previously reported 18.6K drop. The unemployment rate also eased to 4.4% from 4.5%, matching market expectations.
Technical Analysis
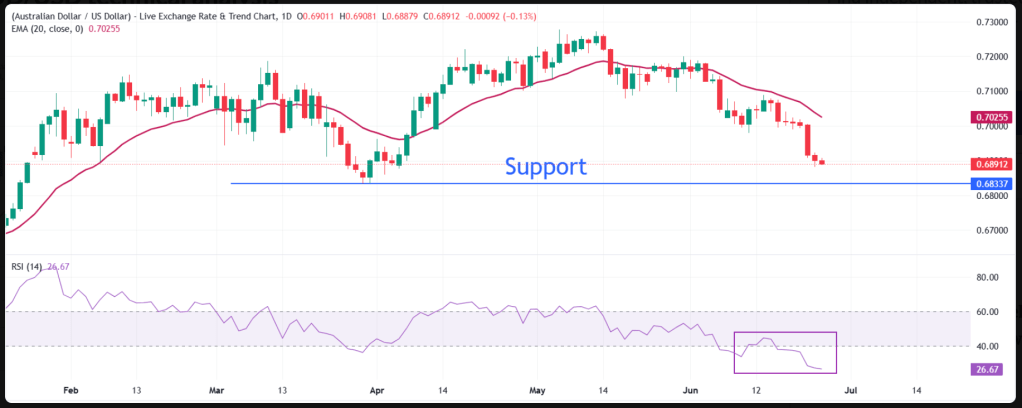
AUD/USD trades near 0.6890 and continues to show a bearish short-term outlook, with the pair remaining below the 20-day Exponential Moving Average (EMA) at 0.7025. Price action has continued to drift away from the key trend indicator, while the Relative Strength Index (RSI) stands at 26.6 in oversold territory, suggesting that bearish momentum remains strong even though the recent decline may be overstretched.
On the upside, the first major resistance is seen around the 20-day EMA near 0.7025. A recovery above this level would help reduce immediate downside pressure.
On the downside, key support is located at the March 30 low of 0.6833. A break beneath this area could open the door for a deeper decline toward the January 7 high near 0.6766.
United States Dollar Index remains close to 13-month highs
The United States Dollar Index stays near a 13-month peak around 101.13, supported by hawkish expectations surrounding the Federal Reserve policy outlook. Meanwhile, US Vice President JD Vance stated that negotiations have achieved “great progress,” despite lingering tensions behind the scenes.
The United States Dollar Index (DXY), which tracks the US Dollar against six major currencies, traded steadily near the 101.00 mark during Tuesday’s Asian session after posting modest gains in the previous session.
The index continues to hover close to its 13-month high of 101.13, reached on June 19, as markets maintain a hawkish view on the Federal Reserve policy outlook. The Fed kept interest rates unchanged at 3.50%–3.75% during its June meeting.
Still, updated economic forecasts and remarks from Kevin Warsh, who chaired his first Fed meeting, were viewed as more hawkish than expected. Following the announcement, futures markets fully priced in a 25-basis-point rate hike for September, while also assigning a small probability to a potential increase as early as next month.
Despite the Dollar’s resilience, easing geopolitical tensions may limit further upside. Ongoing peace discussions between the US and Iran have improved market sentiment and reduced inflation concerns. According to CNBC, US Vice President JD Vance said negotiations had made “great progress,” although some tensions remain unresolved.
On Monday, Vance also stated that Iran had agreed to allow inspectors from the International Atomic Energy Agency back into the country. Iranian Foreign Minister Abbas Araghchi echoed the positive tone, noting that the Switzerland talks had produced “major progress.”
Gold holds steady near $4,200 as US–Iran peace progress offset by Fed hawkish stance
Gold prices remain flat near $4,190 during early Asian trading on Tuesday. Progress in US–Iran peace negotiations may pressure the precious metal, while expectations of a Fed rate hike later this year grow after the new Fed Chair struck a hawkish tone.
Gold prices remained steady near $4,190 during Tuesday’s early Asian session as traders monitored ongoing developments surrounding the US–Iran peace negotiations.
US Vice President JD Vance said talks between Washington and Tehran had made “great progress,” despite recent tensions. He noted that negotiations in Bürgenstock were continuing and that Iran had agreed to allow inspectors from the International Atomic Energy Agency back into the country.
However, discussions became strained after Iran announced the closure of the Strait of Hormuz in response to Israeli strikes on Lebanon, arguing the attacks violated the ceasefire agreement.
According to Saxo Bank analyst Ole Hansen, energy prices remain a major short-term driver for precious metals. He added that the uneven progress in US–Iran talks could pressure oil prices while supporting demand for gold.
Meanwhile, expectations for tighter US monetary policy also weighed on bullion. Markets increasingly anticipate a Federal Reserve rate hike later this year after new Fed Chair Kevin Warsh adopted a hawkish stance on inflation during his first policy meeting. Higher interest rates tend to reduce gold’s appeal since the metal does not offer yields.
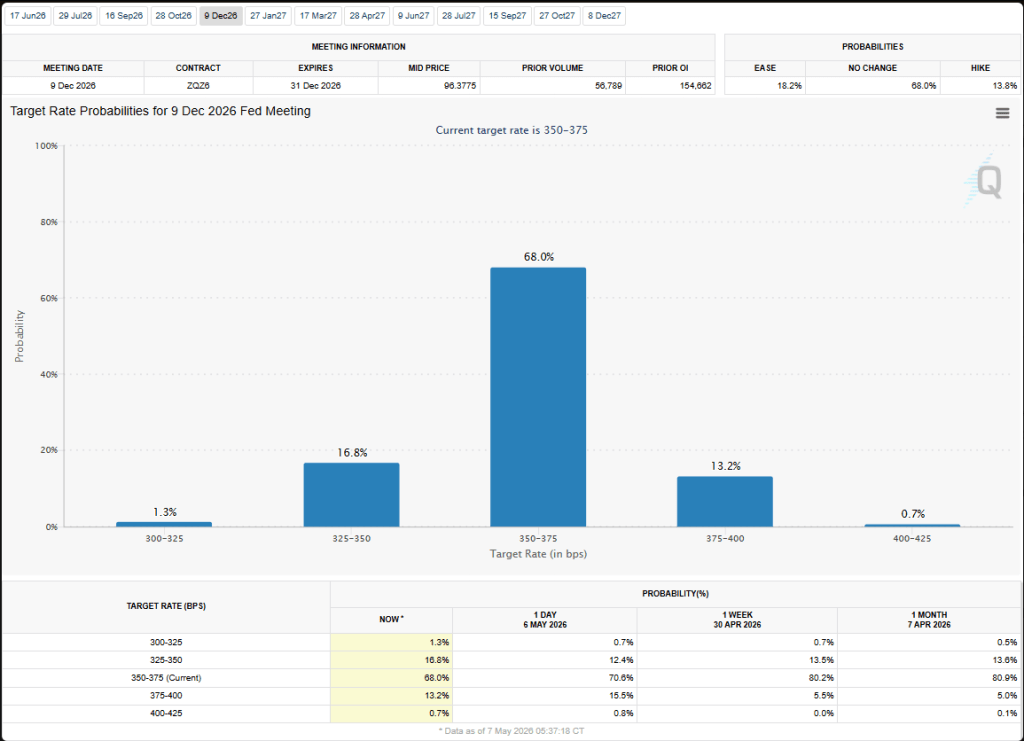
Traders are now pricing in nearly an 89% probability of a Fed rate hike in December, up sharply from 61% before last week’s FOMC meeting, according to the CME FedWatch Tool.
The peace dividend is real, but the bigger story for oil may be the delayed release of Gulf crude into an Asian market that is already better supplied than it was just a few months ago.
Falling oil prices provide support for bonds and a select group of equity leaders, but they do not automatically eliminate the inflation risks that have recently pushed the Fed toward a more hawkish stance.
The 24–48 hour rule after a central-bank surprise remains relevant: betting against the Fed too quickly can be costly, particularly when the US dollar is gaining momentum.
The more compelling opportunity may emerge after the initial dollar rally fades, when gold and major currencies reveal whether weaker energy prices are starting to undermine the Fed’s inflation narrative.
As option-related market support fades, investors could face greater volatility just as the peace trade, the oil-overhang trade, and the Fed trade begin pulling markets in different directions.
The Fed’s Hard Edge
Wall Street delivered the kind of rebound that appears straightforward at first glance but becomes far more complex beneath the surface. Equities advanced, bonds recovered, oil prices retreated, and semiconductor stocks surged back toward record highs after the interim US-Iran agreement offered markets their clearest signal yet that the Strait of Hormuz could reopen. An inflation risk that had dominated macro discussions suddenly looked less like an imminent shock and more like a pressure point beginning to ease.
That shift matters. Lower crude prices have given parts of the equity market much-needed breathing room following the Fed’s latest message. They have also offered support to longer-duration assets after policymakers signaled they are prepared to respond forcefully should inflation pressures re-emerge. While cheaper energy does not solve every macro challenge, it removes one of the most visible drivers of inflation expectations.
The market is correctly focusing on oil. Reopening Hormuz does more than restore disrupted supply—it unlocks a significant backlog of Gulf crude destined for Asia. More than 60 million barrels reportedly remain stored on tankers in the region, waiting for transport routes to normalize. Once confidence returns and those cargoes begin moving, Asian buyers may face not only additional supply but a delayed surge of barrels entering a market that has already adapted by securing alternative shipments from West Africa, the Americas, and other exporters.
As a result, the oil market may be transitioning rapidly from a scarcity narrative to an oversupply narrative. The immediate concern was whether crude could leave the Gulf. The next challenge is how quickly delayed cargoes arrive in a market that is already relatively well stocked. This dynamic suggests the decline in oil prices may have further room to run, as the reopening of Hormuz removes both the geopolitical risk premium and exposes the inventory buildup created during the disruption.
That is why developments in the Dubai crude market are attracting attention. The shift of Dubai prompt time spreads into contango is more than a technical detail—it may be an early sign that the last remnants of the geopolitical premium are fading. Contango indicates that immediate barrels are becoming less valuable relative to future supply, suggesting traders are beginning to worry less about securing cargoes and more about finding storage for them. This subtle change in market structure often signals a transition from supply anxiety toward concerns about excess inventory.
For Asian refiners, the market is entering a new phase. The original shock came from the loss of Gulf crude supplies. The next challenge may be the opposite: a surge of delayed Gulf barrels arriving simultaneously into a region that has already secured alternative supplies. For months, oil traders focused on the closure of the gate; now they must assess the growing traffic jam waiting on the other side, particularly around Singapore’s storage and trading hub.
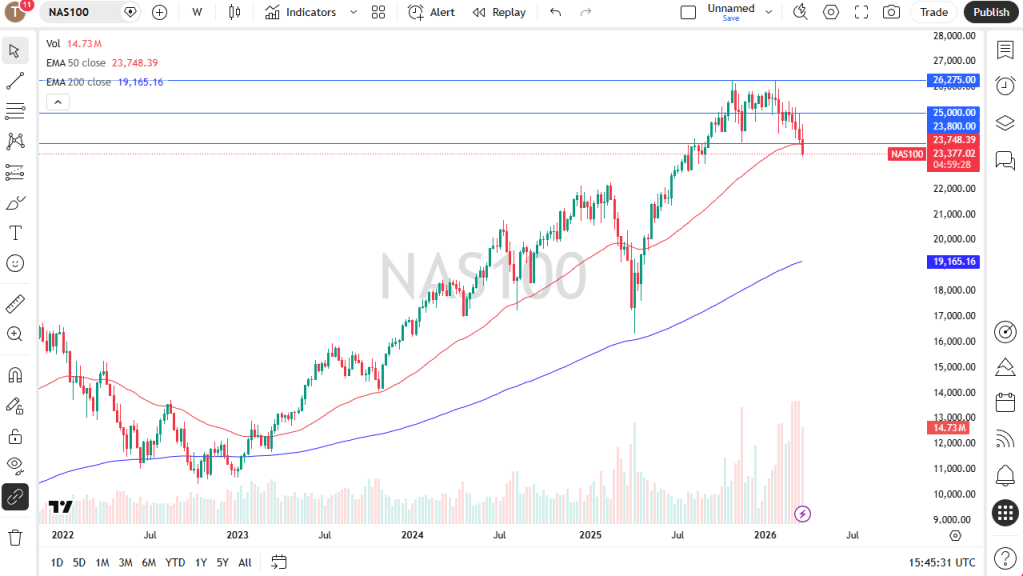
Meanwhile, equity markets have reverted to a familiar script. The Nasdaq is outperforming, semiconductor stocks are leading the advance, and renewed optimism surrounding domestic chip production has added fresh momentum to the broader AI and capital-expenditure story. Retail stocks remain resilient, energy shares have softened alongside crude prices, and investors are once again embracing growth-oriented sectors as concerns over energy-driven inflation begin to fade.
However, the post-Fed recovery remains narrow beneath the surface. While technology and semiconductors have resumed leadership, broader market participation remains limited. Cross-asset signals from currencies, rates, and volatility markets suggest caution rather than a full-fledged risk-on environment. The generals may be charging ahead, but the rest of the market has yet to follow, making the rally appear selective rather than comprehensive.
That distinction is important because the Fed did more than leave rates unchanged—it reshaped the market’s expectations. The latest dot plot revealed that nine policymakers now support additional rate hikes this year, strengthening the US dollar and forcing investors to consider a scenario in which the Fed’s next move could be another hike rather than an extended pause. Even if further tightening is not the base case, its inclusion in the discussion changes the complexion of every risk asset rally.
Lower oil prices help ease inflation concerns, but a stronger dollar can still tighten financial conditions. Gold finds itself caught between these opposing forces. While the metal has stabilized above $4,200 as the initial shock from the Fed fades, currency markets continue to favor the dollar. The message remains clear: traders are still responding to the Fed’s tougher stance, and gold remains constrained by expectations of higher real rates and a Dollar Index trading back above the psychologically important 100 level.
For gold investors, the peace dividend and the Fed’s hawkish turn are working against one another. Falling energy prices reduce inflation pressure and should support a less restrictive policy outlook. Yet the Fed’s latest communication suggests policymakers remain concerned enough about inflation to maintain a cautious stance. This tension now sits at the center of the market debate. If Hormuz fully normalizes, Gulf exports recover, and oil prices continue to soften, the Fed’s current inflation concerns may begin to look increasingly outdated. The key question is whether declining energy costs can cool inflation expectations quickly enough to make recent hawkish repricing appear excessive, especially if consumer demand weakens later in the year.
This is the central fault line for markets. Investors are not debating whether lower oil is positive—it clearly is. The debate is whether it merely softens the Fed’s inflation challenge or fundamentally shifts the policy outlook back toward patience.
Another factor entering the equation is June options expiration, which is removing a subtle but important source of market stability. Recent gains have benefited from heavy call-option positioning, a dynamic that suppressed volatility and encouraged frequent intraday reversals. Dealer hedging acted as an invisible cushion beneath the market, but much of that support is now fading just as investors attempt to determine whether cheaper oil can offset a more hawkish Fed.
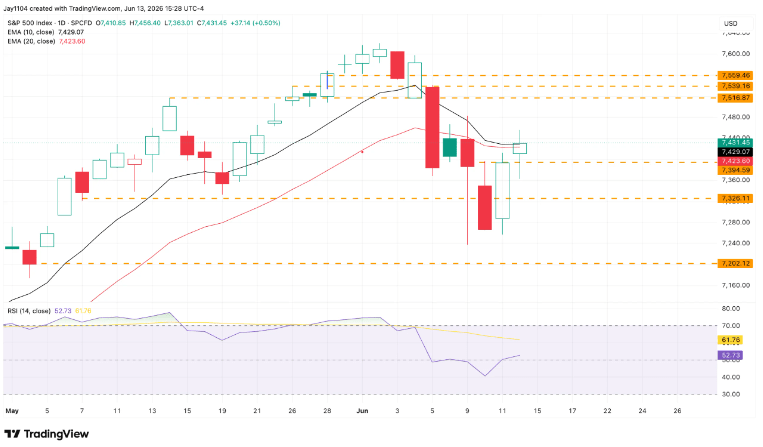
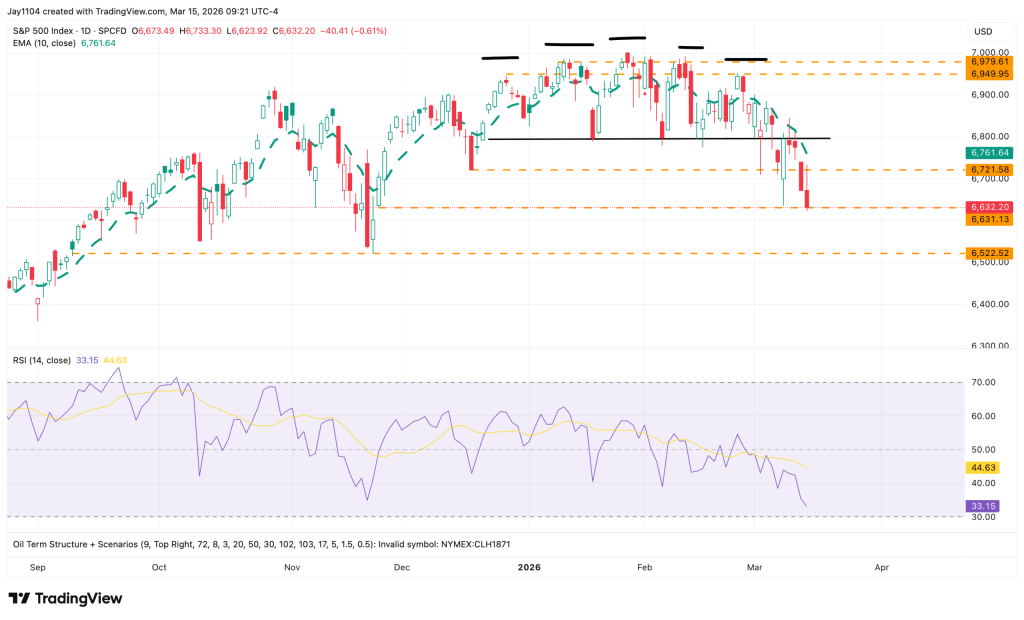
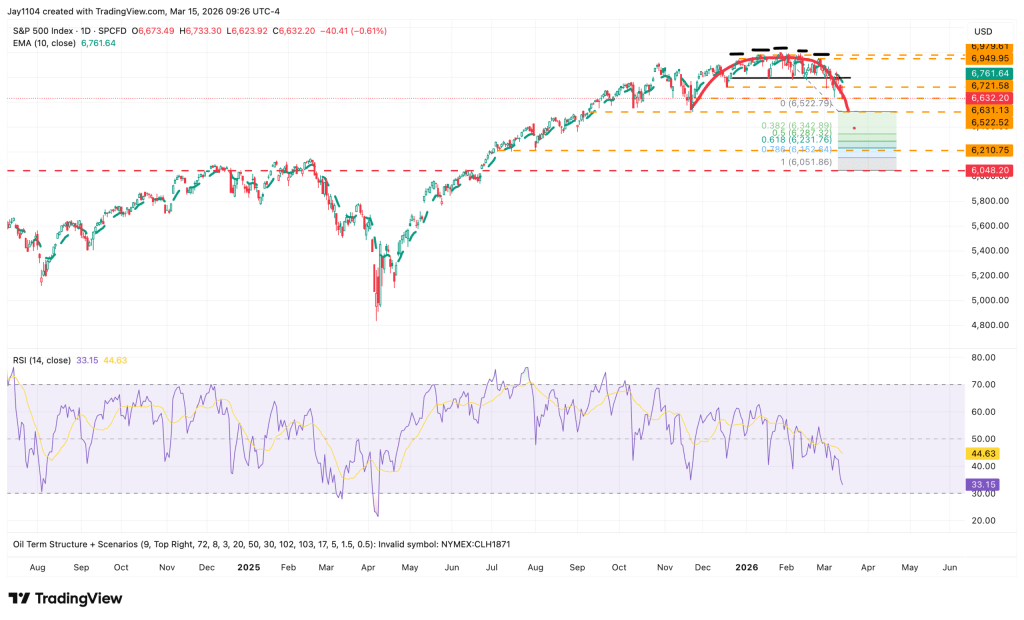
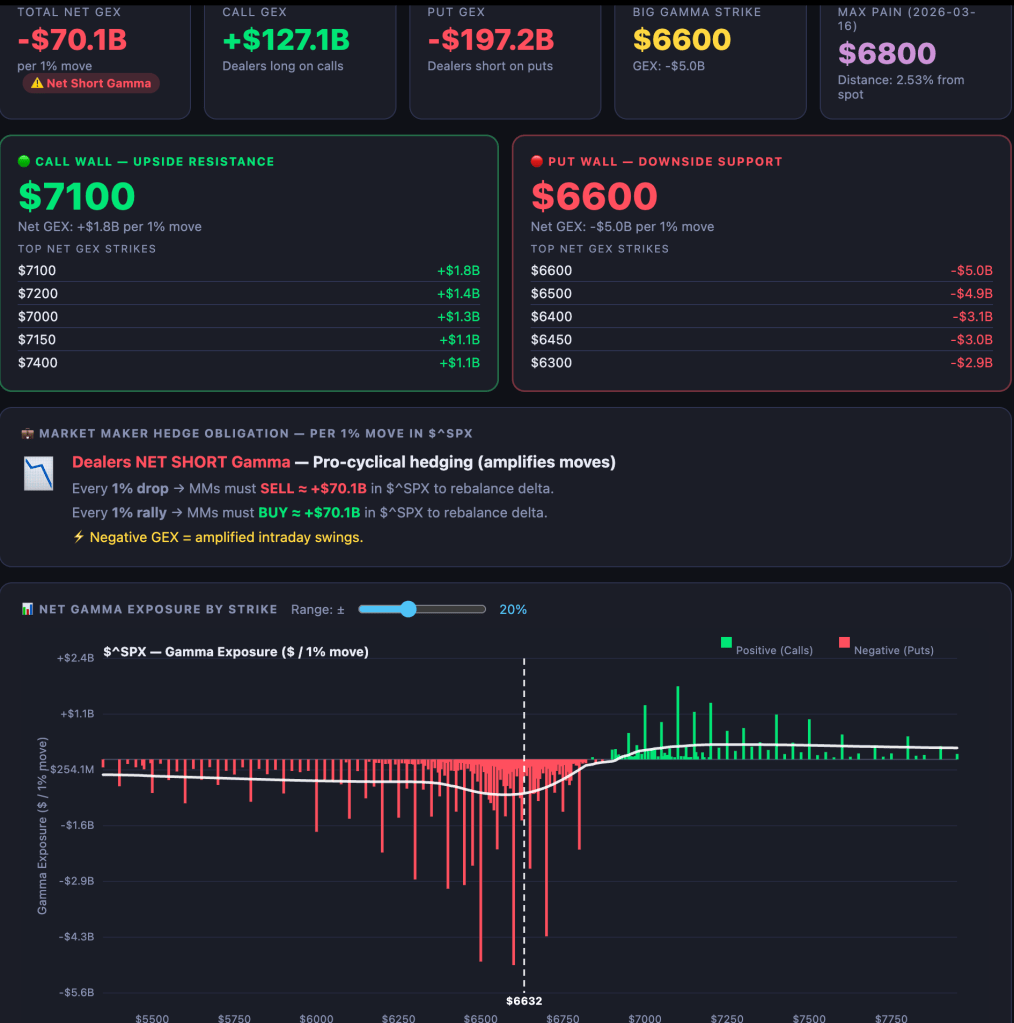
The S&P 500’s position below 7,500 is particularly important from a positioning perspective. Above major option strike concentrations, dealer hedging tends to dampen volatility by encouraging purchases during declines and sales during rallies. Below 7,500, that stabilizing effect begins to weaken.
With negative gamma extending toward 7,350, dealer hedging can start amplifying market moves instead of smoothing them. In that environment, declines may trigger additional selling from dealers seeking to maintain hedges, potentially accelerating downside momentum. This does not imply a market crash; rather, it suggests a greater sensitivity to directional flows and reduced resilience during periods of selling pressure.
The June expiration itself is not necessarily bearish. The removal of substantial call exposure may simply represent a cooling of speculative enthusiasm without damaging the broader trend. Nevertheless, once that call-heavy structure disappears, equities lose part of the mechanical support that has helped keep volatility subdued. Combined with a hawkish Fed and mixed cross-asset signals, the margin for error becomes increasingly narrow.
In practical terms, traders should expect a market with fewer shock absorbers. The derivatives landscape is becoming less supportive at the same time that the macro backdrop grows more complex. Oil is falling and the Strait of Hormuz is reopening—both constructive developments. Yet the Fed remains focused on inflation risks, and the dollar continues to reflect that reality. The key question is whether the peace dividend can cool inflation quickly enough to soften the Fed’s tougher stance.
For now, equities are voting yes. Technology leadership has returned, bonds have stabilized, and lower oil prices are removing one of the market’s most visible inflation threats. Yet this is not the classic Goldilocks environment. Investors are attempting to balance the benefits of cheaper energy against a central bank that appears increasingly willing to tighten policy if inflation resurges. As Hormuz reopens, one support mechanism is returning to markets while another—options-related protection—is quietly fading away.
From a trading perspective, the timing now becomes critical. The first 24 to 48 hours after a hawkish Fed surprise are rarely the ideal moment to fade the dollar or challenge the central bank’s message. Gold and major currencies have already suffered a significant repricing as investors adjusted to the Fed’s revised outlook. The more interesting question comes afterward: can weaker oil prices gradually undermine the inflation narrative that fueled the dollar’s rally?
Investors should closely monitor whether gold and major currencies can stage a meaningful recovery once the initial hawkish positioning has cleared. A sustained decline in oil prices, a softer Dubai crude structure, and a steady return of Gulf exports to Asia would not automatically force the Fed to change course. However, these developments could make the market’s most aggressive tightening expectations appear less convincing, especially if inflation begins to cool more rapidly than anticipated.
Ultimately, the market is caught between two powerful forces. The peace dividend is supporting equities, bonds, and lower energy prices, while the Fed’s tougher tone continues to bolster the dollar and weigh on gold. The next major move will depend on whether the reopening of Hormuz and the release of trapped Gulf supply can cool inflation quickly enough to reduce pressure for tighter monetary policy.
For now, traders remain suspended between relief and restraint—and that is often where the most compelling opportunities emerge.
Silver remains under pressure as investors increasingly price in a more hawkish Federal Reserve outlook, reducing demand for precious metals. Fed Chair Kevin Warsh reinforced this view by emphasizing that maintaining price stability remains the central bank’s primary objective, signaling that policymakers may be prepared to keep interest rates elevated for longer if inflation remains persistent.
Meanwhile, geopolitical tensions eased after the United States and Iran signed an initial agreement that launches a 60-day negotiation period aimed at reaching a comprehensive peace deal. The diplomatic progress has improved market sentiment and reduced some safe-haven demand for silver, adding to the downside pressure on the metal.
Silver (XAG/USD) remained under selling pressure for a third consecutive session on Friday, slipping to around $64.40 during Asian trading hours. The precious metal continued to weaken as investors adjusted to a more hawkish Federal Reserve outlook, which has increased expectations that US interest rates could remain elevated for longer. Higher borrowing costs typically weigh on non-yielding assets such as silver by raising the opportunity cost of holding them.
During his first press conference as Fed Chair, Kevin Warsh reaffirmed that maintaining price stability remains the central bank’s top priority. While the Federal Open Market Committee (FOMC) unanimously decided to keep interest rates unchanged at 3.5%–3.75%, policymakers delivered a hawkish message, with nearly half of committee members indicating that additional rate increases may still be necessary before the end of the year.
Although the recent US-Iran peace initiative helped ease inflation concerns by pushing oil prices lower, its positive impact on silver has been overshadowed by expectations of tighter monetary policy. According to reports, Washington and Tehran signed a preliminary agreement that initiates a 60-day negotiation period aimed at securing a comprehensive peace settlement.
Further supporting market optimism, the US military announced the end of its blockade of Iranian ports near the Strait of Hormuz, allowing oil shipments to resume through one of the world’s most important energy corridors. While these developments have improved risk sentiment and supported higher-risk assets, investors remain cautious, recognizing that global shipping and energy markets may require several months to fully recover from the disruptions caused by the conflict.
Gold extended its decline for a third consecutive session on Friday as renewed US Dollar strength weighed on the precious metal. The Greenback continued to draw support from the Federal Reserve’s hawkish stance, reducing demand for non-yielding assets such as gold. Meanwhile, reports that the US Vice President canceled a planned trip to Switzerland for talks with Iran further boosted the Dollar, adding to the downside pressure on bullion.
Gold (XAU/USD) remained under pressure during Friday’s Asian session, falling to a fresh weekly low near $4,122 as the US Dollar stayed close to its strongest level since May 2025. The precious metal continued its three-day decline as investors reacted to the Federal Reserve’s hawkish outlook, which reinforced expectations that interest rates could remain elevated for longer. Following its latest policy meeting, the Fed left rates unchanged at 3.5%-3.75%, but policymakers signaled the possibility of further tightening if inflation proves persistent. Fed Chair Kevin Warsh also emphasized the importance of maintaining price stability, reducing expectations for near-term rate cuts.
Market participants are now assigning a roughly 70% probability of a Fed rate hike in September, according to CME FedWatch data. Higher Treasury yields and a stronger Dollar have consequently weighed on non-yielding assets such as gold. At the same time, fading optimism surrounding a preliminary US-Iran peace agreement has further boosted demand for the Greenback. Uncertainty increased after US Vice President JD Vance canceled a planned meeting with Iranian officials in Switzerland, while renewed Israeli air strikes in Lebanon raised concerns about a potential escalation of regional tensions.
Looking ahead, any deterioration in Middle East stability or setbacks in US-Iran negotiations could continue supporting the safe-haven US Dollar and keep gold prices under pressure. Although trading activity may remain subdued due to the Juneteenth holiday in the United States, bullion appears on track for a third consecutive weekly decline as investors closely monitor geopolitical developments and the outlook for US monetary policy.
Gold Daily Chart
Gold remains under bearish pressure after multiple unsuccessful attempts to break above its 100-day Exponential Moving Average (EMA), reinforcing the negative outlook for XAU/USD. Technical indicators continue to favor sellers, with the Relative Strength Index (RSI) hovering around 36, signaling weak buying interest without yet reaching oversold territory. At the same time, the Moving Average Convergence Divergence (MACD) remains below its signal line in negative territory, indicating that downward momentum is still intact.
On the upside, the 200-day EMA near $4,358 serves as a key resistance level. A decisive daily close above this barrier would be needed to reduce bearish sentiment and support the possibility of a broader recovery. Until such a breakout occurs, gold is likely to remain vulnerable to additional losses, with momentum-driven selling expected to keep prices under pressure in the near term.
EUR/USD extends its recovery for a third consecutive session as easing US-Iran tensions weigh on the US Dollar.
The shared currency remains supported by the ECB’s relatively hawkish stance, adding further momentum to the pair.
Still, traders appear cautious ahead of the closely watched FOMC interest rate decision, limiting stronger bullish moves for now.
EUR/USD maintains a positive tone for the third consecutive day, holding comfortably above the 1.1600 level during Wednesday’s Asian session. Still, bullish momentum remains limited as traders prefer to stay cautious ahead of the outcome of the two-day FOMC policy meeting before committing to fresh positions following the pair’s rebound from last week’s two-month low near the 1.1500 psychological area.
Improved risk sentiment driven by optimism surrounding an interim peace agreement between the US and Iran continues to pressure the safe-haven US Dollar, providing support for EUR/USD. Meanwhile, the Euro also benefits from the European Central Bank’s hawkish stance after delivering its first rate hike in three years. The ECB additionally lifted its 2026 inflation forecast to 3%, citing persistent energy-related shocks and widening price pressures across the Eurozone.
Markets are still pricing in around 40 basis points of additional ECB tightening in 2026 despite easing geopolitical tensions in the Middle East. The US and Iran recently agreed to a preliminary peace framework aimed at ending the conflict that escalated earlier this year. The memorandum of understanding includes a 60-day ceasefire, the reopening of the Strait of Hormuz, and future technical negotiations regarding Iran’s nuclear program, though many details of the agreement remain unclear.
At the same time, expectations that the Federal Reserve could still deliver a 25-basis-point rate hike in December continue to limit downside pressure on the US Dollar and cap stronger gains in EUR/USD. Investors are now focused on the Fed’s policy announcement, updated economic projections, and the closely watched dot plot. Market participants will also closely monitor comments from Fed Chair Kevin Warsh during the post-meeting press conference for further insight into the future direction of monetary policy.
Gold steadies above $4,300 as investors await the Fed’s rate decision for fresh market direction.
Gold trades within a tight range as investors remain cautious ahead of the key FOMC rate announcement.
Market participants are awaiting clearer signals on the Fed’s future policy direction before making new bullish or bearish positions.
Meanwhile, optimism surrounding a US-Iran peace agreement continues to pressure the US Dollar, providing underlying support for the precious metal.
Gold (XAU/USD) struggles to build on its weekly rebound but continues to hold above the $4,300 level during Wednesday’s Asian session. Optimism surrounding a temporary US-Iran peace agreement keeps the US Dollar under pressure, offering some support to bullion prices. However, the precious metal remains capped below Monday’s weekly peak and the key 200-day Simple Moving Average (SMA) as investors stay cautious ahead of the outcome of the two-day FOMC policy meeting. The Fed’s decision is expected to influence US Dollar demand and provide fresh direction for non-yielding assets like Gold.
The United States and Iran have reportedly agreed on a framework peace deal aimed at ending the conflict that erupted earlier in 2026. The preliminary memorandum of understanding (MoU) includes a 60-day ceasefire, the reopening of the Strait of Hormuz, and plans for further negotiations regarding Iran’s nuclear program. However, uncertainty remains as details of the agreement are still limited and conflicting statements continue to emerge. US President Donald Trump stated that the deal would ensure Iran never acquires nuclear weapons, while Iranian state media claimed that no detailed nuclear negotiations had yet taken place.
Meanwhile, reports suggesting the creation of a $300 billion private investment fund for Iran were dismissed by Trump as “fake news,” adding to market uncertainty. This cautious sentiment is preventing aggressive bearish bets against the US Dollar ahead of the Federal Reserve’s policy announcement later today. The Fed is widely expected to keep interest rates unchanged, though policymakers may adopt a less dovish tone as inflation remains stubbornly elevated. Investors will therefore focus closely on updated economic projections and the Fed’s dot plot for clues on future policy moves.
Attention will also turn to Fed Chair Kevin Warsh’s post-meeting press conference for further guidance on the central bank’s outlook. Markets have recently scaled back fears of extreme inflation and aggressive Fed tightening that intensified during the US-Iran conflict. Even so, traders still see around a 60% probability of a 25-basis-point rate hike in December. As a result, a clearer dovish pivot from the Fed may be required before investors regain confidence in extending Gold’s recovery from last week’s year-to-date low.
XAU/USD daily chart
From a technical standpoint, Gold (XAU/USD) remains under pressure as prices continue to trade below both the 38.2% Fibonacci retracement level of the April-to-June decline and the descending 200-day SMA, preserving the broader bearish outlook. Meanwhile, the Relative Strength Index (RSI) near 44 and a mildly positive MACD signal suggest that downside momentum is fading, although bullish conviction remains limited.
As a result, any additional upside could initially face resistance around the $4,400 psychological level, followed by the key $4,445–$4,450 region, where the 50% Fibonacci retracement and the 200-day SMA converge. A sustained daily close above this zone would help weaken bearish pressure and potentially pave the way toward the 61.8% Fibonacci retracement near $4,560, with further resistance levels seen around $4,707 and $4,893.
On the downside, immediate support is located near the 23.6% Fibonacci retracement around $4,227. Below that, the recent swing low near $4,022 remains a crucial structural support level. A decisive break beneath this area would reinforce the prevailing bearish trend and increase the risk of deeper losses.
Gold supported by rising central bank buying and global de-dollarization trends, says Rabobank.
Rabobank’s RaboResearch Global Economics & Markets team highlighted growing central bank demand for Gold amid rising geopolitical uncertainty and the ongoing global de-dollarization trend. The report noted that central banks are increasingly repatriating Gold reserves instead of storing bullion overseas, while most survey respondents expect official Gold holdings to continue rising over the next five years.
The report also pointed to broader concerns surrounding global financial stability and security risks. Citing the Financial Times, Rabobank noted that capital continues flowing into “insurance assets” despite elevated geopolitical tensions, prompting fears that markets may be underpricing risk. Traditionally, investors have relied on central banks to stabilize markets during periods of stress, though Rabobank questioned whether policymakers can continue playing that role while also dealing with growing geopolitical and security challenges.
In addition, the report referenced a Wall Street Journal article about a $40 million Gold heist that could potentially expose sensitive CIA intelligence operations. Rabobank also highlighted Nikkei Asia survey findings showing that 84% of respondents expect central banks to increase Gold reserves further as countries continue reducing reliance on the US Dollar in global trade and reserve management.
The Australian Dollar extends its decline against major currencies following the latest economic data from China. On a yearly basis, China’s Retail Sales fell by 0.6%, while Industrial Production increased by 4.5%. Market participants are now focused on the upcoming Reserve Bank of Australia (RBA) policy decision, with expectations that the Official Cash Rate (OCR) will remain unchanged at 4.35%.
The Australian Dollar (AUD) remains under pressure against its major counterparts during Tuesday’s Asian session, slipping 0.16% to around 0.7060 against the US Dollar (USD). After posting gains for three consecutive sessions, the AUD/USD pair reversed lower, with losses accelerating following weaker-than-expected economic data from China.
As Australia’s largest trading partner, China plays a crucial role in shaping demand for Australian exports, making Chinese economic indicators a key driver of the Australian Dollar.
Data released by China’s National Bureau of Statistics showed Retail Sales fell 0.6% year-over-year in May, missing expectations for a flat reading and reversing April’s 0.2% increase. Fixed Asset Investment also deteriorated, contracting 4.1% compared with forecasts of a 2.0% decline and the previous 1.6% drop.
In contrast, Industrial Production provided a bright spot, rising 4.5% annually, exceeding both market expectations of 4.3% and April’s 4.1% growth.
Attention now turns to the Reserve Bank of Australia (RBA), which is scheduled to announce its monetary policy decision at 04:30 GMT. Markets widely expect the central bank to keep the Official Cash Rate (OCR) unchanged at 4.35%.
Investors are likely to focus less on the rate decision itself and more on the RBA’s policy guidance, particularly as inflation pressures show signs of easing and labor market conditions soften. Australia’s annual Consumer Price Index (CPI) slowed to 4.2% in April, below forecasts of 4.4% and down from 4.6% previously. Meanwhile, the unemployment rate unexpectedly rose to 4.5%, compared with expectations and the prior reading of 4.3%.
These developments could influence the RBA’s assessment of the economic outlook and shape expectations for the future path of monetary policy.
The market had a shaky start to the week but managed to stage a respectable recovery following last week’s sharp selloff. Most of the rebound came on Thursday after reports suggested that the US and Iran could be moving closer to another agreement, a development that has resurfaced repeatedly since March. Whether a deal is ultimately finalized or not, investors continue to react positively whenever such headlines emerge, and that response itself remains significant. By Friday’s close, the S&P 500 had edged slightly above where it finished the previous week.
However, the index remains capped by its 10-day and 20-day exponential moving averages, both of which are currently acting as resistance. Additional technical barriers sit just above these levels, suggesting that the market still faces challenges before a more convincing upside breakout can occur.
From a positioning perspective, the market has drifted back into slightly positive gamma, meaning dealer hedging is once again acting as a stabilizer rather than a source of amplification. However, the signal is still relatively weak. If we see another pullback next week, that setup could quickly shift back into negative gamma, where hedging flows would start to reinforce price moves and potentially accelerate downside — a dynamic that helped fuel Thursday’s rebound.
In a positive gamma environment, price action tends to gravitate toward “pinning” rather than trending. With monthly options expiring on Thursday the 18th (and markets closed on Friday the 19th for the holiday), and a meaningful amount of gamma set to roll off into expiry, conditions point toward a potentially quieter, more range-bound week ahead.
The key event next week is the Fed meeting on Wednesday, and there’s a risk the market may be caught leaning the wrong way if the tone comes in more hawkish than expected.
It helps to put the starting point in context. At the March meeting under Chair Powell, the FOMC’s dot plot showed a median policy rate of about 3.4% for 2026, with the easing cycle flattening out near 3.1% into early 2027.
Since then, markets have moved meaningfully higher in their rate expectations. Fed funds futures are now pricing roughly 3.80% for 2026, 3.90% for 2027, and about 4.05% for 2028. In effect, that shift has largely erased the earlier assumption of continued rate cuts and instead leans toward a more restrictive long-run stance, even introducing a subtle tilt toward the possibility of hikes.
Against that backdrop, the focus will be on whether the Fed updates its messaging to match this repricing. A key risk is a removal of any remaining easing bias, along with a rhetorical shift away from emphasizing labor market softness and back toward inflation persistence.
Inflation has also become more interesting lately because it’s no longer just an energy-driven story.
Core CPI, which strips out food and energy, is running at roughly 3.1%–3.2% on a three- and six-month annualized basis, and about 2.8% year over year. That implies the headline annual figure may continue edging higher unless monthly momentum clearly cools in the near term.
Core PCE — the Fed’s preferred inflation measure — is showing a similar pattern. It’s tracking around 3.8% on a three- and six-month basis and about 3.3% year over year, reinforcing the idea that underlying inflation remains sticky even without the volatility from energy prices.
Even measures designed to strip out outliers are now pointing in the same direction. Trimmed mean PCE — an alternative inflation gauge that excludes the most extreme monthly price moves and has been highlighted by figures such as Kevin Warsh — is running around 2.3%. Meanwhile, the Cleveland Fed’s trimmed mean CPI sits closer to 2.9%.
The historical context matters here. In 2021, trimmed-mean measures lagged the acceleration in inflation, while core PCE moved higher earlier and ultimately peaked first. In contrast, during 2019–2020, relying on trimmed-mean data alone would not have justified the rate cuts that eventually came.
The current setup suggests this is not purely an energy-driven story. If inflation were mainly about oil, it would be harder to explain why core measures are still elevated on both three- and six-month annualized bases, especially given that oil’s move only really began in March.
A key contributor appears to be goods inflation. After previously running negative, goods prices have swung back to roughly 4.4% year over year, and that reversal is now feeding through into broader inflation readings.
At the same time, the labor market is starting to show signs of turning. The ratio of job openings to unemployed workers has moved back above one and has been trending with higher highs and higher lows since December. Broader indicators — including payroll data, ADP figures, and Revelio Labs — are broadly aligned, suggesting the labor market likely bottomed out in late autumn and is now gradually firming.
That shift gives the Fed more flexibility to pivot its attention away from employment concerns and back toward inflation. Against that backdrop, it wouldn’t be surprising if the updated dot plot on Wednesday reflects a slightly lower unemployment path alongside higher inflation projections for both this year and next.
On equities, the semiconductor complex still hasn’t fully reset. Implied volatility across the group remains near the upper end of its one-year range, and positioning in options is still skewed toward calls. Even after Broadcom and NVIDIA pulled back following Broadcom’s results, names like Micron have kept overall volatility elevated.
At the same time, dispersion remains wide — the gap between single-stock volatility and index-level volatility is still pronounced — and implied correlations are still low. In other words, single-stock volatility is elevated while index volatility remains relatively contained, and that relationship hasn’t fully normalized despite the sharp selloff over the past couple of weeks.
Gold comes under renewed selling pressure on Friday as uncertainty surrounding the Iran peace deal boosts the US Dollar.
Expectations of a hawkish Federal Reserve continue to support the USD and weigh on the non-yielding precious metal.
XAU/USD remains on track to post significant losses for the second consecutive week.
Gold (XAU/USD) faces renewed selling pressure on Thursday after a modest rebound to the $4,246–$4,247 area during the Asian session, halting the previous day’s strong recovery from its lowest level since November 2025. Conflicting signals from the US and Iran regarding a possible peace agreement revive demand for the safe-haven US Dollar (USD). Combined with expectations of a hawkish US Federal Reserve (Fed), the stronger USD continues to weigh on the non-yielding precious metal.
US President Donald Trump stated on Thursday that a deal with Iran had been reached and that the final agreement could be signed soon, possibly over the weekend. However, optimism faded after Iran denied making a final decision on the agreement. Reports also indicated that Iran’s new Supreme Leader, Mojtaba Khamenei, has yet to approve the proposed US-backed peace deal. In addition, Iran’s Foreign Ministry reportedly noted that key issues, including access through the Strait of Hormuz and frozen assets, remain unresolved.
Meanwhile, Iranian forces reportedly stopped a tanker from passing through the strategic waterway without prior coordination, highlighting continued uncertainty over Iran’s stance. Further escalating tensions, Fox News reported that US forces intercepted and destroyed two Iranian one-way attack drones near the Strait of Hormuz. These developments keep geopolitical risks elevated and support a modest rebound in crude oil prices, increasing inflation concerns. This comes as recent US inflation data points to renewed price pressures, strengthening the case for higher interest rates for a longer period.
This week’s US Consumer Price Index (CPI) and Producer Price Index (PPI) data signaled a reacceleration in inflation, reinforcing expectations that the Fed could raise interest rates again before year-end. The outlook continues to support the Greenback and pressure Gold prices. Still, traders may avoid making aggressive bearish moves on XAU/USD while awaiting further developments in the Middle East situation. Even so, the precious metal remains on course to record heavy losses for the second consecutive week.
Gold Daily Chart
Gold’s technical outlook continues to favor bearish traders, supporting the possibility of further downside in the near term.
From a technical standpoint, the precious metal maintains a negative bias while trading below the 200-day Simple Moving Average (SMA). In addition, Friday’s rejection near the 23.6% Fibonacci retracement level of the decline from the April swing high indicates that the recent rebound may simply represent a short-covering rally rather than a true trend reversal.
At the same time, the Moving Average Convergence Divergence (MACD) remains in bearish territory, with the indicator staying below its signal line and the histogram still negative. The Relative Strength Index (RSI) also remains around the mid-30 region, suggesting that selling pressure is still present despite the modest recovery from recent lows.
On the upside, immediate resistance is seen near the 23.6% Fibonacci level around $4,229, followed by the 38.2% retracement near $4,355. Further resistance appears around the 200-day SMA at approximately $4,450, which aligns closely with the 50% Fibonacci retracement near $4,456. Beyond that, the 61.8% retracement at $4,558 and the 78.6% level around $4,703 could pave the way toward the cycle peak near $4,887.
On the downside, the key support level remains the recent swing low around $4,026. A decisive break below this area would increase the likelihood of a deeper corrective decline.
GBP/USD ticks up to around 1.3385 during Thursday’s Asian trading session. Rising expectations for additional US interest rate hikes, fueled by stronger-than-expected economic data, continue to support the US Dollar. Meanwhile, officials from the Bank of England (BoE) have indicated that the central bank is in no hurry to tighten monetary policy further.
The GBP/USD pair extends its recovery and climbs toward the 1.3385 area during Thursday’s Asian session. However, gains may remain capped as investors increasingly expect US interest rates to stay elevated for longer. Market participants are also adopting a cautious stance ahead of the release of the US Producer Price Index (PPI) later in the day.
Strong US labor market figures and persistent inflation pressures have reinforced the Federal Reserve’s higher-for-longer policy outlook, providing support for the US Dollar and limiting upside potential for GBP/USD.
According to the CME FedWatch Tool, markets now assign a 43.7% chance of a 25-basis-point rate hike in December, a significant increase from roughly 14% just one month ago.
Attention now turns to the upcoming US PPI report, which could offer fresh clues about the Fed’s policy trajectory under Chairman Kevin Warsh. Several major financial institutions have already pushed back their expectations for rate cuts, with Goldman Sachs forecasting that the Fed will keep rates unchanged through 2026 and not begin easing until 2027.
In the UK, Bank of England policymaker Alan Taylor recently stated that current interest rates are already restrictive enough and that additional tightening is unnecessary, despite inflationary risks linked to the Iran conflict. Meanwhile, BoE Governor Andrew Bailey reiterated last week that the central bank is “in no rush” to raise rates.
Traders are now looking ahead to Friday’s UK monthly GDP figures, which could provide further insight into the outlook for the UK economy and the future path of BoE monetary policy.
EUR/USD advances toward 1.1550 as investors await the ECB’s upcoming monetary policy decision. Expectations that the central bank could tighten policy further to address persistent inflation pressures are lending support to the euro. Meanwhile, escalating tensions in the Middle East are boosting safe-haven demand for the US Dollar, which may limit the pair’s upside potential.
The EUR/USD pair edges higher toward the 1.1550 level during Thursday’s Asian session as traders position themselves ahead of the European Central Bank’s (ECB) policy decision scheduled for 12:15 GMT.
Market participants widely expect the ECB to raise its Deposit Facility Rate by 25 basis points to 2.25%, aiming to address mounting inflationary pressures fueled by elevated energy costs. Such a move would mark the central bank’s first policy adjustment after eight consecutive meetings without changes.
Recent comments from several ECB policymakers have reinforced expectations of tighter monetary policy, with officials highlighting growing upside risks to inflation stemming from ongoing energy supply disruptions. Investors will closely scrutinize remarks from ECB President Christine Lagarde for clues on whether inflationary pressures could generate broader second-round effects across the Eurozone economy.
Meanwhile, the US Dollar has recovered part of its earlier losses as concerns mount that the fragile ceasefire between Iran and the United States could unravel following renewed military exchanges. Despite the rebound, the US Dollar Index (DXY) remains modestly lower on the day, trading around 99.97 at the time of writing.
Technical Analysis
EUR/USD is trading slightly higher near 1.1550 at the time of writing, but the broader technical outlook remains bearish following a breakdown from a Symmetrical Triangle pattern and the presence of a downward-sloping 20-period Exponential Moving Average (EMA), currently positioned at 1.1603.
Momentum indicators also point to persistent downside risks. The Relative Strength Index (RSI) remains below the 40.00 threshold, signaling renewed selling pressure while still staying comfortably above oversold territory.
On the upside, immediate resistance is seen at the 20-period EMA near 1.1603. Additional barriers emerge at 1.1623, where a previously supportive ascending trend line has turned into resistance, followed by a stronger descending trend-line resistance around 1.1707. On the downside, a break below the June 8 low near 1.1500 could accelerate losses toward the March 16 low at 1.1411.
Gold prices fell toward $4,235 during early Asian trading on Wednesday as renewed US-Iran tensions boosted market uncertainty. Fresh US strikes on Iran, following the downing of a helicopter, intensified fears of a prolonged conflict. Meanwhile, investors are closely watching the US May CPI inflation report due later Wednesday for further market direction.
Gold prices extended losses to around $4,235, the lowest level since March 23, during Wednesday’s early Asian session. The decline in XAU/USD comes amid renewed Middle East tensions and growing expectations that the Federal Reserve could raise interest rates later this year. Investors are now awaiting the release of the US May CPI inflation report for fresh market direction.
According to Reuters, the US launched strikes on Iran after US President Donald Trump claimed that Tehran had shot down a US Apache helicopter in the Strait of Hormuz. Earlier on Tuesday, Trump said the US and Iran were close to reaching an agreement, although little concrete progress has emerged since a fragile ceasefire began in early April.
Ongoing uncertainty surrounding a potential peace deal between Washington and Tehran continues to fuel inflation concerns and support expectations for higher interest rates. While Gold is traditionally viewed as a safe-haven asset during geopolitical instability, elevated interest rates reduce the appeal of the non-yielding metal.
Meanwhile, stronger-than-expected US May employment data have reinforced market expectations of a possible Fed rate hike this year. Traders are now focused on the upcoming US CPI report. Headline inflation is forecast to rise 4.2% year-over-year in May, up from 3.8% previously, while core CPI is expected to increase 2.9% YoY compared with 2.8% in April.
Any signs of stronger-than-expected inflation could strengthen the US Dollar and add further downside pressure on Gold prices in the near term.
“The prevailing inflation fears, data strength, Fed hike probability increasing, and break of 200-day moving average have led to a heavy skew negative,” said Ryan McKay, senior commodity strategist at TD Securities.
Traders are currently holding the biggest short position on the U.S. dollar in six months. However, when positioning becomes overly one-sided, markets often move in the opposite direction.
The “debasement trade” was built on expectations of Fed rate cuts and easing inflation. But instead, inflation has reaccelerated, with April CPI at 3.8% and PPI at 6%, leaving the Fed on hold potentially through 2027.
While the inflation surge is largely driven by energy prices, underlying service-sector inflation remains persistent, limiting the Fed’s ability to ease policy even if oil prices decline.
A stronger U.S. dollar acts as a channel for global monetary tightening, weighing on assets like gold, silver, and oil, while also creating an asymmetric setup for long-duration Treasury bonds.
The preferred strategy is a barbell approach: holding short-term Treasury bills for stable yield with minimal duration risk, while gradually adding long-duration exposure as 30-year yields move toward the 5% level.
The most crowded short in U.S. markets isn’t in equities or big tech—it’s the U.S. dollar. Earlier this year, speculators extended dollar selling for eight consecutive weeks, while asset managers turned net short on the DXY for the first time in months.
Across macro funds, the positioning is strikingly uniform: expectations for a weaker dollar, stronger gold and commodities, and a broader narrative of currency debasement. In that context, the “strong dollar” trade—effectively betting against this consensus—has become the potential pain trade heading into 2026. When positioning becomes one-sided, the market often moves in the opposite direction.
In macro terms, positioning is one of the clearest signals of vulnerability, revealing where consensus is most exposed. At present, that exposure is heavily skewed to one side.
According to Saxo’s COT analysis for early January, non-commercial positioning in IMM FX futures showed roughly $11.9 billion in net dollar shorts, the largest bearish exposure in about six months. Asset managers had also shifted to a net short DXY stance for the first time since mid-October, aligning with leveraged funds in a broadly bearish dollar view. As Bob Farrell’s Rule #9 notes, when consensus becomes near-unanimous, the market is often closest to a reversal.
The flaw in the dollar-bearish narrative is that it was built on expectations that never materialized. The market assumed the Federal Reserve would begin cutting rates, inflation would continue easing, and foreign currencies such as the euro, yen, and many emerging-market currencies would benefit from an improving global growth outlook.
Instead, inflation has remained stubbornly elevated. April CPI rose 3.8% year-over-year, its highest reading since May 2023, while PPI accelerated to 6%, marking the strongest pace since 2022. Core PPI, which strips out food and energy prices, climbed to 5.2%, underscoring persistent underlying price pressures.
As a result, markets have dramatically reassessed the policy outlook. Expectations for Fed rate cuts throughout 2026 have largely been priced out, while the probability of a rate hike before year-end has rebounded to roughly 35%–39%.
With inflation proving more persistent and monetary easing no longer imminent, the foundation of the widespread short-dollar trade has weakened considerably. The assumptions that justified betting against the dollar are no longer supported by the data.
A fair counterargument to the strong-dollar view is that much of the recent inflation surge can be traced back to energy. The U.S.–Iran conflict that erupted in late February pushed crude oil to its highest levels in four years, making energy the primary driver of both the CPI and PPI increases. Remove food and energy from the equation, and core CPI comes in at 2.8% rather than the headline 3.8%.
From the debasement perspective, the case is straightforward: inflation is being distorted by a temporary oil shock. If crude prices retreat, headline inflation should ease, giving the Federal Reserve room to resume rate cuts and reviving the bearish-dollar thesis.
The challenge with that argument is what lies beneath the surface of the inflation data. April’s PPI report showed that services accounted for roughly 60% of the monthly increase, marking the strongest services inflation since 2022. Meanwhile, core producer prices excluding food, energy, and trade services rose 4.4% year-over-year.
That matters because services inflation is not simply a reflection of higher fuel costs. It points to broader price pressures spreading through the economy, supported by resilient demand and continued economic strength. Unlike an oil-driven spike, these pressures tend to be more persistent and do not disappear as soon as energy prices decline. Even if crude retreats, the underlying inflation trend may prove sticky enough to keep the Fed cautious and delay the policy easing that dollar bears have been counting on.
The bearish-dollar thesis depended on two key developments: easing inflation and Federal Reserve rate cuts. At this point, neither appears to be materializing.
The Hawkish Shift Supporting the Dollar
The confirmation of Kevin Warsh as Fed Chair on May 13 reinforces the possibility of a more hawkish policy environment. The irony is notable. While Warsh was widely expected to support lower rates and has previously acknowledged room for monetary easing, he has spent years criticizing quantitative easing and advocating for a smaller Fed balance sheet. Now he finds himself facing a backdrop of accelerating inflation that limits his flexibility.
Even if Warsh would prefer to deliver the rate cuts many investors anticipated, current economic conditions may not allow it. Following the April CPI release, analysts such as Krishna Guha argued that the inflation data strengthened the case of policymakers who believe the Fed’s next move could be a hike rather than a cut.
The market’s expectations have shifted accordingly. Goldman Sachs has pushed its forecast for the next rate cuts to December 2026 and March 2027, envisioning only two quarter-point reductions over that period. With producer inflation accelerating, oil prices elevated, and labor-market conditions remaining firm, the environment looks far less supportive of a weaker dollar than many investors had expected.
Why the Dollar Trade May Still Be Early
Although the Dollar Index has rebounded from below 97 in late April to around 98.8 by mid-May, the broader move remains modest. The dollar is still lower on the year by roughly 1.5%, meaning the bullish-dollar trade has yet to become crowded.
That is precisely what makes the setup interesting. Investor positioning remains heavily skewed toward dollar weakness, while the fundamental catalysts increasingly point in the opposite direction. If expectations continue to shift toward higher-for-longer rates, the dollar could have significant room to appreciate simply because so few investors are positioned for that outcome.
The 1970s Comparison May Be Misleading
A common argument among dollar bears is that the current environment resembles the inflationary 1970s, implying sustained currency debasement and negative real returns. However, the real-yield backdrop today looks fundamentally different.
Using April’s 3.8% CPI reading, realized real yields remain positive:
2-year Treasury: approximately +0.1%
10-year Treasury: approximately +0.7%
Fed funds rate: approximately +0.7%
Meanwhile, the 10-year Treasury Inflation-Protected Securities (TIPS) market implies a real yield near 1.95%, reflecting investors’ expectations for future inflation rather than current price growth.
Those figures are not especially restrictive, but they are far removed from the 1970s experience, when real yields frequently plunged to around -5%. That distinction matters. Sustained dollar weakness typically requires deeply negative real returns and an aggressively accommodative central bank. Today’s environment features neither condition, suggesting the historical comparison may be overstated and that the case for a stronger dollar remains more compelling than current market positioning implies.
The key takeaway from the 1970s comparison is that while the U.S. fiscal backdrop may share some similarities—rising debt levels and significant foreign ownership of Treasuries—the economic transmission mechanism that drove the dollar’s collapse during that era is largely absent today. The 1970s featured deeply negative real interest rates, a self-reinforcing wage-price spiral, and an economy heavily dependent on oil-intensive industrial production. Without those ingredients, the historical parallel begins to break down.
What a Stronger Dollar Could Mean for Commodities
The implications are significant because many commodity markets remain positioned for the opposite outcome. Gold, silver, and crude oil have all benefited from expectations of a weaker dollar, easier monetary policy, and continued currency debasement. If the dollar strengthens instead, the underlying assumptions supporting those trades become less compelling.
Gold and silver are particularly sensitive to dollar movements. Because they are priced in U.S. dollars, a stronger greenback raises their cost in foreign currencies and can reduce international demand. Silver may face additional pressure because, unlike gold, it relies more heavily on industrial consumption, which tends to soften when financial conditions tighten and economic growth slows.
Oil presents a more complex case. On one hand, crude prices remain supported by supply concerns stemming from the U.S.–Iran conflict. On the other, a stronger dollar and slower global growth would typically weigh on demand and exert downward pressure on prices. As a result, oil is caught between geopolitical risk and macroeconomic headwinds.
According to market commentary from the delta-one desk at Goldman Sachs, a meaningful decline in crude prices could help broaden equity market participation beyond the dominant mega-cap technology names. A stronger dollar could contribute to that outcome, particularly if tensions around the Strait of Hormuz begin to ease.
Why Lower Oil May Not Mean Lower Rates
The most important aspect of the thesis is that falling oil prices do not automatically lead to Federal Reserve easing. Lower crude prices would likely reduce headline inflation, but they would do little to address the persistent services inflation embedded throughout the economy.
If services inflation remains elevated, the Fed may have little incentive to cut rates even as energy prices retreat. In that scenario, the dollar would retain support from relatively high interest rates while commodities lose support from falling inflation expectations.
That dynamic creates a challenging backdrop for the broader commodity-supercycle narrative. Much of the bullish case for gold, silver, and other dollar-denominated assets rests on the assumption of a weakening dollar and easier monetary policy. If those assumptions prove incorrect, the foundation supporting the trade becomes considerably less stable, raising the risk of a significant reversal across commodity markets.
This is where the debate diverges most sharply from the prevailing gold-and-debasement narrative. The common view is that fiat currencies and government bonds are structurally impaired, leaving hard assets as the only viable refuge. But if the dollar strengthens, the chain of effects may point in the opposite direction.
A stronger dollar acts as a powerful transmission mechanism for global financial tightening. It:
Drains liquidity from emerging markets.
Increases the burden of dollar-denominated debt for foreign borrowers.
Tightens global financial conditions.
Slows economic activity outside the United States.
Over time, that slowdown can feed back into the U.S. economy, reducing inflation pressures and lowering inflation expectations. When that happens, long-term Treasury yields tend to fall rather than rise.
This is why the bond market may be more attractive than many investors currently assume. The 30-year Treasury yield closed near 4.98% on May 11, hovering just below the 5% threshold that Michael Hartnett has identified as a level where broader market stress could emerge. If tighter financial conditions begin to weigh on growth, the long end of the Treasury curve could rally as investors seek safety and markets price in slower economic activity.
In that environment, Treasury bonds—after enduring one of their worst multi-year periods in decades—could become one of the biggest beneficiaries of a stronger-dollar regime. The irony is that the same dollar appreciation many investors dismiss as unlikely may be the catalyst that restores bonds’ traditional role as portfolio stabilizers.
Viewed through this lens, the sequence is not:
Dollar weakness → higher inflation → higher bond yields → hard assets win.
Instead, it may be:
Dollar strength → tighter global liquidity → slower growth → lower inflation expectations → lower long-term yields → bonds outperform.
That possibility is largely absent from current consensus positioning. Many investors remain heavily allocated to the debasement trade—long gold, long commodities, short duration, and short dollar. If the dollar continues to strengthen, the assets expected to benefit from inflation could face headwinds, while the most neglected trade may be a recovery in long-duration Treasury bonds.
The broader implication is that the debate may not be about whether inflation exists today, but about which force ultimately dominates: persistent inflation or the growth slowdown that tighter financial conditions can create. If the dollar becomes the vehicle for that tightening, bonds could emerge as the unexpected winner.
How to Position for the Trade
To be fair to the opposing view, the debasement thesis is not without merit. U.S. fiscal deficits remain large, government debt continues to grow, and central banks around the world are accumulating gold at the fastest pace in decades. Meanwhile, bond markets are showing signs of stress elsewhere: Japan’s long-term yields have surged to record highs, and the UK continues to grapple with periodic gilt-market volatility.
The key issue, however, is that these challenges are not unique to the United States. The euro area faces its own fiscal constraints, Japan is dealing with mounting pressure in its government bond market, and the UK remains vulnerable to political and fiscal uncertainty. Currency markets are relative, not absolute. In that comparison, the U.S. dollar still benefits from higher yields, deeper capital markets, and a Federal Reserve that remains reluctant to ease policy while inflation pressures persist.
In other words, the dollar may not be attractive because conditions in the U.S. are ideal—it may be attractive because conditions elsewhere are no better and, in some cases, worse.
A Barbell Strategy for a Stronger-Dollar Scenario
If the stronger-dollar thesis proves correct, a barbell approach offers a logical way to express the view.
One side of the portfolio:
Hold cash and short-duration Treasury bills.
Capture yields above 4%.
Avoid duration risk.
Benefit directly from a higher-for-longer interest-rate environment.
The other side of the portfolio:
Gradually accumulate longer-duration Treasuries as yields approach historically attractive levels.
Long-duration instruments could benefit disproportionately if tighter financial conditions eventually slow growth and drive long-term yields lower.
Vehicles such as long-duration Treasury ETFs become increasingly attractive if the economy weakens while the Fed remains restrictive.
This structure allows investors to earn attractive short-term yields today while maintaining exposure to a potential bond rally if growth deteriorates.
Commodities: More Caution Than Conviction
Under a stronger-dollar scenario, the risk-reward profile for commodities becomes less favorable.
Gold: After a substantial rally over the past year, much of the easy upside may already be reflected in prices.
Silver: Faces both monetary and industrial headwinds if tighter financial conditions weigh on growth.
Oil: Still supported by geopolitical risks, but vulnerable to a combination of stronger-dollar effects and weaker global demand.
Rather than aggressively adding commodity exposure, investors may find it more prudent to reduce overweight positions or maintain only modest allocations as hedges against geopolitical shocks.
The Investment Implication
The central argument is not that a stronger dollar is guaranteed. It is that the market remains heavily positioned for the opposite outcome.
Consensus trades often become vulnerable when the underlying assumptions begin to weaken. If inflation remains sticky, rate cuts continue to be pushed further into the future, and global growth slows under tighter financial conditions, the strongest opportunities may emerge in assets that few investors currently favor:
Long U.S. dollars.
Short-duration Treasuries.
Selective long-duration bond exposure.
Reduced reliance on the commodity-debasement narrative.
The essence of the trade is simple: position for the outcome that the market is least prepared for. If the dollar strengthens while investors remain committed to the weak-dollar consensus, the resulting adjustment could become one of the most consequential macro shifts over the next several quarters.
Silver prices declined sharply to around $72.40 as Federal Reserve officials reiterated concerns about persistent inflationary pressures.
Fed official Schmid noted that policymakers may need to either maintain interest rates at elevated levels for longer or consider further rate hikes to keep inflation under control.
Meanwhile, investors remain focused on the upcoming US Nonfarm Payrolls (NFP) report for May, which could provide fresh clues about the labor market and the future path of monetary policy.
Silver prices (XAG/USD) fell nearly 2% to around $72.40 during Friday’s Asian session, coming under heavy selling pressure after several Federal Open Market Committee (FOMC) officials highlighted persistent inflation risks and suggested that policymakers may need to either maintain current interest rates for an extended period or raise them further.
Higher interest rates from the Federal Reserve (Fed) are generally unfavorable for non-yielding assets such as Silver, as they increase the opportunity cost of holding precious metals.
Speaking at the Bank of Kansas City Economic Forum on Thursday, Kansas City Fed President Jeffrey Schmid emphasized that inflation remains the primary threat to the economy. He noted that policymakers are debating whether to keep rates unchanged for longer or tighten monetary policy further to bring inflation back toward the Fed’s target.
Market participants are now turning their attention to the US Nonfarm Payrolls (NFP) report for May, scheduled for release at 12:30 GMT. Economists expect the US economy to have added 85,000 jobs during the month, down from 115,000 in April. The unemployment rate is forecast to remain steady at 4.3%, while annual Average Hourly Earnings—a key gauge of wage inflation—are projected to slow to 3.4% from the previous 3.6%.
A stronger-than-expected employment report could reinforce expectations that the Fed will maintain a hawkish stance this year. However, weaker labor-market data may have only a limited effect on policy expectations, as Fed officials appear increasingly focused on addressing elevated inflation pressures.
US Dollar Index remains steady as uncertainty over a potential US-Iran deal intensifies.
The US Dollar Index stays flat near 99.25 as uncertainty surrounding a potential US-Iran deal continues to rise. Renewed attacks between Washington and Tehran have revived concerns over a possible escalation in the Middle East conflict. Meanwhile, investors are turning their focus to upcoming US economic releases, including the ADP Employment Change, ISM Services PMI, and May’s Nonfarm Payrolls report.
The US Dollar (USD) traded in a subdued manner during Wednesday’s Asian session, despite rising uncertainty over a potential United States-Iran agreement after both sides exchanged attacks.
At the time of writing, the US Dollar Index (DXY), which measures the Greenback against a basket of six major currencies, was little changed around 99.25.
On Tuesday night, the US Central Command (CENTCOM) announced it had intercepted multiple Iranian missile and drone strikes aimed at regional allies such as Kuwait and Bahrain, while also launching defensive operations against targets on Iran’s Qeshm Island.
The developments have reignited concerns over a renewed Middle East conflict, a situation that could drive oil prices higher and provide further support for the US Dollar.
Historically, the Greenback tends to strengthen during periods of geopolitical tension, as rising energy prices fuel inflation pressures and reduce expectations for aggressive Federal Reserve (Fed) rate cuts.
On the economic front, traders are awaiting the release of the US ADP Employment Change report and the ISM Services Purchasing Managers’ Index (PMI) for May during the North American session.
Meanwhile, Tuesday’s US JOLTS Job Openings report for April exceeded forecasts, showing 7.618 million available positions versus market expectations of 6.88 million.
Attention now turns to Friday’s US Nonfarm Payrolls (NFP) report for May, which is expected to be the key catalyst for the US Dollar this week.
New Zealand Dollar strengthens after upbeat China PMI data, ending a two-day decline against the US Dollar.
NZD/USD gains traction on Wednesday, supported by a mix of positive catalysts. Stronger-than-expected China Services PMI data and the Reserve Bank of New Zealand’s hawkish stance underpin the Kiwi, while a softer US Dollar adds further support. However, ongoing geopolitical tensions may help limit broader USD weakness and restrain additional upside for the pair.
The NZD/USD pair moved higher during Wednesday’s Asian session, climbing toward the 0.5935 area after stronger-than-expected China Services PMI data boosted market sentiment. The pair appears to have ended a two-day losing streak, although ongoing geopolitical tensions could limit further upside.
Data released by RatingDog showed China’s Services PMI rising to 54.4 in May from 52.6 previously, beating market expectations of 52.3 and marking the fastest expansion in three months. The upbeat figures supported antipodean currencies, including the New Zealand Dollar.
Additional support for the Kiwi came from the Reserve Bank of New Zealand’s (RBNZ) unexpectedly hawkish stance and softer demand for the US Dollar. The RBNZ signaled a strong likelihood of a 25-basis-point rate hike at its July 8 meeting and projected the Official Cash Rate (OCR) could climb to around 2.85% by year-end, suggesting as many as three further hikes.
By contrast, markets currently see only a little more than a 50% chance of one additional rate increase from the US Federal Reserve (Fed) this year. Combined with uncertainty surrounding US-Iran negotiations, this has weighed on the Greenback and supported NZD/USD.
Meanwhile, geopolitical risks remain elevated. Reports indicated that US forces intercepted Iranian missile and drone attacks targeting regional allies while carrying out defensive strikes on Iran’s Qeshm Island. US Secretary of State Marco Rubio also stated that sanctions relief for Iran would depend on Tehran abandoning enriched uranium activities.
In addition, US President Donald Trump announced an open-ended extension of the ceasefire alongside the continuation of a US blockade until negotiations are resolved. The persistent geopolitical uncertainty could continue supporting the US Dollar and cap gains for NZD/USD.
Investors now await the US ADP private employment report and the ISM Services PMI data later in the North American session for fresh market direction.
The US Dollar Index (DXY) weakened toward the 98.90 area on Friday as improving risk sentiment reduced demand for traditional safe-haven assets. Although the latest US Core Personal Consumption Expenditures (PCE) Price Index remained unchanged at 3.3% year-over-year in April, reinforcing expectations that the Federal Reserve could maintain higher interest rates for longer, investors focused primarily on geopolitical developments. Reports indicating that the United States and Iran had reached a memorandum of understanding to extend their ceasefire by 60 days, reopen the Strait of Hormuz, and begin nuclear negotiations boosted confidence across financial markets.
The EUR/USD pair advanced toward 1.1670, supported by broad-based US Dollar weakness and improving investor appetite for risk.
Meanwhile, GBP/USD climbed toward the 1.3470 level as reduced demand for the Greenback provided support for the British pound. Sterling remained relatively resilient despite ongoing concerns about the United Kingdom’s fiscal position and slowing economic growth.
In Japan, USD/JPY traded near 159.30. While elevated US Treasury yields continued to offer support to the pair, a softer Dollar limited further gains. The Japanese yen remained under pressure after Tokyo Core CPI slowed to 1.4% year-over-year in May. Additionally, Kazuo Ueda cautioned that energy-related shocks could become more persistent if they begin influencing wages and inflation expectations.
The AUD/USD pair rose toward 0.7190, benefiting from stronger risk sentiment as progress in US-Iran negotiations encouraged demand for growth- and commodity-linked currencies.
In the commodities market, West Texas Intermediate (WTI) crude oil traded near $88 per barrel. Expectations of an extended ceasefire and the potential reopening of the Strait of Hormuz helped ease concerns over supply disruptions, limiting upward pressure on oil prices.
Despite the improved risk backdrop, gold rallied toward the $4,550 area as investors continued to balance optimism over geopolitical developments against lingering uncertainty and persistent global inflation risks. The precious metal remained supported by its role as a hedge against both inflation and geopolitical instability.
Looking Ahead: Key Economic Insights on the Horizon
Market participants will closely monitor a series of speeches and events involving major central bank officials in the coming days, seeking fresh clues on the outlook for interest rates, inflation, and economic growth.
Friday, May 29
Catherine Mann (Bank of England)
Sunday, May 31
Megan Greene (Bank of England)
Christopher Waller (Federal Reserve)
Jerome Powell (Federal Reserve)
Tuesday, June 2
Boris Vujčić (European Central Bank policymaker)
Andrew Bailey
Olaf Sleijpen (European Central Bank policymaker)
Megan Greene
Wednesday, June 3
Kazuo Ueda
Frank Elderson
Michael Barr
Piero Cipollone
Bank of England Monetary Policy Report Hearings
Federal Reserve Beige Book release
Thursday, June 4
Christine Lagarde
Andrew Bailey
Friday, June 5
Swati Dhingra
Andrew Bailey
The week’s schedule places particular emphasis on comments from the Federal Reserve, European Central Bank, Bank of England, and Bank of Japan, with investors looking for signals on the future path of monetary policy. Remarks from Powell, Lagarde, Bailey, and Ueda, alongside the Fed’s Beige Book and the BoE’s policy hearings, could have a significant impact on currency, bond, and equity markets.
Central Bank Meetings and Key Economic Data Set to Drive Markets
Investors will face a busy week of economic data and policy-related events, with releases from China, the Eurozone, the United States, Canada, Australia, Japan, New Zealand, and Switzerland likely to influence expectations for growth, inflation, and interest rates.
Friday, May 29
China Manufacturing PMI
China Non-Manufacturing PMI
Sunday, May 31
Australia TD-MI Inflation Gauge
China Caixin Manufacturing PMI
Monday, June 1
Eurozone Retail Sales
Switzerland Retail Sales
Switzerland GDP
Germany Manufacturing PMI
France Manufacturing PMI
Eurozone Manufacturing PMI
Eurozone Unemployment Rate
Canada Manufacturing PMI
US Manufacturing PMI
Australia Building Permits
Tuesday, June 2
Eurozone CPI Inflation
US JOLTS Job Openings
New Zealand Building Permits
Australia AiG Industry Index
Australia PMI
Australia Q1 GDP
China Caixin Services PMI
Wednesday, June 3
Spain Services PMI
Germany Services PMI
Eurozone Services PMI
Eurozone Producer Price Index (PPI)
US ADP Employment Change (4-week average)
US Services PMI
US Factory Orders
Australia Trade Balance
Thursday, June 4
Switzerland CPI Inflation
Eurozone Retail Sales
US Challenger Job Cuts
US Initial Jobless Claims
US Nonfarm Productivity
US Unit Labor Costs
Japan Labor Cash Earnings
Friday, June 5
Eurozone GDP
Eurozone Employment Change
Canada Employment Report
Canada Average Hourly Wages
Canada Unemployment Rate
US Nonfarm Payrolls (NFP)
US Unemployment Rate
US Average Hourly Earnings
US Labor Force Participation Rate
Canada Ivey PMI
Among the week’s highlights, investors will pay particular attention to Eurozone CPI, Australia’s first-quarter GDP, US JOLTS job openings, ADP employment data, and especially Friday’s US Nonfarm Payrolls report, which could provide critical insight into labor market conditions and influence expectations for future monetary policy decisions. The combination of inflation, growth, and employment data is likely to play a key role in determining the direction of major currencies, equities, bonds, and commodities throughout the week.
Kevin Warsh was officially sworn in today as the 17th Chairman of the FOMC, but persuading policymakers to support interest-rate cuts may prove challenging. The US labor market continues to show resilience — and may even be gaining momentum — while inflation remains above the Federal Reserve’s 2% objective.
Against that backdrop, the US Dollar Index could benefit from expectations of higher US interest rates. If the index breaks above near-term resistance around 99.50, it may quickly rally toward the psychologically important 100.00 level.
In relatively subdued trading ahead of the holiday weekend, Warsh formally succeeded Jerome Powell as the Fed’s new leader. As the preferred candidate of Donald Trump, Warsh is likely to face political pressure to lower borrowing costs. However, current economic conditions make a convincing argument for rate cuts difficult. The unemployment rate remains low, and the latest National Federation of Independent Business Small Business Optimism survey indicates the labor market could be strengthening further rather than slowing.
At the same time, inflation — the other pillar of the Federal Reserve’s dual mandate — is clearly moving in the wrong direction. No matter which inflation gauge is used, price growth remains above the Fed’s 2% target. Moreover, the ongoing conflict involving Iran is likely to add further upward pressure on prices in the months ahead, even if the Strait of Hormuz were to reopen immediately.
Against this backdrop, traders have begun pricing in the possibility of at least one interest-rate hike over the next year. According to the CME Group FedWatch tool, markets are currently assigning a 20% probability that the Federal Reserve could deliver two or more 25-basis-point rate increases by the end of next April.
Although Kevin Warsh is expected to be more cautious about raising interest rates than the average FOMC policymaker — largely due to the political circumstances surrounding his appointment — the broader policy outlook has become increasingly hawkish in recent months.
For now, the Federal Reserve is still expected to keep rates within the current 3.50%–3.75% range throughout the summer unless economic conditions shift unexpectedly. However, if inflation and labor-market data continue to remain strong, even the most dovish members of the committee may eventually have little choice but to support tighter monetary policy.
US Dollar Technical Outlook: DXY 4-Hour Chart
Turning our attention to the charts, higher US interest rates would be expected to support the world’s reserve currency, all else equal. The US Dollar Index (DXY) has been lagging the rally in 2-year Treasury yields (a proxy for near-term FOMC interest rate expectations) since the start of the month, hinting at the potential for a “catch-up” trade to the topside as we head toward June.
From a technical perspective, the US Dollar Index has carved out a sideways range between about 99.00 and 99.50 over the past week and a half, with a symmetrical triangle pattern forming within that zone over the course of this week. The rangebound trade has allowed the world’s reserve currency to correct its overbought condition through time, rather than an outright price correction, a bullish development that hints at another leg higher if 99.50 is eclipsed.
In that scenario, a quick rally toward the psychologically-significant 100.00 level would be the higher-probability development to watch, whereas a bearish breakdown below 99.00 would invalidate the bullish setup and point to a deeper retracement toward 98.50 next.
US financial markets will remain closed on Monday in observance of Memorial Day, leaving investors with a shortened trading week and a relatively light economic calendar. Attention will center on Thursday’s release of the second estimate for Q1 2026 GDP, alongside April’s core PCE data — the Federal Reserve’s preferred measure of inflation.
Throughout the week, eight Federal Reserve officials are scheduled to speak. With limited new economic data available to shape expectations around the FOMC’s policy direction, investors will closely analyze their remarks for any hawkish signals. Markets are currently pricing in a 62.5% probability of a rate hike by December, up from 50% just one week earlier, though some analysts believe tightening could arrive as soon as July.
Another key uncertainty remains President Donald Trump’s recently announced “likely negotiated” peace agreement. On Saturday, Trump stated that the arrangement would reopen the Strait of Hormuz. Iran’s foreign ministry noted that the proposed framework currently consists of a memorandum of understanding as an initial step, with broader negotiations expected within the next 30 to 60 days. However, substantial differences between the two sides still persist.
Meanwhile, global bond yields retreated from recent highs but continued to trade at elevated levels. The yield on the US 10-year Treasury declined to 4.56% after peaking at 4.69%, while the UK 10-year gilt yield eased to 4.90% from 5.19%.
GDP
Thursday’s second estimate of Q1 2026 GDP is expected to remain close to the preliminary 2.0% growth reading. Meanwhile, the Atlanta Fed’s GDPNow model is already projecting Q2 growth at 4.3%, supported largely by a sharp increase in business equipment investment.
Core PCED
April’s core PCED — the Federal Reserve’s preferred measure of inflation — will also be released on Thursday. The index rose 3.2% year-over-year in March, accelerating from 3.0% in February, while headline inflation reached 3.5%. With both the latest CPI and PPI figures coming in stronger than expected, markets are increasingly concerned about another upside inflation surprise, which could reinforce expectations for an additional Fed rate hike.
Consumer Confidence
The May Consumer Confidence Index, due Tuesday, is expected to edge higher from April’s reading of 92.8. Market attention will mainly center on the survey’s labor market components, which are anticipated to show modest improvement.
Unemployment
Initial jobless claims, scheduled for release on Thursday, previously came in at 209,000, while the four-week moving average stood at 202,500. Continuing claims were reported at 1.782 million, with the corresponding four-week average at 1.778 million. Overall, the data continues to point toward gradual improvement in labor market conditions.
Regional Business Surveys
This week’s regional Federal Reserve manufacturing surveys will include the Dallas Fed survey on Tuesday and the Richmond Fed survey on Wednesday. Both the national ISM Manufacturing PMI and the average readings from the five regional Fed surveys have shown improvement in recent months, signaling that the manufacturing recovery is becoming increasingly broad-based.
The regional prices-paid average has risen again to 54.9, while the Producer Price Index (PPI) for final demand is already increasing at an annual rate of 6.0%, highlighting persistent inflationary pressures across the production pipeline.
UK annual headline inflation is expected to soften in April even as monthly inflation edges higher.
The upcoming UK CPI report could give the BoE additional room to leave interest rates unchanged in June.
Pressure on the Pound Sterling remains to the downside, while an inflation figure above forecasts may add to the currency’s weakness.
The Office for National Statistics is set to release the UK Consumer Price Index (CPI) data for March at 06:00 GMT.
As inflation remains a key focus for central banks, investors will closely examine April’s CPI figures for clues on the next policy move by the Bank of England. Any significant divergence from market expectations could trigger short-term volatility in the British Pound (GBP).
What to expect from the upcoming UK inflation report
UK annual inflation is projected to ease to 3% in April from 3.3% in March, although monthly CPI growth is expected to accelerate slightly to 0.9% from the previous 0.7% reading.
The reduction in Ofgem’s energy price cap ahead of the Iran conflict appears to have helped limit the impact of higher energy costs, while fading Easter-related price effects have also contributed to moderating inflation pressures.
Core CPI, which excludes volatile items such as energy, food, alcohol, and tobacco, is projected to slow to 2.6% YoY in April — the weakest pace since July 2021 — reinforcing expectations for softer overall inflation.
Alongside the CPI report, the Office for National Statistics will also release April’s Producer Price Index (PPI) data. PPI Input inflation is forecast to cool sharply to 1% from 4.4% in March, while PPI Output inflation is expected to edge up slightly to 1% YoY from 0.9%.
If confirmed, easing inflation pressures could reduce the urgency for the Bank of England to raise interest rates, particularly as UK unemployment continues to rise following Tuesday’s labor market data. However, the relief may prove temporary. Ofgem is scheduled to revise the energy price cap in July, likely leading to higher household energy bills and renewed upward pressure on headline inflation. The BoE currently expects inflation to peak around 4% later this year.
Analysts at TD Securities noted that while the latest inflation figures may offer short-term reassurance, the full impact of higher energy costs is expected to emerge in the third quarter, with potential second-round inflation effects later in the year.
How could the UK CPI report impact GBP/USD?
Inflation remains a central factor in BoE policymaking and therefore has a major influence on the British Pound. Still, Sterling has been weighed down in May by mounting political uncertainty following the Labour Party’s poor performance in local elections, creating additional pressure on the currency.
In this context, a softer-than-expected inflation reading could offer some support to the Pound by giving the BoE more flexibility to monitor domestic conditions and assess the economic fallout from tensions in the Middle East before adjusting interest rates. BoE Deputy Governor Sarah Breeden warned on Monday that political uncertainty is affecting the business climate and cautioned policymakers against acting too aggressively on rates.
On the other hand, a stronger-than-expected inflation print could place the BoE in a more difficult position and potentially deepen bearish sentiment toward the Pound.
From a technical standpoint, Guillermo Alcala believes the British Pound remains under pressure following last week’s decline. He noted that although Monday’s bullish engulfing pattern on the daily chart helped reduce some downside momentum, the near-term outlook for GBP remains bearish. According to Alcalá, buyers still require stronger momentum to reclaim the former support zone near 1.3450 and shift attention toward the mid-May highs around 1.3530–1.3540.
On the downside, he highlighted Monday’s low near 1.3305 as an important support level. A decisive break below that area could pave the way for further losses toward the late-March and early-April highs around 1.3175.
Gold remains under pressure on Wednesday, extending its decline as the US Dollar stays broadly stronger. Ongoing geopolitical tensions and increasing expectations of further Federal Reserve rate hikes continue to support the greenback near a six-week high. Investors are now awaiting the release of the FOMC Minutes for additional insight into the Fed’s future policy direction.
Gold (XAU/USD) extended its losses on Wednesday, falling to its lowest level since March 30 after briefly rising above the $4,500 mark during the Asian session. The precious metal remains under pressure as the US Dollar (USD) stays strong, supported by persistent geopolitical uncertainty, inflation concerns, and expectations of a more hawkish Federal Reserve (Fed).
Investor caution remains elevated amid uncertainty surrounding a potential US-Iran peace agreement. US President Donald Trump stated on Tuesday that the US could launch another strike on Iran if negotiations fail, noting that he had delayed a planned attack following requests from Gulf leaders. At the same time, Vice President JD Vance said both Washington and Tehran had made significant progress in talks and were seeking to avoid renewed military conflict. However, ongoing disagreements over Iran’s nuclear ambitions and the Strait of Hormuz continue to cloud the prospects for a diplomatic resolution. This uncertainty has reinforced the US Dollar’s safe-haven appeal, weighing further on Gold prices.
Additionally, tensions linked to the US-Iran standoff have kept Crude Oil prices close to monthly highs, fueling inflation worries and strengthening expectations for further Fed tightening. According to the CME FedWatch Tool, markets are now pricing in more than a 55% probability of at least one 25-basis-point rate hike in 2026. Philadelphia Fed President Anna Paulson also indicated that additional tightening could be appropriate if economic growth remains strong or inflation risks intensify. Rising US Treasury yields, driven by these expectations, have added further support to the Greenback while pressuring non-yielding assets such as Gold.
Despite the USD’s strength, traders remain cautious ahead of the release of the FOMC Minutes later in the North American session, which could offer fresh guidance on the Fed’s policy outlook. Further developments in the Middle East are also likely to influence market sentiment. Still, the broader fundamental backdrop continues to favor the US Dollar, suggesting that Gold prices may remain vulnerable to additional downside pressure, with any short-term rebounds likely to face renewed selling interest.
Gold Daily Chart
Gold appears set to extend its downward move below the key $4,500 psychological level.
From a technical standpoint, sustained trading beneath the $4,500 mark may serve as a fresh bearish signal and could pave the way for additional losses. Momentum indicators also continue to favor the downside, with the Relative Strength Index (RSI) remaining in the mid-30s and the Moving Average Convergence Divergence (MACD) staying in negative territory.
These signals suggest that bullish momentum is weakening, although Gold still finds support from the longer-term trend line near the 200-day Simple Moving Average (SMA), currently around $4,363.73. A clear break below this support zone could trigger a deeper correction, while maintaining levels above it may help XAU/USD stabilize and preserve its broader bullish trend despite the current weak momentum conditions.
USD/CHF moves higher as the US Dollar finds support after President Trump threatened to renew attacks on Iran.
Meanwhile, the US 30-year Treasury yield eased to 5.181% after reaching a near 19-year peak of 5.200% on Wednesday.
In Switzerland, preliminary data showed the economy expanded 0.5% in the first quarter, marking its strongest quarterly growth in a year and pointing to a recovery in economic activity.
USD/CHF continued to climb for a second straight session, trading near 0.7890 during Wednesday’s Asian session as demand for safe-haven assets boosted the US Dollar. Market sentiment remained cautious after a Bloomberg report indicated that President Donald Trump had threatened to restart attacks on Iran within days in an effort to pressure Tehran into ending the conflict with Israel. The warning followed a temporary pause in military action after Iran reportedly presented a new proposal aimed at de-escalation.
Concerns over rising energy prices linked to the conflict have also fueled fears of stronger inflationary pressures in the United States. Higher oil prices reinforced expectations that the Federal Reserve could keep interest rates elevated for a longer period or potentially tighten policy further if inflation remains persistent.
Meanwhile, US Treasury yields stayed near multi-month highs. The 30-year Treasury yield eased slightly to 5.181% after touching a nearly 19-year high of 5.200% earlier on Wednesday. At the same time, the 10-year yield hovered close to a 16-month peak of 4.687%, while the 2-year yield remained near a 15-month high of 4.139%, both levels reached on Tuesday.
In Switzerland, preliminary data showed the economy expanded by 0.5% quarter-over-quarter in the first quarter of 2026, up from 0.2% growth in the previous quarter. The reading marked the country’s strongest quarterly growth in a year and suggested that the Swiss economy continues to recover steadily. Investors are now awaiting Switzerland’s first-quarter Industrial Production data, scheduled for release on Thursday.
The US Dollar Index remains supported by growing expectations that the US Federal Reserve will maintain a more hawkish policy stance.
Meanwhile, the benchmark 10-year US Treasury yield briefly surged to 4.659% — its highest level since February 2025 — before pulling back to around 4.591%.
Geopolitical tensions also eased temporarily after President Trump postponed a planned military strike on Iran following requests from Gulf states.
The US Dollar Index (DXY), which tracks the US Dollar (USD) against a basket of six major currencies, edged higher during Tuesday’s Asian session, recovering after posting mild losses in the previous trading day and hovering near the 99.10 mark.
The Greenback found support from growing expectations that the US Federal Reserve (Fed) could maintain a more hawkish monetary policy stance. Overnight, the benchmark 10-year US Treasury yield climbed to 4.659% — its highest level since February 2025 — before easing back to around 4.591%. The spike in yields reflected investor concerns that persistently high energy prices may feed into consumer inflation, potentially forcing the Fed to keep interest rates elevated for longer.
Investors are also paying close attention to developments within the US central bank. According to Reuters, DRW Trading market strategist Lou Brien said recent market volatility has been driven by investors assessing how newly appointed Fed Chair Kevin Warsh will respond to inflationary pressures. Brien noted that markets are looking for reassurance that Warsh will uphold the Fed’s traditional policy mandate and remain independent from political influence coming from the White House.
Despite the Dollar’s strength, improving market sentiment limited safe-haven demand for the currency. Sentiment improved after US President Donald Trump announced a delay to a planned military strike on Iran. Reports indicated that Trump suspended the scheduled Tuesday attack after Persian Gulf allies urged Washington to allow more time for diplomatic negotiations. While the US administration stated it remains ready to act militarily if talks fail, officials have not provided a specific deadline for any potential action.
Silver surged above $85 this week after two separate single-session rallies of more than 6% — first on May 7 amid optimism surrounding Iran peace developments, and again on May 11 ahead of the anticipated Trump-Xi summit. The compression in the gold-silver ratio to 55.46, while gold itself remained relatively stable, makes the driver of the rally clear: markets were repricing industrial demand rather than reacting to fear. Around 60% of silver consumption comes from industrial use, much of it tied to supply chains dependent on US-China trade. Investors bid silver higher in anticipation that an extension of trade détente between Washington and Beijing would benefit industries with heavy silver demand.
Beneath the headline rally, however, a more important structural shift emerged on April 29 — one that could have greater implications for silver over the coming year than any individual price spike.
In the April 15 report, it was noted that March’s 3.3% CPI reading reinforced the stagflationary conditions this newsletter has been monitoring. April’s CPI, released on May 12, climbed further to 3.8% — the highest since May 2023 — confirming that the previous month’s inflation surge was not an isolated event. The Federal Reserve is now confronting a difficult combination of persistent inflation and a weakening labor market, and the events of April 29 highlighted how sharply divided policymakers have become over the appropriate response.
The Fed’s Deepest Division in 34 Years — and Why It Matters for Silver
On April 29, the Federal Open Market Committee voted 8-4 to keep interest rates unchanged at 3.50%–3.75%. The breakdown of votes was revealing: three governors argued rates should rise further, while one believed rates should already be cut. During what may be his final press conference as Fed Chair, Jerome Powell described policy as being “at the high end of neutral or perhaps mildly restrictive.” The statement reflected uncertainty rather than conviction — a central bank divided not only on policy direction, but on the broader outlook for the economy itself.
That same day, the Senate Banking Committee advanced Kevin Warsh’s nomination to replace Powell in a narrow 13-11 party-line vote, marking the first fully partisan committee vote for a Fed Chair nomination in modern history. Powell also announced he would remain on the Board of Governors after stepping down as Chair, positioning himself as a potential counterbalance to his successor. The combination of a fractured committee, a politicized leadership transition, and an outgoing Chair staying on the Board has little historical precedent.
A Federal Reserve unable to cut rates without risking higher inflation — yet unable to raise them without damaging growth — is effectively trapped. Historically, periods of monetary paralysis combined with political uncertainty at the central bank have often created favorable conditions for silver outperformance. The historical pattern is compelling enough to warrant close attention.
Three Periods of Fed Paralysis — and Three Major Silver Bull Runs
From 1978 through January 1980, the Federal Reserve repeatedly swung between tightening policy to combat inflation and easing to avoid recession, ultimately failing to fully address either problem. During that period, silver surged from $6.08 to $49.45 — a gain of more than 700% that cannot be explained solely by the Hunt Brothers’ speculative activity. Inflation exceeded 11% in 1974 and climbed above 14% by 1980, according to Federal Reserve data. The key dynamic, as documented by Fed historians, was that policymakers could not raise interest rates aggressively enough to contain inflation without severely damaging employment. Each delay further weakened confidence in the US dollar and pushed capital toward hard assets such as silver.
A similar pattern emerged between 2008 and 2011. The Fed maintained near-zero interest rates while inflation expectations increased and real yields fell into negative territory. Silver climbed from roughly $8.50 at the depths of the financial crisis to nearly $50 by April 2011, marking a gain of around 480%. Although the context differed — this time the Fed was attempting to stimulate a post-crisis economy rather than contain inflation — the underlying mechanism remained the same: a central bank unable to respond decisively contributed to dollar weakness and stronger silver prices.
The 2020–2022 period offered another example. Massive fiscal stimulus collided with a Federal Reserve that reacted slowly to accelerating inflation pressures. Silver rallied from approximately $12 in March 2020 to above $29 by August, more than doubling within five months. The Fed’s delayed tightening response allowed what was initially viewed as temporary inflation to become more persistent, while silver reflected both growing monetary instability and rising industrial demand.
Across all three episodes, the decisive factor was not simply the level of interest rates, but the Fed’s inability to commit firmly in either direction. During the stagflationary 1970s alone, silver gained roughly 1,546% over the decade as inflation averaged 7.4% annually and policymakers consistently lagged behind price pressures.
Today’s environment has not yet reached the extremes of 1979, but the structural similarities are increasingly difficult to ignore. Inflation remains elevated at 3.8%, wage growth has softened to 0.2% monthly, the US fiscal deficit has expanded to $2.065 trillion, and the Fed’s institutional independence is now openly being challenged.
The market reaction on May 8 underscored this shift. Despite a jobs report that exceeded expectations by 85%, the US dollar weakened rather than strengthened. Normally, stronger economic data supports a currency by attracting capital inflows. When a currency declines on positive economic news, markets may be signaling concern that the broader monetary framework is deteriorating faster than headline employment data suggests.
What This Could Mean for Silver
Even after climbing to $85, silver remains roughly 30% below its all-time high of $121.67 reached on January 29. While prices have risen sharply, the underlying structural backdrop remains largely intact. Metals Focus and the Silver Institute forecast a sixth consecutive annual silver market deficit of 46.3 million ounces. Meanwhile, COMEX registered inventories stand at 79.88 million ounces, with the coverage ratio holding at 13.4% — below the 15% stress threshold for a seventh straight month. The World Silver Survey 2026 also projects global silver supply to decline 2% in 2026 even as industrial demand remains above 650 million ounces annually.
The outcome of the Trump-Xi summit remains uncertain, and geopolitical tensions involving Iran are unresolved. After a nearly 13% rally in just two weeks, a short-term correction from the $85 level would not be unusual. Markets rarely move in straight lines.
However, the broader Federal Reserve dynamic described above appears less like a temporary trading catalyst and more like a structural shift in the monetary system — one that has historically created highly supportive conditions for silver. The April 29 FOMC split vote and the partisan confirmation battle surrounding Kevin Warsh did not immediately trigger a silver rally. Instead, they may have altered the long-term framework through which future market movements will be interpreted.
April’s CPI report delivered mixed signals. On Tuesday, the Labor Department reported that the Consumer Price Index (CPI) climbed 0.6% in April and 3.7% over the past year. Core CPI, which excludes food and energy, increased 0.4% for the month and 2.8% annually. Food prices rose 0.5%, while energy costs jumped 5.6%. Although core inflation came in slightly above expectations, Treasury yields remained relatively stable.
Shelter expenses, particularly owners’ equivalent rent, advanced 0.6% after easing in recent months. Analysts attribute much of this increase to disrupted data collection during the federal government shutdown, which may have distorted the figures.
Despite the uncertainty surrounding the report, inflation has continued to cool since the sharp rise seen in March, leading many investors to shift their attention back toward strong corporate earnings. Historically, equities have served as an effective hedge against inflation.
In periods of uncertainty, investors are often best served by focusing on fundamentally strong companies. Following an impressive earnings season, attention is now turning to upcoming results from NVIDIA and Micron Technology. Their performance could help drive first-quarter earnings growth for the S&P 500 above 20%. With demand continuing to rise for data centers and AI-related infrastructure, forecasts for the next quarter are becoming even more optimistic.
President Donald Trump is also set to begin a high-profile trip to China on Thursday, accompanied by senior officials including Treasury Secretary Scott Bessent and major business leaders such as Jensen Huang, Tim Cook, Elon Musk, and executives from ExxonMobil. The visit is widely viewed as an effort to strengthen commercial ties and reinforce U.S. economic influence amid shifting global power dynamics.
Silver gains support from its critical use in solar panels, electronics, and automotive manufacturing.
However, the precious metal could face pressure as escalating geopolitical tensions and possible disruptions in the Strait of Hormuz push oil prices and inflation higher.
Meanwhile, stronger-than-expected US inflation data has reinforced expectations that the Federal Reserve may keep interest rates elevated for longer to contain persistent inflationary pressures.
Silver prices (XAG/USD) extended their rally for a sixth consecutive session, trading near $86.80 per troy ounce during Wednesday’s Asian session. Growing industrial demand continues to support the metal, as Silver remains widely used in the manufacturing of solar panels, electronics, and automotive components.
Despite the strong upward momentum, geopolitical tensions could pose a major challenge to Silver’s advance. Concerns over a prolonged closure of the Strait of Hormuz may keep oil prices elevated, intensifying inflation pressures worldwide. This environment could encourage central banks to maintain higher interest rates for longer, reducing the attractiveness of non-yielding assets such as Silver as investors shift toward yield-bearing investments.
Tensions in the Middle East remain heightened after comments from US President Donald Trump, who stated that Iran is “under control” while warning that the situation could end either with a new agreement or complete “decimation.” Meanwhile, Iranian Deputy Foreign Minister Kazem Gharibabadi reiterated that any credible peace deal must involve compensation payments, recognition of Iran’s sovereignty over the Strait of Hormuz, and the removal of all US sanctions.
On the economic front, inflation concerns intensified after the US Bureau of Labor Statistics released stronger-than-expected April Consumer Price Index (CPI) data on Tuesday. Headline CPI rose 0.6% month-over-month, lifting annual inflation to 3.8%, the highest reading since May 2023. Core CPI, which excludes food and energy prices, also climbed 2.8% year-over-year. The data strengthened expectations that the Federal Reserve will likely keep interest rates elevated for an extended period in an effort to curb persistent inflation.
The US Dollar Index remained steady as President Trump’s remarks on the Middle East fueled geopolitical uncertainty and market volatility. Hotter-than-expected CPI figures reinforced expectations that the Federal Reserve may keep interest rates elevated for longer to contain persistent inflation pressures. Investors are now turning their attention to upcoming producer inflation data for further clues on how the conflict with Iran is affecting the broader US economy.
The US Dollar Index (DXY), which tracks the Greenback against a basket of six major currencies, held steady near 98.30 during Wednesday’s Asian session after posting gains over the previous two days. The US Dollar continued to draw support from escalating geopolitical tensions in the Middle East following recent remarks by President Donald Trump. Although Trump stated that Iran was “under control,” he warned that the situation would ultimately end either with a new agreement or with complete “decimation.” Meanwhile, Iranian Deputy Foreign Minister Kazem Gharibabadi reiterated that any acceptable peace deal must involve reparations, recognition of Iran’s sovereignty over the Strait of Hormuz, and the full removal of US sanctions.
Additional support for the Greenback came from stronger-than-expected US inflation data, which reinforced hawkish expectations for the Federal Reserve. Investors increasingly believe the Fed will keep interest rates elevated for longer in an effort to contain persistent inflationary pressures. According to data released by the Bureau of Labor Statistics on Tuesday, the US Consumer Price Index (CPI) rose 0.6% month-over-month in April, lifting annual inflation to 3.8%, the highest reading since May 2023. Core CPI, which excludes food and energy prices, also increased, posting a 2.8% annual gain.
With expectations for a Fed rate cut this year largely fading, markets are now pricing in the possibility of a quarter-point rate hike by December. Attention is now turning to upcoming producer inflation figures, which could offer further insight into how the ongoing conflict involving Iran is affecting the broader US economy.
Gold advocates often argue that an expanding supply of dollars automatically weakens the currency: more money in circulation means each dollar buys less, prices rise, and gold serves as the ultimate hedge against this erosion of purchasing power. From this perspective, growth in the money supply is treated as inherently inflationary.
However, this view is overly simplistic for two main reasons. First, it strips away important context around how and why money supply expands. Second, it ignores a crucial driver of inflation that is just as important as supply itself: the velocity of money.
A recent commentary by Michael Oliver of Momentum Structural Analysis prompted a closer look at this debate. He points out that M2 has increased by roughly 45% since 2020, implying a steady erosion in the real value of cash “year by bloody year,” while reinforcing gold’s role as a preferred alternative store of value. While this is a persuasive narrative, the link between money supply expansion and inflation is not as direct or mechanical as often implied, and requires a more nuanced interpretation of M2 dynamics.
It is also worth noting that Oliver’s bullish stance on gold is not based solely on M2 growth. He also cites several additional factors, including the long-term debasement of fiat currencies by central banks, supportive technical structures, declining confidence in central bank credibility, geopolitical tensions increasing safe-haven demand, and persistent fiscal deficits that necessitate continued monetary accommodation.
Context Matters
Simply pointing to M2 growth in isolation is not meaningful without proper context. To clarify this point, we can refer back to a recent Commentary.
If inflation is the key reason for buying or selling gold, then what truly matters is how money supply growth compares to economic growth. On that basis, the picture changes significantly. During 2020 and 2021, M2 expanded far more rapidly than the real economy. However, in the years since, money supply growth has slowed considerably. Over the broader six-year period referenced by Oliver, GDP growth has actually modestly outpaced M2 expansion.
Assuming, for simplicity, that monetary velocity remains stable (a topic we address separately below), the implication is clear: M2 growth was strongly inflationary during 2020–2021, but in the current environment it is, at best, neutral—and may even be disinflationary or deflationary.
The intuition is straightforward. If an economy produces 10% more goods and services, but the money supply only expands by 5%, there is relatively more supply of goods than purchasing power. That imbalance forces either price reductions or rising unsold inventories. In both cases, the pressure on prices is downward rather than upward.
In that sense, if gold is being held primarily as a hedge against inflation, then relying on M2 growth alone may have been a reasonable argument during the pandemic-era monetary surge. But under current conditions, that same rationale is far less convincing without additional supporting factors.
Monetary Velocity Also Matters
Consider a simple thought experiment.
What if the government secretly printed an enormous amount of money, locked it away in a vault, and permanently lost the key? Would that sudden increase in the money supply drive prices of goods and services higher?
The answer is no—it would have virtually no impact.
Now imagine a different scenario: rumors of that hidden stockpile begin to circulate. Even though the money still isn’t being spent, expectations shift. People start to anticipate future spending, and that change in behavior alone could begin to influence prices.
The distinction here is important. Inflation is not determined solely by how much money exists “on paper.” It also depends on how actively that money is used—how quickly it circulates through the economy. This is what economists refer to as monetary velocity.
In other words, price levels are shaped not just by the supply of money, but by the willingness and ability of households, businesses, and institutions to spend it. When velocity is high, money changes hands quickly and exerts more upward pressure on prices. When velocity is low, even a large money supply may have limited inflationary impact.
This is why analyzing inflation through M2 alone can be misleading: without considering velocity, the picture is incomplete.
What Is Monetary Velocity
According to the Federal Reserve Bank of St. Louis, the velocity of money refers to the rate at which a single unit of currency is used to purchase domestically produced goods and services over a given period of time. In simpler terms, it measures how often each dollar is spent within the economy.
Put differently, it reflects how many times one dollar changes hands to facilitate transactions during a specific timeframe. When monetary velocity rises, it indicates that more economic transactions are taking place between individuals and businesses, signaling a more active flow of spending.
Velocity is therefore influenced by both economic activity and the money supply. A shrinking money supply does not necessarily imply lower prices if economic activity is strong and money is circulating rapidly—velocity can rise and still exert upward pressure on prices. Conversely, even if the money supply expands significantly, inflation may remain muted if that money is not actively being spent, meaning demand for goods and services stays weak and price pressures remain limited.
In short, monetary velocity helps explain why the relationship between money supply and inflation is not mechanical: it is the interaction between how much money exists and how quickly it is used that ultimately matters for price dynamics.
What Impacts Velocity?
Monetary velocity doesn’t move randomly—it reflects how people, businesses, and financial systems behave. A range of economic and psychological factors can either accelerate or slow the rate at which money changes hands.
Factors typically associated with higher velocity
These conditions encourage spending, investing, and faster circulation of money:
Lower interest rates — reduce the incentive to hold cash, encouraging spending and investment instead
Strong consumer and business confidence — optimism about the future leads to higher spending activity
Rising inflation expectations — if people expect prices to increase, they tend to spend sooner rather than later
Easy credit conditions — abundant lending increases effective purchasing power and transaction volume
Technological innovation — new products, services, and platforms create additional channels for spending
Income and wage growth — higher earnings support more frequent and larger transactions
Economic expansion — growing output naturally leads to more economic exchanges per unit of money
Factors typically associated with lower velocity
These conditions encourage saving, caution, or reduced spending:
Recessions or economic uncertainty — fear leads households and firms to defer spending
Expectations of falling prices (deflation) — consumers delay purchases in anticipation of cheaper goods later
Debt reduction (deleveraging) — paying down loans removes credit-driven money from active circulation
Aging populations — older demographics generally spend less and save more
Financial or banking stress — tighter credit conditions reduce lending and the “multiplier” effect of money
The key takeaway
Velocity is ultimately a behavioral and structural variable. It reflects confidence, incentives, credit conditions, and demographics—not just monetary policy or money supply figures. This is why two economies with similar M2 growth can experience very different inflation outcomes depending on how actively money is being used.
M2 and Core CPI
With a clearer understanding of monetary velocity, we can re-examine the common claim among gold advocates that M2 growth and inflation move closely together.
To test this more rigorously, a regression analysis is conducted using quarterly data on M2 and monetary velocity against Core CPI since 2010.
In this context, Core CPI is used instead of headline CPI because it excludes volatile food and energy components. These categories are often influenced by short-term shocks such as geopolitical events or weather conditions, which can obscure underlying inflation trends. By focusing on Core CPI, the analysis aims to capture a more stable and statistically meaningful relationship.
The first step of the analysis examines how M2 alone relates to Core CPI, allowing us to quantify the direct association between money supply growth and underlying inflation over time.
The results suggest that M2 growth, in isolation, has a very weak and statistically insignificant relationship with Core CPI. The R-squared value of 5.13% implies that changes in M2 explain only a small fraction of the variation in Core CPI over the sample period. In practical terms, most inflation dynamics are driven by other factors outside the money supply variable alone.
The negative t-statistic (-1.771) further indicates that the estimated relationship is not only weak but also inversely signed in this model specification—meaning that, within this dataset, higher M2 growth is associated with slightly lower Core CPI. However, this relationship is not statistically robust and should not be interpreted as causal.
Using the regression equation to forecast Core CPI from M2 alone therefore produces unreliable results. As expected from the low explanatory power of the model, the output has little predictive value and is effectively not useful for practical forecasting.
Overall, the takeaway is that M2 by itself is a poor standalone indicator of inflation dynamics, reinforcing the importance of incorporating additional variables—such as velocity, credit conditions, and broader economic activity—when analyzing price pressures.
M2, Velocity, and CPI
Next, we extend the analysis by incorporating monetary velocity into the multiple regression framework alongside M2.
The R-squared value indicates that the relationship becomes substantially stronger when both M2 and monetary velocity are included in the model, with the combined variables explaining more than half of the variation in Core CPI.
In addition, the F-statistic’s near-zero p-value suggests that the overall model is highly statistically significant, meaning there is a very low probability that these results are due to chance.
Finally, when the model’s implied Core CPI is plotted against actual Core CPI, the comparison shows that the combination of money supply and velocity tracks inflation much more closely than M2 alone. This supports the view that inflation dynamics are better understood as a function of both liquidity (M2) and its rate of circulation (velocity), rather than money supply in isolation.
Summary
There are valid reasons to buy and hold gold, but for short-term traders, it is important to understand the narratives that often drive gold price action.
The idea that rising money supply alone explains inflation—and therefore supports higher gold prices—can be misleading. As discussed, this relationship needs to be placed in proper context relative to economic growth. Equally important is not just the quantity of money in circulation, but the rate at which it circulates through the economy, or monetary velocity.
Many widely accepted macro narratives appear intuitive at first glance, but lose explanatory power once examined more closely. It is in these gaps between narrative and reality that investors can better understand the true drivers of asset prices—and reduce the risk of being caught offside when simplified stories fail to hold up in practice.
Nonfarm Payrolls are forecast to increase by 62K in April, while the Unemployment Rate is expected to remain unchanged at 4.3%. The USD could face elevated volatility ahead of the weekend.
The United States Bureau of Labor Statistics is set to release the April Nonfarm Payrolls (NFP) report on Friday at 12:30 GMT, with markets closely watching the data for clues on the Federal Reserve’s interest-rate path later this year.
Economists expect the US economy to add 62K jobs in April, a sharp slowdown from March’s stronger-than-expected 178K gain. The Unemployment Rate is forecast to remain steady at 4.3%, while annual wage growth, measured by Average Hourly Earnings, is seen accelerating to 3.8% from 3.5%.
Analysts at TD Securities expect signs of stabilization in the labor market after several volatile months. They forecast payroll growth of around 80K, driven mainly by hiring in healthcare and leisure & hospitality, while government employment may decline slightly. They also expect monthly wage growth to stay modest at 0.2%.
Additional labor indicators released earlier this week painted a mixed picture. ADP reported that private-sector employment rose by 109K in April, improving from March’s revised 61K increase. Meanwhile, the Employment Index in the Institute for Supply Management Services PMI climbed to 48 from 45.2, signaling that service-sector hiring is still contracting, though at a slower pace.
What impact will the US March Nonfarm Payrolls have on EUR/USD?
EUR/USD is likely to remain highly sensitive to the upcoming US Nonfarm Payrolls (NFP) report, as investors reassess the outlook for the Federal Reserve and the broader direction of the US Dollar.
Despite the Fed’s relatively hawkish April meeting, the USD has struggled to gain traction amid improving global risk sentiment and easing geopolitical tensions in the Middle East. Comments from Fed Chair Jerome Powell reinforced a data-dependent approach, while Austan Goolsbee acknowledged that labor market conditions have softened, even if they remain broadly stable.
Markets currently expect the Fed to keep rates unchanged through the end of 2026, though traders still see some probability of either a rate hike or cut depending on incoming data. A weak NFP reading — particularly below 30K alongside a higher Unemployment Rate — could strengthen expectations for rate cuts later this year. In that scenario, the USD may weaken further, allowing EUR/USD to extend gains.
On the other hand, a stronger-than-expected payrolls figure could reduce expectations for monetary easing and help the USD stabilize. This would likely cap EUR/USD upside, although a sustained dollar rally may remain limited if risk appetite stays strong heading into the weekend.
From a technical perspective, FXStreet analyst Eren Sengezer notes that EUR/USD maintains a bullish near-term bias. The pair continues to trade above its 100-day and 200-day Simple Moving Averages, while the Relative Strength Index trends toward bullish territory.
Key resistance is seen around 1.1800–1.1810, followed by 1.1900–1.1910 and the psychological 1.2000 level. On the downside, major support stands in the 1.1710–1.1680 zone, with further downside targets at 1.1650 and 1.1560 if selling pressure intensifies.
USD/GBP has remained under pressure since early April, driven mainly by uncertainty among central banks over how the conflict in Iran could affect inflation and energy prices. On Thursday, April 30, a fresh batch of economic data reinforced the cautious stance adopted by both the Federal Reserve (Fed) and the Bank of England (BoE).
Over the past month, the pair has fallen 2.8%, with ongoing tensions in the Middle East continuing to fuel market volatility.
While recent inflation data from both the United States and the United Kingdom drew attention, markets remained focused on the broader energy risks linked to the closure of the Strait of Hormuz, which has become a key factor behind the cautious outlook.
Energy driving USD/GBP
For currency traders, USD/GBP has increasingly behaved like a proxy for crude oil rather than reacting primarily to interest rate differentials, though energy market disruptions have also directly influenced monetary policy expectations on both sides of the Atlantic.
Over the past week, the pair has maintained a notably strong correlation with Brent crude, ranging between 0.96 and 0.97. In practical terms, this suggests that USD/GBP tends to rise alongside oil prices and fall when crude declines. Since correlations closer to 1 indicate an almost perfect relationship, the current pattern highlights the extent to which oil prices are steering movements in the pair.
Recent volatility in crude — which briefly surged nearly 7% to a four-year high of $126 per barrel — was largely triggered by reports that the US military was preparing to brief President Donald Trump on potential new actions involving Iran.
“We saw oil prices climb on fears over supply disruptions, making energy one of the few sectors to post gains,” Wealthify said in its monthly market summary. “Equity markets declined broadly, with losses across the US, Europe, the UK, and Asia, leaving investors with limited regional shelter.”
“The Federal Reserve kept rates unchanged in March, but rising oil prices and inflation concerns cast uncertainty over future rate cuts, pressuring bond prices lower. In the UK, mounting inflationary pressures alongside a softer labour market strengthened expectations that the Bank of England may keep rates elevated for longer, with the possibility of another hike later this year.”
The connection between energy markets and USD/GBP has therefore become a dominant force shaping sentiment, often overshadowing corporate earnings and other macroeconomic drivers. At the same time, interest rate expectations themselves are increasingly being influenced by the Middle East conflict, with recent central bank guidance offering key clues about the future direction of both the US Dollar and the British Pound.
Rates fuel cautious optimism
Thursday, April 30, 2026, brought a wave of central bank updates with important implications for USD/GBP.
The Bank of England (BoE) began the day by keeping its benchmark interest rate unchanged at 3.75%, while warning that the conflict in Iran could eventually trigger further inflation pressures and potentially require additional rate hikes.
The decision to hold rates passed by an 8–1 vote, though policymakers signaled that future tightening remains possible, including the prospect of more aggressive increases if inflation risks intensify.
Meanwhile, the United States released its March Personal Consumption Expenditures (PCE) Price Index data. Headline inflation came in slightly below expectations at 3.5%, versus forecasts of 3.6% from economists.
Excluding volatile food and energy prices, the Federal Reserve’s preferred core inflation measure rose 3.2%, matching market expectations and once again underscoring the uncertain influence of geopolitical tensions in the Middle East.
Additional US economic data released Thursday showed weekly jobless claims falling to 189,000 — the lowest level in more than 50 years — signaling ongoing resilience in the labor market and strengthening hopes for continued economic recovery.
While strong US labor data would normally support the Dollar against the Pound, expectations that the BoE may raise rates further are emerging as a key bullish factor for Sterling.
Markets now appear to be pricing in a more hawkish outlook for the UK, whereas sentiment in the United States is becoming comparatively more cautious despite elevated inflation linked to the Iran conflict. Although the Federal Reserve also left rates unchanged recently, several major financial institutions — including Capital One Financial, Synchrony Financial, and Marcus by Goldman Sachs — have already reduced yields on high-yield savings accounts.
These developments highlight growing differences in the monetary policy outlook between the two sides of the Atlantic, a divergence that forex traders are likely to monitor closely in the months ahead.
What’s next for USD/GBP?
The prospect of a more hawkish stance from the Bank of England, fueled by rising energy-driven inflation, could place further downward pressure on USD/GBP in the coming weeks. However, the key factor shaping the pair’s direction will remain developments surrounding the conflict in Iran and the continued closure of the Strait of Hormuz.
If the conflict drags on and keeps energy markets under strain, the BoE may be forced to respond with more aggressive rate hikes to contain inflationary pressures. In contrast, the Federal Reserve could continue facing political pressure from the US administration to lower interest rates, even as higher oil prices complicate the inflation outlook.
Against this backdrop of heightened volatility and uncertainty, a prolonged Middle East conflict could potentially drive USD/GBP toward the 0.71 level. At the same time, expectations for future US rate cuts may extend the Dollar’s broader long-term weakness against major global currencies.
Gold draws some buying interest on Thursday as the US dollar pauses following its post-FOMC rally. Meanwhile, elevated crude oil prices continue to stoke inflation concerns and reinforce expectations of a more hawkish Federal Reserve. At the same time, the ongoing US–Iran standoff underpins the dollar, which in turn caps further upside for the metal.
Gold (XAU/USD) extends its modest rebound from the $4,500 area—its latest monthly low—and gains traction during Thursday’s Asian session. The US dollar is currently consolidating after a hawkish Fed-driven rally to a two-and-a-half-week high, providing a supportive backdrop for the metal.
As expected, the Federal Reserve left interest rates unchanged at 3.50%–3.75%, though the decision saw the most dissent since 1992, with three officials opposing the policy tone. Fed Chair Jerome Powell later emphasized that the disagreement centered on communication rather than the need for rate hikes. Still, markets scaled back expectations for policy easing in 2026 and are now assigning a modest probability to a rate increase by year-end.
At the same time, surging energy prices—driven by ongoing US–Iran tensions and stalled negotiations—are reinforcing inflation concerns and supporting the dollar. In a recent development, President Donald Trump dismissed Iran’s proposal to end the conflict, insisting that no agreement would be reached unless Tehran abandons its nuclear ambitions. He also highlighted that naval blockades are continuing to disrupt energy flows through the Strait of Hormuz.
These factors may help sustain the dollar’s strength and limit gold’s upside potential. Even so, the precious metal has broken a three-day losing streak and is trading near $4,580, up about 0.75% on the day. Market participants now turn their attention to key US data releases, including the advance Q1 GDP report and the PCE Price Index, along with upcoming policy decisions from the Bank of England and the European Central Bank, which could drive further volatility.
Gold chart
Gold could face renewed selling pressure at higher levels, given the weakening technical outlook.
The recent rejection near the 200-period Simple Moving Average (SMA) on the 4-hour chart, combined with a drop below the 38.2% Fibonacci retracement of the March–April rally, tilts the bias in favor of XAU/USD bears.
Momentum signals also remain fragile, with the Relative Strength Index (RSI) lingering around 38 and the Moving Average Convergence Divergence (MACD) still in negative territory. This indicates that any recovery attempts may struggle as long as prices remain capped below key resistance levels.
On the downside, initial support is located near the 50% retracement around $4,494.59, followed by deeper Fibonacci support levels at $4,401.36 and $4,268.64, which could act as a broader cushion if selling pressure intensifies.
The US Dollar Index hovered around 98.65 in early Wednesday Asian trading, showing little change. The Fed is broadly expected to keep rates unchanged at 3.50%–3.75% at its April meeting. Market focus will then turn to Thursday’s US Q1 GDP and PCE inflation data.
The US Dollar Index (DXY), which tracks the value of the US Dollar (USD) against a basket of six major currencies, is trading around 98.65 during Wednesday’s Asian session. The index remains stable as investors await the Federal Reserve’s interest rate decision later in the day.
The Fed is widely anticipated to keep the federal funds rate unchanged at 3.50%–3.75%, a level maintained since January. This meeting may also be Chair Jerome Powell’s last before a potential transition to nominee Kevin Warsh.
Market participants will pay close attention to Powell’s post-meeting press conference for guidance on the Fed’s outlook amid ongoing economic risks. A more hawkish stance on persistent inflation could provide short-term support for the US Dollar against other major currencies.
According to Carol Kong, currency strategist at Commonwealth Bank of Australia, uncertainty remains over Powell’s future role, including whether he will step down as Chair or continue serving as a governor beyond his term.
Looking ahead to Thursday, investors will focus on the preliminary US Q1 GDP data and the Personal Consumption Expenditures (PCE) Price Index. Weaker-than-expected results from these reports could put downward pressure on the DXY.
EUR/USD Price Forecast
EUR/USD remains steady around 1.1700 ahead of upcoming Fed and ECB policy decisions, with both central banks expected to keep rates unchanged. Meanwhile, German HICP is projected to rise at a faster annual rate of 3% in April.
EUR/USD trades sideways around 1.1700 in Wednesday’s Asian session, as markets await key Fed and ECB policy decisions. Both central banks are expected to keep rates unchanged while flagging inflation risks linked to higher energy prices amid ongoing Strait of Hormuz disruptions. Investors will closely watch commentary from Jerome Powell and Christine Lagarde for signals on future policy direction. Ahead of the meetings, attention also turns to German April HICP data, expected to show inflation rising to 3% YoY from 2.7%.
EUR/USD technical outlook
EUR/USD is trading flat around 1.1700, showing a sideways bias as it continues to hover near the 20-day EMA at 1.1698, while still holding above the 38.2% Fibonacci retracement level at 1.1666.
The RSI has moved back into the 40–60 neutral zone after failing to sustain levels above 60, signaling fading upside momentum, although the broader bullish bias is still in place.
On the upside, immediate resistance is seen at the 50% Fibonacci level near 1.1745, followed by 1.1825 (61.8% retracement), then 1.1938 and the recent cycle high around 1.2082. On the downside, initial support lies at 1.1666; a break below this level could open the way toward 1.1567 (23.6% retracement) and further down to the key structural support near 1.1408.
USD/JPY weakens below 159.50 during Monday’s Asian session, extending its pullback from near the key 160.00 psychological level. The pair is pressured by renewed US dollar softness and lingering fears of Japanese intervention, while a slight improvement in risk sentiment also supports the yen. Meanwhile, traders are largely looking past tensions between the US and Iran, turning their focus to this week’s monetary policy decisions from the Bank of Japan and the Federal Reserve.
Technical Analysis
Aside from a few brief knee-jerk moves, USD/JPY has been trading within a range since mid-March. Considering the recent solid rebound from the technically important 200-day EMA, this price action can still be seen as a phase of bullish consolidation, supporting a positive overall outlook.
Momentum indicators also point to a constructive setup rather than an overstretched market. The RSI sits near 57, indicating sustained upward pressure without entering overbought territory. Meanwhile, the MACD remains slightly below the zero line, suggesting only mild bearish momentum that has yet to threaten the broader uptrend.
That said, buyers should wait for a clear and sustained move above the 160.00 psychological level before targeting further upside. In the meantime, any pullbacks are likely to be viewed as corrective within the broader bullish structure, as long as USD/JPY stays above the key long-term support near 154.76. A decisive break below this level would be needed to indicate a more significant shift in trend.
Fundamental Analysis
USD/JPY extends last week’s rebound from the mid-157.00s, advancing for a fourth consecutive day on Thursday. The Japanese yen remains under pressure due to economic concerns tied to escalating Middle East tensions and expectations that the Bank of Japan may delay further rate hikes. At the same time, ongoing geopolitical uncertainty reinforces the US dollar’s safe-haven appeal, pushing the pair to a one-and-a-half-week high during the early European session.
Although US President Donald Trump announced a temporary extension of the Iran ceasefire just before its expiration, investors remain doubtful about any lasting de-escalation. Limited progress in negotiations, tensions surrounding the Strait of Hormuz, and continued friction—highlighted by the US naval blockade of Iranian ports—keep risks elevated. Iran’s chief negotiator, Mohammad Bagher Ghalibaf, stated that reopening the strategic waterway is not feasible under current conditions. These developments raise concerns about disruptions to energy supplies, posing potential strain on Japan’s economy and weighing further on the yen.
Meanwhile, reports indicate that the Bank of Japan is inclined to keep policy unchanged this month, as uncertainty over the Middle East conflict clouds the economic and inflation outlook. This adds to downward pressure on the yen, though the central bank is still expected to signal readiness to tighten policy as early as June amid rising inflation. Additionally, speculation that Japanese authorities could intervene to support the currency may limit further yen weakness and cap USD/JPY gains near the 160.00 psychological level. Even so, any meaningful pullback appears limited given the underlying strength of the US dollar.
Higher crude oil prices are also reviving inflation concerns, reducing expectations of a dovish stance from the Federal Reserve. This pushes US Treasury yields higher and continues to support the dollar, suggesting that the overall bias for USD/JPY remains tilted to the upside. Traders now turn to upcoming US data, including weekly jobless claims and flash PMI releases, though attention is likely to remain focused on developments in the US–Iran situation, which could drive further market volatility.
Gold prices climbed during Asian trading on Wednesday, rebounding from a one-week low after the U.S. extended its ceasefire with Iran indefinitely, though uncertainty around future peace negotiations persisted.
The precious metal had come under pressure in the previous session after Federal Reserve Chair nominee Kevin Warsh indicated he had not assured President Donald Trump of any interest rate cuts if confirmed.
Spot gold gained 0.9% to $4,763.66 per ounce, while gold futures advanced 1.3% to $4,782.21/oz as of 02:45 ET (06:45 GMT). Prices continued to trade within the $4,700–$4,900 range observed over the past two weeks.
Other precious metals also posted gains, with spot silver rising 2.4% to $78.5335/oz and spot platinum increasing 2.3% to $2,087.15/oz.
On Tuesday, Donald Trump announced an indefinite extension of the ceasefire with Iran, opening the door for further negotiations between Washington and Tehran.
Despite the extension offering some near-term relief, the outlook for future peace talks remains unclear. Expected discussions between the U.S. and Iran, which were slated for Tuesday, collapsed at the last minute.
Trump also stated that a naval blockade against Iran would stay in place, prompting backlash from Iranian officials, who described the move as an “act of war.”
Gold has faced difficulties since the conflict began, as safe-haven demand has been outweighed by concerns over the war’s potential to drive inflation.
Since the outbreak of the conflict in late February, the metal has traded more like a risk-sensitive asset, often moving in line with equities as market sentiment shifts with developments in the situation.
Warsh signals no pledge on rate cuts, hints at major Fed policy changes
Precious metals came under pressure on Tuesday as the U.S. dollar strengthened, supported by market reaction to testimony from Kevin Warsh.
Warsh stressed the importance of the Federal Reserve’s independence from political influence, while also pointing to the possibility of a significant policy overhaul at the central bank if he is confirmed as chair.
A former Fed governor, Warsh is viewed as less dovish than markets had anticipated. His nomination in late January had already sparked sharp declines in gold and other precious metals.
Although his confirmation appears likely, the timeline remains uncertain. Several Republican leaders have opposed moving forward with Warsh’s appointment until the Trump administration ends its ongoing probe into current Fed Chair Jerome Powell.
As a result, Powell is expected to remain in his role beyond the scheduled end of his term on May 15, particularly if Congress delays Warsh’s confirmation.
The U.S. Consumer Price Index (CPI) is forecast to increase by 3.3% year-on-year in March, driven sharply higher by rising energy prices. Core CPI inflation is also expected to tick up slightly to 2.7% annually. Meanwhile, the EUR/USD technical outlook remains mildly bullish in the near term.
The U.S. Bureau of Labor Statistics (BLS) is scheduled to release March Consumer Price Index (CPI) data on Friday.
The report is widely expected to show an uptick in inflation, largely driven by the surge in crude oil prices following increased tensions after a joint U.S.–Israel strike on Iran.
The monthly CPI is projected to increase by 0.9%, up from a 0.3% rise in March, while the annual rate is expected to climb to 3.3%—its highest level since May 2024—from 2.4% in February. Core CPI, which excludes food and energy, is forecast to rise 0.3% on the month and 2.7% year-on-year.
Since the outbreak of conflict in the Middle East on February 28, West Texas Intermediate (WTI) crude has surged roughly 40%, even after easing following a recent two-week ceasefire announcement between the U.S. and Iran. In March alone, WTI jumped nearly 50%, rising from around $67 per barrel to close near $100.
According to TD Securities analysts, the spike in crude prices is expected to be the main driver behind the sharp 0.9% monthly CPI increase, pushing the annual reading up by nearly one percentage point to 3.3%, marking a two-year high. They also noted that core inflation is likely to remain relatively contained at 0.27% month-on-month, though goods prices may continue to rise due to tariff pass-through, with “supercore” inflation staying firm around 0.3%.
CPI data
The next CPI report is expected to be heavily influenced by recent volatility in oil prices, meaning the March inflation print will likely show a noticeable jump in headline CPI—something that markets have already largely anticipated.
Even if annual inflation rises to around 3.3% as forecast, investors may treat it as a temporary spike rather than a lasting inflation trend, assuming oil prices retreat if geopolitical tensions ease and a durable truce in the Middle East helps stabilize supply routes such as the Strait of Hormuz.
However, uncertainty around the durability of any ceasefire—and political conditions tied to control of key shipping lanes—adds risk to the outlook. This makes it harder to assume a sustained decline in oil prices, and therefore keeps inflation expectations sensitive to geopolitical developments rather than the CPI data alone.
On the policy side, the Federal Reserve’s recent meeting minutes suggest policymakers are becoming more cautious about cutting interest rates. Many are concerned that inflation could remain stickier than expected, especially if higher energy prices begin to feed into broader price pressures.
Still, some analysts, such as those at BBH, argue that if underlying (core) inflation stays contained, the Fed may be able to “look through” the temporary oil-driven inflation spike and avoid tightening further, even amid a mixed U.S. labor market.
What impact might the US Consumer Price Index (CPI) report have on EUR/USD?
Currently, markets are pricing in about a 75% probability that the Federal Reserve will keep its policy rate unchanged at 3.5%–3.75% by the end of the year, a sharp increase from just 17% on March 9, according to the CME FedWatch Tool.
A stronger-than-expected March CPI reading may have limited impact on reshaping expectations for the Federal Reserve’s interest rate path. However, if high inflation data coincides with renewed escalation in Middle East tensions and rising concerns that shipping activity in the Strait of Hormuz will not return to normal levels soon, markets could start pricing in a higher likelihood of a Fed response to persistent inflation pressures. In that case, the US dollar could strengthen, pushing EUR/USD lower.
On the other hand, the dollar may stay under pressure—and EUR/USD could extend its recovery—if oil prices keep declining steadily, even if the CPI report comes in hot.
Overall, March inflation data alone is unlikely to trigger a major market reaction, with investors remaining more focused on the US–Iran geopolitical situation and its implications for energy prices.
From a technical perspective, Eren Sengezer, FXStreet European Session Lead Analyst, notes that EUR/USD’s short-term outlook remains tilted to the upside. The RSI on the daily chart has moved above 50 for the first time since the US–Iran conflict began, and the pair has broken above a two-month descending trendline.
Key resistance levels are seen at 1.1730 (Fibonacci 50% retracement of the February–April move), followed by 1.1800 (61.8%) and 1.1900 (78.6%). On the downside, initial support lies at 1.1650 (38.2%). If that level breaks, sellers may target 1.1560 (23.6%) and then the psychological 1.1500 level.
Gold is once again being driven primarily by interest rates rather than risk sentiment, with US Treasury yields taking the lead as markets head into a heavy US data schedule.
The inverse relationship between gold and yields has strengthened notably, placing key inflation readings like CPI and core PCE at the center of attention. Prices are currently moving within a clear range, with support around $4700 and resistance between $4800 and $4850. The next directional move will likely depend on whether yields continue rising or begin to ease, while ongoing developments surrounding the US–Iran ceasefire remain a secondary influence.
This renewed sensitivity to yields signals a return to more traditional macro dynamics, following a period where gold traded more like a high-volatility risk asset.
Whether this rate-driven relationship will persist is still uncertain. However, with correlation coefficients currently sitting in the high negative 0.9 range across both short- and long-term Treasury yields, gold is now highly sensitive to movements in interest rates. This sharp linkage brings not only developments in the US–Iran ceasefire into focus, but also an upcoming wave of US economic data that is likely to challenge and validate the strength of this relationship in the near term.
Inflation data is set to put this relationship to the test.
While the Fed’s preferred inflation gauge, the core PCE deflator, is due later today, it may carry less weight as it reflects February data and predates the energy price shock linked to the Iran conflict. Instead, markets may focus more on income and spending figures for clues on consumption and broader economic momentum in the March quarter. Strong data could reignite concerns about rising inflation, while weaker numbers may ease pressure by signaling softer demand and hiring.
Following a weak 10-year Treasury auction midweek, attention may also turn to the 30-year bond auction for its impact on yields. Still, Friday’s release of March CPI is expected to be the key event. Headline inflation is likely to rise due to energy costs, but the critical question is whether those pressures spill into core inflation. Any reading above the 0.3% forecast could push markets to reconsider the possibility of Fed rate hikes rather than cuts this year.
Inflation expectations will also be in focus, with the University of Michigan’s 5-year outlook offering timely insight into consumer sentiment around future prices, wages, and spending.
If inflation surprises to the upside, Treasury yields are likely to climb—potentially weighing on gold given their strong inverse relationship. Conversely, softer inflation data could support bullion. Beyond economic data, developments surrounding the US–Iran ceasefire remain an important underlying risk factor.
Price action remains orderly and well-defined.
On the daily chart, the presence of a bearish pin bar reinforces the earlier signal that sellers are active in the $4800–$4850 zone, establishing it as a key overhead resistance area for traders.
A closer look at the H4 timeframe confirms both this resistance and the overall clarity of gold’s price action, especially given the broader macro volatility. The $4700 level, which previously acted as resistance, has now flipped into support and serves as the first downside level to watch. Below that, $4600 and $4550 emerge as additional support zones if the current range breaks.
On the upside, a sustained move above $4850 would open the door toward $4975, with the 50-day moving average sitting in between as a potential intermediate hurdle. Momentum indicators such as RSI (14) and MACD remain neutral, offering no strong directional bias and reinforcing the importance of reacting to price behavior around key levels.
From a short-term trading perspective, long positions could be considered above $4700 with tight risk control below that level, targeting a move back toward $4850 resistance. However, conviction in this setup is limited, and a confirmed bounce from $4700 would provide a more reliable entry signal.
Could markets be misjudging both oil and the war, as this analyst argues?
Possibly—but what about the relationship between oil and gold? The mainstream narrative suggests that surging oil prices are a bearish signal for gold, based on claims that “gold yields no interest” and that “the Fed might raise rates by a quarter point (though it’s unlikely), while real inflation runs near 15%,” leading to the conclusion that “gold should decline sharply against fiat currencies.”
Western analysis of oil, war, and gold is deeply troubling—arguably even reprehensible. It feels like something straight out of a Nineteen Eighty-Four… except it’s happening in reality.
A closer look at currency market dynamics suggests that as interest rates rise, the heavily indebted U.S. government faces increasing borrowing needs to sustain its finances. This pressure can lead to policies that shift the burden beyond its borders, affecting global economic stability.
History offers parallels—such as Ancient Rome—where excessive debt strained state behavior and credibility. Some argue that similar pressures are emerging in modern fiscal systems.
In simple terms, critics of fiat systems view government-issued currency as vulnerable to mismanagement, while seeing gold as a more reliable store of value for individuals worldwide.
What are the most attractive price levels for investors to accumulate more gold? Looking at the daily chart, the $4,400 range previously acted as a strong buying zone, while $4,100 represented a secondary level of support.
That said, investors may benefit more from focusing on time rather than precise price points. If gold trades within a range for the rest of the year, a disciplined accumulation strategy—such as monthly purchases (or weekly for more aggressive investors)—could be more effective.
Time-based buying helps reduce the emotional stress of trying to predict short-term price movements, which often leads to cycles of fear and greed.
Ultimately, steadily increasing gold holdings may matter more than timing the exact entry. Still, from a price perspective, the $5,600, $3,900, and $3,500 levels could all serve as attractive accumulation zones if the market pulls back.
If gold were to climb into the $6,500–$7,500 range, then $5,600 could become a particularly significant support level—potentially one of the most important in the market’s history. From there, some bullish scenarios suggest the possibility of a powerful rally toward $15,000–$20,000.
Such dramatic price action would likely require major catalysts—such as sustained inflation, escalating debt pressures, geopolitical instability, or a significant loss of confidence in fiat currencies.
The U.S. interest rate chart is drawing attention, with what appears to be a large inverse head-and-shoulders pattern suggesting a potential move toward the 7%–8% range.
At the same time, many argue that the real inflation experienced by average Americans may be closer to 8%–15%, higher than official figures. If that view gains traction, the prevailing institutional narrative—where rising rates are seen as negative for gold—could shift.
Instead, rising rates might come to be interpreted as a signal that inflation is persistent and that government financing pressures are intensifying. In that scenario, investors could increasingly turn to gold, viewing it as a hedge and continuing to accumulate it over time.
A long-term view of the 40-year U.S. inflation–deflation cycle suggests that policy shifts could have major consequences. If a future Fed leader—such as Kevin Warsh—were to scale back quantitative easing, government borrowing pressures would likely remain.
Even without aggressive rate hikes from the Federal Reserve, market forces themselves could push interest rates higher.
For investors, maintaining a focus on the broader macro picture is essential. Key factors shaping the landscape include inflation trends, tariffs, geopolitical tensions, elevated equity valuations, debt ceiling challenges, and potential shifts in global economic leadership.
Critics argue that instead of implementing significant spending cuts, policymakers have relied on measures like tariffs, which may contribute to inflationary pressure. At the same time, rising fiscal deficits and geopolitical risks could undermine confidence in government bonds, prompting central banks and institutional investors to reduce their holdings.
This dynamic may create a feedback loop: higher debt levels, rising borrowing costs, and declining bond demand reinforcing one another.
In that context, some bullish perspectives suggest that gold could see substantial long-term gains, while interest rates could continue trending higher—though projections as extreme as $20,000 gold or 20% rates remain highly speculative and dependent on extraordinary economic conditions.
And what about the miners? The GDX chart looks particularly impressive, with a clear inverse head-and-shoulders pattern forming. The head developed around the critical $85 support level, where the 14,7,7 Stochastics oscillator also signaled a bottom.
After a brief two-day pullback, price is now hovering near $92—potentially setting up as a springboard for the next upward move. At the same time, a broader buy signal from the 20,40,10 MACD indicator appears to be on the verge of triggering—possibly as soon as today.
The Federal Reserve is navigating one of its toughest policy backdrops in years as the conflict with Iran unsettles global energy markets and clouds the outlook for both inflation and growth.
Heightened geopolitical volatility is forcing policymakers into a difficult balancing act: tightening too much could push the economy into recession, while easing prematurely risks fueling inflation again. For now, the most prudent approach appears to be holding rates steady until incoming data provide clearer direction on policy.
Cleveland Fed President Beth Hammack reinforced this stance in a recent AP interview, indicating a preference to keep rates unchanged “for quite some time.” However, she acknowledged flexibility, noting that rate cuts could be warranted if the labor market weakens משמעותfully, while further hikes may be needed if inflation remains persistently above target.
Meanwhile, the Treasury market has shifted its expectations. After a prolonged period of dovish positioning, investors are now assigning a higher probability to near-term rate hikes. This shift is evident in the policy-sensitive 2-year Treasury yield—around 3.84% as of April 6—trading above the median effective Fed funds rate of 3.64%, signaling a renewed tilt toward a more hawkish outlook for the first time since 2022.
The outlook for inflation and economic growth remains uncertain, with rising concern that risks may tilt toward higher prices, slower growth—or both.
IMF Managing Director Kristalina Georgieva warned that “all roads now lead to higher prices and weaker growth,” highlighting a global environment marked by heightened uncertainty. Speaking to Reuters, she pointed to multiple risk factors—including geopolitical tensions, rapid technological change, climate disruptions, and shifting demographics—and stressed the need for vigilance even after the current shock passes.
Against this backdrop, the Federal Reserve’s policy stance remains slightly restrictive. Based on a basic model incorporating unemployment and year-over-year CPI changes, current settings still lean tight, giving the central bank room to remain patient. This supports a wait-and-see approach, allowing policymakers to assess incoming data before making any decisive shifts.
Chicago Fed President Austan Goolsbee signaled that an interest rate increase may be approaching. When asked to assess economic risks on a color scale—from crisis-level red to optimistic green—he described the outlook as “at least orange,” suggesting conditions are concerning and far from ideal. Recent movements in the Treasury market appear to reflect a similar level of caution.
However, because inflation and broader economic data tend to lag, the Federal Reserve is likely to remain patient while it evaluates how the economy responds to the conflict with Iran. The difficulty lies in not delaying too long, as inflation or slowing growth could outpace policy actions, forcing the Fed into a reactive stance. This scenario echoes its delayed response during the 2021–2022 inflation surge—an error policymakers are keen to avoid repeating.
At the same time, moving too quickly carries its own risks, potentially worsening inflationary pressures or hindering growth. Ultimately, the Fed’s task is less about identifying a perfect policy and more about staying flexible in an unpredictable environment. One thing is clear: whenever the next policy move comes, it will be made amid significant uncertainty.
Sterling fell on Tuesday, trading around $1.3234 at 03:50 ET, as the U.S. dollar held firm ahead of a White House deadline linked to the U.S.–Iran conflict.
The decline extended recent losses, with GBP/USD briefly dipping to an intraday low of $1.3211, while the 52-week low remains at $1.2721.
The dollar gained support from heightened geopolitical uncertainty as investors awaited clarity on a potential ceasefire. A failure to reach an agreement could lead to U.S. and Israeli strikes on Iranian civilian infrastructure, increasing the risk of retaliatory action across the Gulf region.
Rising energy prices have also bolstered the greenback. Further gains in oil and gas amid escalating tensions would be “unambiguously dollar-positive,” according to ING strategist Chris Turner.
Stronger U.S. domestic data has added to dollar strength. The March jobs report surprised to the upside, while markets now largely expect the Federal Reserve’s policy stance to remain unchanged this year, contrasting with expectations for additional rate hikes among other major central banks.
ING noted that stronger activity data and higher energy costs could shift expectations toward Fed tightening. Investors are now focused on Wednesday’s Federal Open Market Committee minutes and Friday’s March CPI report for further guidance.
Headline U.S. inflation is forecast to rise to 3.4% year-on-year from 2.4%. Comments from New York Fed President John Williams will also be closely watched for any change in tone.
ING expects the dollar index (DXY) to stay supported within a 100–100.50 range.
Elsewhere, the euro remained under pressure, with EUR/USD at $1.1544 and trading within a 1.1420–1.1640 band. Markets have reduced expectations of an April ECB rate hike to just below 50%, though around 75 basis points of tightening is still priced in for the year.
ING warned that if the ECB holds off on an April move despite elevated energy prices, the euro could face additional downside pressure.
In Central and Eastern Europe, markets followed global trends. Czech inflation is expected to rise due to higher fuel costs, while Romania’s central bank is projected to keep rates at 6.50% despite persistent double-digit inflation. Poland’s central bank is also expected to maintain its 3.75% rate, with forward guidance later in the week in focus.
In Asia-Pacific, the Reserve Bank of New Zealand is widely expected to keep rates unchanged at 2.25% on Wednesday. The New Zealand dollar has underperformed the Australian dollar this year, and without a hawkish surprise, that divergence may continue.
Thinner liquidity later in the week due to holidays could amplify price swings driven by geopolitical developments.
Asian currencies moved without a clear trend on Monday, while the dollar remained steady as investors weighed escalating geopolitical tensions in the Middle East against signs of renewed ceasefire efforts.
The US Dollar Index inched up 0.1% following recent gains, with its futures also rising 0.1% as of 02:52 ET (06:52 GMT).
Trump issues ultimatum to Iran; Axios reports ongoing ceasefire negotiations
Trump issued a deadline for Iran to reopen the Strait of Hormuz, while reports from Axios pointed to ongoing ceasefire discussions. Traders closely watched the situation as he warned Tehran to resume tanker traffic by 8 p.m. Eastern Time on Tuesday or risk strikes on key infrastructure such as power plants and bridges.
Market sentiment improved slightly after Axios reported that the U.S., Iran, and regional mediators were negotiating a potential 45-day ceasefire, although no deal had been finalized.
In currency markets, USD/JPY remained largely unchanged, while USD/KRW slipped 0.3%. Regional currencies were also shaped by persistently high oil prices following a recent surge, which typically weigh on major importers like Japan, South Korea, and India by worsening their trade balances.
Meanwhile, USD/CNY fell 0.1%, USD/SGD was steady, and AUD/USD rose 0.3%.
Indian rupee weakens; RBI policy decision expected later this week
The Indian rupee weakened, with the USD/INR pair rising 0.6% to 93.281 on Monday, after touching a more than two-week low of 92.585 in the previous session.
The currency had strengthened over the past five sessions, supported by measures from the central bank.
Attention now turns to the Reserve Bank of India’s policy decision on Wednesday, where rates are widely expected to remain unchanged despite the rupee’s decline.
Meanwhile, investors are also reacting to stronger-than-expected U.S. payroll data released on Friday, which has reinforced expectations that the Federal Reserve could keep interest rates higher for longer.
For years, a dependable macro strategy was to buy dips when economic data weakened. Softer labor figures implied a more accommodative Fed, leading to lower discount rates and, in turn, higher equity valuations. That chain is now being tested.
The key issue this Wednesday isn’t whether the data are weak—they clearly are. The real question is whether markets can continue to interpret soft data as a trigger for policy easing when inflation signals remain stubborn.
A Familiar Macro Play—and Why It May Be Breaking Down
For much of the past three years, equity markets leaned on a simple framework: weaker growth would trigger easier monetary policy, and that easing would offset the damage from slowing activity. Soft payrolls boosted expectations of rate cuts, often lifting stocks. Weak manufacturing data pushed bond yields lower, compressing discount rates and supporting higher valuations—especially in growth equities. The pattern became almost automatic.
But that playbook only works when slowing growth comes with easing inflation. A disinflationary slowdown gives the Fed room to cut rates. When growth weakens while inflation pressures stay firm, that flexibility disappears. Easing policy into persistent price pressure risks unanchoring inflation expectations, which could later require more aggressive tightening. Today’s data point to exactly that mismatch: labor conditions are deteriorating, while inflation-sensitive indicators remain elevated. The JOLTS hires rate for February dropped to 3.1%, near pandemic-era lows, with hiring at its weakest since March 2020. Meanwhile, the Conference Board’s 12-month consumer inflation expectations rose to 5.2% in March, up from 4.5% in January. In other words, hiring is slowing sharply even as households expect higher inflation ahead.
Jerome Powell addressed this dilemma directly in remarks at Harvard on Monday. He highlighted the downside risks to the labor market, which argue for lower rates, alongside upside risks to inflation, which argue against easing. The Fed can afford to sit with that tension and wait for clearer trends—but markets typically cannot; they adjust immediately to incoming data. If Wednesday’s ISM Prices Paid index stays elevated following February’s 70.5 reading—the highest since mid-2022—it would reinforce what the mixed signals already suggest: this is not the kind of slowdown the old “buy-the-dip” reflex was designed for.
What the Hiring Data Is Already Signaling
The labor market’s weakening is showing up more clearly in the JOLTS hires rate than in headline payroll numbers. This metric tracks gross hiring as a share of total employment, and at 3.1% in February, it has dropped to levels last seen during the pandemic slowdown. While layoffs remain relatively low—and initial jobless claims around 213,000 suggest companies aren’t aggressively cutting staff—the real shift is in reduced hiring activity. The labor market is losing momentum on both sides: workers are less willing to quit, and employers are less willing to hire. Both trends point to softening demand.
The quit rate has stayed at or below 2.0% for eight straight months through February, with total quits falling to 2.97 million—the lowest since August 2020. When workers stop leaving jobs, it reflects declining confidence in finding better opportunities. This kind of stagnation tends to push unemployment higher धीरे through attrition rather than layoffs, making the deterioration less visible in monthly payroll reports. February’s payroll decline of 92,000 followed a series of inconsistent and often weak readings, including multiple recent negative months. Even January’s gain was driven by narrow sector strength rather than broad-based hiring. For March, the FactSet consensus sits at +57,000, but much of that expected increase may simply reflect the return of workers temporarily excluded in February due to a healthcare strike—hardly a sign of genuine improvement.
The ADP private payroll report, scheduled for release Wednesday morning, will offer an early look at March hiring trends. While ADP emphasizes that its data is independent and not a forecast of official figures, its February reading of +63,000 diverged significantly from the government’s count. At this point, the exact number matters less than the direction: whether hiring picked up meaningfully in March, or whether the slowdown seen in JOLTS extended into the new data.
Technical Snapshot
JOLTS – February 2026 (released Mar 31) Job openings declined to 6.9 million from 7.2 million in January. Hiring totaled 4.85 million, with the hires rate at 3.1%—near pandemic-era lows and the weakest since March 2020. Quits fell to 2.97 million, marking an eighth straight month at or below 2.0%.
Conference Board Consumer Confidence – March 2026 The headline index came in at 91.8, above the 88.0 consensus. The Present Situation component rose 4.6 points to 123.3, while Expectations slipped 1.7 points to 70.9—its 14th consecutive month below the 80 threshold often associated with recession risk. One-year inflation expectations climbed to 5.2%, up from 4.5% in January.
ISM Manufacturing PMI – February (latest actual) The headline PMI registered 52.4. The Prices Paid component surged to 70.5, the highest since June 2022. The March reading is due Wednesday, April 1 at 10:00 AM ET, marking the first release since the late-February escalation.
ADP Private Payrolls – March (Apr 1, 8:15 AM ET) Still pending. February showed a gain of 63,000, though this diverged sharply from the BLS estimate (roughly -50,000 in private payrolls). ADP emphasizes that its figures are independent and not a direct forecast of official data.
Nonfarm Payrolls – March (Apr 3, 8:30 AM ET) Consensus stands at +57,000, according to FactSet. U.S. equity markets (NYSE, Nasdaq) will be closed for Good Friday, with SIFMA recommending a full bond market closure. The next regular equity session is Monday, April 6.
10-Year U.S. Treasury Yield Currently at 4.41%, hovering near an eight-month high and up 44 basis points from 3.97% before the late-February escalation.
U.S. National Average Gasoline Price (AAA, Mar 31) $4.00 per gallon, reaching that level for the first time since August 2022.
How the Data Panels Frame the Argument
The three panels together lay out the core evidence. The first highlights a choppy payroll trend with several negative prints, and even if March meets expectations, hiring remains subdued. The second shows that the drop in the hires rate is not just monthly noise but a structural shift—hovering near pandemic-era lows while separations stay relatively stable, meaning the weakness is concentrated in reduced hiring. The third panel captures the real tension: consumer confidence from the The Conference Board came in stronger than expected at 91.8, yet the Expectations index sits at 70.9, below the recession signal threshold for 14 straight months. At the same time, 12-month inflation expectations climbed to 5.2%. Households are both pessimistic about growth and anticipating higher inflation—a mix that limits the Fed’s flexibility. Cutting rates risks reinforcing inflation expectations, while holding steady risks deepening the slowdown.
ISM Prices Paid: The Deciding Variable
While early attention will likely focus on the ADP payroll release, the more critical variable is the inflation signal from ISM. The Prices Paid index surged to 70.5 in February, its highest since mid-2022, reflecting rising input costs across commodities and tariffs. March will be the first reading to fully capture conditions after the late-February conflict, including the energy shock.
With oil prices elevated and gasoline back above $4 per gallon, this release becomes the first real test of how deeply cost pressures are feeding into the production chain. If Prices Paid remains high—or climbs further—while hiring data weakens, it creates the exact setup that challenges the old market playbook. Soft labor data alone would typically support expectations of easing, but persistent cost pressures make that response less likely without accepting inflation risk.
That divergence matters. The traditional “bad data is good news” logic only works when both growth and inflation move in the same direction. If hiring weakens while inflation signals stay firm, that relationship breaks down.
A Shift in Market Interpretation?
The issue isn’t that one week of data changes the macro outlook—it’s that the framework markets use to interpret data may no longer hold. The familiar reflex—weak data leads to rate-cut expectations, which lifts equities—was built in an environment where the Fed had room to ease because inflation was falling alongside growth. When those two forces diverge, that reflex starts to fail.
Jerome Powell emphasized this balance in recent remarks, noting that policy operates with long and variable lags and that the Fed does not respond mechanically to every short-term shock. That approach preserves institutional credibility. Markets, however, operate differently—they price probabilities in real time. The risk isn’t simply weak data; it’s weak data paired with stubborn inflation, which removes the usual policy backstop.
What Comes Next: CPI as the Decisive Test
The next major checkpoint is the March CPI release on April 10. February’s data largely preceded the late-February shock, while March will begin to reflect its impact—especially through energy prices. If CPI confirms what current indicators suggest—a cooling labor market alongside rising inflation expectations—it would strengthen the case that the old interpretation mechanism is no longer reliable.
Wednesday’s data won’t settle the question. But it will be the first structured test of whether markets can still treat weak data as bullish in an environment where inflation refuses to cooperate.
Gold is stabilizing above $4,500, though its recovery remains uncertain following a steep sell-off earlier this month. Despite a modest rebound at the start of the week, momentum is still fragile.
Gains in oil prices, higher Treasury yields, and a stronger U.S. dollar continue to limit gold’s upside potential. In the near term, resistance around $4,700 and support near $4,400 are expected to define its trading range.
Gold began the week on a positive note, rising 0.8% in early Monday trading. However, the recent surge in geopolitical tensions between Israel and Iran triggered a sharp decline, and while prices are rebounding, it may be premature to view this as a full recovery.
Oil Price
Oil prices remain the key driver of market sentiment. Crude has stayed elevated after intensified weekend fighting between Israel and Iran, with the Houthis also entering the conflict. Although Trump claimed progress in negotiations, Iran has continued to reject those assertions.
While U.S. futures and European markets showed some early stability, this could prove short-lived, as seen in prior weeks. Meanwhile, the U.S. dollar continues to strengthen and bond yields remain firm.
Brent crude holding above $110 is reducing expectations for rate cuts and even prompting some to consider possible hikes. Typically, a stronger dollar and rising yields would pressure gold, but increased safe-haven demand is helping to keep it supported for now.
Still, investor confidence has weakened after gold’s previous strong upward trend stalled in recent months. Looking ahead, everything hinges on developments in the Middle East and their impact on energy prices, inflation, and central bank policy.
If tensions ease and oil prices decline in the coming weeks, the U.S. dollar could soften, which would support gold and other risk assets. However, the situation remains highly uncertain. Iran appears reluctant to negotiate, potentially leveraging elevated energy prices. Until there is clear progress toward de-escalation, any short-term market moves should be viewed cautiously.
XAU/USD technical analysis
Gold finished last week largely unchanged, rebounding from Monday’s decline after experiencing notable losses in the prior weeks. Importantly, it managed to stay above the $4,400 level — its February low — which provides a modestly positive signal.
That said, stronger confirmation is still needed before traders can conclude that gold has formed a bottom. Multiple resistance levels overhead may limit further gains, particularly as the metal has been in a downtrend since its peak in January.
Key Levels to Watch
A crucial area on the upside is the former short-term bullish trendline, now acting as resistance, along with the $4,700 level. This zone is strengthened by the 21-day exponential moving average near $4,750, making the $4,700–$4,750 range a significant barrier if prices continue to rise.
Beyond that, the next resistance lies between $4,800 and $4,840 — a region that has previously served as both support and resistance. A strong breakout above this band could open the path toward the key psychological level of $5,000.
On the downside, the $4,400–$4,500 zone is a critical support area. A daily close below this range would weaken the short-term outlook and could lead to a decline toward last week’s lows near $4,100, where the 200-day moving average provides additional support.
Further down, longer-term support is seen around $4,000, where a major upward trendline aligns with this important psychological level.
Overall, gold remains in a fragile position and has yet to fully stabilize.
The main disruption in financial markets right now is the sharp rise in both food and energy prices, reflected in the Producer Price Index (PPI) and the highest import costs in four years. March inflation data for these sectors is expected to be particularly severe, with many economists now forecasting annual inflation above 4%. This has already pushed Treasury yields higher, especially following weak demand at a recent auction. As a result, expectations for further Federal Reserve rate cuts have diminished.
However, a weak March jobs report or potential stress in private credit markets could prompt the Fed to lower rates sooner than expected, despite persistent inflation pressures. Federal Reserve Chair Jerome Powell is set to speak at Harvard this week, and investors will be watching closely for signals on whether slowing job creation could justify policy easing.
Ongoing geopolitical uncertainty is also keeping many investors cautious and on the sidelines. Historically, markets tend to rebound once war-related concerns ease.
Despite broader volatility, fundamentally strong companies continue to hold up well. For example, Argan (AGX) surged after reporting better-than-expected quarterly results, with strong gains in both revenue and earnings. As a data center-related company, its performance has also supported other stocks in the same sector.
Looking ahead, the U.S. is expected to maintain significant influence over global energy markets, including regions in the Caribbean, North America, and the Middle East. Lower domestic energy prices remain a priority, especially after substantial profits among energy producers. With a potential oversupply of crude oil in the coming months, energy stocks may face pressure, except possibly for tanker companies unless earnings forecasts improve significantly.
Overall, the U.S. is likely to remain the primary driver of global economic growth, continuing to attract international investment due to its stronger GDP outlook and a firming dollar.
The Nasdaq 100 attempted to rally early in the week but ultimately tumbled as market fear intensified. With U.S. interest rates continuing to rise, the index has now broken below the key 23,800 level.
We are also trading below the 50-week EMA, and quite frankly, this is a market being driven almost entirely by the latest headlines out of Washington or Tehran, as they are causing sharp swings in interest rate expectations. As rates climb, they put significant pressure on technology stocks—and that dynamic is clearly playing out now.
USD/MXN
The U.S. dollar initially declined against the Mexican peso but has now formed a hammer pattern for the third consecutive week. This suggests the peso may start to weaken, and with U.S. interest rates rising, the negative swap cost associated with buying this pair becomes less of a burden.
On the upside, the 50-week EMA is near the 18.29 level, with the 18.50 area as the next likely target. If the pair pulls back from here, pay close attention to next week’s candlestick formation, as it would take significant downside pressure on the U.S. dollar to shift the trend. While the interest rate differential makes me hesitant to buy the dollar against the peso, the market still appears to be attempting a rally.
GBP/JPY
The British pound edged higher against the Japanese yen this week, and the key level to watch now is 214 yen, which has acted as a significant barrier. A break above this level would likely open the door for further upside.
Short-term pullbacks should continue to present buying opportunities, but there is always the risk of intervention from the Bank of Japan. That said, it’s likely a challenging task for the central bank to prevent the yen from weakening significantly. The ongoing interest rate differential will keep driving yen-denominated pairs higher, with the British pound standing out as a key beneficiary.
EUR/USD
The euro has been quite volatile this week, ultimately forming something resembling a shooting star. We remain within the same range that’s held for some time, suggesting little has fundamentally changed. However, a breakdown below the 1.14 level could trigger a sharp strengthening in the U.S. dollar.
In that scenario, you’d likely look to buy the U.S. dollar against most currencies—not just the euro—since this pair often acts as a broader signal for how the greenback performs globally. On the other hand, if we break to the upside and clear this past week’s highs, that would be broadly dollar-negative and could pave the way for a move toward the 1.18 level.
Gold (Xau/Usd)
Gold prices dropped sharply over the week but staged a solid recovery. A large weekly hammer is beginning to form, though a break above $4,600 is needed to confirm strong momentum. While there are many factors supporting further gains, rising U.S. interest rates remain a key headwind.
Rising interest rates remain a significant headwind, weighing on gold despite ongoing geopolitical tensions that could otherwise push prices higher. A drop below the $4,000 level would be severely bearish, but for now, the market appears to be attempting a rebound.
BTC/USD
Bitcoin has been a bit weak over the week, but it’s still holding within the same range. Given the ongoing conflict between the U.S. and Iran, that actually counts as relatively strong performance. The price is currently hovering around the 200-week EMA, a key long-term support level.
The $72,000 level continues to act as resistance, while $60,000 below remains a solid support zone. Overall, the market is quite choppy, but it appears to be in the process of building a base for a potential longer-term move.
Natural Gas
Natural gas declined over the week but has shown a modest rebound. However, it’s likely a market retail traders should avoid for now, as demand is dropping sharply.
While Europe may continue to face supply challenges, this is seasonally a weak period for natural gas demand. Many retail traders also overlook that they are trading a U.S.-centric contract. With spring approaching, the typical strategy is to sell into rallies once signs of exhaustion appear.
USD/CHF
The U.S. dollar has gained solid ground against the Swiss franc and is now approaching the key 0.80 level. A breakout above that point could trigger a stronger upward move, but for now, such a scenario seems unlikely.
In this environment, the outlook remains bullish, with interest rate differentials continuing to support further upside. The Swiss central bank also provides a form of downside protection, having signaled it may intervene if the franc strengthens excessively. This creates a favorable “buy on dips” setup, with the added benefit of earning daily swap.
The US dollar weakened over the week, with the US Dollar Index (DXY) falling back below the 100 mark to around 99.60 by Friday, after a midweek boost following the Federal Reserve’s decision to keep interest rates unchanged at 3.50%–3.75%. Meanwhile, the conflict in Iran has entered its third week, and the Strait of Hormuz remains effectively shut, keeping oil prices elevated. Reports of the Pentagon sending thousands more Marines to the region point to a prolonged standoff. At the same time, Fed Chair Jerome Powell warned that inflationary pressures may still build further.
EUR/USD is hovering around the 1.1550 level after hitting new lows for 2026 earlier in the week, despite the European Central Bank’s hawkish stance, with markets now assigning an 85% chance of a rate hike this year.
GBP/USD is trading near 1.3330 after the Bank of England kept rates unchanged on Thursday but hinted that further tightening could be necessary if energy-led inflation continues.
USD/JPY is holding close to 159.30, with the yen gaining support as the Bank of Japan signaled a return to policy normalization.
AUD/USD is sitting around 0.7010 following a second straight rate hike from the Reserve Bank of Australia, though broader risk-off sentiment is still weighing on the currency.
West Texas Intermediate (WTI) crude is near $98 per barrel, close to weekly highs, after Israeli Prime Minister Benjamin Netanyahu indicated efforts to reopen the Strait of Hormuz.
Gold dropped sharply to $4,583 amid a heavy selloff driven by rising Treasury yields and forced liquidations of leveraged positions, overwhelming any safe-haven demand linked to the conflict.
Upcoming economic outlook: Key voices to watch
Monday, March 23:
ECB’s Escrivá
ECB’s Cipollone
ECB’s Lane.
Tuesday, March 24:
RBNZ’s Breman
ECB’s Kocher
ECB’s Sleijpen
ECB’s Cipollone
ECB’s Nagel
ECB’s Lane
Fed’s Barr
Wednesday, March 25:
ECB’s President Lagarde
ECB’s Lane
BoE’s Greene
Fed’s Miran
Thursday, March 26:
ECB’s De Guindos
BoE’s Breeden
BoE’s Greene
BoE’s Taylor
Fed’s Cook
Fed’s Miran
Fed’s Jefferson
Fed’s Logan
Fed’s Barr
Friday, March 27:
Fed’s Daly
Fed’s Paulson
ECB’s Schnabel
Saturday, March 28:
ECB’s Cipollone
These scheduled speeches and appearances from central bank officials across the European Central Bank, Federal Reserve, Bank of England, and Reserve Bank of New Zealand will be closely watched for signals on inflation, interest rates, and policy direction amid ongoing global uncertainty.
Key economic data and central bank signals shaping policy outlook
Monday, March 23:
Eurozone March Consumer Confidence (Preliminary)
Australia March S&P Global PMIs (Preliminary)
Japan February Consumer Price Index
Tuesday, March 24:
Eurozone March HCOB PMIs (Preliminary)
UK March S&P Global PMIs (Preliminary)
US ADP Employment Change
US Q4 Nonfarm Productivity & Unit Labor Costs
US March S&P Global PMIs (Preliminary)
Bank of Japan Monetary Policy Meeting Minutes
Wednesday, March 25:
Australia February Consumer Price Index
United Kingdom Inflation Data (CPI, PPI, RPI)
Switzerland March ZEW Expectations Survey
Germany March IFO Business Climate
Swiss National Bank Quarterly Bulletin (Q1)
Thursday, March 26:
Germany April GfK Consumer Confidence
Eurozone Q4 Gross Domestic Product
Deutsche Bundesbank Monthly Report
US Initial Jobless Claims
New Zealand March ANZ–Roy Morgan Consumer Confidence
Friday, March 27:
UK March Consumer Confidence
UK February Retail Sales
Eurozone March Harmonized Index of Consumer Prices (Preliminary)
US March Michigan Consumer Sentiment & Inflation Expectations
This packed calendar of releases across major economies—alongside guidance from institutions like the European Central Bank, Federal Reserve, and Bank of England—will play a crucial role in shaping expectations for interest rates, inflation trends, and overall monetary policy direction in the near term.
The U.S. labor market is weakening, reducing the flow of passive dollars into the stock market. Both labor supply and demand are declining simultaneously.
Supply-Side Pressures:
Immigration into the U.S. has fallen from roughly 2 million annually since 2020 to near zero today.
Demographics are slowing population growth: from 1.8% post-WWII to 0.5% currently.
Aging population: Over 4.1 million Baby Boomers are turning 65 each year from 2024–2027 (~11,200 daily).
Labor Force Participation Rate (LFPR) peaked at 66% with baby boomers, remained stable from 1990–2008, and has now fallen to 62%.
Demand-Side Pressures:
AI adoption is suppressing hiring, with estimates of 200–300k job losses in 2025 alone.
U.S. bonds’ 40-year bull market has ended; persistent inflation (>2% for 5 years) and $2T annual deficits are fueling a $39T national debt. Higher yields on debt suppress business formation and expansion.
The result: employment growth has stalled. January 2025 had 170.7M workers; today it’s 170.4M. Fewer employed individuals mean less money flowing into 401(k)s and the stock market, reversing trends seen over past decades.
Recent Economic Highlights:
U.S. spent $11.3B in the first week of the Iran war.
Home foreclosures rose for the 12th consecutive month in February (+20% YoY).
Private credit default rate climbed to 9.2%, exceeding 2008 crisis levels. Q4 GDP revised down to 0.7% from 1.4% estimate (Q3 was 4.4%).
Fed added $18B in base money supply last week.
January core PCE inflation: 3.1% (well above 2% target); headline: 2.8%. Post-Iran war, energy price spikes will likely push headline higher.
February PPI: 3.4% YoY; core PPI: 3.9% YoY (rising from January’s 2.9%/3.4%).
The Fed did not cut rates in March, and future rate reductions are unlikely as inflation remains elevated. War-related energy price spikes further complicate monetary stimulus.
Market Valuations:
The stock market is historically expensive, with Total Market Cap/GDP at 220% (vs. 50% in 1975–1990).
Geopolitical Outlook:
Low probability scenario: Iran surrenders enriched uranium and reopens the Strait of Hormuz in exchange for bombing cessation—unlikely due to U.S. and Israel demanding regime change.
More probable: war scales down over weeks, partial shipping resumes, oil prices moderate to ~$80/barrel. This scenario limits aggressive market shorts but allows portfolio hedges against stagflation.
Investment Strategy:
Favor precious metals, energy, and defensive stocks.
Short rate-sensitive stocks and bonds.
Stagflation makes buy-and-hold 60/40 portfolios risky; active management through inflation/deflation cycles is a better approach.
Dollar posts a weekly drop as policymakers adopt a cautious stance due to the ongoing Iran war.
The U.S. dollar held steady on Friday but remained below multi-month highs and was set for a weekly decline, as investors weighed the future of U.S. interest rates amid the ongoing war in Iran. The US Dollar Index, tracking the greenback against six major currencies, rose 0.3% to 99.50 but fell 0.9% for the week.
EUR/USD slipped 0.2% to 1.1570 and GBP/USD dropped 0.7% to 1.3338, both aiming for weekly gains, while USD/JPY gained 0.9% to 159.21. Rising oil prices, driven by attacks on Middle East energy infrastructure and disruption of key shipping routes, have fueled expectations that global central banks may tighten monetary policy to counter renewed inflation risks, boosting demand for the dollar since the conflict began in late February.
The Federal Reserve left interest rates unchanged this week, citing uncertainty around U.S.-Israeli actions in Iran, though it maintained projections for potential rate cuts later this year. This positions the Fed as the only major central bank not expected to hike rates in 2026, in contrast to the European Central Bank’s more hawkish stance. JPMorgan analysts noted the stark difference, highlighting that early hikes could risk repeating past policy errors, though market expectations still tilt toward some rate increases this year.
Brent crude prices fell from a recent $119 per barrel spike after President Donald Trump sought to calm markets, pledging to resolve the crisis without deploying ground troops—though Pentagon planning and additional troop deployments suggest contingency preparations. The White House is also exploring measures to ease energy market pressures, including potentially lifting sanctions on Iranian oil, while requesting $200 billion in funding for the conflict.
The pound falls as rising oil prices counteract a hawkish signal from the Bank of England.
Sterling fell on Friday as higher oil prices pressured sentiment, but the pound remained on track for a weekly gain following a hawkish surprise from the Bank of England that revised UK rate expectations. At 12:52 GMT, GBP/USD was down 0.3% at $1.34, partially reversing Thursday’s 1.31% jump, with the currency up 1.2% for the week.
EUR/GBP was largely unchanged, as hawkish signals from both the ECB and BoE offset each other. EUR/USD slipped 0.2% to 1.15, pulling back from Thursday’s 1.2% rally, as the dollar found tentative support despite the ECB’s April rate hike guidance.
On Thursday, the BoE voted unanimously 9-0 to keep rates on hold, surprising markets that had expected some members to favour a cut. Dovish MPC member Swati Dhingra even discussed possible hikes to manage inflation. Traders quickly repriced expectations, now anticipating around 80 basis points of tightening by year-end, though ING cautioned this may be excessive given weaker conditions for second-round inflation than in 2022.
Oil continued to drive markets, with Brent volatile amid the Iran conflict and Strait of Hormuz concerns. ING strategist Francesco Pesole noted that while the hawkish BoE stance provided some support for sterling, commodity prices and geopolitical developments remained the dominant market influences. ING retains a bullish view on EUR/GBP, targeting 0.88 by end-Q2, factoring in May local elections and potential future BoE cuts.
The U.S. dollar has remained a favored safe-haven asset since late February, when the U.S. and Israel launched attacks on Iran. Investors have priced in the expectation of prolonged higher interest rates due to inflationary pressures from surging oil prices, which typically strengthen the dollar.
Market sentiment was largely negative on Thursday after oil and gas prices jumped again following attacks on energy facilities in the Middle East. Iran’s South Pars gas field—the world’s largest natural gas deposit—was targeted, prompting Tehran to retaliate against sites in Gulf countries, including Qatar and Saudi Arabia.
Israeli Prime Minister Benjamin Netanyahu told reporters that Israel acted alone in the South Pars strike and that U.S. President Donald Trump had requested no similar actions in the future. Netanyahu added that Iran no longer possesses the capacity to enrich uranium or produce ballistic missiles, which caused oil prices to retreat.
“We are winning, and Iran is being decimated,” Netanyahu stated.
Federal Reserve holds rates steady
On Wednesday, the Federal Reserve kept its key policy rate unchanged, as expected. The Fed’s updated projections raised the 2026 inflation forecast, partly due to rising oil prices. Fed Chair Jerome Powell emphasized uncertainty over the war’s impact on inflation and the U.S. economy, noting repeatedly, “I’m not certain. I’m uncertain.”
JPMorgan economist Michael Feroli observed that Powell seems to be giving little weight to current forecasts and mentioned that this would have been a round where the Summary of Economic Projections could have been skipped, similar to March 2020. Regarding future rate hikes, Powell reiterated that no option is off the table, though it is not expected to be the baseline for most of the monetary policy committee.
Euro, pound, and yen rise after central bank decisions
On Thursday, both the European Central Bank (ECB) and the Bank of England (BoE) held policy rates steady, mirroring the Fed. The ECB described the Middle East conflict’s impact on inflation and growth as “uncertain,” while the BoE warned that higher oil prices would push up household fuel and utility costs and indirectly affect business expenses.
EUR/USD rose 1.2% to 1.1586, and GBP/USD climbed 1.3% to 1.3429. Deutsche Bank’s Sanjay Raja noted that the BoE’s Monetary Policy Committee voted unanimously 9-0 to pause, reflecting the scale of the energy shock and potential inflationary pressures.
The Bank of Japan also kept rates unchanged, as expected. USD/JPY fell 1.3% to 157.67. Only one board member, Hajime Takata, opposed the decision, advocating a 25-basis-point hike. Japan relies heavily on Middle Eastern energy imports, and although slowing rice price increases have helped the BoJ manage inflation, the war-driven oil surge could intensify price pressures, according to José Torres of Interactive Brokers.
The U.S. dollar paused on Wednesday as softer crude oil prices helped revive some risk appetite ahead of a series of major central bank decisions.
The yen remained fragile near levels that have previously raised concerns about possible intervention by Tokyo, especially with Japanese Prime Minister Sanae Takaichi set to meet U.S. President Donald Trump in Washington. Meanwhile, the euro slipped slightly after two sessions of gains, as the European Central Bank prepared to kick off its two-day policy meeting.
Amid the ongoing Middle East crisis, now in its third week, the dollar has strengthened as the primary safe-haven currency. However, oil prices edged lower after data from the American Petroleum Institute indicated a rise in U.S. crude inventories.
According to Hirofumi Suzuki, chief FX strategist at Sumitomo Mitsui Banking Corporation, while the pause in oil’s rally hasn’t dramatically improved conditions, markets are showing signs of stabilization. He noted that USD/JPY has moved modestly in favor of yen strength.
The dollar index rose slightly by 0.06% to 99.61 following a two-day decline, while the euro dipped 0.05% to $1.1532. The yen weakened marginally to 159 per dollar, and sterling remained steady at $1.3355.
The greenback had surged to a 10-month high late last week, driven by geopolitical tensions and rising oil prices that pushed investors toward safer U.S. assets.
Highlighting the broader impact of the crisis, Trump announced he would delay a planned trip to Beijing to meet Chinese President Xi Jinping. Takaichi is expected to leave for Washington later Wednesday.
Analysts at Mizuho Securities noted that even if the conflict drags on, equities could rebound, supporting commodity-linked currencies like the Australian dollar, as well as currencies of oil-importing nations such as the yen and euro. However, they expect limited downside for USD/JPY, partly due to the Japanese government’s preference for a weaker yen.
Attention now turns to central banks, with the Federal Reserve set to announce its decision Wednesday, followed by the ECB, Bank of England, and Bank of Japan a day later. All are widely expected to hold rates steady, though markets will closely watch their outlooks on inflation and growth amid geopolitical uncertainty.
Expectations for Fed rate cuts have been trimmed to around 25 basis points this year. Meanwhile, traders are now pricing in more than one ECB rate hike in 2026—a notable shift from earlier expectations of potential cuts.
Elsewhere, the Australian dollar gained 0.1% to $0.7109, and the New Zealand dollar rose 0.05% to $0.586. In crypto markets, bitcoin slipped 0.40% to $74,257.80, while Ethereum edged up 0.22% to $2,333.60.
This week will see a series of major central bank meetings worldwide, including those of the Federal Reserve, European Central Bank, Bank of Japan, and Bank of England. With oil prices climbing sharply and inflation expectations edging higher, investors will be closely watching how policymakers assess the outlook for monetary policy and the implications of elevated energy costs.
Among these institutions, the Bank of Japan faces perhaps the most delicate situation, particularly after the country’s February general election and the policy trajectory it had already been pursuing since its previous meeting. With oil trading near $100 a barrel, the BOJ must proceed cautiously as the USD/JPY exchange rate moves toward 160 — a level widely viewed as a potential tipping point for the currency.
The pair has already broken above resistance near 159, though it still remains below the highs reached in July 2024.
From a technical perspective, once USD/JPY moves above its July 2024 peak, there would be no clear resistance levels ahead, potentially opening the door for further and possibly sharp depreciation of the Japanese yen.
Meanwhile, the recent surge in oil prices has reshaped expectations for U.S. interest-rate cuts. Markets have gradually scaled back their projections for easing, even though the incoming Federal Reserve chair nominee has indicated a preference for looser monetary policy.
December Fed funds futures have climbed to around 3.44%, reflecting reduced expectations for rate cuts. Since 2022, market pricing for Fed easing has broadly moved in tandem with oil prices.
If oil continues to rise, it could complicate the Fed’s ability to lower rates, as higher energy costs tend to fuel inflation. Rate cuts may only become more likely if oil prices rise to a point where they begin pushing the economy toward recession.
Rising rates are not limited to the U.S., as Australia’s 2-year bond yield has now moved above its October 2023 peak.
Rising global oil prices are likely to tighten liquidity and financial conditions worldwide. Tighter financial conditions typically place pressure on economic activity and risk markets. As long as oil prices remain elevated — or continue to climb — they are likely to further tighten global financial conditions and weigh on risk assets.
For investors trying to gauge the outlook for risk assets, the direction of oil prices has become increasingly important. However, predicting oil’s near-term path remains challenging. Weekend oil CFDs were trading about 3% higher and above $100 per barrel.
From a technical perspective, the trend remains upward for now, as long as oil continues to hold above its 10-day exponential moving average.
The situation is similar for the S&P 500—as long as the index stays below its 10-day exponential moving average, the short-term trend is likely to remain downward.
The distribution pattern in the S&P 500 appears relatively clear, with a key pivot level near 6,525, which coincides with the index’s November lows.
More significantly, measuring the decline from the recent high to this pivot level and projecting that move 100% lower points to a potential downside target near 6,050. Such a move would also fill the price gap from June 24 and allow the index to retest the breakout level from the pre-tariff highs, an area that could act as technical support.
Such a scenario would likely require oil prices to stay elevated while interest rates and the U.S. dollar continue to strengthen. The U.S. Dollar Index could also extend its gains; a decisive break above 100.50 may open the door for a move toward 102.
With momentum indicators turning positive, it appears likely that CTAs and leveraged funds may start adding long dollar positions while reducing their existing shorts.
Meanwhile, the U.S. 2‑Year Treasury Yield may have room to extend higher, with the next resistance level seen near 3.80%, followed by a potential move toward 3.97%.
Technically, the outlook has strengthened as the yield has moved above its 200-day moving average, while the 50-day moving average is beginning to trend upward. In addition, the yield recently broke above a multi-year downtrend line that had been in place since April 2024, reinforcing the case for further upside momentum.
We’ll have to watch how the week develops. With options expiration (OPEX) taking place, market volatility could remain elevated. This is particularly true for the S&P 500, where put options currently dominate positioning, increasing the potential for sharp and erratic intraday price swings.
The sharp rise in oil prices following escalating tensions between the United States and Iran has reignited talk of stagflation. That concern is largely misplaced. What markets may actually be reacting to is not a repeat of the 1970s, but the early stages of a broader shift in capital allocation — away from financial assets and toward tangible ones.
The Stagflation Comparison Falls Apart
Whenever oil prices surge, fears of stagflation quickly emerge. The pattern appeared in 2022 and is resurfacing again. The instinct makes sense: higher energy costs can push inflation upward while weighing on economic growth. However, drawing a direct parallel with the stagflation period of the 1970s and early 1980s oversimplifies the situation.
Classic stagflation requires a persistent combination of three conditions: entrenched inflation far above target levels, stagnating or shrinking economic activity, and limited policy tools capable of correcting the imbalance without worsening the problem. In the United States during 1973 and again in 1979, all of these factors were present. Today’s environment looks very different.
Inflation is the first major distinction. During the 1970s, U.S. consumer prices averaged above 7% for much of the decade and surged beyond 13% at the end of the period. Inflation was embedded in wages, expectations, and policy frameworks. By contrast, today’s inflation has already declined significantly from its 2022 highs. While still above the ultra-low levels seen after 2008, it remains far more controlled. Importantly, central banks now possess the credibility that was missing during the Federal Reserve leadership of Arthur Burns. Inflation expectations remain relatively stable — a crucial difference.
Economic growth tells a similar story. Real GDP continues to expand at a respectable pace, and while the labor market is gradually cooling, it is far from collapsing. Corporate profits have generally remained resilient, apart from sectors particularly sensitive to higher interest rates. Consumer spending — supported by continued employment — has not stalled. In this context, an oil price spike represents a headwind rather than an automatic trigger for recession.
Supply conditions also differ dramatically from those of the 1970s. The earlier oil crises were driven by coordinated OPEC embargoes that deliberately restricted supply to Western economies. At the time, alternatives were limited and domestic production could not compensate. Today, the United States is the world’s largest oil producer thanks to the shale revolution. A disruption involving Iran can lift prices, but it does not recreate the systemic vulnerability that defined the 1973 crisis.
The reality is straightforward: energy prices may push inflation slightly higher and shave some growth at the margins. But an isolated oil shock does not produce stagflation unless the broader economic structure is already broken — and that is not the case today.
What the Oil Spike Actually Signals
Rather than focusing on stagflation, investors should consider what oil’s move may be revealing about broader market dynamics.
Historical patterns following geopolitical shocks offer a useful guide. In the first three months after such events, oil tends to be the strongest performer among major assets, rising roughly 18% on average. Gold typically advances about 6%, while equities post modest gains of around 4%, often reflecting relief that the situation did not escalate further.
Six months later, however, the picture often changes. Gold generally continues to climb, with average gains near 19%. Equity markets lose momentum, and oil frequently gives back much of its initial spike as supply responses and fading fear premiums bring prices back down.
The tactical takeaway is clear: oil tends to perform best during the initial shock phase, while gold benefits from the longer period of uncertainty that follows. The geopolitical risk premium embedded in oil prices is often temporary, but in gold it can evolve into a more lasting repricing tied to concerns about currencies, fiscal sustainability, and the reliability of financial assets.
The Bigger Shift: Real Assets Regaining Importance
Looking at the broader market landscape, the oil rally may represent just one element of a larger transition.
During 2024 and 2025, equity markets were dominated by a single theme: artificial intelligence. Capital poured into a small group of large technology companies investing heavily in AI infrastructure. The narrative was simple — if AI would reshape the economy, investors should own the companies leading that transformation.
By 2026, leadership appears to be shifting. The strongest performers are increasingly the firms supplying the physical foundations of the AI economy: semiconductor manufacturers, materials producers, energy providers, and industrial supply chains. Meanwhile, some of the technology platforms themselves face rising costs and pressure on their traditional software revenue models.
This development suggests something deeper than a normal sector rotation.
For decades, capital markets favored companies that consumed resources while undervaluing those that produced them. Asset-light businesses commanded premium valuations, while industries tied to the physical economy — mining, energy, utilities, and heavy industry — were often neglected and underfunded.
Yet the real economy never disappeared. In fact, its importance is now becoming more apparent.
The expansion of artificial intelligence requires enormous amounts of electricity to power data centers. Electrification of transportation and manufacturing depends on vast quantities of copper and other metals. Efforts to rebuild domestic manufacturing and strengthen supply chains demand steel, critical minerals, and engineering capacity that has been underdeveloped for years. Energy security has also become a top political priority, encouraging renewed investment in domestic production infrastructure.
All of these forces point toward the same conclusion: the materials and energy systems that underpin the global economy are increasingly scarce relative to rising demand.
When markets begin to recognize a prolonged supply gap in strategically important commodities, the resulting repricing can be powerful and long-lasting. Recent strength in assets such as copper, gold, uranium, and energy infrastructure may be early evidence of that process.
Investment Implications
Viewing the current environment through the lens of stagflation frames it as a temporary economic problem. That interpretation misses the larger opportunity.
The macroeconomic risks are likely overstated: inflation is not deeply entrenched, the economy continues to expand, and the conditions that produced 1970s-style stagflation are absent. Investors who position primarily for economic collapse may find themselves overly defensive.
At the same time, the stagflation narrative understates the structural shift taking place. If markets are beginning to rotate from financial assets toward real ones — from digital platforms to the physical infrastructure supporting them — then the investment strategy should focus less on protection and more on positioning.
In simple terms, the beneficiaries are likely to be the builders rather than the spenders: companies involved in energy production, materials, infrastructure, and industrial supply chains, along with scarce hard assets.
History shows that when these types of market rotations begin, they often last longer and move further than most investors expect. Commodity sectors have experienced more than a decade of underinvestment, while the forces driving demand — artificial intelligence power needs, electrification, and reindustrialization — are structural trends rather than short-term cycles.
This moment may not replicate the 1970s. But it could mark the beginning of a similarly significant shift: a period in which the physical economy returns to the center of global capital markets, rewarding investors who recognize the change early.
Middle East tensions likely to delay Fed rate cuts
The conflict in the Middle East is expected to increase price pressures, while at the same time posing risks to U.S. economic growth and employment prospects. As a result, the situation is more likely to delay potential Federal Reserve rate cuts rather than eliminate them entirely. This differs from the situation in 2022, when a combination of demand and supply shocks sharply accelerated inflation and forced the central bank to raise interest rates.
Rising inflation limits the Fed’s flexibility
Recent developments in the Middle East have significantly altered expectations for monetary policy at the Federal Reserve. Financial markets had previously anticipated two 25-basis-point rate cuts this year, but pricing has now shifted to reflect barely one cut.
Investors are also overwhelmingly expecting the Federal Open Market Committee to leave interest rates unchanged at its meeting on March 18, a view we also support.
Military activity in Iran and heightened risks to shipping through the Strait of Hormuz have driven a sharp rise in energy prices. Although the United States imports relatively little crude oil from the Persian Gulf and remains self-sufficient in natural gas, global oil pricing means domestic consumers still feel the impact.
Retail gasoline prices in the U.S. have already climbed above $3.60 per gallon, with the national average potentially approaching $4.25 per gallon in the near term. Higher fuel costs are expected to raise transportation and distribution expenses, while airline ticket prices could also increase.
If the disruption persists, price pressures may extend into other sectors such as fertilizers, food products, and plastics. As a result, inflation could rise toward 3.5% by the summer, remaining well above the Fed’s 2% target.
Growth and employment outlook uncertain
The implications for economic growth and employment remain less certain. February’s ISM business surveys suggested activity levels consistent with roughly 3% GDP growth. However, the labor market data paints a less optimistic picture.
The February employment report showed the economy lost 92,000 jobs, while the unemployment rate rose to 4.4%. This suggests the Fed may have been premature in removing its earlier assessment that “downside risks to employment rose in recent months” from the January FOMC statement.
Increasing geopolitical and economic uncertainty is unlikely to support stronger job creation and may dampen economic activity outside the U.S. energy sector.
Fed expected to signal a delay in rate cuts
Against this backdrop, attention will turn to the updated economic projections from the Federal Reserve. In its December outlook, the Fed had anticipated one interest-rate cut in 2026, followed by an additional 25-basis-point reduction in 2027.
However, the ongoing conflict and the uncertainty surrounding its duration and severity make the outlook highly unpredictable. As a result, policymakers are likely to have limited confidence in their forecasts.
At the press conference, Fed Chair Jerome Powell is expected to emphasize the difficulty of setting monetary policy amid such geopolitical and economic uncertainty.
Even so, the Fed may modestly downgrade its growth projections, raise its inflation forecasts, and ultimately push back the previously expected 2026 rate cut to 2027.
Risks still tilted toward lower interest rates
We have been projecting two interest-rate cuts in September and December, although—like financial markets—we acknowledge the possibility that these reductions could be pushed into next year. While the Federal Reserve operates under a dual mandate of maintaining price stability and promoting maximum employment, safeguarding its credibility on inflation remains crucial. Cutting rates becomes difficult to justify when inflation is already above target and appears to be moving further away from it.
In early 2022, the Fed initially argued that inflation would prove temporary because it was largely driven by supply disruptions, suggesting there was no immediate need to raise rates. However, strong job creation, rapid wage growth, pent-up consumer demand following pandemic lockdowns, and stimulus payments fueled a surge in spending. Inflation subsequently accelerated far more than expected.
As a result, the central bank was forced to respond aggressively, lifting interest rates by 525 basis points between March 2022 and July 2023 in an effort to regain control over rising prices.
Currently, the U.S. labour market appears significantly weaker, with both job creation and real household disposable income showing little growth over the past six months. At the same time, consumer confidence has been weighed down by concerns over tariffs and job security, reducing the likelihood of a strong demand surge that could push inflation higher. This environment suggests that inflationary pressures may indeed prove temporary this time.
Instead, the current energy shock may ultimately dampen demand, which would help ease core inflation over time. A correction in equity markets could amplify this demand destruction further. For this reason, we continue to expect a downward bias in Federal Reserve policy rates over the next 12–18 months.
Although tax refunds this year are expected to be relatively large—averaging around $4,000 compared with $3,200 last year—a much stronger fiscal stimulus would likely be required to generate enough demand to entrench inflation. Measures such as widespread stimulus checks would probably be necessary to produce sustained price pressures that might force the Fed to raise interest rates again.
However, such a scenario could unsettle bond markets due to concerns about rising government debt and renewed inflation risks. This, in turn, could trigger fears of 1970s-style inflation dynamics, a period marked by persistent inflation and financial market volatility. For now, we view that outcome as relatively unlikely.
Should the Fed Address the Persistent Stickiness in the Effective Funds Rate?
Since the Federal Reserve resumed purchasing Treasury bills in mid-December 2025, it has accumulated about US$165 billion in T-bill holdings. Overall, the Fed’s total securities portfolio—including bills—has increased by US$130 billion, bringing the balance sheet to roughly US$6.26 trillion. At the same time, bank reserves have risen by around US$180 billion to slightly above US$3 trillion, partly supported by a moderate drawdown in the Treasury’s cash balance.
Despite this US$130 billion expansion of the balance sheet, the Fed may find it frustrating that the effective federal funds rate has not declined, even marginally. Historically, the effective rate traded roughly 8 basis points above the policy floor, but it climbed to about 14 basis points in September and October 2025—one of the factors that prompted the renewed T-bill purchase program.
The underlying issue emerged when bank reserves slipped below US$3 trillion, causing conditions in the repo market to tighten noticeably. That tightening, from a relative-value perspective, helped push the effective funds rate higher. While the broader policy narrative has been dominated by rate cuts, the real concern is the effective funds rate drifting upward within the 25-basis-point target range.
For now, the effective funds rate remains stuck at 3.64%, just 1 basis point below the interest rate on reserve balances (3.65%). Moving up to 3.65% would be difficult because eligible counterparties can choose between holding reserves or lending in the federal funds market, though the rate should not exceed that level. Whether the Fed will address this issue publicly remains uncertain, although it arguably warrants attention from reporters, given that efficient market functioning is particularly important in the current environment.
Looking more broadly at interest rates—especially the outlook for bonds—the Fed is facing signals of higher nominal yields, rising real yields, and widening inflation breakevens. This mix does little to support further rate cuts. In fact, each element points toward the logic of maintaining current policy settings. For the time being, the market is likely to see more of the same, with 10-year Treasury yields potentially moving into the 4.3%–4.5% range before real yields eventually begin to decline again.
Fed Caution Should Continue to Support the Dollar
Like the rest of the world, the United States has seen a hawkish re-pricing of short-term interest rate expectations as the Middle East energy shock reduces the likelihood of near-term monetary easing. Although the shift in US rates has been smaller than in many other regions, it has done little to weaken the dollar. At the moment, the macro impact of rising energy prices is the dominant force shaping currency markets, while traditional drivers such as rate differentials have temporarily taken a back seat.
This suggests that even a mildly hawkish Federal Open Market Committee meeting on Wednesday—where the Fed could push the projected 25-basis-point rate cut from 2026 to 2027—may not provoke a dramatic reaction in the dollar. Still, if policymakers emphasize the inflation risks posed by higher energy prices while the US labor market remains resilient, it would likely provide modest support for the currency. In fact, the market’s reassessment of the Fed’s policy path has amplified the energy shock confronting Europe, Asia, and many emerging economies, undermining earlier expectations of a gradual dollar decline this year.
As long as energy prices remain elevated—or climb further—it will be difficult for the dollar to surrender the gains it has made this month. One potential source of increased dollar supply could come from official intervention, particularly if Japan steps in to curb USD/JPY should the pair rise beyond 160. A coordinated intervention by the United States and Japan to sell dollars would be unexpected and could trigger a broader correction in the currency. However, unless energy prices retreat meaningfully, any intervention would likely serve only to limit volatility rather than reverse the dollar’s broader strength.
The U.S. dollar strengthened on Friday and remained on course for a solid two-week winning streak, supported by its status as a preferred safe-haven asset amid the ongoing conflict involving Iran.
By 15:46 ET (19:46 GMT), the U.S. Dollar Index, which measures the greenback against a basket of six major currencies, rose 0.7% to 100.36 and was set for a weekly gain of around 1.4%. Meanwhile, EUR/USD fell 0.8% to 1.1423 and GBP/USD dropped 0.9% to 1.3228. USD/JPY edged 0.2% higher to 159.65.
Analysts at ING noted that the dollar has climbed to fresh monthly highs as markets struggle to see a clear resolution to the escalating Middle East crisis.
The joint U.S.–Israeli military campaign against Iran has now lasted more than a week and shows little sign of easing. President Donald Trump stated that Washington is “totally destroying” Iran’s military and economic capacity.
However, Tehran has signaled it will continue resisting. Iran’s new Supreme Leader, Mojtaba Khamenei, emphasized that the strategic Strait of Hormuz — a crucial shipping lane responsible for roughly one-fifth of global oil supply — will remain closed.
The possibility of a prolonged shutdown of the strait has triggered significant volatility in global oil markets. Brent crude prices surged to nearly $120 per barrel earlier in the week before briefly dropping below $90. On Friday, Brent futures were trading above $100 per barrel.
Because much of the oil and gas transported through the Strait of Hormuz is used to produce key goods such as fertilizers and plastics, rising energy prices could intensify inflationary pressures worldwide.
These inflation risks could lead central banks, including the Federal Reserve, to reconsider plans for near-term interest rate cuts. Higher interest rates typically attract foreign capital, which could further strengthen the U.S. dollar.
PCE inflation data in focus
Investors are also closely watching U.S. inflation data due on Friday, when the personal consumption expenditures (PCE) price index for January will be released.
The core PCE index — which excludes volatile categories like food and energy — is expected to rise 3.1% year-on-year, slightly above the 3.0% reading in December. This indicator is closely followed by financial markets because it is one of the Federal Reserve’s preferred gauges when setting monetary policy.
According to ING analysts, the core PCE index has been drifting further away from the Fed’s 2% target since reaching a low of 2.6% last summer.
They suggested that this trend may limit the Fed’s ability to lower interest rates this year and that policymakers will likely address the issue during next Wednesday’s Federal Open Market Committee (FOMC) meeting.
Interestingly, recent PCE data has shown stronger inflation than the Consumer Price Index (CPI) reported by the Labor Department. This difference largely reflects variations in weighting methods, particularly for housing and healthcare costs, as well as differences in coverage and consumer substitution patterns. Lower weighting for cooling shelter costs and higher exposure to rising medical expenses have kept PCE inflation relatively elevated compared with CPI.
In contrast, February’s CPI data released on Wednesday showed relatively moderate inflation of 2.4% year-on-year.
However, these figures mostly reflect a period before the Iran conflict escalated in late February with a wave of U.S. and Israeli airstrikes. Since then, the inflation outlook has become more uncertain.
Major central bank decisions ahead
Next week will be a crucial period for global monetary policy watchers, as several major central banks — including the Federal Reserve, the European Central Bank (ECB), and the Bank of England — are set to announce interest rate decisions.
Investors will pay close attention to how policymakers address the economic implications of the Iran conflict.
According to JPMorgan economist Michael Feroli, markets widely expect the Fed to leave its benchmark interest rate unchanged at a target range of 3.5%–3.75%.
However, the Middle East conflict may complicate the outlook. Feroli said the Fed’s post-meeting statement is likely to mention the crisis as an additional source of uncertainty affecting both employment and inflation objectives.
The ECB is also expected to keep rates unchanged, although policymakers are likely to comment on the severe oil and gas shock Europe is experiencing due to the conflict.
JPMorgan economists Bruce Kasman and Nora Szentivanyi noted that central banks often face difficult policy choices during periods of volatile energy prices. Energy costs frequently fluctuate by around 25% annually, pushing up energy inflation while making it difficult to determine whether changes stem from supply disruptions or shifts in demand.
While oil prices are expected to remain elevated, a prolonged closure of the Strait of Hormuz could drive prices well beyond current market expectations. A sustained rise to $125 per barrel or higher would likely increase inflation while simultaneously weakening economic growth.
They warned that such a scenario could trigger different policy responses from major central banks. The Federal Reserve typically prioritizes mitigating recession risks and could adopt a more dovish stance if oil shocks intensify. In contrast, the ECB has historically been more sensitive to rising inflation and could tighten monetary policy if oil prices climb significantly.
Before the attack began on Feb. 28, lingering inflation concerns had already made the Federal Reserve cautious about continuing the interest rate cuts introduced last year. While several indicators of price pressure had eased compared with earlier highs, policymakers were reluctant to declare victory over inflation, which had peaked at 9.0% year over year in the Consumer Price Index in June 2022.
Since then, inflation has fallen sharply and stabilized around the mid-2% range, slightly above the Fed’s 2% target. However, the cautious optimism that accompanied this disinflation may quickly fade because of the war.
The main concern is that surging energy prices could reignite inflation and force the central bank to keep monetary policy tighter for longer. With oil, gasoline, and natural gas prices rising sharply, it remains unclear how persistent the shock will be—or how the Fed should respond. This uncertainty creates a policy gray area that may take time to resolve. The longer the conflict lasts, the more uncertain the outlook for monetary policy becomes.
Two key questions dominate the discussion: When will the war end, and what economic consequences will follow? For now, the answers remain highly speculative. Much of the analysis focuses on the recovery of oil exports through the Strait of Hormuz, which remains largely closed due to the conflict and normally handles about one-fifth of the world’s seaborne oil exports.
The basic calculation is straightforward: the longer shipments remain disrupted, the greater the hit to global supply, which could sustain upward pressure on energy prices. According to estimates from Capital Economics, cited by the Financial Times, prolonged export disruptions would likely extend the period of elevated oil prices and complicate the inflation outlook.
The challenge for the Federal Reserve is determining which scenario is most likely and calibrating monetary policy accordingly. With no clear end to the war in sight, the near-term outlook for energy prices—and their implications for inflation and economic growth—remains highly uncertain.
Financial markets are also struggling to assess the range of possible outcomes and are largely adopting a wait-and-see stance. One signal of this caution can be seen in the U.S. 2‑Year Treasury Yield, which is widely viewed as a proxy for expectations about Fed policy. In recent days, the yield has hovered close to the Effective Federal Funds Rate, suggesting investors broadly expect the central bank to keep interest rates steady in the near term.
Fed funds futures point to a similar outlook, indicating that markets expect the Federal Reserve to keep interest rates unchanged over the next three policy meetings. Current pricing suggests the first potential rate cut could come in July or September, although those expectations remain tentative given the high level of uncertainty surrounding the war’s impact on growth and inflation.
“The Fed always has a problem in deciding how to respond to a supply shock,” said Alan Detmeister, a former Fed economist now at UBS. “On the one hand, the inflationary effects argue for raising interest rates. On the other, weaker output and rising unemployment point toward lowering rates. It’s not clear-cut, which often leads the Fed to wait and see which side of its dual mandate—inflation or employment—requires the most support.”
Ultimately, even if a ceasefire eventually stabilizes the region, the economic aftershocks could persist. As a result, the Fed’s policy outlook is likely to remain uncertain for some time, with policymakers needing clearer signals on how the conflict will shape inflation and economic growth.
It’s difficult to get too excited about today’s CPI report. Because the data entirely predates the Iran war, it does not capture the recent surge in energy prices that could make next month’s inflation reading far more dramatic. Normally, this might be considered the last relatively “clean” inflation print before those effects appear. However, the data is not truly clean either, as lingering distortions from earlier shutdowns are still influencing the figures.
Those lingering effects may become more visible in April’s report, when rent data could show a temporary spike. This is expected because the October owners’ equivalent rent (OER) sample—assumed to have contained zero increases—will drop out of the calculation, potentially lifting the shelter component for one month. By that time, inflation data will also begin to reflect the impact of the Iran conflict. As a result, the next couple of months could bring more volatile inflation readings.
For February, expectations were roughly +0.26% for headline inflation and +0.24% for core inflation. That pace implies an annual rate close to 3%—still above the Federal Reserve’s target but not dramatically so. However, inflation had already been showing signs of firming even before the geopolitical tensions in the Middle East intensified, raising questions about how markets and policymakers will interpret the latest data.
The U.S. CPI swaps curve already appears to be factoring in the effects of the conflict. Unsurprisingly, it is inverted, reflecting expectations of higher inflation in the near term due to energy prices. What is more unusual is that longer-term inflation expectations remain lower. While that might initially seem odd, it also serves as a useful reminder that markets may expect the energy shock to be temporary rather than a lasting source of inflation pressure.
Another interesting point can be seen in the chart of five-year inflation swaps across several regions. Despite the sharp swings in energy prices, U.S. five-year CPI swaps have moved relatively little compared with other markets. This is partly because the U.S. economy is generally less sensitive to oil price fluctuations than many other countries. In addition, the U.S. dollar has often moved in the same direction as oil prices, which can soften the direct pass-through of energy costs into domestic inflation.
Even so, the move still appears notable. Given that this is a five-year tenor, it is somewhat surprising to see such a reaction when most of the current volatility stems from spot energy prices rather than longer-term inflation pressures.
With those preliminaries in mind, the actual data is worth examining. Forecasts proved fairly accurate, with headline CPI rising 0.267%, while core CPI increased 0.216%, both broadly in line with expectations.
The spike in apparel prices is somewhat unusual, although such jumps do occur occasionally and the category represents a relatively small share of the overall CPI basket. The increase in medical care costs—driven largely by hospital services—was somewhat concerning. On the other hand, shelter inflation came in softer, which helped offset some of the upward pressure from other components.
Both core services and core goods inflation eased on a year-over-year basis. Core goods inflation is now running at about +1% y/y. While a continued downward turn had been widely expected, the key question is where it ultimately stabilizes—around +0.5% or -0.5%. My view is that it is more likely to settle near +0.5%. Even so, the latest trend is encouraging news for the broader inflation outlook.
The main surprise in the report came from primary rents. While Owners’ Equivalent Rent (OER) rose 0.22% month-on-month, roughly in line with the previous month and continuing to trend lower on a year-over-year basis, Rent of Primary Residence increased by only 0.13% month-on-month.
This softer reading was notable, although the year-over-year trend in OER may shift in the coming months as the October sample—when increases were effectively assumed to be zero—drops out of the calculation.
The broader trend in rents is clearly moving lower, but the sharp drop is still surprising—especially given the ongoing cost pressures faced by landlords. It is possible that the decline will partially reverse next month. One likely explanation could be compositional shifts in the data. For example, rents may be softening in large cities as reverse immigration flows ease pressure on housing supply, while outmigration from places like New York City could also be influencing the figures. A deeper breakdown of the data would be needed to confirm these effects.
Meanwhile, the Lodging Away from Home category rose 1%. This component has been recovering after a dip last year, although hotel prices remain below the post-pandemic surge that followed COVID-19, when pent-up travel demand pushed rates sharply higher. Given the ongoing recovery in travel demand, there is a reasonable chance that hotel prices could reach new highs in 2026.
Airfares also increased, rising 1.4% month-on-month. This is worth watching closely. As energy prices climb, airlines often pass higher fuel costs on to passengers. While February’s data does not yet reflect the latest surge in energy prices, persistently high jet fuel costs could push airfares higher in the coming months.
If that happens, it may show up as stronger core inflation, even though the underlying driver would primarily be energy-related rather than a broader rise in service-sector prices.
The red dot reflects the end-of-February reading. Since then, jet fuel prices have been highly volatile. They are currently around $3.49, after briefly reaching $4.11 just a few days ago. Such swings in fuel costs typically feed through to airline pricing with a short lag, meaning the impact is likely to appear in next month’s airfare data.
Turning to “supercore” inflation—core services excluding shelter—**the pace eased compared with the previous month. Last month, supercore rose 0.59% month-on-month, while this month it increased a more moderate 0.35% m/m.
On a year-over-year basis, core services excluding rents currently stand at 2.94%. However, that figure is likely to jump next month due to base effects. The comparison will drop the unusually weak reading from last March, when several travel-related categories posted sharp declines: airfares fell 5.27%, lodging away from home dropped 3.54%, and car and truck rentals declined 2.66%.
As those unusually weak numbers roll out of the calculation, the year-over-year supercore measure will likely rise—even if the month-to-month readings remain relatively modest. And given recent developments in travel and energy costs, those monthly figures may not stay soft for long.
The overall distribution of price changes this month is also notable. Several categories recorded increases of less than 1% on an annualized month-to-month basis, although most of them were only slightly below that threshold.
It is also worth noting that the figures shown in red reflect adjustments based on my own estimate of seasonal patterns, rather than the methodology used by the Federal Reserve Bank of Cleveland.
There were also many categories in the upper tail of the distribution, although the upper tail appears longer than the lower one. Of course, Median CPI—a measure published by the Federal Reserve Bank of Cleveland—doesn’t depend on how long those tails are. That is precisely the point of using a median measure.
While I’m not fully confident in my estimate this month, I expect the median reading to come in relatively soft, likely below 0.2%.
Typically, median CPI tends to run comfortably above the mean CPI because for many years inflation has existed in a disinflationary regime, where price-change distributions were skewed to the downside—meaning the tails were longer on the negative side. In such environments, the median usually sits above the mean. This month, however, that pattern may not hold. During inflationary cycles, the distribution often flips, with longer tails on the upside, causing the mean to exceed the median. That said, one month of data is not enough to draw firm conclusions.
Regarding monetary policy, the February CPI figures may not carry much weight given the developments in March. Markets appear to be misinterpreting the recent energy price spike, treating it as an inflationary impulse that complicates the Federal Reserve’s policy path amid soft employment data. In reality, energy-driven increases in CPI are not typically the kind of inflation central banks try to suppress through tighter policy. Energy prices tend to be mean-reverting and are often anti-growth, meaning they slow economic activity.
Earlier observations about the CPI swaps curve—which is inverted and shows lower longer-term inflation expectations than a month ago—likely reflect markets beginning to price in a possible recession. While recessions themselves are not inherently disinflationary, markets often treat them that way.
If the Fed were to tighten policy in response to an energy-driven spike in inflation, it could worsen an economic slowdown. That dynamic contributed to several policy mistakes during the 1970s inflation crisis, something modern policymakers are well aware of. As a result, an energy shock combined with weak employment data is more likely to push the Fed toward easing rather than tightening.
In that sense, the current situation would not qualify as classic stagflation if core inflation continues to moderate. It may resemble “stag”—sluggish growth—but a higher headline CPI driven by energy does not necessarily signal persistent inflation if core and median measures remain contained.
That said, there are reasons for caution. Core and median inflation may not remain subdued indefinitely. There are already signs they could move back toward the mid-to-high 3% range, and indicators such as the Enduring Investments Inflation Diffusion Index are trending higher, suggesting broader price pressures could gradually re-emerge.
(That said, the Federal Reserve does not necessarily share this view. We may eventually find ourselves discussing stagflation in a more literal sense, but many observers could still be misled by spikes in headline inflation.)
Another key implication is that the February data will likely have limited influence on policy decisions. Given the events that unfolded in March, the CPI figures for February are already somewhat outdated. Since the report came in largely in line with expectations, markets are unlikely to dwell on it for long.
In short, February’s inflation print will probably be forgotten quickly. Attention will soon shift to the next few releases, which are likely to reflect the impact of the recent energy shock. Those upcoming numbers could be far more dramatic—and not necessarily in a reassuring way.
The U.S. dollar remains exceptionally strong, a factor that could help keep U.S. financial markets relatively resilient. Because gold is priced in dollars, the metal may once again attract nervous investors as a safe haven. At the same time, shipping disruptions have created an acute shortage of fertilizers, raising concerns about potential food supply shortages.
Meanwhile, the International Energy Agency has proposed the largest release of oil reserves in its history—around 400 million barrels—to help offset supply disruptions linked to tensions around the Strait of Hormuz. Bloomberg also reported that Germany and Japan are preparing to tap their strategic crude reserves in the coming days.
Signs of stress are also emerging in private credit markets. BlackRock has restricted withdrawals from one of its flagship private credit vehicles, the HPS Corporate Lending Fund, after a surge in redemption requests. The $26 billion fund received about $1.2 billion in withdrawal requests during the first quarter but will permit only $620 million in redemptions—roughly 5% of the fund. If anxiety spreads further across private credit markets, it could tighten lending conditions and slow economic growth, potentially prompting the Federal Reserve to respond with additional interest-rate cuts.
Inflation data also supported expectations for future rate reductions. The U.S. Department of Labor reported that the Consumer Price Index rose 0.3% in February and 2.4% over the past 12 months, with both headline and core readings matching economists’ forecasts. A particularly encouraging detail was the moderation in shelter costs—often measured through owners’ equivalent rent—which increased only 0.2% in February. Given that shelter costs have risen about 3% over the past year and have been a major driver of inflation, this slowdown suggests price pressures in that category may be cooling more rapidly.
On the corporate front, Nvidia is set to host its annual GPU Technology Conference next week, where the company is expected to unveil details about its next-generation chip architecture. Anticipation surrounding the event has already helped lift semiconductor and memory stocks. The conference is also expected to emphasize optical networking technologies, which could benefit companies such as Ciena, Corning, and Ubiquiti.