- Silver stays under pressure near $57.00 after plunging roughly 12% over the past two sessions.
- Growing expectations of further Fed rate hikes have weighed heavily on precious metals this week.
- XAG/USD is now trading in deeply oversold territory, signaling the possibility of a corrective rebound.
Silver (XAG/USD) extends its decline on Thursday, hovering near seven-month lows around $57.00 at the time of writing after tumbling nearly 12% over the previous two sessions. Growing expectations that the Federal Reserve (Fed) could raise interest rates later this year have pressured precious metals throughout the week, while investors now turn their attention to the upcoming US Personal Consumption Expenditures (PCE) Price Index data for further policy clues.
A series of stronger-than-expected US economic releases, particularly improving labor market conditions and persistently elevated inflation, has reinforced the Fed’s hawkish tone in recent weeks. Markets currently see a 32% probability of a rate hike at next month’s meeting and a 65% chance of monetary tightening by September. This outlook has lifted US Treasury yields and strengthened the US Dollar, adding further downside pressure on Silver.
Thursday’s US economic calendar features several key releases, though the spotlight remains on the May PCE Price Index report. Annual PCE inflation is forecast to accelerate to 4.1%, marking its highest level in three years, as the data precedes the recent drop in Crude Oil prices. Such figures are unlikely to offer meaningful relief for Silver prices.
Technical Analysis: The intraday RSI has slipped into oversold territory, signaling the potential for a short-term corrective rebound.
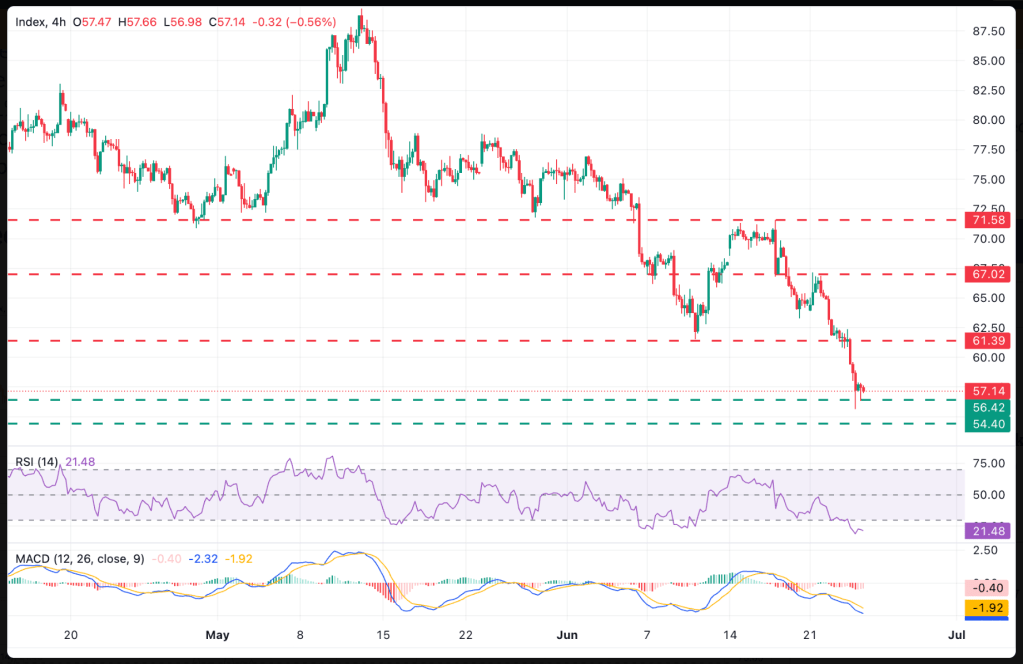
XAG/USD trades around $57.14, maintaining a bearish short-term outlook, although oversold conditions suggest the recent decline may be overstretched. On the 4-hour chart, the Relative Strength Index (14) sits near 20, while the Moving Average Convergence Divergence (MACD) histogram remains in negative territory but is gradually moving toward the zero line, indicating that bearish momentum could be fading.
The December 4, 2025 low near $56.45 continues to provide immediate support, with the next downside target located around the mid-$54.00 region, corresponding to the October and November 2025 highs. A deeper decline could then expose the November 21, 2025 low at $48.64.
On the upside, any recovery attempt is expected to encounter initial resistance around the previous support zone near $61.40. Additional barriers are seen near the June 22 high around $67.00, followed by the June 17 peak close to $71.60.

Leave a comment