- Gold attracts fresh buying interest after tumbling to a weekly low in the wake of the Fed’s policy announcement.
- Growing optimism surrounding a potential US–Iran peace agreement triggers profit-taking in the US Dollar, lending support to the precious metal.
- However, the Fed’s hawkish stance boosts expectations of a December rate hike, helping the Dollar limit its decline and keeping gold’s upside in check.
Gold prices rebounded above $4,300 during Thursday’s Asian session as investors took profits on the US Dollar following optimism surrounding a preliminary US–Iran peace agreement.
The agreement, signed by US President Trump and Iranian President Pezeshkian, aims to end hostilities and reopen the Strait of Hormuz, while Trump’s indication that nuclear negotiations remain flexible further improved market sentiment. The resulting decline in safe-haven demand for the Dollar helped support gold prices.
However, gold’s upside remains limited after the Federal Reserve’s hawkish policy decision. The Fed left interest rates unchanged at 3.5%–3.75%, but removed language suggesting further easing and raised its year-end rate forecast to 3.8% from 3.4%. Markets now see an approximately 85% probability of a 25-basis-point rate hike in December, pushing US Treasury yields higher and providing underlying support for the Dollar.
As a result, while gold has recovered from recent lows near $4,020, stronger follow-through buying may be needed to confirm a sustained bullish recovery. Investors will closely monitor upcoming US economic data, including the Philadelphia Fed Manufacturing Index and Weekly Initial Jobless Claims, as well as comments from Fed officials, for further direction in both the Dollar and gold markets.
Gold Daily Chart
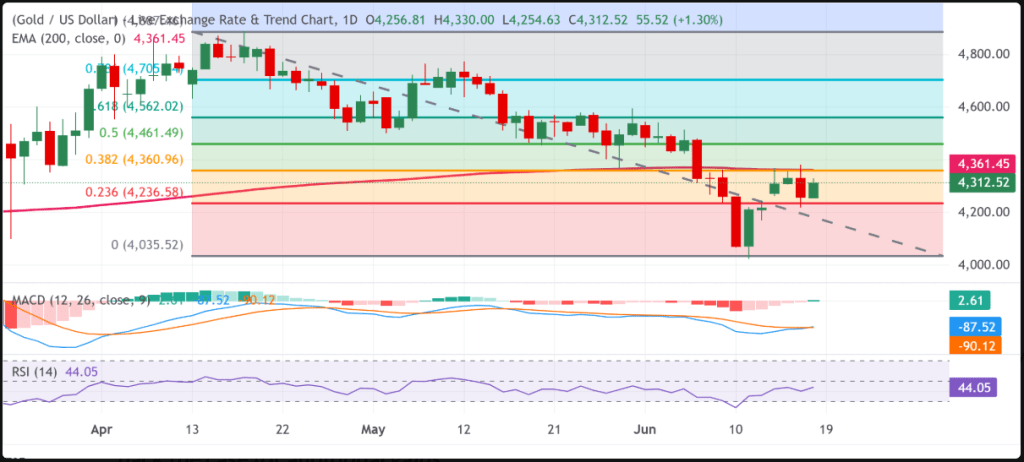
Gold’s recovery remains tentative after failing to establish a foothold above the $4,350–$4,360 resistance zone, where the 38.2% Fibonacci retracement of the April–June decline converges with the 200-day EMA. This key technical barrier continues to cap upside momentum and suggests that bullish conviction remains limited.
Although the subsequent pullback found support near the 23.6% Fibonacci retracement level around $4,237, momentum indicators paint a mixed picture. The RSI remains near 44, indicating weak momentum and a lack of strong buying pressure, while the MACD histogram has turned slightly positive, suggesting that bearish momentum is fading rather than signaling a decisive bullish reversal.
As a result, a sustained break and close above $4,350–$4,360 would be needed to confirm a stronger recovery and open the door for a move toward the 50% retracement level at $4,461. Beyond that, the next upside targets are located at $4,562, $4,705, and ultimately the recent high near $4,887.
On the downside, $4,237 serves as the first line of support. A break below this level could expose the previous swing low around $4,036, a critical area where buyers are expected to defend the broader long-term bullish trend. Overall, the near-term bias remains cautiously constructive, but confirmation above the $4,350–$4,360 resistance zone is needed before a stronger rally can be anticipated.

Leave a comment