- Gold comes under renewed selling pressure on Friday as uncertainty surrounding the Iran peace deal boosts the US Dollar.
- Expectations of a hawkish Federal Reserve continue to support the USD and weigh on the non-yielding precious metal.
- XAU/USD remains on track to post significant losses for the second consecutive week.
Gold (XAU/USD) faces renewed selling pressure on Thursday after a modest rebound to the $4,246–$4,247 area during the Asian session, halting the previous day’s strong recovery from its lowest level since November 2025. Conflicting signals from the US and Iran regarding a possible peace agreement revive demand for the safe-haven US Dollar (USD). Combined with expectations of a hawkish US Federal Reserve (Fed), the stronger USD continues to weigh on the non-yielding precious metal.
US President Donald Trump stated on Thursday that a deal with Iran had been reached and that the final agreement could be signed soon, possibly over the weekend. However, optimism faded after Iran denied making a final decision on the agreement. Reports also indicated that Iran’s new Supreme Leader, Mojtaba Khamenei, has yet to approve the proposed US-backed peace deal. In addition, Iran’s Foreign Ministry reportedly noted that key issues, including access through the Strait of Hormuz and frozen assets, remain unresolved.
Meanwhile, Iranian forces reportedly stopped a tanker from passing through the strategic waterway without prior coordination, highlighting continued uncertainty over Iran’s stance. Further escalating tensions, Fox News reported that US forces intercepted and destroyed two Iranian one-way attack drones near the Strait of Hormuz. These developments keep geopolitical risks elevated and support a modest rebound in crude oil prices, increasing inflation concerns. This comes as recent US inflation data points to renewed price pressures, strengthening the case for higher interest rates for a longer period.
This week’s US Consumer Price Index (CPI) and Producer Price Index (PPI) data signaled a reacceleration in inflation, reinforcing expectations that the Fed could raise interest rates again before year-end. The outlook continues to support the Greenback and pressure Gold prices. Still, traders may avoid making aggressive bearish moves on XAU/USD while awaiting further developments in the Middle East situation. Even so, the precious metal remains on course to record heavy losses for the second consecutive week.
Gold Daily Chart
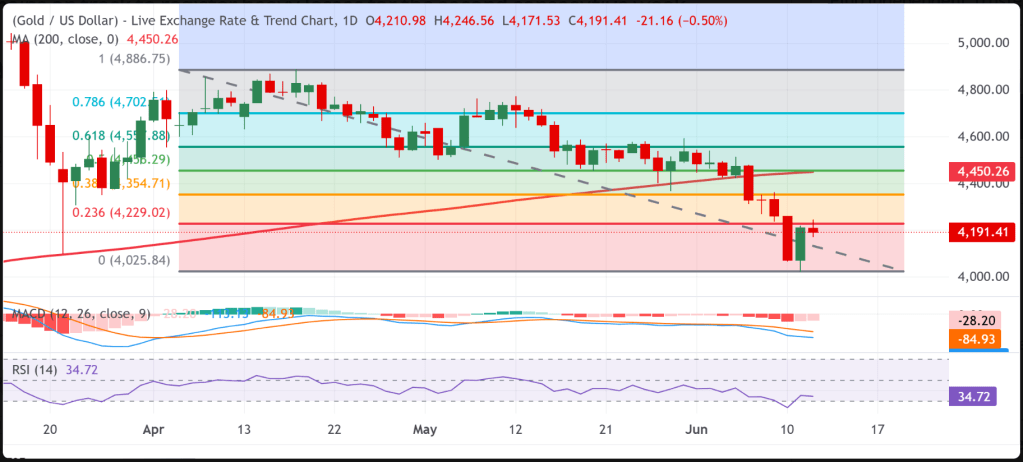
Gold’s technical outlook continues to favor bearish traders, supporting the possibility of further downside in the near term.
From a technical standpoint, the precious metal maintains a negative bias while trading below the 200-day Simple Moving Average (SMA). In addition, Friday’s rejection near the 23.6% Fibonacci retracement level of the decline from the April swing high indicates that the recent rebound may simply represent a short-covering rally rather than a true trend reversal.
At the same time, the Moving Average Convergence Divergence (MACD) remains in bearish territory, with the indicator staying below its signal line and the histogram still negative. The Relative Strength Index (RSI) also remains around the mid-30 region, suggesting that selling pressure is still present despite the modest recovery from recent lows.
On the upside, immediate resistance is seen near the 23.6% Fibonacci level around $4,229, followed by the 38.2% retracement near $4,355. Further resistance appears around the 200-day SMA at approximately $4,450, which aligns closely with the 50% Fibonacci retracement near $4,456. Beyond that, the 61.8% retracement at $4,558 and the 78.6% level around $4,703 could pave the way toward the cycle peak near $4,887.
On the downside, the key support level remains the recent swing low around $4,026. A decisive break below this area would increase the likelihood of a deeper corrective decline.

Leave a comment