Tag: commodity

  • Gold prices continue to rise amid renewed concerns over Trump’s tariff policies.

    Gold extended its rally for a fourth consecutive session on Monday, building on last week’s advance as new global tariff measures from U.S. President Donald Trump and softer U.S. economic data boosted demand for safe-haven assets.

    Spot gold climbed 0.8% to $5,143.55 an ounce by 19:53 ET (00:53 GMT), while U.S. gold futures jumped 1.7% to $5,165.86.

    Bullion gained more than 1% last week as escalating geopolitical tensions between the U.S. and Iran encouraged a risk-off tone across markets.

    Late last week, Trump announced a 10% tariff on global imports for 150 days under Section 122 of U.S. trade law, following a decision by the Supreme Court of the United States to strike down a broader tariff framework. The administration subsequently increased the levy to 15%—the maximum permitted under the statute—heightening fears of retaliatory actions and disruptions to global supply chains.

    The tariff move dampened investor sentiment, driving flows into traditional safe havens such as gold and U.S. Treasuries. Ongoing uncertainty about how long the tariffs will remain in place, along with potential legal and congressional challenges, added to market volatility.

    Gold also found support in recent U.S. data. The economy expanded at an annualized 1.4% pace in the fourth quarter, a notable slowdown from the prior quarter. Meanwhile, the Personal Consumption Expenditures (PCE) price index—the inflation measure favored by the Federal Reserve—rose 2.9% year-on-year in December, with core inflation near 3.0%, still above the central bank’s 2% target.

    The mix of moderating growth and persistently elevated inflation strengthened gold’s role as both a hedge against economic uncertainty and a store of value.

    Sources: Ayushman Ojha

  • Markets in Focus – USD/MXN, S&P 500, EUR/USD, USD/CAD, Gold, Bitcoin, USD/JPY, GBP/USD

    USD/MXN

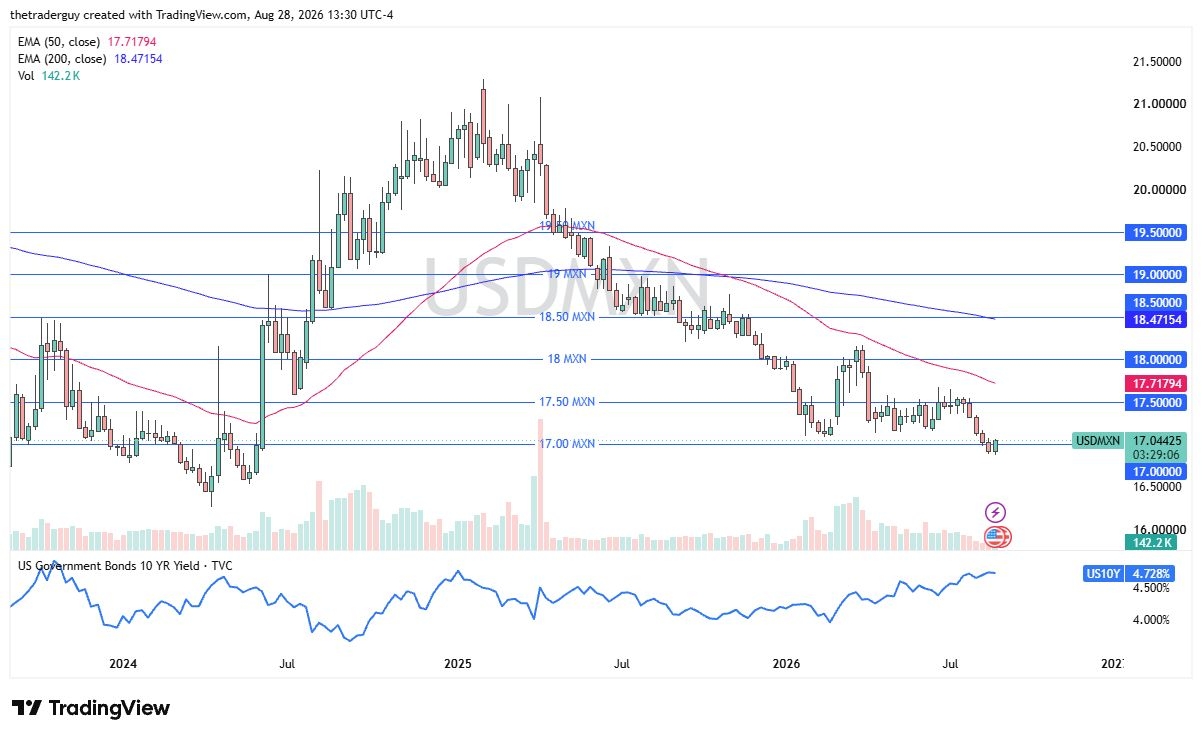
    The US dollar at one stage surged sharply against the Mexican peso, but by week’s end it had given back some of those gains. The 17.00 area below continues to act as a key support zone, and a decisive break beneath it could open the door for a move toward 16.50.

    While short-term bounces are possible, the broader setup suggests selling into strength. The 17.50 region remains a significant resistance barrier, and the wide interest rate differential still strongly favors the Mexican peso.

    S&P 500

    The S&P 500 pulled back early in the week but appears to be stabilizing as it continues to trade within a broader consolidation range. Since early December, price action has been confined between 6,800 and 7,000, suggesting a market building momentum for its next major move.

    The bias still leans to the upside. A decisive daily close above 7,000 could trigger a stronger breakout and accelerate gains. On the other hand, a breakdown below 6,800 would signal a shift in tone and mark a more bearish development.

    EUR/USD

    The euro declined notably over the course of the week, but it continues to find buyers near the 1.18 level, making that area especially important to watch. Given the current structure, caution is warranted when trading this pair.

    Price action appears largely range-bound, with 1.18 acting as a central pivot or magnet. Resistance stands near 1.1850, while solid support can be found around 1.1750, reinforcing the broader sideways pattern.

    USD/CAD

    The US dollar has advanced against the Canadian dollar, but price action remains choppy around the 1.3750 zone — an area that has repeatedly proven significant. The pair appears to be oscillating as traders assess whether momentum can build for a sustained move higher.

    A decisive push and hold above 1.3750 would signal renewed strength for the US dollar. Conversely, a breakdown below 1.35 would represent a notably bearish shift in sentiment.

    Major Technical Support and Resistance Levels

    Gold (XAU/USD)

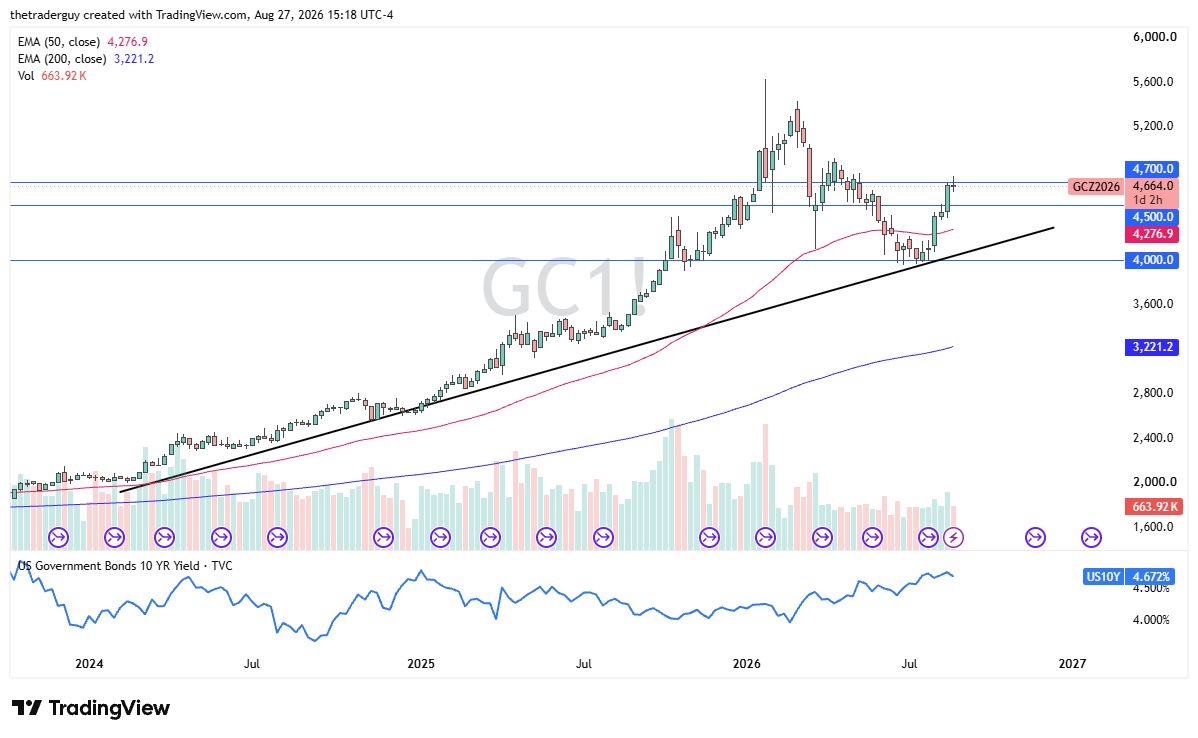
    Gold remains choppy, initially easing back during the week, yet buyers continue to emerge on dips, stepping in whenever prices soften. The 4,800 level appears to be firm support, while the 5,000 mark is likely to act as a psychological magnet for price action.

    The broader bias still favors buying pullbacks, with the expectation of an eventual move higher. However, volatility may persist after the sharp turbulence seen in recent weeks, following what had previously been a near one-way surge. Over the longer term, a retest of the highs seems plausible, though it will likely require patience amid ongoing fluctuations.

    Bitcoin (BTC)

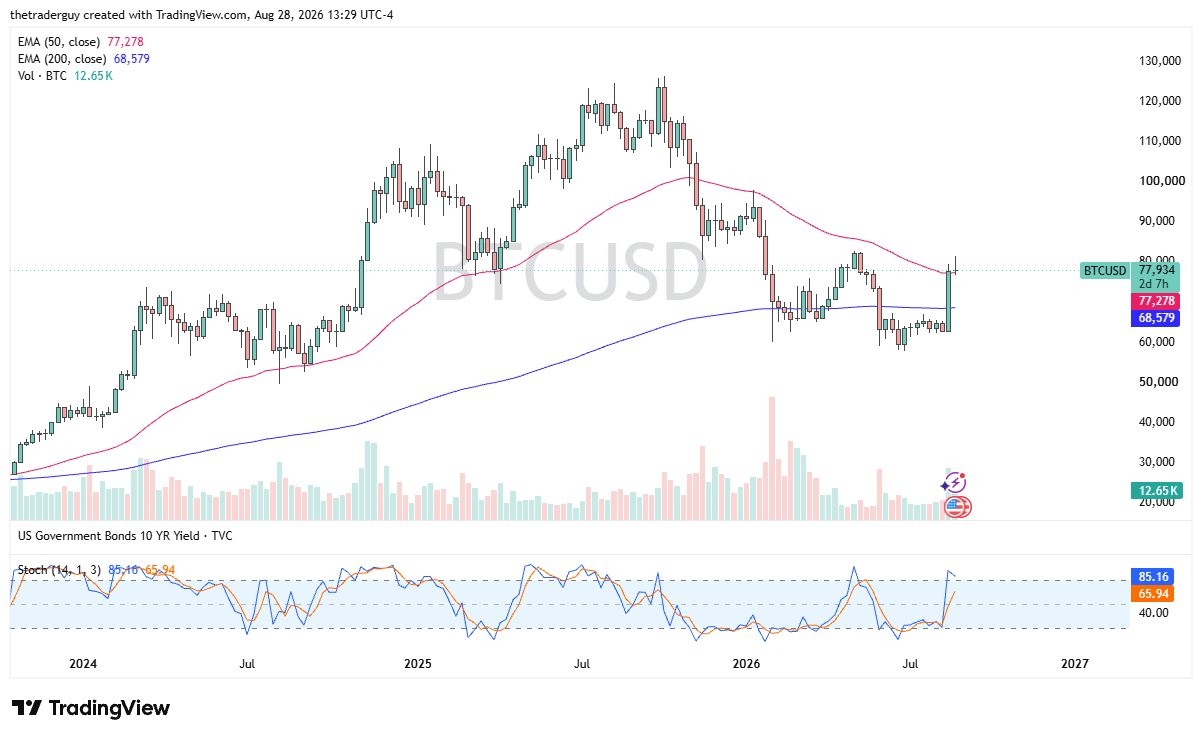
    The Bitcoin market is still searching for renewed upside momentum, but the encouraging development is that price action has at least stabilized. Given the prolonged weakness seen in recent periods, simple stability is a constructive step forward for the market.

    The $60,000 level remains a crucial support zone and a major psychological benchmark. Holding above this area is essential if Bitcoin is to maintain any realistic prospect of a sustained recovery.

    USD/JPY

    The US dollar posted solid gains against the Japanese yen over the week, with the ¥152 level continuing to provide strong support. The 50-week EMA is positioned just beneath that area, reinforcing the floor and encouraging dip-buying as the interest rate differential remains in favor of the US dollar.

    With the Bank of Japan maintaining its current policy stance, there appears to be little immediate catalyst for a structural shift. As a result, the pair may be entering a consolidation range between ¥152 on the downside and ¥158 on the upside. A decisive move above ¥160 would represent a significant breakout, clearing a resistance zone that has been in place since 1990.

    GBP/USD

    The British pound declined sharply during the week, dropping to test the 1.35 level — a large, round psychological threshold that has proven important on multiple occasions. The fact that buyers are attempting to defend this area is at least a constructive short-term signal.

    However, recent UK economic data has been somewhat underwhelming. As a result, sterling may currently be one of the weaker major currencies against the US dollar. This pair deserves close monitoring, as broader dollar strength could translate into pronounced downside pressure here, potentially making GBP/USD particularly vulnerable.

    Sources: Lewis

  • A rollback of Trump-era tariffs may lower input costs for U.S. energy companies, though it is unlikely to significantly alter overall trade flows.

    The U.S. Supreme Court’s decision on Friday to overturn trade tariffs introduced by President Donald Trump last year could ease financial pressure on certain oil producers and drilling firms, though analysts say it is unlikely to significantly reshape global energy trade flows in the near term.

    By striking down the tariffs, the Supreme Court of the United States may lower the cost of constructing LNG facilities and other major energy projects that depend on foreign-made modules and components. For instance, Venture Global assembles parts of its LNG plants in Italy before shipping them to the U.S. for completion — a process that had become more expensive under the tariff regime. U.S. crude producers and oilfield service firms also faced higher costs for imported equipment and materials, with some absorbing the impact and others attempting to pass it along to customers.

    Cam Hewell, CEO of Premium Oilfield Technologies, said his company had expected to pay $5–6 million in tariff-related taxes in 2026 — a figure that may now decline. He noted that most of the added costs had been absorbed internally, meaning customer pricing would see little change, but improved cash flow could support research, employee compensation, and shareholder returns.

    Kirk Edwards, president of Latigo Petroleum in Texas, added that the ruling could improve budgeting clarity and cost visibility for drilling projects.

    However, the decision does not eliminate the 50% tariffs on steel and aluminum imposed last year, and some executives remain cautious that the administration could pursue alternative measures to maintain similar trade barriers. Trump himself indicated he may introduce a 10% global tariff for 150 days, signaling that policy uncertainty remains.

    Despite the potential cost relief for LNG infrastructure, experts believe global LNG trade patterns are unlikely to shift materially. Ira Joseph of Columbia University’s Center on Global Energy Policy said China has stronger economic incentives to continue redirecting U.S. LNG cargoes to Europe for arbitrage or to import cheaper oil-indexed LNG from the Middle East.

    Alex Munton of Rapidan Energy added that Beijing increasingly views LNG purchases as strategic leverage in its relationship with Washington, making new buying commitments unlikely even if tariff pressures ease. Samantha Santa Maria-Hartke of Vortexa echoed that view, suggesting China — which halted U.S. crude and LNG imports after imposing retaliatory tariffs — is unlikely to reverse course in the near term.

    Sources: Reuters

  • Gold Breakout Above $5,160 Signals Move Toward $5,275

    Gold futures are presently moving within a defined VC PMI mean-reversion structure, signaling a market positioned at a pivotal balance point between accumulation and expansion. The price hovering near 5,030 coincides exactly with the weekly VC PMI mean, reinforcing the idea that value and momentum are in equilibrium as traders wait for a clear directional trigger.

    When prices consolidate around the mean, the probability outlook turns neutral. A decisive breakout above resistance or a pullback into lower value zones is needed to generate the next high-probability trading opportunity.

    Under the VC PMI framework, a sustained close above the 5,030 weekly mean and the daily Sell-1 resistance around 5,036 shifts probabilities in favor of continued upside. That confirmation opens the path toward the daily Sell-2 level near 5,075 and the weekly Sell-1 target at 5,160. A firm break and close above 5,160 would mark the start of a volatility expansion phase, transitioning the market from consolidation into a directional trend, with former Sell-1 and Sell-2 levels converting into support.

    In that bullish scenario, momentum could extend toward the weekly Sell-2 objective around 5,275, signaling stronger institutional flows and momentum-based participation. Historical probability metrics suggest that once price closes above the mean and sustains it, there is roughly a 70–80% chance of continuation toward the next resistance zone.

    On the other hand, failure to hold above the VC PMI mean—particularly a close below 5,000—would tilt probabilities toward a corrective retracement into the daily Buy-1 level near 4,965 and Buy-2 around 4,933. These represent statistically extreme value areas, where the model identifies a 90–95% probability of reversion back toward equilibrium after being tested.

    As long as price remains above the weekly Buy-1 level at 4,916, the broader technical structure stays constructive, implying pullbacks are corrective in nature rather than trend reversals. However, a decisive break below the weekly Buy-2 level at 4,785 would negate the current bullish outlook and point to a deeper cyclical correction.

    Time-cycle analysis heading into late February and early March highlights critical inflection windows around February 24–26 and March 3–7—periods that historically coincide with shifts from consolidation to expansion phases.

    These timing cycles correspond with Square-of-9 harmonic resistance in the 5,075–5,160 range and support clusters between 4,965 and 4,916, forming a technically balanced and mathematically aligned trading range.

    When time and price harmonics converge in this manner, the probability of volatility expansion increases significantly, often leading to directional breakouts accompanied by stronger momentum and broader market participation.

    Sources: Patrick MontesDeOca

  • Gold maintains upward bias north of $5,000 as traders await US economic releases.

    Gold (XAU/USD) remains tilted to the upside for a third consecutive session on Friday, though gains appear restrained amid a mixed fundamental backdrop. Traders are largely staying on the sidelines ahead of key U.S. data releases — the Advance fourth-quarter GDP report and the Personal Consumption Expenditures (PCE) Price Index — before committing to fresh directional positions. These readings are expected to shape expectations for the Federal Reserve’s rate-cut trajectory, which in turn will influence the U.S. dollar and the outlook for the non-yielding yellow metal.

    Heightened geopolitical tensions are offering some support. U.S. President Donald Trump warned Iran that it must reach a nuclear agreement within 10 to 15 days or face severe consequences. In response, Iran told UN Secretary-General Antonio Guterres that while it does not seek conflict, it would respond to any military aggression and consider hostile forces’ regional bases legitimate targets. The escalating rhetoric has revived fears of a broader Middle East confrontation, underpinning safe-haven demand for gold and helping sustain its modest advance into the end of the week.

    However, upside momentum remains capped by shifting interest-rate expectations. Minutes from the January FOMC meeting indicated policymakers are not in a rush to ease policy further and even discussed the possibility of additional tightening should inflation remain persistent. Strong U.S. labor market data, coupled with hawkish remarks from Fed officials, has prompted investors to scale back expectations for aggressive rate cuts.

    This repricing has lifted the U.S. dollar to its highest level since January 23, limiting further gains in gold and suggesting bulls may remain cautious until clearer signals emerge from incoming economic data.

    XAU/USD H1 chart

    Gold buyers stay in control above the 100-hour SMA; range breakout still pending.

    On Thursday, XAU/USD successfully held above the 100-hour Simple Moving Average (SMA), which has shifted from resistance to support, and staged a modest rebound from that level. However, the absence of strong follow-through buying and the largely range-bound movement seen over the past couple of sessions suggest bulls should remain cautious. The 100-hour SMA, currently positioned at $4,965.41, continues to provide nearby dynamic support.

    From a momentum standpoint, the Moving Average Convergence Divergence (MACD) remains below both its Signal line and the zero mark, although the narrowing negative histogram points to easing bearish pressure. Meanwhile, the Relative Strength Index (RSI) hovers around 53, reflecting neutral conditions and a tentative recovery bias.

    As long as price action stays above the rising 100-period SMA, short-term risks remain tilted to the upside. A bullish MACD crossover accompanied by a move back above the zero line would reinforce the case for further gains. On the other hand, if MACD momentum weakens further and the RSI turns lower from the mid-50 region, the rebound could lose traction, potentially leading to another test of the moving average before a clearer directional move emerges.

    Sources: Haresh Menghani

  • Oil hovers near six-month peak on US-Iran tensions, poised for strong weekly gains.

    Oil prices moved modestly higher in Asian trading on Friday, building on strong gains from the prior two sessions and putting major benchmarks on course for roughly a 6% weekly advance, as rising tensions between the U.S. and Iran heightened concerns about potential supply disruptions in the Middle East.

    By 22:41 ET (03:41 GMT), Brent for April delivery climbed 0.2% to $71.81 a barrel, while West Texas Intermediate (WTI) crude rose 0.5% to $66.78 a barrel.

    Both contracts were hovering near their highest levels since early August and were set to record weekly gains of more than 6%.

    Oil near six-month high on US-Iran tensions

    Investor anxiety has intensified after U.S. President Donald Trump warned Tehran that “bad things” could follow if a nuclear agreement is not reached within roughly 10–15 days, raising the possibility of military action.

    According to a Wall Street Journal report, Trump is considering a limited strike on Iranian targets to pressure Tehran into accepting a nuclear deal.

    Any escalation involving Iran — a key OPEC producer — could jeopardize shipments through the Strait of Hormuz, a vital passageway that handles about one-fifth of global oil trade, thereby increasing the market’s sensitivity to geopolitical risk.

    This week’s rally also marked a rebound from earlier losses, when prices slipped at the start of the week on hopes that U.S.-Iran negotiations were making progress. The renewed tough rhetoric has since restored a geopolitical risk premium, pushing crude back toward multi-week highs.

    US crude inventories drop sharply – EIA

    Data from the U.S. Energy Information Administration on Thursday showed crude stockpiles fell by around 9 million barrels last week, defying expectations for a 1.7 million-barrel increase.

    The report also indicated declines in gasoline and distillate inventories, both coming in below forecasts, suggesting solid demand from refiners and consumers.

    Markets are now awaiting the release of the U.S. Personal Consumption Expenditures (PCE) Price Index later on Friday — the Federal Reserve’s preferred measure of inflation.

    Following recent hawkish Fed minutes that signaled policymakers are in no rush to cut interest rates, the PCE data could offer additional insight into the central bank’s policy trajectory.

    Sources: Ayushman Ojha

  • Gold Moves in a Tight Range, but Technical Setup Signals Potential Surge Toward $6,800 if Breakout Occurs

    The Chinese Spring Festival (Chinese New Year) holiday is now underway, a period that has historically coincided with softer fiat-denominated gold prices.

    Meanwhile, gold is carving out a consolidation range between $4,400 and $5,600. The longer price action remains compressed within this band, the more constructive the setup becomes.

    Extended consolidation typically builds pressure — increasing the probability of an eventual upside breakout and a potential rally toward $6,800.

    Here’s another perspective on the price action. Notice the channel outlined by the dotted blue trendlines.

    Gold has broken decisively above that channel and now seems to be digesting the move, consolidating gains after the breakout.

    Seasonal softness across the metals complex could linger until the Chinese holiday concludes. For enthusiastic Western gold investors, this pullback phase may present an opportunity to increase exposure to gold, silver, and mining equities.

    I’ve outlined what I call an emerging “gold bull era,” driven less by Western fear-based demand and more by the structural economic ascent of China and India—an expansion powerful enough to overshadow the West’s traditional crisis trade.

    This new phase could also unfold alongside rapid automation, with hundreds of millions of robots taking on work that inflation-strained populations—both East and West—are increasingly burdened by.

    In such an environment, widespread income support could evolve into significantly higher baseline incomes, and gold-oriented Asian consumers may expand their purchases well beyond already robust levels.

    In the West, the backdrop looks increasingly fragile. Job growth in 2025 has been minimal, with the latest ADP data showing only around 22,000 positions added in January.

    By contrast, the official government report showed a gain of 130,000 jobs. That wide gap raises questions—either the data contains significant distortions, or much of the hiring is concentrated in government roles funded by expanding public debt.

    The core fear-trade argument is straightforward: if private-sector job creation continues to stall while debt-financed employment props up the headline numbers, underlying economic weakness may deepen.

    Unless productivity gains from automation are formally reflected in economic measurements, the strain between slowing human employment and rising fiscal burdens could intensify.

    For investors focused on hedging systemic risk, the question becomes familiar: is your portfolio positioned with assets designed to weather instability?

    How about silver? The head-and-shoulders top currently forming is a bearish technical pattern pointing toward the $20 area. What might invalidate this setup?

    A rally to $87 would push silver back above three of the shoulders in the formation. An additional climb to $93 would fully invalidate the pattern and deal a severe blow to heavily leveraged bears.

    Being a pure silver bug—someone almost entirely invested in silver—demands serious conviction and resilience. For the average investor newly drawn to this remarkable metal, it’s wise to keep ample cash on hand to take advantage of unexpected price pullbacks.

    What about the miners? On the CDNX daily chart, the RSI and Stochastics are showing positive signals, but the key 20,40,10 MACD is still sluggish and lacking momentum. If that indicator begins to strengthen, the uptrend in junior mining stocks should pick back up.

    The CDNX weekly chart looks impressive. The base formation is strong and likely signals further upside not only for juniors, but also for intermediate and senior mining companies.

    The most probable near-term outlook is a brief pause as Chinese investors step back for the New Year holiday, followed by a solid rally into April for the mining sector. After that, a seasonal consolidation through the summer seems likely, before a powerful, decisive breakout above the 1177 highs.

    In the meantime, many individual mining stocks could “front-run” the CDNX, advancing to fresh highs ahead of the broader index.

    Looking at the long-term chart of the VanEck Vectors Gold Miners ETF versus gold, mining stocks appear strikingly undervalued—arguably the cheapest sector relative to its underlying asset in modern market history.

    The encouraging part is that this imbalance may be only months away from correcting through the only reset that truly counts: a major revaluation of gold equities relative to gold itself.

    The weekly chart of Lundin Gold is particularly compelling. While most gold producers report all-in sustaining costs (AISC) below $2,000 per ounce—and silver producers around $20—Lundin’s AISC is closer to $1,000, underscoring its strong cost position. Still, even the most efficient miners require periodic technical pauses. The behavior of the key 5 and 15 moving averages highlights these natural consolidation phases.

    Pullbacks across the mining sector—both juniors and seniors—can offer strategic entry points, especially as gold continues to consolidate following its broader fundamental breakout.

    Some investors even speculate that the fiat price of gold could eventually exceed that of Bitcoin, viewing bitcoin primarily as a liquidity vehicle to accumulate more gold. Over time, rising global demand—particularly from China—could further reinforce gold’s long-term appeal.

    Sources: Stewart Thomson

  • WTI holds above $65.00 amid persistent geopolitical tensions.

    • WTI prices could stage a rebound as supply concerns intensify amid escalating US-Iran tensions and stalled Ukraine-Russia negotiations.
    • Talks between Washington and Tehran have yielded little concrete progress, with Iranian officials only اشاره to a broad framework for a potential nuclear agreement, leaving uncertainty over future crude exports.
    • Meanwhile, peace discussions between Ukraine and Russia held in Geneva concluded without a breakthrough, sustaining geopolitical risks that may continue to underpin oil prices.

    West Texas Intermediate (WTI) crude slips slightly on Thursday after plunging 4.9% in the previous session, hovering around $65.00 per barrel during Asian trading. Despite the recent drop, oil prices may find support from potential supply disruptions linked to rising US-Iran tensions and stalled Ukraine-Russia peace efforts.

    Negotiations between Washington and Tehran remain unresolved. Iranian officials have pointed to a “general agreement” on the framework of a possible nuclear deal, but key differences persist. US Vice President JD Vance stated that Iran failed to meet Washington’s red lines, while US President Donald Trump reiterated that military action remains an option. Reports suggest that any potential US strike could develop into a prolonged campaign, with Israel advocating for an outcome aimed at regime change in Iran.

    Meanwhile, peace talks in Geneva between Ukraine and Russia concluded without tangible progress, according to Reuters. Ukrainian President Volodymyr Zelenskiy accused Moscow of stalling US-backed diplomatic efforts to end the four-year conflict. Trump has urged Kyiv to consider a deal that could involve significant concessions, even as Russian forces continue attacking energy infrastructure and making battlefield advances.

    On the trade front, India’s state-run Bharat Petroleum Corporation Limited (BPCL) reportedly made its first-ever purchase of Venezuelan crude, while HPCL Mittal Energy Limited resumed buying cargoes from Venezuela for the first time in two years.

    In US inventory data, the American Petroleum Institute (API) reported a 0.609 million-barrel decline in weekly crude stocks, partially offsetting the previous week’s massive 13.4 million-barrel build — the largest increase since January 2023.

    Sources: Akhtar Faruqui

  • Gold hovers around $5,000 an ounce amid geopolitical tensions, while Fed minutes limit further gains.

    Gold prices were largely steady in Asian trade on Thursday, following a surge of more than 2% in the previous session. Momentum was restrained by thin Lunar New Year holiday liquidity, while investors weighed ongoing geopolitical tensions and mixed signals from the Federal Reserve.

    Spot gold edged down 0.1% to $4,971.55 an ounce as of 20:51 ET (01:51 GMT), while U.S. gold futures fell 0.4% to $4,991.59.

    The precious metal rallied 2.1% on Wednesday, briefly climbing above the $5,000-an-ounce mark and reclaiming most of its earlier weekly losses. However, subdued trading volumes across several major Asian markets amplified short-term volatility.

    Geopolitical uncertainty continued to underpin demand for bullion. Market participants tracked rising friction between the United States and Iran, including concerns over security in the Strait of Hormuz and stalled nuclear negotiations. Limited headway in Russia-Ukraine peace talks also sustained broader risk aversion, supporting safe-haven flows into gold.

    On the policy front, sentiment turned more cautious after minutes from the Federal Reserve’s latest meeting revealed differing views among officials on the interest-rate trajectory. Some policymakers warned that persistently high inflation could warrant further tightening, while others signaled scope for rate cuts later this year.

    Expectations that U.S. rates may stay higher for longer bolstered the dollar and Treasury yields, creating headwinds for non-yielding gold after its sharp rally. The U.S. Dollar Index was flat after climbing 0.6% overnight in response to the Fed minutes.

    Gold typically faces pressure when borrowing costs rise, as higher yields raise the opportunity cost of holding the metal. Investors are now focused on Friday’s U.S. personal consumption expenditures (PCE) price index data — the Fed’s preferred inflation measure — for clearer direction on monetary policy.

    Sources: Ayushman Ojha

  • Gold steadies after sliding about 2% as U.S.– Iran talks show progress; traders weigh implications of upcoming Fed policy.

    Gold prices held steady in Asian trading on Wednesday following a sharp decline in the previous session, as reduced geopolitical tensions and a stronger U.S. dollar curbed safe-haven demand, with investors looking ahead to new signals on the Federal Reserve’s policy direction.

    Spot gold rose 0.1% to $4,884.16 an ounce as of 20:24 ET (01:24 GMT), while U.S. gold futures slipped 0.1% to $4,899.91.

    Trading activity in Asia remained subdued due to Lunar New Year holidays across several key regional markets, keeping price movements limited.

    The precious metal had fallen more than 2% on Tuesday amid improved risk sentiment following indications of progress in U.S.–Iran negotiations. Both sides reportedly reached an understanding on key “guiding principles,” boosting optimism for a diplomatic breakthrough and reducing demand for bullion as a safe-haven asset.

    Gold’s earlier losses were amplified by a firmer dollar, which makes the metal costlier for holders of other currencies, as well as diminishing expectations of imminent U.S. rate cuts. The U.S. Dollar Index rose 0.1% during Asian hours after gaining 0.3% in the previous session.

    Investors remained cautious ahead of the release of minutes from the Federal Reserve’s January meeting, due later in the day, which may provide further clarity on the timing and extent of potential policy easing.

    Attention is also focused on Friday’s U.S. personal consumption expenditures (PCE) price index for December—the Fed’s preferred measure of inflation—which could significantly influence rate expectations.

    Generally, higher interest rates tend to pressure non-yielding assets like gold, while expectations of monetary easing typically lend support to prices.

    Sources: Ayushman Ojha

  • U.S.- Iran discussions loom while Palo Alto Networks prepares to report — market movers

    U.S. stock futures edge lower

    U.S. stock futures drifted near the flatline Tuesday as investors braced for a wave of economic data and corporate earnings in a holiday-shortened week.

    As of 03:04 ET, Dow futures were down 26 points (0.1%), S&P 500 futures slipped 11 points (0.2%), and Nasdaq 100 futures dropped 99 points (0.4%). Wall Street’s main indexes were closed Monday for a public holiday.

    Markets ended Friday mixed, with investors weighing the broader impact of new artificial intelligence models and questioning whether heavy AI infrastructure spending will generate strong returns for mega-cap tech firms. At the same time, cooler-than-expected U.S. consumer price data for January fueled expectations that the Federal Reserve could bring forward its next interest rate cut after pausing its easing cycle last month. The tech-heavy Nasdaq Composite edged down 0.2%, while the S&P 500 and Dow Jones Industrial Average posted gains.

    Crude prices steady ahead of U.S.-Iran negotiations

    In commodities, Brent crude ticked lower ahead of planned talks between the U.S. and Iran in Geneva over Tehran’s nuclear enrichment program. A firmer dollar, ahead of key economic releases and signals from the Fed, also weighed on oil prices. Brent for April delivery fell 0.7% to $68.13 a barrel, while West Texas Intermediate futures rose 0.6% to $63.11, with the move partly influenced by Monday’s U.S. market holiday.

    U.S. and Iranian officials are scheduled to meet in Switzerland on Tuesday amid elevated tensions in the Middle East, as Washington increases its regional military presence. President Donald Trump has repeatedly warned of potential military action if Iran declines a U.S.-backed agreement.

    Trading activity was subdued across Asia due to Lunar New Year holidays in China, Hong Kong, Taiwan, South Korea, and Singapore.

    Gold declines

    Gold prices moved lower Tuesday, with silver also retreating, as traders stayed cautious ahead of a slate of U.S. economic data due this week.

    At 03:09 ET, spot gold fell 1.4% to $4,919.72 an ounce, while April gold futures dropped 2.2% to $4,941.74. Spot silver slid 2.0% to $75.0925 per ounce, whereas platinum edged up 0.2% to $2,024.79.

    Precious metals have been volatile in recent weeks, posting sharp swings and remaining well below their late-January highs.

    Investor focus is shifting to upcoming U.S. economic releases, along with minutes from the January meeting of the Federal Reserve, when policymakers kept interest rates unchanged at 3.5% to 3.75%.

    U.S. industrial production figures are scheduled for release on Wednesday, followed by Friday’s PCE price index report — one of the Fed’s key measures of inflation.

    Palo Alto Networks earnings ahead

    Attention is also turning to results from Palo Alto Networks, due after U.S. markets close Tuesday, which could offer further insight into the outlook for tech firms grappling with rising competition from newly launched AI models.

    The California-based cybersecurity group raised its full-year revenue and profit guidance in November, pointing to strong demand for its digital security solutions amid growing online threats.

    Palo Alto also unveiled a $3.35 billion acquisition of cloud management and monitoring firm Chronosphere, saying it plans to fold the business into its Cortex AgentiX platform. The integration is designed to allow Palo Alto’s AI agents to leverage Chronosphere’s data to identify performance bottlenecks and pinpoint root causes more effectively.

    Together with a separate agreement to acquire identity security specialist CyberArk Software, the Chronosphere transaction is slated to be finalized in the second half of Palo Alto’s fiscal 2026.

    Nikkei extends slide

    Japan’s benchmark Nikkei 225 slipped again, adding to Monday’s losses after data showed the country’s economy grew far less than expected in the fourth quarter.

    Official figures revealed that gross domestic product expanded at an annualized rate of 0.2% in the October–December period — well below forecasts of 1.6%. Still, the reading marked a rebound from the prior quarter, when the world’s fourth-largest economy contracted by 2.6%.

    The weak data highlights the economic hurdles facing Prime Minister Sanae Takaichi following her sweeping election victory earlier this month. While she appears to have secured a mandate to implement stimulus measures aimed at boosting growth, her government must contend with persistent cost-of-living pressures that continue to dampen domestic demand.

    Adding to the complexity is the stance of the Bank of Japan, where policymakers are working to address stubborn inflation and yen weakness. Officials have indicated they intend to continue raising interest rates after years of ultra-loose monetary policy.

  • Silver price outlook: XAG/USD stays above $74.50 as bearish momentum builds.

    Silver is hovering around the $75.00–$77.00 region, struggling to capitalize on the US Dollar’s softness. Despite the weaker greenback, precious metals remain directionless in a subdued start to the week, with thin liquidity as several Asian markets were closed for Lunar New Year and US markets shut for President’s Day.

    XAG/USD is posting modest losses near $77.00, not far from last week’s low around $74.50. Price action has been choppy in recent weeks, but the broader bearish structure from the late-January peak remains intact. Bulls continue to face strong resistance below the key $80.00 psychological barrier, keeping upside attempts contained.

    Technical outlook

    On the 4-hour chart, silver trades beneath a declining 50-period Simple Moving Average (SMA), reinforcing the near-term bearish bias. The MACD histogram remains in negative territory, while the RSI stands near 43 — consistent with neutral-to-bearish momentum.

    Initial support lies around $74.40, near last week’s trough, followed by the February 6 low near $64.00. On the upside, immediate resistance is seen at the 50-period SMA around $80.00. A break above that could expose the upper boundary of last week’s range near $86.30, with stronger resistance ahead at the February 4 peak above $92.00.

    Overall, silver maintains a cautious, slightly bearish tone unless buyers reclaim the $80.00 level with convincing momentum.

    Sources: Guillermo Alcala

  • Silver Technical Outlook: Could the Rio Rally Break Out Above 80.24?

    Silver futures remain confined within a clearly defined mean-reversion framework, anchored around the VC PMI equilibrium in the 76–77 range. This period of consolidation signals a transitional stage after the post–Chinese New Year liquidity reset and is laying the groundwork for the expected Rio Rally phase in the precious metals market.

    From a seasonal standpoint, the Chinese New Year period typically brings short-term volatility and reduced institutional participation. As the holiday ends and Asian markets resume full operations, liquidity and physical demand tend to rebound. This shift often signals the onset of the Rio Rally — a cyclical upswing that usually begins in late February or early March and can persist through the remainder of the year. The current corrective setup aligns with this historical tendency of accumulation preceding expansion.

    Time-cycle analysis highlights several high-probability inflection periods. The first key decision window falls between February 15–18, when price action is expected to define near-term direction around the VC PMI equilibrium. Sustained acceptance above the mean would indicate accumulation and bullish continuation, while rejection below it would open the door to a deeper corrective move toward support levels.

    The second cycle window, February 20–24, serves as a confirmation phase. When prices remain above the weekly mean around 79.28 during this period, the market often extends toward the Weekly Sell-1 and Sell-2 objectives at 84.80 and 91.65. Historically, this window has signaled the ignition stage of the Rio Rally, as institutional capital returns following the post-holiday liquidity reset.

    A third and broader expansion window unfolds between February 26 and March 5, coinciding with the March futures delivery cycle. This timeframe carries the strongest probability for a breakout and sustained directional move. A decisive close above 80.24 during this phase would trigger upside expansion toward 82.51, 84.80, and potentially 91.65 as momentum builds.

    Within the VC PMI framework, support at 74.72 (Daily Buy-1) and 72.43 (Weekly Buy-1) marks high-probability accumulation zones if retested. These levels align with Square-of-9 geometric support angles and outline the final corrective range before a broader advance. On the upside, resistance at 80.24 and 82.51 corresponds with descending Square-of-9 angles and functions as breakout thresholds.

    As the market moves beyond the Chinese New Year cycle and into the Rio Rally window, silver is approaching a pivotal time-cycle juncture. Sustained trade above the VC PMI equilibrium and a breakout through 80.24 would validate the start of the Rio Rally expansion phase into March and potentially beyond.

    Sources: Patrick MontesDeOca

  • In Focus: USD/CAD, EUR/USD, GBP/USD, USD/MXN, Silver, Gold, USD/CHF, and USD/JPY

    USD/CAD

    The US dollar initially weakened against the Canadian dollar earlier in the week, slipping toward the 1.35 level before rebounding and showing renewed strength. This recovery is shaping a potential weekly hammer pattern. A break above the 1.3750 level could pave the way for further gains toward 1.40. Overall, the pair is likely to remain range-bound, continuing to trade within the broad sideways band that has held for more than a year.

    EUR/USD

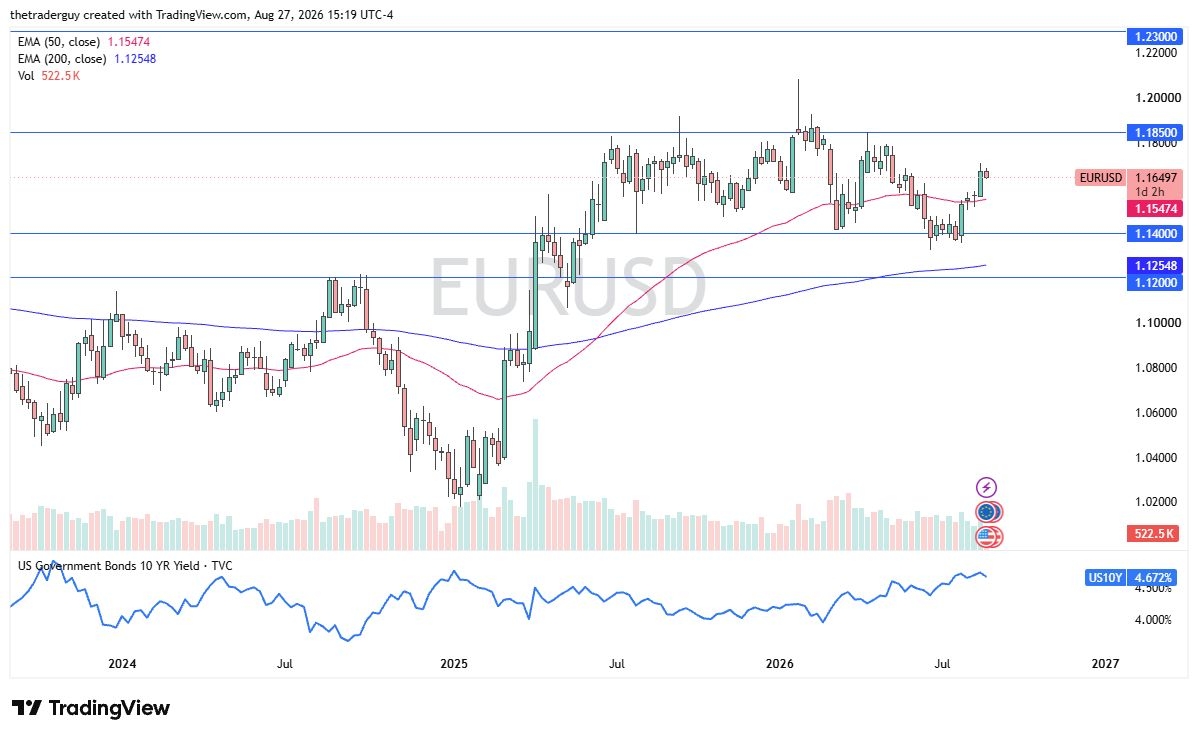
    The euro climbed at the start of the week but now appears to be losing momentum, struggling to hold on to its gains. Traders are likely assessing whether the broader uptrend can be sustained. With the US dollar having been oversold against several currencies, the euro often serves as a key gauge for the greenback’s next move. Even if the pair breaks higher, the measured move from the prior consolidation range indicates that the upside may be limited to around 1.23.

    GBP/USD

    The British pound advanced early in the week but later surrendered roughly half of those gains amid continued choppy trading. The 1.3750 level remains a key area to monitor, as a decisive break above it could clear the path toward 1.39. On the downside, a pullback would likely find support around 1.35, followed by 1.33 if selling pressure intensifies. Overall, the US dollar appears to be regaining some strength.

    USD/MXN

    The US dollar has weakened further against the Mexican peso, with the pair appearing to drift toward the 17.00 level. A decisive break below that mark could open the door to a move toward 16.50. On the upside, any rebound is likely to face significant resistance around 17.50. That said, the pair may ultimately settle into a consolidation phase, similar to the range observed at this level in late 2023.

    Silver

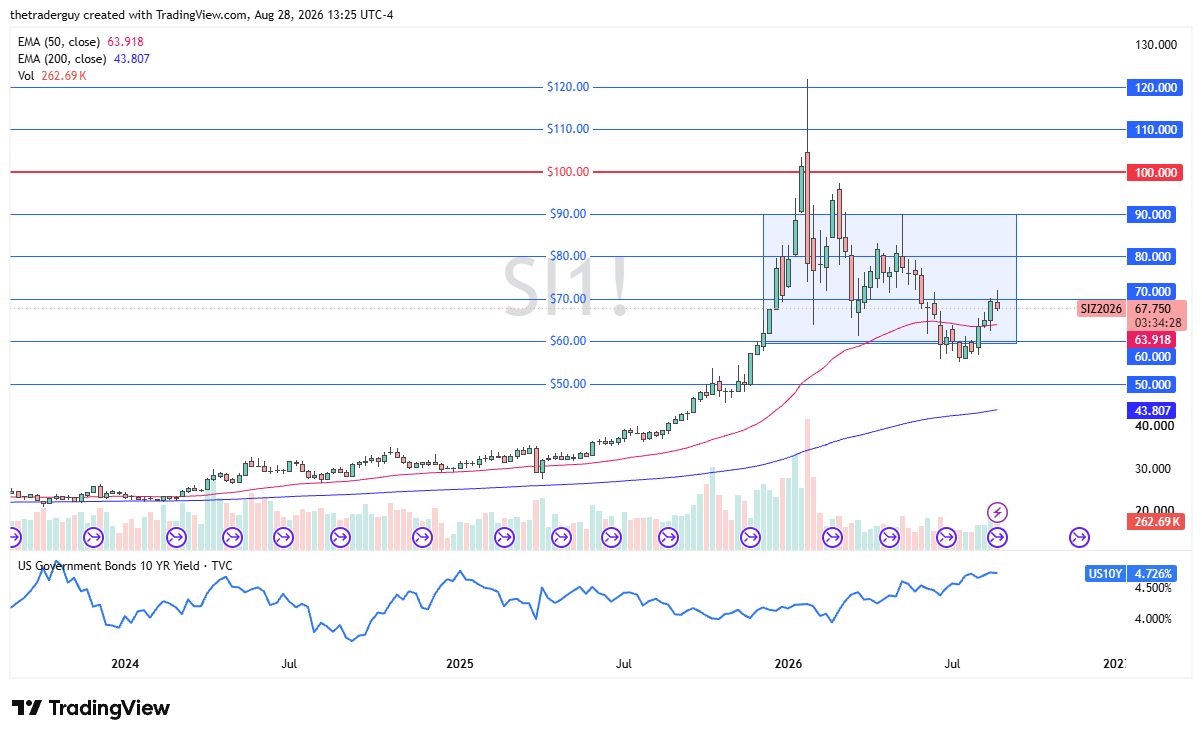
    Silver remains highly erratic, with the week producing a volatile yet ultimately neutral candlestick. The $80 level appears to act as a pivot point and a magnet for price action. Strong support is seen near $70, while $90 stands out as a key resistance zone. Overall, the market is likely to continue exhibiting choppy and unpredictable movements.

    Gold

    Gold also moved in a back-and-forth manner throughout the week, with the $5,000 level emerging as a potential price magnet. A sustained break above $5,000 could signal the start of a stronger upward move. However, recent candlestick patterns tell a mixed story: a prominent Shooting Star formed a couple of weeks ago, followed by a hammer, suggesting ongoing uncertainty and likely consolidation. Still, the longer price holds near the $5,000 mark, the more it may indicate underlying bullish strength.

    USD/CHF

    The US dollar has declined against the Swiss franc, though the 0.76 level appears to be providing solid support. If the pair rebounds from this area, it could move toward the 0.79 level, which stands out as significant resistance. Overall, the market remains sensitive to potential action from the Swiss National Bank, and the risk of intervention if the franc strengthens too much makes taking short positions less appealing at this stage.

    USD/JPY

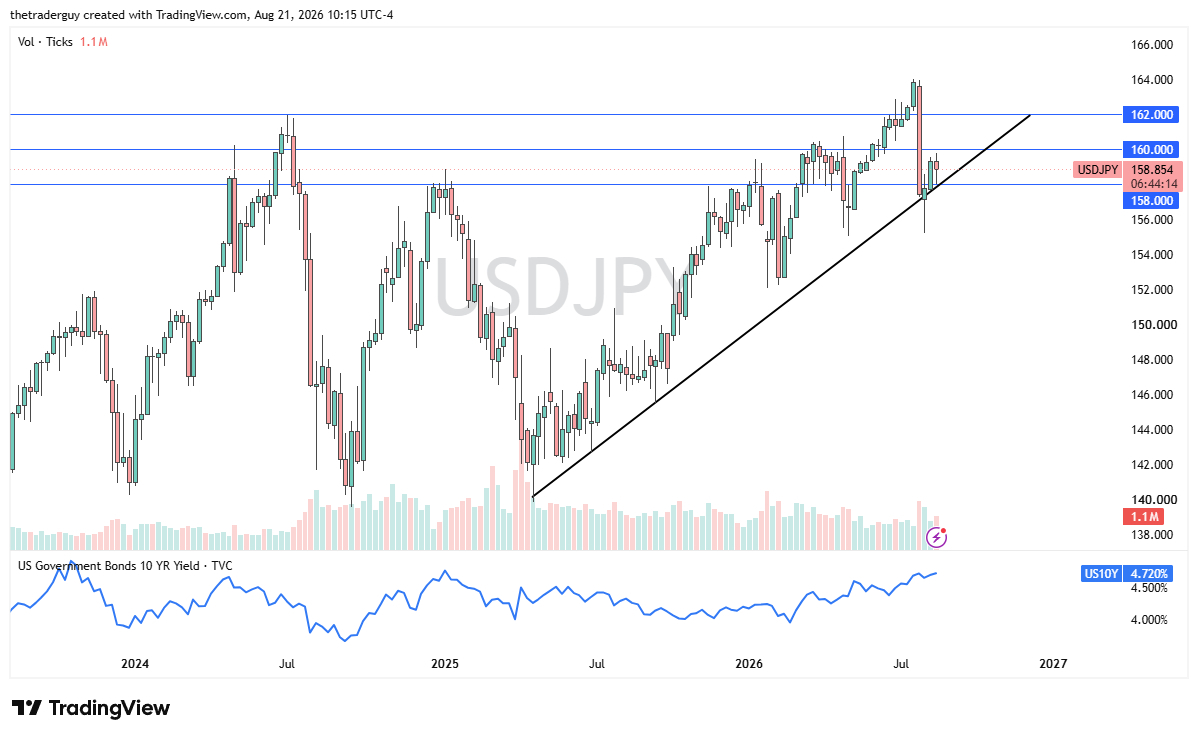
    The US dollar dropped sharply against the Japanese yen over the week and is now testing its 50-week EMA. A rebound from this area could see the pair target ¥156, with ¥158 as the next potential objective. On the longer-term charts, the ¥160 level—where price pulled back a few weeks ago—remains a significant resistance zone dating back to 1990.

    Although this week’s candlestick appears bearish, there are likely plenty of buyers waiting below. It may simply be a matter of allowing the market to stabilize before considering fresh long positions. For now, it’s a pair worth monitoring closely, but staying on the sidelines seems prudent.

    Sources: Christopher Lewis

  • Oil prices remain stable while attention centers on US-Iran geopolitical risks.

    Oil prices moved sideways in Asian trading on Monday, as attention centered on renewed diplomatic engagement between the U.S. and Iran, with investors wary of possible supply disruptions in the Middle East.

    Trading activity remained subdued due to public holidays in China and the U.S., while weak Japanese growth figures added to worries about slowing demand. Brent crude for April delivery slipped 0.2% to $67.65 per barrel by 21:15 ET (02:15 GMT).

    U.S.– Iran nuclear talks to resume

    The U.S. and Iran are set to hold a second round of discussions in Switzerland this week regarding Tehran’s nuclear program, following the restart of negotiations earlier in February. However, diplomatic efforts coincided with Washington deploying a second aircraft carrier to the Middle East and signaling readiness for extended military action should talks collapse.

    President Donald Trump reiterated warnings that Iran must agree to a deal or risk further military measures. Over the weekend, Iranian officials indicated a willingness to make concessions on their nuclear activities in exchange for relief from tough U.S. sanctions, adding that the next move rests with Washington.

    Tensions between the two countries have recently supported oil prices, as traders factored in a higher geopolitical risk premium amid fears of renewed conflict that could disrupt Iranian oil output.

    OPEC+ considering renewed output increases

    At the same time, some of oil’s geopolitical premium was tempered by a Reuters report suggesting that OPEC+ intends to restart production hikes from April. Higher output would enable member countries to capitalize on recent price gains, though increased supply could weigh on prices over the longer term.

    The group is scheduled to meet on March 1.

    Oil markets were pressured throughout 2025 by concerns of excess supply in 2026. Although OPEC+ gradually raised production last year, it paused further increases in December due to persistent oversupply worries.

    Nonetheless, crude prices climbed to a six-month high in early 2026 amid escalating Middle East tensions, while signs of global economic resilience fueled expectations that demand would stay firm.

    Sources: Ambar Warrick

  • Gold holds intraday losses as Fed cut bets pressure USD.

    Gold starts the week under pressure, weighed down by a slight rebound in the US Dollar and improved market sentiment. Even so, ongoing geopolitical tensions—particularly ahead of the upcoming US-Iran talks—could offer support to the safe-haven metal. At the same time, expectations that the Federal Reserve will deliver additional rate cuts may restrain the Dollar and help cushion gold’s downside.

    During early European trading on Monday, Gold (XAU/USD) stays subdued but has bounced off its intraday low to hover near the key $5,000 psychological level. A mix of supportive factors suggests caution for traders considering aggressive short positions or anticipating a deeper decline.

    A modest uptick in the USD, coupled with a broadly upbeat risk mood, is putting mild pressure on bullion. However, geopolitical risks remain elevated ahead of the second round of US-Iran nuclear negotiations. The US has deployed another aircraft carrier to the region and signaled readiness for a prolonged military response if talks collapse. In turn, Iran’s Revolutionary Guards have warned of retaliation against US bases in the event of strikes. These tensions could underpin gold prices.

    Meanwhile, strong and sustained USD gains appear limited due to dovish Fed expectations, which tend to favor the non-yielding precious metal. Although last week’s robust Nonfarm Payrolls report initially supported the Dollar, softer US inflation data released Friday revived bets that the Fed could begin cutting rates as soon as June. Headline CPI rose 0.2% and core CPI increased 0.3% in the latest reading, reinforcing expectations of further policy easing and potentially limiting gold’s losses.

    Additionally, lighter trading conditions due to the US Presidents Day holiday may discourage traders from taking bold directional positions in XAU/USD. Upcoming remarks from Fed officials could influence both the Dollar and gold, but attention will center on Wednesday’s FOMC meeting minutes for clearer signals on the rate-cut outlook. Later in the week, global flash PMI data on Friday may provide fresh trading opportunities.

    XAU/USD 1-hour chart

    Gold is rejected at the 100-hour SMA resistance.

    XAU/USD’s failure to sustain gains above the 100-period Simple Moving Average (SMA) from Friday’s rally continues to favor the bears. The pair remains below this downward-sloping indicator near $5,028.40, which is limiting upside attempts and maintaining a negative intraday outlook. Meanwhile, the MACD has slipped beneath its signal line into negative territory, with an expanding bearish histogram highlighting growing downside momentum. The RSI sits at 45, in neutral territory but trending lower, in line with the softer bias.

    As long as XAU/USD trades below the falling 100-period SMA, pressure is likely to persist, with the negative MACD setup pointing to ongoing seller dominance. A stronger recovery would require the MACD to cross back above its signal line and the RSI to move above 50, a shift that would reduce bearish pressure and open the door for a corrective rebound.

    Sources: Haresh Menghani

  • Weekly outlook: US Dollar steadies near 96.80 before PCE data and Fed remarks.

    The US Dollar (USD) posted notable weekly losses, briefly rebounding after stronger-than-expected US jobs data showed 130K new positions added in January and the Unemployment Rate dipping to 4.3% from 4.4%. However, softer January CPI figures pressured the currency.

    The US Dollar Index (DXY) slipped to around 96.80 from 97.15 highs as weak inflation data boosted expectations of a Federal Reserve rate cut later this year. Attention now turns to Friday’s release of the December Personal Consumption Expenditures (PCE) report, the Fed’s preferred inflation measure.

    EUR/USD hovers around 1.1880, erasing earlier losses after Eurozone flash Q4 GDP came in at 1.4% YoY, above the 1.3% forecast. Focus next week includes the Eurogroup Meeting and December Industrial Production on Monday, followed by the EcoFin Meeting and February Eurozone and German ZEW Surveys on Tuesday.

    AUD/USD trades near 0.7080, close to a three-year peak, supported by the hawkish stance of the Reserve Bank of Australia. Upcoming data include NAB Business Confidence and the Wage Price Index on Wednesday, then Australian jobs figures and the February flash S&P Global Composite PMI on Thursday.

    USD/CAD sits near 1.3600, recovering nearly half of its weekly losses after US inflation data. Markets will watch Canada’s December Retail Sales on Friday.

    USD/JPY trades around 152.80 following a sharp sell-off triggered by the election victory of Sanae Takaichi, which raised fiscal policy concerns. Japan’s National CPI is due on Thursday.

    GBP/USD holds near 1.3650, with UK Producer Price Index and Retail Price Index data due Wednesday, and Retail Sales scheduled for Friday.

    Gold trades around $5,038, rebounding from Thursday’s drop but still below January’s record high of $5,598, as easing geopolitical tensions push investors toward riskier assets.

    Looking ahead to the economic outlook: Key voices take center stage.

    Saturday, February 14

    • Christine Lagarde (ECB President)

    Sunday, February 15

    • Christine Lagarde (ECB President)

    Monday, February 16

    • Michelle Bowman (Fed)
    • Joachim Nagel (ECB)

    Tuesday, February 17

    • José Luis Escrivá (ECB)
    • Michael Barr (Fed)
    • Mary Daly (Fed)

    Wednesday, February 18

    • Piero Cipollone (ECB)
    • Isabel Schnabel (ECB)
    • Michelle Bowman (Fed)

    Thursday, February 19

    • Piero Cipollone (ECB)
    • Luis de Guindos (ECB)
    • Raphael Bostic (Fed)
    • Michelle Bowman (Fed)
    • Neel Kashkari (Fed)
    • Christian Hawkesby (rbnz official)

    Friday, February 20

    • Christine Lagarde (ECB President)
    • Raphael Bostic (Fed)

    Central bank meetings and upcoming economic data releases are set to guide the next moves in monetary policy.

    Sunday, February 15

    • Japan flash Q4 GDP

    Tuesday, February 17

    • Reserve Bank of Australia (RBA) Meeting Minutes
    • Germany January Harmonized Index of Consumer Prices (HICP)
    • UK January Claimant Count Change
    • UK December Employment Change
    • UK December ILO Unemployment Rate
    • Canada January CPI

    Wednesday, February 18

    • Reserve Bank of New Zealand (RBNZ) Interest Rate Decision
    • UK January CPI
    • Federal Open Market Committee (FOMC) Minutes

    Thursday, February 19

    • Australia January Employment Change
    • Australia Unemployment Rate

    Friday, February 20

    • UK January Retail Sales
    • Germany February flash HCOB Composite PMIs
    • Eurozone PMIs
    • UK flash February S&P Global PMIs
    • US December Core Personal Consumption Expenditures (PCE)
    • US February S&P Global PMIs

    Sources: Agustin Wazne

  • Silver’s Recent Plunge Mirrors the Post-1980 Bubble Collapse

    After surging in a classic speculative frenzy, silver went parabolic before collapsing in dramatic fashion. In recent weeks it has suffered some of its largest daily losses on record, echoing past episodes when extreme tops unraveled into violent crashes. Historically, such vertical “moonshots” have been followed by swift, symmetrical selloffs that wipe out a large share of prior gains—suggesting the current downturn may not yet be finished.

    Silver has long attracted an intensely bullish following, especially during explosive rallies. But like all markets, its powerful upside extremes inevitably give way to sharp reversals. In mid-January, warnings emerged that silver had reached dangerously overbought levels not seen since the aftermath of the early 1980 bubble. Back then, prices plunged more than 75% within months and failed to sustainably exceed that peak for decades—underscoring the risks of vertical blow-offs.

    From late October to late January, silver soared an extraordinary 149% in just over three months, logging numerous record closes. By some technical measures—such as its distance above the 200-day moving average—it reached historically rare territory, ranking among the most overbought readings in more than half a century. Comparable extremes were last seen in January 1980, during the infamous silver bubble.

    Although silver often magnifies gold’s moves and has delivered strong long-term gains since the modern precious metals era began in 1971, its volatility cuts both ways. The same momentum and herd enthusiasm that fuel breathtaking advances tend to necessitate equally forceful corrections. This latest crash, following a surge to bubble-like extremes, has once again demonstrated just how unforgiving those reversals can be.

    On January 30, silver plunged an extraordinary 27.5% in a single session—qualifying as a true crash by stock-market standards and marking its second-worst daily drop since 1971, just behind a 30.8% collapse in March 1980. The trigger was a sharp 10.3% fall in gold, driven largely by heavy Chinese selling, with silver amplifying that move roughly 2.7 times—consistent with its historical tendency to magnify gold’s swings. More steep losses followed, including another 16% plunge, creating a rare cluster of crash-grade declines reminiscent of the aftermath of the 1980 bubble.

    While today’s rally into January 2026 was extreme—silver soared 149% in just over three months and reached one of the most overbought readings in more than five decades—it still fell short of the blow-off top seen in 1980. Back then, silver ultimately cratered nearly 77% in just over two months. Although a repeat of that magnitude appears unlikely, the recent 36.9% drop in only six trading days may not be sufficient to fully unwind the speculative excess. Simply returning to pre-mania levels would require far deeper losses.

    Historical precedent suggests silver’s largest crash days rarely mark final bottoms. Except for a brief climax in March 1980, most 10%+ down days since 1971 have occurred early or mid-way through major selloffs, not at their end. Episodes in 2006, 2008, 2011, 2013, and 2020 all saw further grinding declines after dramatic crash sessions. Sharp bounces often follow panic selling, but sustained weakness is typically needed to shift herd psychology from greed to fear.

    In speculative manias, fundamentals play little role in driving parabolic advances or subsequent collapses. Supply and demand rarely change fast enough to justify such extremes; sentiment and momentum dominate. Arguments about structural demand—such as AI-related usage—cannot rationalize silver doubling in a few months. That surge was largely fueled by speculative fervor, especially heavy Chinese buying, which has now reversed.

    The broader lesson is that silver’s recent crash likely marks the early stages of a deeper rebalancing rather than its conclusion. After reaching near half-century overbought extremes, a proportionally large and sustained correction may be required to normalize sentiment. Historically, silver has tended to grind considerably lower after initial crash days, suggesting this reckoning may still have further to run.

    Sources: Adam Hamilton

  • Stronger Dollar Caps Gold’s Rally Near $5,000 Ahead of CPI Report

    Gold drew renewed buying interest after sliding to a weekly low in the previous session. Expectations that the Federal Reserve may adopt a more dovish stance continue to weigh on the US Dollar, offering support to the precious metal. Market participants are now awaiting the latest US consumer inflation data for fresh direction.

    Gold (XAU/USD) has pulled back from near the $5,000 psychological level but maintains modest intraday gains heading into Friday’s European trading session. Investors are focused on the upcoming US CPI release, which is expected to provide clearer signals on the Fed’s future policy path. The outcome will likely influence short-term US Dollar dynamics and generate meaningful momentum for the non-yielding metal.

    Earlier in the week, a stronger-than-expected US Nonfarm Payrolls report prompted traders to trim expectations for a March rate cut, helping the US Dollar Index (DXY) rebound from a two-week low and contributing to Gold’s pullback. Even so, markets continue to anticipate that the Fed could still deliver two rate cuts in 2026. Meanwhile, softer US Jobless Claims data has limited the Dollar’s upside.

    According to the US Department of Labor, initial jobless claims declined to 227K for the week ending February 7, above the 222K forecast but below the previous week’s revised 232K. Continuing Claims rose to 1.862 million for the week ending January 31, underscoring ongoing labor market softness seen over the past year. This underlying weakness provides support for Gold while tempering the Dollar’s strength.

    Additionally, a deterioration in global risk sentiment, reflected in broadly weaker equity markets, has boosted demand for safe-haven assets like Gold. However, it remains uncertain whether XAU/USD can extend its gains, as traders may prefer to stay cautious until the key US CPI report is released before initiating fresh positions.

    XAU/USD 1-hour chart

    Gold’s Mixed Technical Signals Call for Caution

    Gold’s technical picture remains conflicted, suggesting aggressive traders should proceed carefully. The overnight break below the weekly trading range initially appeared to give bears the upper hand. However, the absence of sustained follow-through selling and the metal’s resilience beneath the $4,900 level argue against firmly committing to a bearish outlook.

    On the momentum front, the MACD has crossed above its Signal line near the zero mark, with the histogram turning positive—an indication that bullish momentum may be gradually building. This shift hints at a possible near-term recovery in price action.

    At the same time, the RSI has rebounded from oversold territory and currently sits at 44.72, a neutral reading. While this supports a tentative intraday bounce, the RSI remaining below the 50 threshold suggests that upside attempts could face resistance.

    Should the MACD slip back below the Signal line and fall under zero, bearish pressure would likely re-emerge, potentially extending the current consolidation phase. For now, momentum leans modestly supportive as long as the MACD holds above zero and the positive histogram continues to expand. Conversely, a narrowing histogram would signal waning momentum and caution against overconfidence in further gains.

    Sources: Haresh Menghani

  • Oil prices remain under pressure amid supply glut outlook; U.S. CPI data in focus.

    Oil prices were mostly stable in Asian trading on Friday but remained on course for a weekly loss after plunging nearly 3% in the prior session, as expectations of a substantial supply surplus and rising inventories pressured sentiment. By 21:07 ET (02:07 GMT), Brent crude for April delivery was up 0.1% at $67.56 a barrel, while WTI crude also edged 0.1% higher to $62.87. Both benchmarks had dropped close to 3% previously, leaving them down about 1% for the week.

    IEA projects oil supply surplus and weaker demand growth outlook.

    The International Energy Agency, in its latest monthly report, projected that the global oil market could see a surplus exceeding 3.7 million barrels per day in 2026, pointing to a pronounced supply overhang.

    It also noted that global stockpiles grew last year at one of the fastest paces since the pandemic, reflecting comfortable supply levels. The agency lowered its forecast for global demand growth, citing a softer economic outlook and moderating consumption, even as non-OPEC production stays strong. This combination of weaker demand and resilient output has intensified concerns about prolonged oversupply.

    In the U.S., the Energy Information Administration reported an 8.53 million-barrel increase in crude inventories this week—well above expectations and the largest build since January 2025—indicating sluggish refinery demand and abundant supply.

    U.S.- Iran nuclear talks under scrutiny; U.S. CPI data awaited.

    Meanwhile, investors monitored geopolitical developments after Donald Trump said negotiations over a potential U.S.-Iran nuclear deal could last up to a month.

    The possibility of extended talks eased immediate fears of supply disruptions in the Middle East, reducing the geopolitical premium that had previously supported prices. Attention is also turning to U.S. CPI data due later Friday, which may provide further insight into the Federal Reserve’s rate outlook after strong January employment figures dampened hopes for near-term rate cuts.

    Sources:

  • Gold steadied below $5,000/oz as rate uncertainty lingered, with CPI data in focus.

    Gold held steady in early Asian trading on Friday after slipping below key technical levels amid growing uncertainty about the outlook for U.S. interest rates, with investors now awaiting upcoming inflation data for clearer direction.

    Silver also stabilized after shedding roughly 10% in the previous session, though metals remained vulnerable following a sharp selloff earlier in the month.

    Persistent doubts about the timing of future U.S. rate cuts continued to pressure precious metals, particularly after January data signaled resilience in the labor market. The U.S. dollar rebounded from weekly lows following Wednesday’s stronger-than-expected nonfarm payrolls report.

    Spot gold edged down 0.1% to $4,915.40 an ounce by 18:31 ET (23:31 GMT), while April gold futures slipped 0.1% to $4,937.60 per ounce. In the prior session, spot prices had dropped more than 3%.

    Spot silver was little changed at $75.060 per ounce, while platinum recovered to trade back above $2,000 per ounce after steep losses a day earlier.

    Thursday’s decline effectively wiped out most of this week’s gains for gold and other precious metals, putting the yellow metal on track for a third consecutive weekly loss.

    Markets have struggled to find direction since a late-January flash crash, with interest rate uncertainty remaining a central headwind. Gold’s retreat from recent record highs was initially sparked by U.S. President Donald Trump’s nomination of Kevin Warsh as the next Federal Reserve Chair, a choice seen as less dovish.

    The robust January jobs report reinforced expectations of fewer rate cuts ahead, while sharp price volatility has also weakened metals’ appeal as safe-haven assets.

    Attention now turns to the January U.S. consumer price index data due later Friday, which could offer further insight into the trajectory of the world’s largest economy. Inflation and labor market conditions remain the Federal Reserve’s primary factors in setting monetary policy.

    Sources: Ambar Warrick

  • Forex Today: Strong US employment figures help the USD regain stability

    The US Dollar (USD) remains firm against major peers in the latter part of the week, supported by stronger-than-expected January labor market data. On Thursday, market participants will focus on weekly Initial Jobless Claims and January Existing Home Sales figures from the US economic calendar.

    According to data released Wednesday by the US Bureau of Labor Statistics, Nonfarm Payrolls increased by 130,000 in January, following December’s upwardly revised gain of 48,000 (from 50,000) and surpassing market forecasts of 70,000. The report also showed the Unemployment Rate easing to 4.3% from 4.4%, while the Labor Force Participation Rate edged up to 62.5% from 62.4%. In response, the USD Index strengthened, climbing toward the 97.30 area. Early Thursday, the index enters a consolidation phase, moving sideways near 97. Meanwhile, US equity futures advance between 0.2% and 0.3%, reflecting an improved risk appetite.

    In the UK, data released Thursday indicated that the economy expanded by 0.1% quarter-over-quarter in the three months to December 2025, matching Q3 growth. On an annual basis, GDP rose 1.0% in Q4, below the expected 1.2% and down from the prior quarter’s revised 1.2% (previously 1.3%). Additionally, December Industrial Production and Manufacturing Output declined by 0.9% and 0.5% month-over-month, respectively, both falling short of forecasts. GBP/USD showed little immediate reaction, trading flat near 1.3630.

    EUR/USD trades sideways around 1.1870 after ending Wednesday in negative territory. Several European Central Bank (ECB) officials are scheduled to speak later in the day.

    USD/JPY continued its weekly decline despite overall USD strength, marking its third consecutive daily loss on Wednesday. The pair extends its drop early Thursday, trading at a two-week low below 153.00.

    In Australia, RBA Assistant Governor Sarah Hunter stated Thursday that she expects labor market conditions to remain tight and inflation to stay above target for an extended period. She added that capacity constraints in the economy and labor market will be closely monitored. AUD/USD surged over 0.7% on Wednesday, reaching a fresh three-year high near 0.7150. Although the pair is correcting lower on Thursday, it remains comfortably above 0.7100 in European trading.

    Gold struggles to build further upside momentum but holds above the $5,000 level after posting moderate gains the previous session.

    Sources: Eren Sengezer

  • Brent crude rises as geopolitical tensions support oil prices – Deutsche Bank

    Deutsche Bank analysts highlight that Brent crude has continued to climb as investors respond to escalating geopolitical tensions involving Iran, along with new remarks from President Trump following his meeting with Israel’s Prime Minister.

    According to the bank, speculation over a possible US military strike on Iran, combined with ongoing diplomatic talks, is helping to underpin oil prices, pushing both Brent and WTI higher.

    Iran-related risk premium lifts Brent

    Regarding recent developments, President Trump met Israeli Prime Minister Netanyahu at the White House yesterday, stating that he had “urged that negotiations with Iran proceed to determine whether a deal can ultimately be reached.”

    He later wrote on social media that “Previously, Iran chose not to make a deal and faced Midnight Hammer — which did not turn out well for them. Hopefully, this time they act more reasonably and responsibly.”

    By the end of the session, Brent crude had risen 0.87% to $69.40 per barrel, and it gained a further 0.25% this morning to reach $69.57 per barrel.

    Sources: Fxstreet

  • Gold and silver prices edged lower after robust payroll data reduced expectations for interest rate cuts.

    Gold and silver prices declined during Asian trading on Thursday after stronger-than-expected U.S. payrolls data dampened expectations for deeper Federal Reserve rate cuts, though losses were cushioned by ongoing safe-haven demand.

    Precious metals largely held onto this week’s gains, supported by continued dollar weakness and elevated tensions between the U.S. and Iran, which kept demand for safe assets intact.

    Spot gold dropped 0.7% to $5,051.26 per ounce, while April gold futures slipped 0.5% to $5,072.04/oz as of 01:36 ET (06:36 GMT). Spot silver fell 1.3% to $83.2505/oz, and platinum declined 1.6% to $2,107.30/oz.

    Gold pressured as dollar rebounds on solid payrolls data

    Gold came under pressure after January’s U.S. nonfarm payrolls report, released Wednesday, exceeded expectations. The stronger labor market reading reduced bets that slowing employment would prompt additional rate cuts from the Fed.

    According to CME FedWatch, markets are now assigning a 94.1% probability that the Fed will keep rates unchanged in March, and a 78% chance of no change in April.

    The upbeat data also triggered a rebound in the U.S. dollar overnight, weighing on metal prices. However, the dollar stabilized in Asian trade and remains slightly lower for the week, partly due to strength in the Japanese yen.

    OCBC analysts noted that a sustained dollar recovery would require further evidence of resilience in the U.S. economy — a scenario that could still offer some support to gold.

    “Structural headwinds — including uncertainty around Fed leadership succession and broader U.S. policy risks — suggest the dollar will need additional upside data surprises to maintain any rebound,” OCBC analysts said.

    Even so, precious metals remained volatile after sharp swings over the past week amid heightened uncertainty surrounding U.S. monetary policy.

    U.S. inflation data and Iran tensions in focus

    Investors are awaiting further signals on the U.S. economy, particularly January consumer price index data due Friday. Inflation and labor market conditions remain the Fed’s primary considerations for rate decisions. Weekly jobless claims figures are also scheduled for release later Thursday.

    Safe-haven demand continued to lend support to metals amid ongoing U.S.–Iran tensions. Although both sides reported some progress in nuclear talks over the weekend, Washington was reportedly preparing to send a second aircraft carrier to the Middle East.

    President Donald Trump also urged Tehran to accept a deal with Washington and met Israeli President Benjamin Netanyahu on Wednesday, underscoring persistent geopolitical risks.

    Sources: Ambar Warrick

  • Gold appears poised to climb further as growing fiat currency risks and geopolitical tensions intensify.

    The author argues that fiat currency is increasingly unstable due to excessive government debt and geopolitical tensions, while gold represents enduring monetary strength. Historically, there have been only four major rallies in fiat currencies over the past 50 years, each weaker than the last, suggesting a long-term decline in confidence.

    Concerns are growing as the U.S. continues expanding debt while using its currency as a geopolitical tool, prompting individuals and institutions to shift toward gold. Although some investors missed earlier buying opportunities around $4,400, the current ascending triangle pattern on gold’s chart suggests further upside potential, with a projected target near $5,900.

    U.S. stock valuations are extremely elevated, while government deficit spending relative to GDP is already at levels typically seen during severe crises. If deficits remain this high during strong markets and under an administration that claims fiscal discipline, the concern is that a future crisis—combined with less restraint—could drive the deficit-to-GDP ratio even higher.

    In short, individuals should prepare not only for a potential U.S. recession but possibly a stagflationary downturn, with the suggested strategy being to strengthen personal savings through holdings in gold and silver.

    On the geopolitical front, rising tensions are viewed as supportive for gold. One concern is the idea of pressuring Taiwan to shift advanced semiconductor production to the U.S., potentially through heavy tariffs on Taiwanese-made chips. Such actions could increase inflation and strain U.S.–Taiwan relations, possibly reshaping regional dynamics with China. Overall, the situation appears increasingly unstable—conditions that historically tend to benefit gold as a safe-haven asset.

    In Cuba, worsening economic conditions—such as public transportation disruptions—reflect deeper structural problems, with little sign of meaningful reform. If instability escalates, it could increase global uncertainty, a backdrop that typically supports higher gold prices.

    The US government’s disturbing plot to elevate election denier, admirer of torture, and destroyer of civic life Delcy Rodríguez has already taken another troubling turn. This nightmare is just one of many geopolitical mechanisms propping up gold interests.
    Could it get even more absurd? In theory, yes — if María Corina Machado were arrested next. Would President Trump then flaunt a Nobel Prize she once held to his followers obsessed with fiat currency and oil, while she languished in prison under Rodríguez’s brutal treatment?

    In such a scenario, Venezuela could spiral into civil war, with chaos on a scale that might rival what we’re seeing in Iran.

    So, do you have any gold?

    What about silver? Silver also looks very strong. A glance at the chart highlights the 14,7,7 Stochastics oscillator at the bottom.

    It has moved into the buy zone — only the third time this has happened since August. A rally back toward the $122 highs appears entirely achievable.

    Silver reached solid support near $70 just as gold touched $4,400. I encouraged investors to anchor their purchases to gold’s powerful technical performance. Those who stepped in at that point are being rewarded, with silver already climbing back above $80 this morning — and the opportunity may still not be gone for those considering entry.

    And the miners? Take a look at the daily CDNX “Jump in the Pool” chart. The Stochastics indicator is signaling strong momentum, and even if prices retreat toward support around 825, that would likely present another attractive buying opportunity.

    The long-term chart looks remarkable. A massive inverse head-and-shoulders pattern appears to be forming. Notice the blue circle on the left side of the chart — a pause around the neckline area now would simply enhance the symmetry between the right and left sides. For enthusiastic junior mining stock investors, the outlook suggests the potential for years of rising prices ahead.

    What about the senior miners — are they worth buying as well? Looking at the long-term GDX versus gold chart, a large inverse head-and-shoulders pattern is taking shape. The formation closely mirrors what’s developing on the CDNX versus fiat chart.

    A glance at the daily chart suggests there may be some consolidation over the next couple of weeks. However, Stochastics has returned to levels last seen in November. Considering the alarming deficit-to-GDP dynamics, ongoing geopolitical turmoil, and the shifting global power landscape, I’d argue that senior gold stock investors worldwide should be ready to step up and take action.

    Sources: Stewart Thomson

  • Gold, silver climb on soft U.S. data; payrolls awaited.

    Gold and silver edged higher in early Asian trading Wednesday after weak U.S. retail sales fueled expectations of a slowing economy, with investors awaiting payrolls data for clearer direction.

    Despite the gains, precious metals remained volatile after retreating from record highs in late January, and have struggled to rebound. A softer dollar and weak U.S. data provided only modest support, while Middle East tensions sustained some safe-haven demand.

    Spot gold rose 0.3% to $5,038.21 an ounce and April futures gained 0.6% to $5,061.45, still roughly $600 below recent peaks. Spot silver climbed 0.9% to $81.5135, and platinum added 0.9% to $2,105.86.

    Metals rise following weak U.S. retail sales data.

    Precious metals posted modest losses on Tuesday before rebounding Wednesday after December U.S. retail sales came in weaker than expected.

    The softer data signaled cooling consumer spending amid persistent inflation and labor market pressures, raising concerns about the economic outlook. Expectations that the Federal Reserve may cut interest rates further this year weighed on Treasury yields and kept the dollar subdued, lending support to metal prices.

    Investors are now focused on the upcoming nonfarm payrolls report for clearer signals on the economy. Signs of continued labor market weakness could strengthen bets on rate cuts, which typically favor non-yielding assets like gold.

    However, uncertainty over U.S. monetary policy persists, particularly after President Donald Trump nominated Kevin Warsh as the next Fed chair. Warsh is seen as less dovish, a perception that has pressured metal markets since late January.

    Sources: Ambar Warrick

  • Oil rises on U.S.-Iran tensions, China demand eyed.

    Oil prices advanced in Asian trading on Wednesday as investors monitored developments in U.S.-Iran relations and looked ahead to travel demand during an upcoming major holiday in China.

    Crude rebounded from part of the previous session’s losses, supported by a softer U.S. dollar ahead of key economic data releases.

    By 21:04 ET (02:04 GMT), April Brent futures climbed 0.6% to $69.18 a barrel, while WTI crude futures also gained 0.6% to $64.19 a barrel.

    Oil prices rise amid US-Iran tensions over potential supply disruptions.

    On Tuesday, Iranian officials stated that recent nuclear discussions with the United States helped Tehran assess Washington’s intentions, adding that diplomatic engagement between the two nations would continue.

    The remarks followed talks held last week regarding Iran’s nuclear program, which came after U.S. President Donald Trump sent several warships to the Middle East.

    Although both sides indicated some progress from their weekend negotiations, attention shifted after the U.S. issued a maritime warning for vessels passing through the Strait of Hormuz.

    Media reports also suggested that Trump was weighing the deployment of a second aircraft carrier near Iran—a step that could significantly heighten regional tensions.

    Amid the uncertainty, oil markets incorporated a risk premium, as traders grew concerned that potential military action might disrupt Iranian oil supplies.

    China’s Lunar New Year travel surge draws attention as CPI data falls short of expectations.

    Oil prices found some support on expectations of stronger Chinese fuel consumption during the upcoming Lunar New Year holiday.

    This year’s Lunar New Year, marking the Year of the Horse in the Chinese zodiac, falls on February 17 and will be observed with an extended nine-day public holiday from February 15 to 23.

    The festive period typically drives higher consumer spending in China, particularly in travel. Authorities project a record 9.5 billion passenger journeys during the spring holiday travel rush.

    International travel is set to include several favored destinations across Southeast Asia, though flights to Japan have reportedly declined sharply amid escalating diplomatic tensions between Beijing and Tokyo.

    Meanwhile, recent economic data signaled that deflationary pressures persist in China, as consumer price index figures came in below expectations and producer prices continued to contract.

    Sources: Ambar Warrick

  • Gold prices edged lower but held above the $5,000-per-ounce level, while silver prices also retreated.

    Gold prices slipped in early Asian trading on Tuesday, pulling back from strong gains in the previous session as investors turned cautious ahead of a series of important U.S. economic data releases this week. Silver and platinum also moved lower, despite some limited support from an overnight dip in the dollar, which later showed signs of recovery in Asian hours.

    Spot gold declined 0.8% to $5,016.28 an ounce, while April gold futures fell 0.8% to $5,041.60 an ounce. Spot silver dropped 2.4% to $81.29 an ounce, and spot platinum slid 2% to $2,081.71 an ounce.

    Precious metals have seen sharp volatility over the past week, with profit-taking and stretched positioning driving prices down from record highs. Markets have also been unsettled by uncertainty around U.S. monetary policy, particularly ahead of a potential leadership change at the Federal Reserve.

    Attention this week is firmly on key U.S. economic indicators for signals on growth and the future path of interest rates. January nonfarm payrolls data is due on Wednesday, followed by consumer price index inflation data on Friday, both of which are critical inputs for the Fed given its focus on inflation and labor market conditions.

    Investors are also assessing the potential policy direction under Kevin Warsh, President Donald Trump’s nominee to succeed Jerome Powell as Fed chair when Powell’s term ends in May. Warsh is widely seen as less dovish, and his nomination triggered steep selloffs in metals markets that have yet to be fully reversed, with gold plunging from near-record highs around $5,600 an ounce and silver falling from above $120 an ounce.

    Sources: Ambar Warrick

  • Oil prices tick lower as markets watch U.S.–Iran tensions.

    Oil prices edged lower in Asian trade on Tuesday, giving back some of the previous session’s gains as markets focused on U.S.–Iran tensions and awaited key economic data. Crude had jumped more than 1% earlier after reports suggested Washington was taking a more cautious stance toward Iran, offsetting optimism from weekend talks.

    A weaker dollar had supported prices, though the greenback stabilized on Tuesday. Brent futures slipped 0.1% to $68.99 a barrel, while WTI fell 0.2% to $64.06.

    The United States has released a maritime advisory concerning Iran.

    On Monday, the U.S. Maritime Administration warned U.S.-flagged ships to keep as much distance as possible from Iranian waters while transiting the Strait of Hormuz and the Gulf of Oman, advising vessels to remain closer to Oman due to the risk of boarding by Iranian forces.

    The advisory underscored ongoing tensions between Washington and Tehran, despite recent diplomatic talks showing some progress and commitments to further negotiations on Iran’s nuclear program, which remain strained as Iran has largely dismissed calls to halt nuclear enrichment.

    Markets are awaiting upcoming economic data releases from the United States and China.

    This week’s focus is on economic data from the world’s largest oil consumers, which is expected to shape demand expectations. In the U.S., January nonfarm payrolls are due on Wednesday, followed by consumer price index inflation data on Friday, with both releases likely to influence interest-rate outlooks amid an upcoming leadership transition at the Federal Reserve. In China, CPI data is also scheduled for Friday, just ahead of the week-long Lunar New Year holiday, when travel activity and fuel demand are expected to increase.

    Sources: Ambar Warrick

  • Gold Moves Into Accumulation Mode as VC PMI Eyes 5,094–5,208 Resistance

    Gold futures remain in a well-defined bullish consolidation, with prices oscillating around the VC PMI daily mean near 4,982. The market’s continued defense of the Buy-1 level at 4,768 and Buy-2 at 4,556 reinforces the view that institutional demand is emerging on pullbacks. This price action aligns with the core VC PMI mean-reversion framework: sustained trade above the mean increases the probability of a move toward the Sell-1 and Sell-2 targets.

    Within the VC PMI framework, the weekly mean around 4,839 has acted as the key pivot for directional bias. As long as price action remains above this level, bullish momentum is sustained, with upside projections toward the daily Sell-1 resistance at 5,094 and Sell-2 at 5,208. These zones mark statistically extreme levels where the probability of mean reversion typically exceeds 90% under normal market conditions. A decisive breakout and close above Sell-2 would indicate a transition into a higher-volatility regime, opening the door to the weekly Sell-1 level at 5,255 and potentially the weekly Sell-2 target near 5,530.

    Square-of-9 geometry closely mirrors the current price structure, highlighting that the recent peak near 5,113 aligns with a harmonic resistance angle projected from prior cycle lows around 4,423. This geometric relationship suggests gold is completing a rotational phase ahead of its next directional move. When prices oscillate between key geometric angles, it often signals energy compression that ultimately resolves through a momentum expansion.

    Time-cycle analysis into mid-February points to a critical inflection window. With prices consolidating above the mean, the higher-probability outcome favors continuation toward upper resistance bands. Conversely, a failure to hold the 4,982 pivot would likely prompt a corrective rotation toward 4,768 and potentially 4,556, levels where longer-term accumulation demand is expected to reappear.

    The combined use of VC PMI price levels, time-cycle analysis, and Square-of-9 geometry creates a multidimensional framework for identifying high-probability inflection points. Rather than forecasting direction, traders should concentrate on price reactions at the mean and statistically extreme bands. Directional bias is ultimately confirmed by the market itself, once price closes decisively above or below these levels.

    Sources: Patrick MontesDeOca

  • Gold and Silver: Volatility is undermining their role as portfolio diversifiers – HSBC

    HSBC Asset Management said gold and silver posted dramatic price swings in 2025, fueled by geopolitical risks and worries about the Federal Reserve’s independence, before evolving into a retail-driven speculative phase. Analysts caution that leveraged selling could increase their correlation with equities, but note that central bank de-dollarisation efforts and crisis-related demand continue to support the long-term structural case for precious metals.

    Safe-haven demand weighed against speculative flows

    “This year’s moves in gold and silver have been extraordinary.
    Sparked by geopolitical tensions and concerns over the Federal Reserve’s independence, the 2025 rally morphed into a retail-driven speculative surge, making a correction increasingly probable.

    So where does that leave investors who rely on gold as a portfolio diversifier? Although retail inflows lifted returns, they also brought equity-like volatility — at odds with gold’s traditional safe-haven role.

    That said, recent turbulence shows that no safe haven is perfect, reinforcing the case for ‘diversifying the diversifiers’: taking an active, multi-asset approach to seek uncorrelated returns across a wide range of assets.”

    Sources: Fxstreet

  • Gold seeks firm footing above $5,000 as a pivotal week begins

    Gold is consolidating recent gains around the $5,000 level, with buyers gradually building momentum for a potential sustained uptrend as a pivotal week gets underway. Market attention is firmly on the delayed U.S. Nonfarm Payrolls report due Wednesday and the Consumer Price Index data scheduled for release on Friday.

    Fundamental Analysis

    As the new, data-heavy week begins, dovish sentiment surrounding the U.S. Federal Reserve is setting the tone, with renewed reflation trades helping gold extend Friday’s strong rebound from the $4,650 area.

    After last week’s weak U.S. labor data, markets have continued to price in the first Fed interest-rate cut as early as June, even as investors remain divided over the likely policy stance of Fed chair nominee Kevin Warsh.

    Risk appetite has also been supported by a resurgence in reflationary trades, sparked by Japan’s ruling Liberal Democratic Party securing a decisive majority in snap elections. The outcome has reinforced expectations of debt-funded fiscal stimulus, further underpinning the broader reflation theme.

    Adding to gold’s support, the U.S. dollar has softened amid renewed weakness in USD/JPY following strong verbal intervention from Japanese authorities. The resulting dollar pressure has helped keep the precious metal buoyant.

    That said, gold’s recovery momentum appears somewhat constrained as overall risk sentiment remains upbeat on expectations of expansionary fiscal policies in Japan. Japanese equity markets have surged to record highs, lifting broader Asian stocks and reducing demand for traditional safe havens.

    Looking ahead, it remains uncertain whether gold can sustain its rebound, as traders may grow more cautious and adjust positions ahead of Wednesday’s closely watched U.S. January jobs report.

    XAU/USD Technical Overview

    On the daily chart, XAU/USD is trading around $5,023.88, with the technical structure firmly tilted to the upside. The 21-day Simple Moving Average (SMA) has crossed above the 50-, 100-, and 200-day SMAs, and all are sloping higher, highlighting a strong and well-established bullish trend. Prices remain comfortably above these moving averages, keeping buyers in control.

    Momentum indicators also support the constructive outlook. The Relative Strength Index (RSI) is at 57.72, holding above the neutral 50 level and well below overbought territory, suggesting steady positive momentum without signs of exhaustion. Immediate dynamic support is provided by the rising 21-day SMA at $4,873.06.

    This bullish alignment implies that any pullbacks are likely to be limited as long as prices stay above the faster moving average. A daily close below the 21-day SMA would signal a deeper corrective move, potentially exposing the 50-day SMA near $4,563.97. For now, the continued rise in medium- and long-term SMAs favors a buy-on-dips approach and keeps the broader trend firmly pointed higher.

    Sources: Fxstreet

  • Gold jumps to $5,000 as silver rallies after volatile week

    Gold prices climbed in Asian trading on Monday, with silver also advancing after precious metal markets experienced sharp volatility last week amid weaker safe-haven demand, profit-taking, and heightened uncertainty over U.S. monetary policy.

    This week’s focus is on a series of key U.S. economic releases—most notably nonfarm payrolls and consumer price index inflation data—which are expected to offer fresh signals on the outlook for the world’s largest economy. Demand for haven assets eased as the United States and Iran showed signs of progress in weekend talks, with both sides agreeing to continue negotiations over Tehran’s nuclear program.

    Spot gold rose 0.7% to $4,996.47 an ounce by 20:49 ET (01:49 GMT), after briefly touching an intraday high of $5,046.79. April gold futures gained 0.8% to $5,016.21 an ounce.

    Spot silver jumped 3.3% to $80.5330 an ounce, extending its rebound from lows near $60 an ounce seen last week. Platinum underperformed, slipping 2.3% to $2,068.45 an ounce.

    Precious metals saw sharp swings last week as investors weighed the outlook for U.S. monetary policy under President Donald Trump’s nominee for Federal Reserve chair, Kevin Warsh. His nomination boosted the dollar, triggering broad selling across metal markets as traders also took profits after strong recent gains in gold and silver.

    So far in 2026, gold and silver remain up about 15% and 5%, respectively, despite both metals retreating sharply from record highs reached in early February.

    Sources: Ambar Warrick

  • Oil prices slip after the U.S. and Iran signal progress in negotiations

    Oil prices slipped in Asian trading on Monday as the United States and Iran indicated they would continue negotiations over Tehran’s nuclear program, easing concerns about heightened tensions in the Middle East.

    Crude prices were also weighed down by a firmer U.S. dollar ahead of a busy week of key U.S. economic data, extending losses after a roughly 2% decline last week. Investors are additionally awaiting major economic releases from China, the world’s largest oil importer.

    Brent crude futures for April dropped 0.7% to $67.57 a barrel by 21:17 ET (02:17 GMT), while West Texas Intermediate futures also fell 0.7% to $63.12 a barrel.

    U.S. and Iran agree to press ahead with nuclear negotiations

    Washington and Tehran said over the weekend that indirect nuclear negotiations will continue following what both sides described as constructive talks in Oman on Friday.

    The statements helped ease fears of an imminent military confrontation in the Middle East, particularly after the United States had earlier deployed several warships to the region.

    Concerns over a potential conflict had previously pushed traders to build a higher risk premium into oil prices, with former President Donald Trump also issuing threats of military action against Iran.

    However, the likelihood of a full-scale war in the region now appears reduced, even as Tehran indicated it will continue advancing its nuclear enrichment activities.

    Markets await key U.S. and China economic data

    Attention this week is also on a slate of major economic data from the world’s largest oil-consuming economies.

    In the United States, January nonfarm payrolls figures are due on Wednesday, followed by CPI inflation data on Friday. These releases will be closely scrutinized for further signals on the interest-rate outlook, as markets continue to assess the direction of monetary policy under Warsh.

    In China, January CPI data is also scheduled for release on Friday, providing fresh insight into conditions in the world’s biggest oil importer.

    The data arrives just ahead of China’s week-long Lunar New Year holiday, which is expected to boost fuel demand across the country.

    Sources: Ambar Warrick

  • WTI Crude Oil Weekly Outlook: Established Range Reasserts Its Pull

    After closing the prior week comfortably above the 65.000 level, WTI Crude Oil began this past Monday with a sharp selloff, dropping to nearly 63.300. From there, price action largely revolved around that area throughout the week, with technical levels guiding the back-and-forth movement.

    Heading into the weekend, WTI is trading near 63.490 and is likely to open with early momentum when markets reopen on Monday. Overall, crude appears to have formed a central pricing zone, reflecting a higher equilibrium that remains reluctant to drift too far from lower levels. Resistance seems to be forming near 65.500, while the 61.000 area is acting as a key support floor—though, of course, there is no guarantee prices will remain confined within this range.

    Short-Term Outlook and Retrospective Analysis

    While some market participants attribute higher WTI crude prices to geopolitical concerns in the Middle East—particularly surrounding Iran and the buildup of U.S. military forces in the region—another factor may be the recent stretch of record cold temperatures across the United States. Notably, WTI crude had been trading with support near the 59.000 level up until January 22.

    The challenge with any of these explanations is the possibility that WTI crude is simply trading higher due to speculative forces, even though broader factors are clearly influencing market sentiment. The combined impact of geopolitical tensions involving Iran and unusually cold weather in the U.S. may be shaping positioning decisions among large market participants. At the same time, WTI has returned to a price range that was already tested back in August 2025, underscoring that this valuation zone is not unfamiliar territory for the commodity.

    Support and Resistance Levels in Focus This Week

    Broader financial markets continue to display signs of unease, with many large traders and institutions positioning defensively and expressing limited confidence in signals coming from other asset classes.

    By contrast, WTI crude oil has continued to grind along within a familiar and well-defined range, potentially creating opportunities for speculative positioning. The opening price action on Monday will be worth watching, especially given that the prior week began with a sharp selloff at the open. A repeat of that move appears less likely this time, as market anxiety seems to have eased somewhat compared with last week. If WTI opens in a more orderly fashion, it could present attractive opportunities to engage around key technical levels.

    WTI Crude Oil Weekly Market Outlook

    If WTI crude oil moves higher at the start of Monday’s session and approaches the 64.000 level, traders may look to target slightly higher price zones. That said, day traders should avoid becoming overly aggressive, as the 64.500 area could present stiff resistance unless upside momentum is firmly maintained. For now, a sharp acceleration to higher levels appears unlikely, with a decisive breakout probably requiring fresh catalysts—such as escalating developments involving Iran—to overcome established resistance.

    Conversely, if WTI opens lower on Monday, the early reaction around the 63.000 support level will be key. A successful hold there would suggest larger participants are comfortable maintaining the current price equilibrium. However, a sustained break below 63.000 lasting several hours could indicate reduced concern among major oil players, potentially opening the door to further downside movement.

    Sources: Robert Petrucci

  • Macquarie revises its 2026 outlook for gold and silver, setting new price targets

    Macquarie has updated its 2026 outlook for gold and silver, pointing to extreme volatility and recent geopolitical and policy-driven shocks as the main catalysts.

    Strategist Peter Taylor noted that the bank had previously flagged the risk of gold reaching $5,000 per ounce amid concerns surrounding the Federal Reserve chair—a scenario that ultimately materialized. He also warned that silver was vulnerable to a sharp pullback, given its tendency to gap lower.

    Macquarie raised its average gold price forecast for the first quarter of 2026 to $4,590 per ounce from $4,300, while its second-quarter estimate was lifted to $4,300 from $4,200. The bank also increased its full-year 2026 gold forecast to $4,323 per ounce, up from $4,225.

    For silver, the Q1 target was raised sharply to $75 from $55, with the 2026 average forecast increased to $62 from $57.

    Taylor emphasized that market conditions in January were exceptionally volatile, citing events such as threats of a criminal indictment against the Fed chair by the U.S. Department of Justice, the arrest and extradition of Venezuela’s Maduro, renewed focus on Greenland alongside potential tariffs on some NATO countries, and a buildup of military forces around Iran.

    He added that while commodities broadly delivered strong gains, price movements were often detached from underlying fundamentals.

    “Overall, this resulted in one of the strongest monthly performances for the commodities complex in recent history,” Taylor said.

    Macquarie said it is holding off on revising longer-term forecasts for gold and silver, pointing to the ongoing disconnect between fundamentals and the unusually high volatility in precious metals markets.

    Sources: Sam Boughedda

  • Gold Futures in Accumulation as Cycle Signals Point to a $5,000–$5,170 Breakout

    Gold futures are currently trading around 4,841.7, holding steady above the VC PMI daily Buy 1 level at 4,765 and the Buy 2 support at 4,640. This price action suggests the market has entered a well-defined mean-reversion accumulation zone. It reflects the natural interaction between price and time cycles, where markets extend into extreme areas before reverting toward equilibrium.

    The VC PMI daily mean at 4,905 now acts as the key price magnet. A sustained close above this level would signal the return of bullish momentum, potentially paving the way for a move toward Sell 1 at 5,030 and Sell 2 at 5,170.

    On the weekly timeframe, the VC PMI mean at 5,024 aligns closely with an upper resistance cluster and Square of 9 harmonic geometry. This confluence implies that once price establishes itself above the 4,905 mean, upside momentum could accelerate rapidly toward the 5,000–5,170 zone.

    The Square of 9 framework suggests current price action is progressing through a harmonic relationship between time and price, with the next cycle window extending into mid-February. These cycle windows often mark potential inflection points, where volatility expands and directional conviction strengthens.

    From a structural perspective, maintaining levels above 4,765 preserves the bullish accumulation framework and indicates that institutional demand continues to absorb selling pressure. The deeper support at 4,640 marks the lower extreme of the daily cycle. A decisive break below that level would suggest the market is not yet ready to complete its bullish phase and could prompt a retracement toward lower weekly support zones.

    However, as long as price holds above the 4,640–4,765 support zone, the odds continue to favor a mean-reversion advance toward the 5,030 and 5,170 upside targets.

    By integrating VC PMI price levels, time cycles, and Square of 9 geometry, this framework offers a structured way to identify high-probability turning points. Markets operate in recurring phases of expansion and contraction, and these tools are designed to quantify those cycles with consistency, discipline, and objectivity.

    Sources: Patrick MontesDeOca

  • Gold and Silver Movements Depend on US–Iran Talks

    Assessing the daily charts for gold and silver futures against a backdrop of rising trader anxiety, it is clear that the outcome of the meeting between U.S. and Iranian diplomats could soon determine the next directional move once markets receive clearer signals.

    Volatility in both gold and silver futures has surged, leaving prices highly sensitive to the meeting’s outcome. Gold futures opened at $4,722.30, dipped to an intraday low of $4,671.74, and then rallied to trade near the session high around $4,907—just below immediate resistance at $4,938.55. This price action reflects mounting concern as U.S.–Iran talks begin amid fears of a potential direct conflict.

    Despite the heightened tension, the situation remains unresolved. The U.S. is reportedly pressing Iran to freeze its nuclear program, dismantle its uranium stockpile, and expand discussions to include ballistic missiles, regional proxy support, and human rights issues. Iran, however, has stated that talks will be limited strictly to its nuclear program, and it remains unclear whether these fundamental differences have been bridged.

    In recent weeks, President Donald Trump has warned of military action if a deal is not reached, while the U.S. has deployed thousands of troops and significant naval and air assets to the region. Iran has responded with threats of retaliation, including strikes on U.S. military targets in the Middle East and Israel.

    This marks the first direct engagement between U.S. and Iranian officials since last June’s Israel–Iran conflict, during which U.S. forces struck Iran’s three primary nuclear facilities. Iran has since claimed that its uranium enrichment activities ceased following those attacks.

    Meanwhile, precious metals have endured an extended selloff since last week. Initial pressure stemmed from President Trump’s nomination of Kevin Warsh as the next Federal Reserve chair, a move interpreted as less dovish and supportive of a stronger U.S. dollar. The dollar is now on track for its strongest weekly performance since early October, with soft labor data doing little to halt its advance.

    Looking ahead, any indication that talks may ease tensions between the U.S. and Iran could spark renewed selling in gold and silver, even though both futures have already rebounded modestly from their intraday lows. At this stage, dissecting technical rebounds or exhaustion signals may be premature. Instead, the focus remains squarely on the diplomatic outcome and whether it ultimately de-escalates the situation—or deepens existing tensions.

    Looking at the current positioning of the spot gold–silver ratio, today’s session saw it test an intraday high of 72.77 and a low of 65.10, with the ratio currently trading around 66.39. This movement suggests that gold and silver futures may revisit price levels last seen between December 1 and 16, 2025—when gold futures were trading in the $4,207 to $4,340 range and silver futures were between $57 and $65.

    Gold futures are currently trading above the key 50-EMA support near $4,580, while remaining capped below the immediate 9-EMA resistance around $4,885, after successfully holding above the short-term 20-EMA support at approximately $4,824.

    Meanwhile, silver futures are holding above the key 100-EMA support near $62.692, but continue to trade below the immediate resistance at the 50-EMA around $74.252.

    In summary, any constructive outcome from the meeting could prompt renewed selling pressure across both precious metals, while renewed disagreement between the two countries may spark a bout of buying. However, any upside could remain vulnerable to fresh selling, as follow-up commentary from the U.S. President after the meeting is likely to play a decisive role in shaping market sentiment.

    Sources: Satendra Singh

  • Silver plunges below $72.00 as fading safe-haven demand weighs

    Silver prices slipped to around $71.90 during the Asian session on Friday, pressured by profit-taking and easing geopolitical tensions that reduced demand for safe-haven assets. Meanwhile, U.S. initial jobless claims rose more than expected last week, coming in above market forecasts.

    Silver prices (XAG/USD) slid to around $71.90 during Asian trading on Friday, marking their lowest level since January 2, as the metal extended recent losses amid easing geopolitical tensions and profit-taking. Market participants are closely watching scheduled U.S.–Iran talks later in the day for further cues.

    Diminishing tensions between Washington and Tehran have weighed on safe-haven demand for precious metals. Iran has signaled it wants discussions to center on its long-running nuclear dispute with Western powers, while the U.S. is pushing to broaden the agenda to include Iran’s ballistic missile program, its alleged support for armed groups in the Middle East, and its human rights record.

    Analysts note that recent price action has been driven largely by speculative flows, leveraged positioning, and options-related trading rather than underlying physical demand. Sunil Garg, managing director at Lighthouse Canton, said a substantial buildup of speculative positions has yet to be fully unwound.

    Meanwhile, signs of softening in the U.S. labor market could limit further downside by pressuring the U.S. dollar and lending some support to dollar-denominated commodities. Data from the U.S. Bureau of Labor Statistics showed job openings unexpectedly fell in December to their lowest level since 2020, while layoffs increased. In addition, applications for unemployment benefits rose more than anticipated last week.

    Sources: Lallalit Srijandorn

  • Gold, silver extend losses as stronger dollar weighs on metals

    Gold and silver prices declined further in early Asian trading on Friday, extending steep losses from the previous session as profit-taking, easing geopolitical risks, and a stronger U.S. dollar continued to weigh on the metals complex. Silver remained the weakest performer after plunging around 15% on Thursday, while gold was trading nearly $1,000 per ounce below the record high reached last week.

    Spot gold slipped 0.6% to $4,751.13 an ounce by 19:56 ET (00:56 GMT), while April gold futures dropped 2.5% to $4,766.11. Spot silver fell 2.2% to $69.383 per ounce, although it stayed above Thursday’s lows near $63, while silver futures tumbled 8.1% to $70.378.

    OCBC analysts noted that the $70–$90 range has emerged as a key stabilization zone for silver, warning that a sustained break below this level could open the door to a deeper correction toward the $58–$60 area. They added, however, that holding within this range could allow bullish momentum to rebuild over time.

    Losses extended across the broader precious metals space, with spot platinum sliding 7.2% to $1,853.81 an ounce. Metal markets have been under sustained pressure since last week, initially triggered by U.S. President Donald Trump’s nomination of Kevin Warsh to succeed Jerome Powell as Federal Reserve chair. Warsh has been perceived as less dovish, fueling a rally in the dollar that has weighed heavily on metals.

    The U.S. currency was on track for its strongest weekly performance since early October, with softer labor market data failing to curb its advance. Meanwhile, easing tensions between the U.S. and Iran also dampened safe-haven demand for gold and silver, as the two sides were set to hold talks in Oman later in the day.

    Sources: Ambar Warrick

  • Oil prices were steady, heading for a weekly decline as US-Iran talks remained in focus.

    Oil prices slipped in Asian trading on Friday and were on track for a weekly loss, as markets focused on whether upcoming U.S.–Iran talks could ease Middle East tensions. Investors also priced in a lower risk premium and took profits after last week’s strong gains. Brent futures for April held at $67.58 a barrel, while WTI futures edged up 0.1% to $63.09 by 21:13 ET (02:13 GMT).

    U.S.–Iran negotiations are scheduled to be held in Oman.

    U.S. and Iranian officials are scheduled to hold talks in Oman later on Friday, as military tensions in the Middle East intensify following Washington’s deployment of at least two naval fleets to the region. Investors are optimistic that dialogue between Tehran and Washington could ease tensions and reduce the risk of a wider conflict, prompting traders to strip some geopolitical risk premium from oil prices this week.

    However, differences have emerged over the scope of the discussions, with Iran rejecting U.S. demands to address its missile program and insisting that talks will focus solely on its nuclear ambitions. Iran is a key global oil producer and sits alongside the Strait of Hormuz, a critical chokepoint for global crude shipments.

    Oil set for weekly decline as profit-taking and a stronger dollar weigh

    Brent and WTI futures were down between 2.5% and 4% for the week, as prices came under pressure from profit-taking after six straight weeks of gains. Crude had earlier been supported by expectations of tighter supply, particularly after extreme weather in the U.S. disrupted output nationwide.

    Supply disruptions in Kazakhstan and concerns over an escalation of conflict in the Middle East also lent support to prices. However, sentiment shifted this week as traders locked in profits, while a broader selloff across commodities—driven by a strengthening U.S. dollar—further weighed on oil markets. The dollar was on track for its strongest weekly performance since October, as investors viewed Kevin Warsh, U.S. President Donald Trump’s nominee for the next Federal Reserve chair, as a less dovish choice.

    Sources: Ambar Warrick

  • Silver Remains Bearish in the Near Term After Rally Fizzles

    Silver sold off sharply after Kevin Warsh’s nomination to the Fed caught investors off guard who had been anticipating a more dovish pivot. The metal remains under pressure from margin increases, elevated physical delivery requirements, and aggressive short positioning by Chinese traders. While long-term fundamentals remain constructive, prices are still range-bound as the market waits for clearer macro and technical signals.

    The steep decline in silver toward the end of last week can reasonably be characterized as a crash, triggered primarily by the announcement of Kevin Warsh’s nomination to lead the Federal Reserve.

    Prior to the news, markets had been positioned for a notably dovish appointment, an expectation shaped by President Donald Trump’s repeated calls for a weaker U.S. dollar and faster interest-rate cuts. Warsh’s nomination caught investors off guard, forcing a rapid reassessment of monetary policy expectations.

    Even so, uncertainty remains around how the incoming Fed chair would ultimately steer the central bank.

    At the same time, broader commodity markets have struggled to regain traction. Despite several rebound attempts, prices have failed to establish sustained upside momentum, leaving commodities—silver included—likely confined to a period of sideways consolidation for now.

    Investors Demand Physical Deliveries

    Beyond monetary policy concerns, silver prices are facing additional pressure following the CME Group’s decision to raise margin requirements for gold and silver. The higher margins have forced some leveraged investors to unwind long positions, intensifying selling pressure.

    At the same time, a growing number of futures contracts are moving toward physical delivery rather than being rolled forward. Given the current supply tightness, this dynamic is, for now, benefiting sellers more than buyers.

    Activity out of China has also drawn attention. Zhongcai Futures reportedly established a sizable short position in silver—estimated at roughly $1.5 billion—and appears to have profited significantly from the recent decline.

    With the Lunar New Year holiday ending and the Shanghai Stock Exchange reopening, market participants will be closely monitoring how Asian demand evolves.

    Overall, the recent move appears to be a corrective pullback after metals prices advanced too rapidly over a short period. While the near-term retracement has weighed on sentiment, it does little to alter the longer-term outlook. From a fundamental perspective, the case for higher prices remains intact, supported by constrained supply and steadily rising industrial demand.

    Investors will also be watching Kevin Warsh closely, as any public remarks could provide clearer insight into his economic views and expectations for the interest-rate path in the months ahead.

    Technical View on Silver

    Early in the week, demand showed signs of returning as investors stepped in to buy the dip. However, the rebound proved short-lived, with a fresh wave of selling reversing the recovery. For now, prices are consolidating within a range of roughly $74 to $92 per ounce.

    By the end of the week, prices are likely to stay confined within this range, provided U.S. labor market data does not deliver any major surprises. From a technical standpoint, the market appears to be in wait-and-see mode, looking for a decisive breakout to determine the next directional move. Meanwhile, the U.S. Dollar Index has once again held key support near the 96 level, which also represents its lows for the year.

    If buyers are able to extend the rebound, the next major hurdle sits near the 100 resistance level. A decisive break above that area could pave the way for a move toward 103.

    On the downside, a drop below 96 on the U.S. Dollar Index would be a clear signal that the broader downtrend remains intact and is likely to persist.

    Sources: Damian Nowiszewski

  • Natural Gas Slides on Warmer Forecasts: Is This a Buying Opportunity?

    Following a sharp and prolonged rally triggered by the outbreak of the Russia–Ukraine war in 2022, natural gas prices have since collapsed. The downturn has been driven by record U.S. output, warmer-than-expected winters, and improvements in drilling technology, all of which have contributed to a significant supply–demand imbalance.

    Over the past five years, natural gas—and related instruments such as the US Natural Gas Fund ETF (NYSE: UNG)—has dropped nearly 60%, reinforcing its long-standing reputation as the “widow maker.”

    However, following a sharp cold-weather-driven spike, warmer February forecasts have dampened near-term demand expectations, triggering a roughly 15% selloff in natural gas prices on Sunday evening.

    Even so, a number of bullish catalysts are coming into focus that could pave the way for a powerful, 2022-style rally in natural gas. Below are three key reasons to maintain a bullish outlook, including:

    Rising Energy Demand From Data Centers

    Already, the buildout of AI-focused data centers represents the largest infrastructure expansion in history. Data from Grand View Research shows that the data center construction market surpassed $250 billion in 2025, as hyperscalers such as Alphabet (NASDAQ: GOOGL) and Microsoft (NASDAQ: MSFT) race to secure leadership in artificial intelligence. Looking ahead, spending on AI data center construction is projected to surge to $450 billion by the end of the decade.

    Recent remarks from Nvidia’s (NASDAQ: NVDA) influential CEO, Jensen Huang, reinforce this view. Speaking at the World Economic Forum (WEF) 2026 in Davos, Switzerland, Huang pushed back against concerns of an AI bubble, pointing to rising spot prices—even for older GPUs—and the scarcity of available units for rent. He also suggested that trillions of dollars of capital are poised to flow into the development of increasingly powerful AI models.

    That said, hyperscalers face a significant constraint: energy. Power costs are climbing as electricity demand from AI data centers is projected to double by the end of the decade.

    While renewable and nuclear energy continue to dominate Wall Street’s narrative, both come with relatively high upfront costs. In the near term, natural gas remains the most reliable, scalable, and cost-effective source of power for meeting large-scale electricity demand.

    U.S. LNG Producers Capitalize on Global Demand

    Several major liquefied natural gas (LNG) export terminals are set to come online in 2026, expanding U.S. producers’ ability to supply Europe and other global markets. With U.S. natural gas prices well below those in Europe, exporters are incentivized to ship more volumes overseas. This dynamic is expected to absorb excess domestic supply, helping establish a solid price floor for U.S. natural gas.

    In addition, the Trump administration has emphasized an “American Energy Dominance” strategy, securing multiple long-term LNG supply agreements with countries such as Japan and Qatar. These deals underpin durable, long-term demand for U.S. LNG exports.

    Natural Gas Poised to Replace Coal

    According to the U.S. Energy Information Administration (EIA), U.S. coal production declined 11.3% year over year, with the number of active coal mines dropping from 560 to 524. Although many countries are transitioning toward renewable sources such as solar, these alternatives are currently insufficient to fully replace coal-fired generation. In the near term, natural gas offers the most viable solution, given its scalability, cost efficiency, and significantly lower emissions—producing roughly half the CO₂ of coal.

    Technical Outlook for Natural Gas

    Over the past several weeks, UNG has surged from roughly $10 to $16.90. However, warmer-than-expected weather forecasts suggest the ETF may pull back to test its 200-day moving average. Bulls will be watching closely this week to see whether that key support level holds.

    Bottom Line

    While natural gas is well known for its short-term volatility and weather-driven swings, the underlying fundamentals are increasingly pointing toward a bullish long-term trajectory. Rising energy demand from AI data centers, combined with expanding U.S. export capacity, is expected to drive sustained growth in demand over time.

    Sources: Andrew Rocco

  • Gold Bulls Hold Their Ground Ahead of U.S. Jobs Data

    Gold saw choppy price action during Thursday’s Asian session, oscillating within a roughly $200 range. Traders are now looking to the U.S. JOLTS Job Openings report and developments on the geopolitical front—particularly U.S.–Iran tensions—for clearer directional cues.

    XAU/USD Technical Analysis

    The 21-, 50-, 100- and 200-day SMAs are all sloping higher, with the 21-day positioned above the longer-term averages, highlighting a well-established bullish structure. Prices remain above these indicators, confirming that buyers retain control. Initial support is seen at the 21-day SMA near $4,827.45, followed by the 50-day SMA at $4,532.68. The 14-day RSI has eased to a neutral 52.58, suggesting momentum is consolidating after retreating from overbought levels.

    The positive alignment of the moving averages favours a buy-on-dips approach while prices hold above the short-term average. A more pronounced correction would bring the 100-day SMA at $4,271.21 into focus, with the 200-day SMA at $3,821.77 reinforcing the broader uptrend. As long as the RSI remains above the 50 midpoint, the bullish bias stays intact, while a sustained break below it could signal scope for a deeper retracement.

    Fundamental Analysis

    Gold ended Wednesday little changed near $4,950 after choppy two-way trading. The metal initially rebounded sharply, testing the $5,100 area amid uncertainty surrounding the Federal Reserve’s future policy direction under Kevin Warsh, which weighed broadly on the U.S. dollar.

    Renewed geopolitical tensions in the Middle East and between Russia and Ukraine also lent support to gold prices, alongside concerns about potential economic data disruptions stemming from the U.S. partial government shutdown that concluded on Tuesday.

    Sentiment shifted during the U.S. session after the ISM Services PMI signalled firmer inflation pressures, prompting a rebound in the dollar. At the same time, an intensifying tech-sector sell-off on Wall Street unsettled markets, driving demand for the greenback as a safe haven.

    Additional USD strength came from renewed weakness in the Japanese yen amid rising fiscal and political concerns, which pushed USD/JPY higher and further supported the dollar.

    The USD rebound triggered a sharp pullback in gold, although buyers stepped back in near the key $4,950 psychological support level.

    Early Thursday, gold remains under pressure after once again failing above the $5,000 resistance zone. The U.S. dollar continues to advance, hitting fresh two-week highs against its major peers as risk sentiment deteriorates amid a global technology sell-off.

    The decline in global data analytics, professional services, and software stocks followed Anthropic’s launch of plug-ins for its Claude Cowork agent, which raised fresh concerns about AI-driven disruption across these industries, according to Reuters.

    Looking ahead, the delayed U.S. JOLTS Job Openings report could offer gold some relief, particularly if it reinforces expectations for two Federal Reserve rate cuts this year. Conversely, an extended sell-off in the Japanese yen could spark another wave of heavy selling pressure in gold.

    Sources: Fxstreet

  • Gold retreats as stronger dollar weighs ahead of jobs data and central bank meetings

    Gold prices gave up early gains and declined during Asian trading on Thursday, pressured by a firmer U.S. dollar as investors positioned ahead of major central bank meetings and key U.S. labor market data. Reduced safe-haven demand also weighed on bullion after the U.S. and Iran confirmed plans to hold talks on Friday, easing fears of an imminent military escalation in the Middle East.

    Spot gold slid 1.1% to $4,912.26 an ounce by 21:17 ET (02:17 GMT), while April gold futures fell 0.4% to $4,929.25 an ounce. Prices had climbed as high as $5,092.31 an ounce on Wednesday before surrendering most of those gains and slipping back below the $5,000 level by the session’s close.

    The pullback came as diplomatic developments between Washington and Tehran helped calm geopolitical concerns. At the same time, a stronger dollar weighed on precious metals, with traders favoring the greenback ahead of interest rate decisions from the Bank of England and the European Central Bank, both scheduled for Thursday.

    Additional support for the dollar came from anticipation of U.S. nonfarm payrolls data due on Friday, which could influence expectations for the Federal Reserve’s interest rate path. The greenback also extended gains from last week following President Donald Trump’s nomination of Kevin Warsh as the next Fed chair. Warsh is widely seen as a less dovish candidate, potentially signaling a tighter monetary stance even as rates decline.

    Other precious metals also retreated after a brief rebound earlier in the week. Spot silver plunged 6.9% to $82.3130 an ounce after rallying nearly 6% in the previous session. While silver continues to benefit from its dual role as an industrial and precious metal and has significantly outperformed in recent months, it has faced sharp losses over the past week amid profit-taking and dollar strength.

    Spot platinum fell 3% to $2,167.59 an ounce, while benchmark copper futures on the London Metal Exchange slipped 0.6% to $12,986 per tonne.

    Sources: Ambar Warrick

  • Oil prices fell more than 1% as markets focused on ongoing U.S.– Iran talks.

    Oil prices fell in Asian trading on Thursday as traders pared back risk premiums after the U.S. and Iran confirmed talks would take place on Friday.

    Crude was also weighed down by a stronger U.S. dollar, which firmed ahead of key January nonfarm payrolls data due on Friday. Attention was additionally focused on major central bank meetings in Europe and the UK later on Thursday.

    Prices reversed some of Wednesday’s strong gains as investors locked in profits, though oil remained on track for a weekly decline after earlier losses driven by a broader selloff in commodity markets.

    Brent crude futures for April slipped 1.4% to $68.50 a barrel, while West Texas Intermediate futures fell 1.3% to $63.80 a barrel by 20:42 ET (01:42 GMT).

    Earlier, oil had found support from data showing U.S. inventories declined more than expected last week, as extreme cold weather disrupted production across the country.

    U.S.– Iran talks are set to be held in Oman on Friday.

    U.S. and Iranian officials are due to meet in Oman on Friday, as confirmed by both sides this week, though disagreements persist over the scope of the talks.

    Washington has repeatedly pushed for the discussions to include Iran’s missile program, while Tehran has said it is only willing to negotiate on its nuclear activities. These differences had earlier raised doubts about whether the meeting would go ahead, a factor that helped lift oil prices earlier in the week.

    Markets have also priced in a higher risk premium for crude amid concerns that U.S. President Donald Trump could follow through on threats to launch new strikes against Iran.

    A stronger dollar weighs on markets as investors await central bank meetings and upcoming payrolls data.

    A firmer dollar added pressure to oil prices, as the greenback attracted strong demand this week.

    Expectations around interest rate decisions from the Bank of England and the European Central Bank on Thursday prompted traders to move into the dollar, while attention also remained on upcoming U.S. nonfarm payrolls data.

    The dollar rebounded sharply from near four-year lows after President Donald Trump nominated Kevin Warsh as the next Federal Reserve chair, a choice seen as less dovish by markets.

    Investors are now focused on January nonfarm payrolls data due on Friday, which is expected to provide clearer signals on the future path of U.S. interest rates.

    Sources: Ambar Warrick

  • Silver prices plunged 16%, erasing the recent recovery.

    Silver prices fell sharply during Asian trading on Thursday, dragging the broader precious metals complex lower as renewed selling pressure erased most of this week’s brief rebound.

    Spot silver plunged as much as 16.7% to $73.5565 an ounce, moving back toward the lows seen after last week’s selloff, while March silver futures slid more than 10% to $73.383 per ounce. The sudden drop unfolded during the Asian session and coincided with a modest rise in the U.S. dollar.

    According to Chris Weston, head of research at Pepperstone, the selloff originated in China, beginning with a decline in Shanghai silver futures before spreading to CME futures and spot markets.

    Precious metals have been under pressure from a stronger dollar over the past week, as the greenback rebounded from near four-year lows after markets interpreted President Donald Trump’s nominee for the next Federal Reserve Chair, Kevin Warsh, as less dovish than expected. This sentiment has continued to weigh on metal prices.

    Meanwhile, traders remained broadly positioned in favor of the dollar ahead of key European central bank meetings on Thursday and the release of U.S. nonfarm payrolls data on Friday.

    Sources: Ambar Warrick

  • Gold Demand Remains Structurally Strong Despite Short-Term Fed Noise

    The mainstream narrative claims that a new Fed chair will safeguard the central bank’s independence from U.S. government influence—and that this alone justifies a $1,200/oz drop in gold and a $50 collapse in silver.

    Put simply, that narrative is complete nonsense.

    Fiat currency is best thought of as meme—or even junk—money, and despite its obvious flaws, it can still enjoy periodic rallies against what many see as the ultimate form of money: gold. These countertrend moves typically emerge during bouts of speculative excess, much like the frothy conditions that have dominated markets over the past couple of months.

    From a fundamental standpoint, the gold bull market remains fully intact. Billions of gold-focused savers across China and India—along with a smaller group of informed Western investors—do not rely on central banks for validation. Their priority is building long-term wealth in gold, not accumulating ever more fiat currency and debt.

    In the context of this broader bull cycle, it makes little difference who occupies the Fed chair. What matters is whether gold is attractively priced. When it is, prudent savers see it as an opportunity to accumulate more, regardless of short-term fiat-driven narratives.

    The long-awaited “exciting buy zone” has finally come into play. Gold investors were encouraged to prepare for a meaningful dip into the $4,400 area, and that discounted opportunity has now materialized.

    Sustainable wealth building is not about predicting prices, but about preparing for unexpected moves. This pullback unfolded over just a few days, leaving unprepared investors confused and still focused on guessing what happens next.

    The key development now is that the $5,600 region has emerged as a major accumulation zone on any future pullback. Gold investors should already be positioning themselves to take advantage of that opportunity if and when it presents itself.

    As for silver, the recent price sell-off was “super-sized,” driven by large and heavily leveraged bets against fiat currencies. That decline ultimately found support at the $70 buy zone, aligning perfectly with gold’s move into the $4,400 area.

    Gold remains the undisputed leader of the precious metals complex. If silver investors and mining-stock enthusiasts take their cues from gold bullion, they position themselves to build substantial and durable wealth. The most likely near-term path for silver is a broad trading range between $70 and $120, followed by a powerful upside breakout that could propel prices toward the next target zone of $170–$200.

    Over the longer term, silver has the potential to trade well above $1,000, largely because governments worldwide—both in the East and the West—continue to cling to fiat currencies and debt rather than returning to sound money anchored in gold.

    A new 40-year inflation cycle began in 2020 and is unlikely to end until U.S. interest rates reach record highs. Unlike the cycle’s conclusion in 1980, however, elevated rates this time are unlikely to curb inflation, as it is being driven by ongoing government policies rather than purely monetary conditions.

    Another perspective on U.S. rates: the incoming Fed chair is more likely to lean toward fiscal restraint on a debt-addicted U.S. government than to dispense easy-money policies of QE and rate cuts. Such a stance would have implications for long-term sovereign yields worldwide, and global money managers are likely to continue shifting capital into gold as a strategic response.

    As interest rates continue their relentless climb in the years ahead, governments will inevitably confront their “Queen Gold maker.” They will be forced to begin replacing fragile fiat currencies with gold—or face effective financial ruin.

    As for robots, they will simply become another cost burden for citizens already trapped in stagflation. As automation expands rapidly and robot populations eventually outnumber humans, workers will be left competing for a shrinking pool of jobs. Confronted with government-driven stagflation and lacking the protection of gold savings, many will endure severe financial stress—conditions that would be further worsened by a stock market crash.

    As for the miners, they too presented exceptional buying opportunities when gold dipped to $4,400. The CDNX is now starting to emerge from a decade-long base, with price action that closely resembles gold’s breakout above $2,000. The initial rally may appear deceptive, but it is genuine—because this type of breakout unfolds as a process rather than a single, short-lived move. Notably, trading volumes across CDNX-listed stocks have surged, reinforcing the strength of the move.

    While pockets of speculative excess briefly appeared in gold and silver bullion, such froth has been absent in the mining sector. Several silver explorers nearing production are projecting all-in sustaining costs well below $20, while gold explorers with large-scale projects are reporting AISC figures under $2,000. The conclusion is clear: junior gold and silver miners may represent the most undervalued segment in market history.

    And what about the senior miners? The GDX versus gold chart is striking. Since the 2015 low—when the head of a massive inverse head-and-shoulders pattern began to form—I’ve been guiding investors through this setup. That structure points not merely to years, but potentially decades of strong performance for gold equities. In alignment with the CDNX-to-fiat picture, the breakout process is now underway.

    The GDX daily chart delivers a real “wow factor.” The latest five-wave advance was remarkable—and signs suggest a new leg higher may already be unfolding. Notably, GDX’s recent pullback held well above its October highs, even as gold retraced back to that level. That kind of relative strength is a powerful signal that further upside is likely.

    Even if gold consolidates between $5,600 and $4,400, and silver oscillates between $120 and $70, GDX and many of its underlying stocks could still push on to new highs. With 2026 marking the Chinese Year of the Fire Horse—symbolizing bold action and the fight for freedom—the question arises: are gold and silver equities poised for their own moment of liberation, breaking out to extraordinary new levels? The evidence suggests they are.

    Sources: Stewart Thomson

  • WTI edges higher above $63.50 after U.S. downs Iranian drone

    • WTI crude prices edged higher to around $63.75 during Wednesday’s Asian trading session.
    • The move came after the U.S. military said it shot down an Iranian drone that “aggressively approached” a U.S. aircraft carrier, heightening geopolitical tensions.
    • Oil prices were also supported by data showing U.S. crude inventories recorded their largest decline since August 2023.

    West Texas Intermediate (WTI), the U.S. crude oil benchmark, was trading near $63.75 during Asian hours on Wednesday, edging higher amid rising concerns over escalating tensions between the United States and Iran. Market participants are also positioning ahead of the release of the U.S. Energy Information Administration’s (EIA) crude oil inventory report later in the day.

    According to CNBC, the U.S. military shot down an Iranian drone on Tuesday that had “aggressively” approached the USS Abraham Lincoln aircraft carrier in the Arabian Sea. The incident comes at a time of heightened Middle East tensions, as U.S. President Donald Trump weighs potential military action against Iran.

    Iran has also insisted that talks with the United States this week be held in Oman rather than Turkey, and that negotiations be limited to bilateral discussions focused solely on nuclear issues, further complicating an already fragile diplomatic process. Any escalation in tensions between Washington and Tehran—OPEC’s fourth-largest crude producer—could provide near-term support to WTI prices.

    Meanwhile, the American Petroleum Institute’s (API) weekly report showed that U.S. crude inventories fell by 11.1 million barrels in the week ended January 30, sharply deeper than the 250,000-barrel decline seen the previous week and well below market expectations for a 700,000-barrel build. The sizeable drawdown in stockpiles could lend additional support to oil prices.

    On the downside, renewed demand for the U.S. dollar may cap gains in dollar-denominated commodities. U.S. President Donald Trump’s nomination of Governor Kevin Warsh as the next Federal Reserve chair has led traders to expect a slower pace of interest rate cuts and a greater emphasis on reducing the Fed’s balance sheet under his leadership.

    Sources: Lallalit Srijandorn

  • Silver price forecast: XAG/USD jumps above $87.50 amid geopolitical risks

    • Silver prices climbed to around $87.60 during Wednesday’s Asian trading session.
    • However, shifting expectations surrounding the next Federal Reserve chair could limit further upside in the metal.
    • Demand for safe-haven assets strengthened after reports that the United States shot down an Iranian drone that was approaching an aircraft carrier.

    Silver prices (XAG/USD) climbed to around $87.60 during Asian trading on Wednesday, rebounding after a historic correction last week as dip-buying activity returned to the market.

    On Friday, U.S. President Donald Trump nominated Kevin Warsh to replace Jerome Powell as the next Chair of the Federal Reserve, with Warsh expected to assume the role when Powell’s term ends in May. Expectations that Trump’s nominee may favor keeping interest rates elevated to combat inflation have supported the U.S. dollar, potentially weighing on dollar-denominated commodities such as silver.

    Precious metals have also faced pressure from margin hikes by the CME Group. Over the weekend, the exchange raised margin requirements for gold and silver, forcing many leveraged traders to liquidate positions to meet higher costs.

    On the other hand, safe-haven demand has been underpinned by rising geopolitical risks and economic uncertainty. Reuters reported on Tuesday that the U.S. military shot down an Iranian drone that “aggressively” approached the Abraham Lincoln aircraft carrier in the Arabian Sea.

    Separately, Iran requested that this week’s negotiations with the United States be held in Oman rather than Turkey and limited to bilateral discussions focused solely on nuclear issues. President Trump warned that with U.S. warships moving toward Iran, “bad things” could occur if an agreement is not reached.

    Sources: Lallalit Srijandorn

  • Gold jumps back above $5,000 an ounce as Iran tensions fuel safe-haven demand

    Gold prices climbed back above key technical levels during Asian trading on Wednesday, as renewed signs of tension between the United States and Iran fueled safe-haven demand for the precious metal.

    Bullion extended its rebound from Tuesday after sharply recovering from recent losses, with dip-buying activity also remaining strong following last week’s more than $1,000 price sell-off.

    Spot gold gained 2% to $5,048.37 per ounce by 21:00 ET (02:00 GMT), while April gold futures advanced 2.8% to $5,017.19 per ounce.

    Other precious metals also moved higher on Wednesday, building on the rebound seen in the previous session. Spot silver gained 0.5% to $85.5245 per ounce, while spot platinum climbed 1.7% to $2,256.04 per ounce.

    Iran concerns return ahead of upcoming nuclear talks

    Renewed concerns over escalating tensions between the United States and Iran were a key catalyst for safe-haven demand, particularly after overnight reports that U.S. forces shot down an Iranian drone over the Arabian Sea.

    In a separate development, Iranian gunboats were reported to have approached a U.S.-linked oil tanker in the Strait of Hormuz.

    These incidents partially offset earlier statements from both Tehran and Washington indicating that talks would be held this Friday. News of the planned negotiations had previously eased market anxiety and weighed on safe-haven demand for gold.

    Gold’s recent pullback was largely driven by expectations that U.S. President Donald Trump’s nominee for Federal Reserve chair, Kevin Warsh, may adopt a less dovish stance than markets had anticipated. This fueled a sharp rally in the U.S. dollar, pressuring precious metals, while gold also faced profit-taking after surging to a record high near $5,600 per ounce last week.

    Despite the recent decline, gold remains up nearly 15% so far in 2026.

    ANZ analysts noted that the core fundamentals underpinning gold’s strength—safe-haven demand, robust physical buying, and ongoing central bank purchases—remain firmly intact.

    Sources: Ambar Warrick

  • Oil prices rise more than 1% amid escalating Iran tensions and expectations of a sharp drop in U.S. inventories.

    Oil prices climbed sharply during Asian trading on Wednesday, driven by reports of escalating tensions between the United States and Iran, which heightened fears of possible supply disruptions in the Middle East.

    Crude prices also found support from industry figures showing an unexpected and substantial drawdown in U.S. oil inventories last week, as severe cold weather across the country curtailed production.

    April Brent futures advanced 1.2% to $68.15 per barrel, while U.S. West Texas Intermediate crude rose 1.4% to $63.69 per barrel as of 21:01 ET (02:01 GMT).

    Oil prices climb amid escalating U.S.-Iran tensions ahead of nuclear negotiations

    Overnight reports indicated that U.S. forces shot down an Iranian drone that was approaching a U.S. aircraft carrier in the Arabian Sea.

    In a separate incident, several Iranian gunboats were observed nearing a U.S.-flagged oil tanker in the Strait of Hormuz.

    These developments came just ahead of planned talks between Washington and Tehran later this week. However, Iranian officials have reportedly insisted that the negotiations—scheduled for Friday—be limited to bilateral discussions focused solely on nuclear issues, raising uncertainty over whether the talks will proceed at all.

    U.S. President Donald Trump has warned of further military action if Iran fails to comply with U.S. demands to rein in its nuclear program, while Tehran has vowed strong retaliation against any U.S. aggression.

    Any escalation of military activity in the Middle East could potentially disrupt regional oil supplies, a risk that has helped support crude prices in recent trading sessions.

    U.S. oil inventories fall sharply amid production disruptions, API data shows

    Oil prices also found support from industry figures showing a large and unexpected drawdown in U.S. crude inventories.

    Data from the American Petroleum Institute indicated that U.S. stockpiles fell by 11.1 million barrels in the week ended January 30, sharply contrasting with expectations for a 0.7 million-barrel build.

    API figures often signal a similar outcome in the official inventory report due later in the day.

    The sizeable drawdown was driven by severe cold weather across the United States, which disrupted oil production nationwide and hampered exports from the Gulf Coast.

    Supply disruptions in the U.S. have also contributed to stronger oil prices in recent weeks.

    Sources: Ambar Warrick

  • Silver price forecast: XAG/USD rebounds above $87 after two-day decline.

    Silver has climbed above $87.00 after rebounding from one-month lows below $72.00. Precious metals are rising on Tuesday as overall market sentiment improves, though XAG/USD bulls may face resistance in the $88.00–$90.00 zone.

    Silver (XAG/USD) is posting modest gains on Tuesday, trading around $87.05 at the time of writing. The white metal has stabilized after plunging more than 30% over the previous two sessions, which pushed prices to one-month lows just below the $72.00 level.

    In a departure from their typical behavior, precious metals are rebounding alongside an improvement in broader market sentiment. Optimism stemming from a trade agreement between the United States and India, along with reports of forthcoming nuclear talks with Iran, has lifted investor confidence and increased appetite for risk assets.

    Technical analysis: XAG/USD faces immediate resistance at $88.00.

    XAG/USD has recovered part of its recent losses, though technical indicators continue to signal a bearish bias. The Moving Average Convergence Divergence (MACD) remains below both the signal line and the zero level, even as the negative histogram narrows toward zero. Meanwhile, the Relative Strength Index (RSI) is ticking higher, suggesting a gradual easing of downside pressure, but it remains below the critical 50 threshold.

    On the upside, the pair is expected to encounter resistance near Monday’s highs around the $88.00 mark. A sustained break above this level could shift attention toward the psychological $100.00 handle, followed by intraday resistance near $104.00.

    On the downside, immediate support is located at the monthly low of $71.37. A break below this level would expose the early-December highs and mid-December lows clustered around the $60.00 area.

    Sources: Guillermo Alcala

  • Precious metals are starting to lose some of their luster.

    Although gold, silver, and platinum were the top-performing commodities over the past year, they came under pressure late last week.

    Metals suffer a sharp pullback after hitting record highs.

    Silver and gold suffered a sharp sell-off early Friday, dragging mining stocks and related ETFs lower. After an exceptional run in 2025, both metals have begun to give back part of their gains. Silver slid roughly 15%, falling back below the $100 level, while gold dropped about 7% and struggled to hold above $5,000. Weakness spread across the sector, with platinum and palladium also declining by around 14% and 12%, respectively.

    Mining equities and ETFs came under heavy pressure. Producers such as Fresnillo, along with silver miners Endeavour and First Majestic, posted double-digit losses in pre-market trading. Silver-focused ETFs were hit even harder, with some falling as much as 25%.

    Following last year’s explosive rally—when silver surged 150% and gold gained 65%—the market appears to be undergoing a correction. Overcrowded positioning, uncertainty surrounding the Federal Reserve’s policy outlook, and shifts in geopolitics and the U.S. dollar have all fueled the sell-off.

    The move underscores that even traditional safe-haven assets are vulnerable to sharp volatility. When positioning becomes one-sided, even fundamentally strong markets can reverse quickly. Investors are now reassessing exposure, with some stepping in to buy the dip while others remain on the sidelines.

    Top-Performing Commodities Over the Past Year

    The three best performers are silver (+273%), platinum (+178%), and gold (+89%). These mark the strongest year-over-year gains for the metals since 1979–1980.

    Can oil keep pace with the broader commodities rally?

    The Bloomberg Commodity Index has surged, but the gains are not being driven by energy. Instead, strength is coming from other commodities, highlighting an unusual source of the rally.

    Germany’s gold reserves are valued at nearly €500 billion.

    Germany’s gold reserves are now valued at €496 billion. The Bundesbank holds 3,352 tonnes in total, with more than 1,200 tonnes stored in New York and the rest kept in Frankfurt and London.

    The Swiss franc strengthens against the U.S. dollar.

    While market attention remains focused on the U.S. dollar and the yen, the Swiss franc has quietly climbed to its strongest level in more than a decade.

    Here’s why the move matters globally:

    The “safe-haven” appeal

    Investors are gravitating toward stability. With gold pushing above $5,000 an ounce and political uncertainty weighing on major economies, the Swiss franc has reasserted itself as a preferred refuge. The currency is up about 3% so far this year, building on a strong 14% gain last year.

    The Swiss National Bank’s policy challenge

    Such strength is a double-edged sword. While it helps keep inflation exceptionally low—currently around 0.1%—it also increases pressure on Switzerland’s export-driven economy. This leaves the Swiss National Bank facing a difficult decision:

    Cut interest rates? With rates already at 0%, a return to negative territory would be a step policymakers are reluctant to take.

    Here is a refined paraphrase that flows naturally from the previous section:

    Intervene? Direct action in currency markets risks accusations of manipulation and could spark diplomatic frictions.

    The global backdrop

    When the world’s primary reserve currency—the U.S. dollar—shows signs of instability, capital doesn’t disappear; it reallocates. Increasingly, those flows are moving toward perceived safe havens, with the Swiss franc emerging as a key beneficiary.

    In an era of heightened market volatility, genuine stability has become one of the rarest—and most valuable—assets.

    U.S. companies account for 20 of the world’s 25 largest market capitalizations.

    The remaining five companies are based outside the U.S., with one each from Europe, China, Taiwan, South Korea, and Saudi Arabia.

    Within the United States, California dominates with six of the world’s largest companies by market value. Texas and Washington follow with three each, while New York is home to two. Nebraska, Arkansas, Indiana, New Jersey, Idaho, and Colorado each host one of the top global firms.

    The endowment model faces mounting challenges.

    For years, the endowment model—heavily tilted toward private assets—was held up as the gold standard for long-term investment success. Its track record was so compelling that institutions across the globe rushed to replicate it.

    But every “secret sauce” loses its edge once it becomes common knowledge. As capital flooded into the same private markets, the once-distinct advantage began to erode.

    Today, the space is increasingly crowded, and the classic endowment model is showing signs of strain. At the same time, more traditional portfolios with greater exposure to public markets are quietly regaining relevance.

    The drivers are clear: too much money is chasing a limited pool of private opportunities, alpha in private equity is harder to extract, and liquid, public-market portfolios are proving more resilient than many expected.

    This raises a critical question: is the era of private-heavy allocations coming to an end, or merely pausing? It may be time to revisit the “Yale model,” with a sharper focus on less congested private strategies and new sources of return—especially if the strong 60/40 performance of the past one and three years turns out to be more cyclical than enduring.

    Sources: Charles-Henry Monchau

  • Gold edges higher as the USD weakens; gains capped amid easing geopolitical tensions

    • Gold sees modest buying interest on Tuesday as the USD takes a breather from its rebound off a four-year low.
    • Kevin Warsh’s nomination as the next Fed Chair may help limit USD downside and restrain gains in the precious metal.
    • Easing geopolitical and trade tensions could continue to cap further upside in XAU/USD.

    Gold (XAU/USD) extends Monday’s rebound from the $4,400 area — its lowest level since January 6 — and picks up modest follow-through during the Asian session on Tuesday. However, the metal struggles to sustain the upside momentum, paring part of its intraday gains and easing back toward the $4,856 zone amid a confluence of bearish factors.

    US President Donald Trump’s nomination of Kevin Warsh as the next Federal Reserve Chair has removed a major source of uncertainty. In addition, a stronger-than-expected US ISM Manufacturing PMI released on Monday has helped the US Dollar hold onto its recent recovery from a four-year low, creating headwinds for gold prices.

    Further weighing on the precious metal are signs of easing US–Iran tensions over Iran’s nuclear program, the US–India trade agreement, and CME Group’s decision to increase margin requirements for precious metals futures. These factors, combined with a generally positive risk tone in global equity markets, call for caution among XAU/USD bulls.

    As a result, it may be prudent to wait for sustained follow-through buying before concluding that the recent sharp corrective decline from the $5,600 region — the record high reached last week — has fully played out. Looking ahead, the US JOLTS Job Openings data could provide fresh direction later in the North American session.

    Daily Digest Market Movers: Gold supported by a weaker USD; upside remains limited amid upbeat risk sentiment

    US President Donald Trump on Friday nominated Kevin Warsh to replace Jerome Powell as Federal Reserve Chair in May, subject to Senate confirmation. Given Warsh’s hawkish credentials, he is expected to remain alert to any rise in inflation expectations.

    Separately, CME Group announced over the weekend that margin requirements for precious metals futures will be raised from Monday’s market close. This triggered a second consecutive day of liquidation, pushing gold to a four-week low on Monday.

    On the data front, the Institute for Supply Management reported that US manufacturing activity expanded for the first time in a year. The Manufacturing PMI jumped to 52.6 in January from 47.9 previously, signaling a sharp rebound.

    Meanwhile, Trump said on Monday that the US and India have finalized a trade agreement and will immediately begin lowering tariffs on each other’s goods. In addition, expectations that the US and Iran will resume nuclear talks on Friday further lifted investor confidence.

    The US Dollar eases on Tuesday, retreating from an over one-week high reached the previous session, offering some support to gold during Asian trading. However, the aforementioned headwinds may continue to cap upside in the precious metal.

    Market participants will look ahead to the US JOLTS Job Openings report on Tuesday, followed by Wednesday’s US ADP private employment data and ISM Services PMI. These releases, along with Fed commentary, are likely to influence the USD and XAU/USD.

    Gold’s mixed technical picture calls for caution before aggressive directional positioning

    The commodity displayed resilience below its 50-day Simple Moving Average (SMA) and rebounded from the 50% Fibonacci retracement of the July 2025–January 2026 rally on Monday. The rising slope of the SMA indicates that downside moves may continue to attract buying interest. In addition, XAU/USD remains above the 38.2% retracement level, located around the $4,645–4,650 region, which should provide immediate support. The Relative Strength Index (RSI) is currently at 51.91 and trending higher, signaling stabilizing momentum.

    That said, the Moving Average Convergence Divergence (MACD) remains below both the signal line and the zero line, maintaining a bearish bias. The expanding negative histogram suggests that downside momentum is gaining traction. On the upside, any further recovery could shift focus toward the 23.6% retracement at $4,995.94. Conversely, a failure to defend the initial support zone may leave the rebound exposed to deeper consolidation.

    Sources: Haresh Menghani

  • Taiwan president urges trade ties with democracies over China

    Taiwan should prioritise trade and economic cooperation with fellow democracies rather than China, President Lai Ching-te said on Tuesday, as his government outlined plans to deepen collaboration with the United States in areas such as artificial intelligence and critical minerals.

    Senior officials from Taiwan and the United States discussed cooperation on AI, technology and drones at a high-level forum held last week, with the U.S. State Department describing Taiwan as a “vital partner.” The two sides also signed statements on economic security cooperation and endorsed the Pax Silica Declaration, a U.S.-led initiative aimed at safeguarding AI and semiconductor supply chains amid growing competition with Beijing, which claims Taiwan as its territory.

    Speaking at a news conference following the U.S.-Taiwan Economic Prosperity Partnership Dialogue, Lai praised the outcome of the talks, saying Taiwan was on the right economic trajectory and ready to work with democratic partners to drive future growth.

    His remarks came as Kuomintang (KMT) deputy chairman Hsiao Hsu-tsen was in Beijing for a think-tank exchange with China’s Communist Party on issues including AI and tourism. Lai acknowledged the opposition’s differing views, contrasting slower economic growth under previous KMT administrations—which pursued closer trade ties with China—with stronger growth since his Democratic Progressive Party took office in 2016.

    Lai said Taiwan faced a clear choice between closer cooperation with the U.S., Japan and Europe, or renewed economic dependence on China. The KMT did not immediately respond, though Hsiao said in Beijing that cross-strait cooperation served both sides’ interests.

    China has refused to engage with Lai, branding him a separatist, a charge he rejects, saying Taiwan’s future can only be decided by its people. Lai reiterated his willingness to hold talks with Beijing on the basis of equality and mutual respect.

    Sources: Reuters

  • CME margin increases drive sharp silver price rout

    The Lone Ranger began as a radio series in 1933 and later ran as a television show for 21 years until 1954. The story follows the last surviving Texas Ranger, who is nursed back to health by Tonto, a Potawatomi tribesman. Together, they ride across the American West on their horses, Silver and Scout, fighting injustice while financing their mission through a silver mine that supplies both income and ammunition.

    When the pair set off in pursuit of villains, the announcer famously cried, “Hi-Yo Silver, Away!” The show’s iconic theme music was written for the film The Lone Ranger and the City of Gold.

    On Friday, however, silver traders were echoing a very different refrain: “Hi-No Silver, Away!” Silver led a broad selloff across precious metals and related ETFs. The SLV ETF plunged 28.5%, while GLD fell 10.3%. Despite the steep losses, trading volumes did not point to a full-blown panic in either fund.

    Along with our colleague Michael Brush, we spent the morning reviewing the various explanations behind silver’s one-day bear market and gold’s sharp one-day correction. Early on Friday, the initial selloff may have been triggered by President Donald Trump’s nomination of Kevin Warsh to replace Jerome Powell as Federal Reserve chair. On the geopolitical side, reports that Iran is willing to negotiate with the U.S.—but only on terms Washington finds unacceptable—seem unlikely to have driven the rout.

    Later in the day, at 2:00 p.m. EST, CME Group announced another increase in maintenance margin requirements—the second hike in three days—taking effect after the market close on Monday, February 2. Maintenance margins were raised to 8% from 6% for gold, to 15% from 11% for silver, to 15% from 12% for platinum, and to 16% from 14% for palladium. Margins on copper were also increased.

    By announcing the margin increase ahead of Friday’s close, the CME effectively signaled to traders that any positions carried into the weekend would face substantially higher collateral requirements by Monday. This prompted many market participants to unwind positions in the final hours of Friday’s session, contributing to the sharp late-day acceleration in the price decline.

    As a result, we discount the various conspiracy theories circulating in the market, including suggestions that the move marks the beginning of another Hunt Brothers–style silver crisis like March 27, 1980, when silver prices collapsed from about $21 to below $11 in a single day.

    Notably, Warsh’s nomination should arguably have been supportive for precious metals, as he has favored boosting growth through lower interest rates and has downplayed the need for the Fed to be overly concerned about inflation at present.

    Friday’s December PPI report was also hotter than expected and, in theory, should have added to the bullish case for precious metals. Headline producer prices rose 0.5% month over month, while the core index increased 0.7%. On a year-over-year basis, headline and core PPI inflation climbed to 3.0% and 3.3%, respectively. The data suggest producers may be beginning to pass on higher costs from tariffs and a weaker currency further along the supply chain.

    We asked Michael Brush for an update on insider buying activity, and he said: “It’s still early, but so far corporate executives and directors have shown little interest in buying the recent market weakness. Their cautious stance remains in place. Buying by investors classified as insiders due to large holdings—10% owners—has increased slightly, but this type of activity is generally less meaningful as a market signal.”

    Sources: Ed Yardeni

  • JPM hikes gold price outlook on strong central bank and investor demand

    JPMorgan has lifted its year-end 2026 gold price forecast to $6,300 an ounce, pointing to sustained and strengthening demand from central banks and investors despite the recent bout of sharp price volatility.

    Gold and silver both saw steep pullbacks late last week after rapid rallies left prices overstretched, with the move partly driven by a rebound in the U.S. dollar. Even so, JPMorgan analysts said the broader environment continues to favor gold, arguing that the “longer-term rally momentum will remain intact” and that they remain “firmly bullish” over the medium term, supported by a structural diversification trend.

    A key factor behind the higher forecast is stronger-than-expected buying from the official sector. Central banks purchased around 230 tonnes of gold in the fourth quarter, taking total buying for 2025 to roughly 863 tonnes, even as prices moved above $4,000 an ounce. JPMorgan now expects about 800 tonnes of central bank demand in 2026, citing ongoing reserve diversification that still has room to run.

    Investor demand has also picked up, with analysts highlighting rising ETF holdings, solid physical bar and coin purchases, and broader portfolio allocations to gold as a hedge against macroeconomic and geopolitical risks.

    “Gold remains a dynamic, multi-faceted portfolio hedge, and investor demand has continued to exceed our previous expectations,” analysts led by Gregory Shearer wrote. “As a result, we now see sufficient demand from central banks and investors to push gold prices to $6,300 per ounce by the end of 2026.”

    While acknowledging the speed of the rally, the analysts dismissed concerns that prices are nearing unsustainable levels, noting that demand remains well above the historical threshold needed to keep the market tightening. “While the air gets thinner at higher price levels, we are not yet close to a point where the structural gold rally risks collapsing under its own weight,” they added.

    On silver, JPMorgan struck a more cautious tone following the metal’s sharp surge and subsequent pullback. Without central banks acting as consistent dip buyers, the analysts said they are “somewhat apprehensive” about the risk of a deeper near-term correction in silver relative to gold.

    Even so, they see a higher average price floor of around $75 to $80 an ounce, arguing that silver is unlikely to fully give up its recent gains. Over the longer term, JPMorgan expects higher prices to reshape fundamentals, gradually easing the supply-demand imbalance that underpinned silver’s recent rally.

    Sources: Vahid Karaahmetovic

  • European stocks pull back as busy week begins; precious metals keep sliding

    European stocks moved lower on Monday as a selloff in precious metals rattled investor sentiment at the start of a week packed with corporate earnings, central bank meetings, and key economic data.

    By 03:05 ET (08:05 GMT), Germany’s DAX was down 0.4%, France’s CAC 40 slipped 0.5%, and the U.K.’s FTSE 100 fell 0.6%.

    Investor sentiment pressured by further declines in precious metals

    Market sentiment was sharply dented on Monday as gold and silver extended their selloff, deepening losses from Friday’s rout. The nomination of Kevin Warsh as the next Federal Reserve chair sparked a strong rebound in the U.S. dollar, triggering widespread profit-taking and bringing an end to a rally that had pushed precious metals to record highs only days earlier.

    Spot gold slid just under 6% to $4,597 per ounce on Monday, after plunging nearly 10% on Friday—its steepest single-day decline since 1983.

    Silver, which had surged alongside gold on safe-haven demand and speculative inflows, also remained under heavy pressure following last Friday’s 30% collapse, marking its worst session since March 1980.

    Adding to investor unease, CME announced increases to margin requirements on several metals contracts effective from Monday’s market close, suggesting some traders may be struggling to meet margin calls and could be forced to sell liquid assets.

    Intesa Sanpaolo posts strong 2025 profit

    Shifting back to the corporate sector, another heavy week of quarterly earnings is ahead, with roughly 30% of the EuroSTOXX index’s market capitalization due to report results.

    Earlier on Monday, Intesa Sanpaolo (BIT: ISP) posted a 7.6% increase in 2025 net profit to €9.3 billion and unveiled plans to return €8.8 billion to shareholders through dividends and share buybacks, reinforcing its status as one of Europe’s most profitable banks.

    Meanwhile, Swiss lender Julius Baer (SIX: BAER) reported 2025 net profit of CHF 764 million, down 25% from the previous year but slightly above market expectations of CHF 679 million.

    In the U.S., attention this week will focus on technology heavyweights Alphabet (NASDAQ: GOOGL) and Amazon (NASDAQ: AMZN), especially as sentiment toward AI-related stocks has weakened after Microsoft (NASDAQ: MSFT) flagged rising costs from heavy AI investment, raising doubts over near-term returns.

    German retail sales edge up

    Data released earlier in the session showed that German retail sales increased by 0.1% in December from the previous month, improving from a 0.5% decline in November.

    Manufacturing activity figures for January are due later in the session for the eurozone and are expected to show a modest improvement, although remaining in contraction territory.

    Meanwhile, data released on Saturday indicated that China’s official manufacturing PMI fell further below the 50 threshold in January, signaling continued contraction in factory activity and underscoring ongoing weakness in domestic demand.

    Both the European Central Bank and the Bank of England are set to hold policy meetings this week, with each widely expected to leave interest rates unchanged.

    Oil falls as geopolitical risk premium fades

    Oil prices dropped sharply on Monday as fears of a potential U.S. strike on Iran eased after President Donald Trump said the Middle Eastern oil producer was “seriously talking” with Washington.

    Brent crude futures fell 4.8% to $65.97 a barrel, while U.S. West Texas Intermediate crude slid 5% to $61.91 a barrel.

    Oil prices had surged last week as markets priced in a higher risk of supply disruptions from the region, following repeated threats by Trump toward Iran over its nuclear program and ongoing domestic unrest.

    Those geopolitical risks appeared to recede after Trump’s comments over the weekend.

    Meanwhile, the Organization of the Petroleum Exporting Countries and its allies, known collectively as OPEC+, left output levels unchanged at their weekend meeting, in line with expectations.

    Sources: Peter Nurse

  • Global markets update: Futures retreat, gold continues sliding, Bitcoin nudges down

    U.S. stock index futures edge lower as a sharp selloff in gold and silver weighs on investor sentiment ahead of a packed week of major corporate earnings and key economic releases. Bitcoin continues to slide after dropping below $80,000 over the weekend. Elsewhere, Oracle signals plans for fresh fundraising, while speculation over potential executive changes at Walt Disney grows ahead of its upcoming quarterly results.

    Futures edge lower

    U.S. equity index futures moved lower on Monday, pointing to a continuation of last session’s losses at the start of the new trading week.

    As of 03:11 ET (08:11 GMT), Dow futures were down 323 points, or 0.7%, S&P 500 futures had declined 62 points, or 0.9%, and Nasdaq 100 futures were lower by 291 points, or 1.1%.

    Market participants are closely watching a heavy slate of upcoming corporate earnings alongside a new monthly jobs report. Together, these releases could shed light on the health of the U.S. economy and test the resilience of a stock market rally now in its fourth year.

    Beyond ongoing questions over the durability of the artificial intelligence-driven rally, investors are also weighing the implications of President Donald Trump’s nomination of Kevin Warsh as the next Federal Reserve Chair. If confirmed by the Senate, Warsh would bring his long-held calls for a shift in the monetary policy framework to the world’s most influential central bank.

    Gold and silver extend their selloff

    A sharp decline in both gold and silver, continuing the historic drop seen on Friday, weighed heavily on market sentiment—especially in Asia, where equities broadly fell.

    Following a nearly 10% plunge late last week, spot gold fell another 4.9% to $4,626.80 per ounce by 03:27 ET, slipping well below the $5,000 mark it had just recently surpassed. Silver, which had benefited from speculative interest and industrial demand, also faced selling pressure but had somewhat stabilized around $79 an ounce as of 03:30 ET.

    Analysts attribute the metals’ losses to a stronger U.S. dollar and widespread profit-taking after their significant rally in recent months.

    Investors also showed concern about Kevin Warsh’s potentially hawkish stance in the long term. Although Warsh—formerly a Federal Reserve governor—has supported President Trump’s calls for sharply lower interest rates, he has been critical of the Fed’s asset purchase programs.

    “Warsh is viewed as the most inflation-focused candidate for the Fed chair, reducing the chances of aggressive monetary easing. This sparked a wave of selling, with gold enduring its steepest decline in four decades,” ANZ analysts noted.

    Bitcoin continues to decline

    The risk-averse mood extended to cryptocurrencies, with Bitcoin dropping over 2% to $76,892.4. On Saturday, the leading digital currency fell below the $80,000 mark, continuing its decline from Friday. Some investors worried that Kevin Warsh might support shrinking the Federal Reserve’s balance sheet, which could reduce liquidity in the financial system.

    Larger Fed balance sheets have historically supported cryptocurrencies by injecting cash into money markets, providing backing for riskier assets.

    This latest slide marks another downturn for Bitcoin since reaching its all-time high last October. Once buoyed by optimism over increased cash flows and a friendlier regulatory environment under Trump, the token has now lost about one-third of its value.

    With turmoil spreading across stocks, commodities, and crypto, Jonas Goltermann, Deputy Chief Markets Economist at Capital Economics, described the past few days as “unusually hectic […] for financial markets” in a recent note.

    Oracle announces plans for new fundraising

    On Sunday evening, Oracle Corporation announced plans to raise new capital in 2026 to support the expansion of its AI and cloud infrastructure amid rising demand for computing power.

    The company aims to generate between $45 billion and $50 billion in gross proceeds during 2026, utilizing a mix of debt and equity financing.

    About half of the funds will come from a combination of equity derivatives and common stock, according to a company statement.

    Oracle plans to raise its debt funding through a single, one-time issuance of investment-grade senior unsecured bonds in early 2026, with no additional debt expected afterward.

    Analysts at Vital Knowledge highlighted that roughly half of the total funding will come from equity-linked securities, including a $20 billion at-the-market (ATM) common equity program.

    They noted, “Oracle’s $20 billion ATM offering is the first time a major tech company has been compelled to raise equity since the AI boom began. If this signals a shift toward greater fiscal caution in the industry, it could lead to a slower overall pace of spending.”

    Disney set to release earnings

    Walt Disney is set to release its earnings before the opening bell on Monday.

    While the company’s continued focus on its streaming services, alongside its vital parks and studios divisions, will be closely watched, much of the attention may center on leadership succession.

    According to the Wall Street Journal, Disney CEO Bob Iger has informed colleagues that he intends to step down and reduce his day-to-day involvement before his contract expires on December 31.

    Board members are expected to convene soon to decide on Iger’s successor, with several media outlets naming Experiences division head Josh D’Amaro as the likely frontrunner.

    Sources: Scott Kanowsky

  • Weekly FX Outlook: EUR/USD, Crude Oil, Bitcoin, Silver & Gold

    Fundamental Analysis & Market Sentiment

    Last week’s best trade ideas were as follows:

    • Long EUR/USD after a daily close above 1.1866, resulting in a 0.24% loss.
    • Long Silver, which ended with a loss of 18.62%.
    • Long Gold after a daily close above $5,000, producing a 2.26% loss.

    Taken together, these positions generated a total loss of 21.12%, or 7.04% per asset. While this was a sizable drawdown, the broader performance of my weekly forecasts over recent weeks remains positive, as earlier gains were exceptionally strong and more than offset this setback.

    Key market data from last week:

    • U.S. Federal Reserve policy meeting: No surprises, with interest rates left unchanged.
    • U.S. Producer Price Index (PPI): The standout data release of the week. Inflation came in far hotter than expected, with headline PPI rising 0.5% month-on-month and core PPI increasing 0.7%, versus forecasts of just 0.2% for both. This reinforced a more hawkish Fed outlook, lifted the U.S. dollar, and accelerated the sharp reversal in Silver (and Gold). As a result, expectations for a second U.S. rate cut in 2026 were pushed back to October.
    • Bank of Canada policy meeting: No change to interest rates, as anticipated.
    • Australian CPI: Inflation exceeded expectations, with an annual rate of 3.8% versus 3.5% forecast, strengthening the case for possible RBA rate hikes and supporting the Australian dollar early in the week.
    • Canadian GDP: Slightly weaker than expected, showing zero month-on-month growth.
    • U.S. unemployment claims: In line with forecasts.

    While PPI and Australian inflation influenced market moves, two broader developments likely had an even greater impact:

    • Federal Reserve leadership: President Trump announced his nominee for the next Fed Chair, Kevin Warsh. Although regarded as a hawk, Warsh is now thought to favor lower interest rates. The nomination contributed to the collapse of the Silver rally and provided additional support to the U.S. dollar.
    • Geopolitical tensions: The U.S. continued its military buildup near Iran, raising the risk of a wider regional conflict. Polymarket currently assigns a high probability to a U.S. strike on Iran in March, despite President Trump still referencing the possibility of a diplomatic agreement. These tensions appear to be supporting crude oil prices, with WTI crude reaching a new four-month high last week.

    Meanwhile, the S&P 500 briefly pushed to a fresh record above 7,000. Although the index remains resilient, upside momentum is limited. In my view, a clearer resolution to U.S.–Iran tensions is needed before a more decisive directional move can develop.

    The Week Ahead: 2nd – 6th February

    The most significant data releases for the coming week, ranked by expected market impact, include:

    • U.S. Average Hourly Earnings and Non-Farm Payrolls
    • Preliminary University of Michigan Inflation Expectations
    • European Central Bank main refinancing rate decision and monetary policy statement
    • Bank of England official bank rate decision, voting breakdown, and monetary policy report
    • Reserve Bank of Australia cash rate decision, rate statement, and monetary policy statement
    • U.S. JOLTS job openings
    • Preliminary University of Michigan consumer sentiment
    • U.S. ISM services PMI
    • U.S. ISM manufacturing PMI
    • U.S. unemployment rate
    • New Zealand unemployment rate
    • Canadian unemployment rate
    • U.S. weekly unemployment claims

    This will be a particularly busy and potentially market-moving week, with three major central banks delivering policy decisions. Please note that Friday is a public holiday in New Zealand, which may reduce liquidity in related markets.

    Monthly Forecast February 2025

    For the month of January 2026, I forecasted that the USD/JPY currency pair would rise in value. Unfortunately, this was a losing trade.

    For the month of February, I forecast that the EUR/USD currency pair will rise in value.

    Weekly Forecast 2nd February 2026

    Last week, three currency crosses experienced unusually high volatility, prompting the following weekly trade forecasts:

    • Short NZD/JPY, which resulted in a 0.57% loss.
    • Short AUD/JPY, ending with a 0.32% loss.
    • Short NZD/CAD, producing a 0.39% loss.

    Overall, the Swiss franc and the New Zealand dollar emerged as the strongest major currencies of the week, while the U.S. dollar was the weakest. Market conditions were relatively subdued, with directional volatility dropping sharply—only 11% of major currency pairs and crosses moved by more than 1% over the week.

    Technical Analysis

    Key Support/Resistance Levels for Popular Pairs

    US Dollar Index

    Last week, the U.S. Dollar Index formed a notably large bullish pin bar, rejecting a fresh four-year low. On its own, this price action is bullish. However, the broader technical structure remains bearish, with the index still trading below its levels from 13 and 26 weeks ago. As a result, the technical outlook for the U.S. dollar is mixed.

    The nomination of Kevin Warsh as Federal Reserve Chair provided some support to the dollar during the week. Nevertheless, the forward outlook remains uncertain, and I believe the most attractive trading opportunities in the near term are likely to be independent of U.S. dollar direction.

    EUR/USD

    The EUR/USD pair recently staged a strong long-term bullish breakout as the U.S. dollar accelerated lower and printed a new 3.5-year low. However, the move quickly failed, with price retreating sharply and finding minimal follow-through support.

    This price action suggests the breakout may have been a temporary spike, although the potential for a sustained bullish trend should not be dismissed, as EUR/USD has historically shown a tendency to trend cleanly once momentum is established.

    That said, the appointment of a new Fed Chair and the renewed strength in the U.S. dollar late in the week—driven by hotter inflation data—argue for a more cautious stance.

    Accordingly, I would only consider a long position following a daily (New York close) above 1.2039.

    WTI Crude Oil

    WTI crude oil has surged strongly in recent sessions as the risk of a regional conflict centered on Iran has intensified. Prediction markets are currently assigning a high probability to a U.S. strike on Iran in March, a scenario that could significantly disrupt global crude supply. Against this backdrop, prices pushed to a new four-month high by the end of last week, with a daily close above $66.25 marking a potential six-month high.

    However, two important cautions should be noted:

    • While a daily close above $66.25 would typically attract trend-following buying, the current moving average structure does not confirm a bullish setup. Even in the event of military conflict, the move could prove to be a short-lived spike, especially if a rapid U.S. victory follows, potentially resulting in a failed breakout.
    • Unlike recent Democratic administrations, the Trump administration is likely to take aggressive steps to suppress crude oil prices, which could cap or reverse upside momentum.

    Bitcoin

    BTC/USD has finally completed a decisive bearish breakdown below the long-term support zone just above $81,000. Price is now firmly established beneath this level and has pushed to a new nine-month low, a development that is technically significant and clearly bearish.

    While equities and precious metals have rallied strongly in recent months, Bitcoin peaked at a record high several months ago and has since trended steadily lower. This divergence highlights a broader downturn across the crypto sector, with Bitcoin now showing clear signs of structural weakness.

    Despite early expectations that Bitcoin would fundamentally reshape global finance, real-world adoption remains limited outside parts of Africa. Practical usability is still constrained, and its underlying value proposition remains uncertain.

    Although I generally avoid short-selling, Bitcoin appears entrenched in a long-term bearish trend. I would not consider buying at current levels. Short positions may be worth considering, but only with strict risk management, as shorting is best suited to experienced traders.

    XAG/USD

    Silver experienced an exceptionally volatile week, surging more than 15% to hit a new all-time high and the long-discussed $120 options target, before suffering a dramatic reversal. The sell-off unfolded sharply on Thursday and Friday—particularly Friday—when prices plunged 28% in a single session.

    I had previously cautioned that the move was highly vulnerable to a sharp correction, and that while a long position was justified, it should be taken with a reduced position size.

    The sheer magnitude of the collapse, even with some bullish undertones and modest resilience in the bounce from the weekly lows, strongly suggests that another record high is unlikely in the near term. This extraordinary rally appears to be finished, and the most probable next phase is a period of erratic consolidation, marked by large swings and gradually diminishing volatility.

    XAU/USD

    Much of the analysis above regarding Silver also applies to Gold. That said, gold’s volatility was noticeably lower, and its price action showed greater resilience at the lows.

    While gold is also likely to enter a period of sideways consolidation, the underlying structure suggests it may recover to the upside more quickly than silver.

    Bottom Line

    My preferred trade for the coming week is:

    • Long EUR/USD, contingent on a daily (New York) close above 1.2039.

    Sources: Adam Lemon

  • Silver price outlook: XAG/USD finds near-term support above $70 ahead of US NFP week

    Silver prices are struggling to regain momentum after a sharp selloff on Friday. The metal came under heavy pressure as a stronger US Dollar—boosted by Kevin Warsh’s nomination as the next Federal Reserve Chair—combined with profit-taking to trigger a steep decline.

    Market participants are now turning their attention to the upcoming US Nonfarm Payrolls report for fresh clues on the Federal Reserve’s monetary policy outlook.

    Silver (XAG/USD) is trading cautiously around $80 during the Asian session at the start of the week, holding slightly above Friday’s fresh four-week low of $73.33. The white metal is attempting to stabilize after last week’s sharp selloff, during which it shed more than 30% from its record high of $121.66. The decline was driven by a stronger US Dollar, profit-taking following a strong rally, and expectations of a more hawkish Federal Reserve policy outlook.

    From a technical perspective, the firmer US Dollar continues to undermine Silver’s risk-reward profile. At the time of writing, the US Dollar Index, which measures the Greenback against six major currencies, remains near its weekly high at around 97.33.

    The US Dollar drew strong support on Friday after the White House nominated former Federal Reserve Governor Kevin Warsh to succeed Jerome Powell as Fed Chair. Analysts see Warsh’s nomination as preserving the central bank’s independence, countering earlier concerns sparked by President Donald Trump’s repeated comments that the next Chair would deliver additional rate cuts.

    Warsh is known for favoring a strong US Dollar during his previous tenure at the Fed, suggesting monetary conditions could remain relatively tight going forward.

    Looking ahead, investor focus will turn to the US Nonfarm Payrolls report for January, which is expected to play a key role in shaping expectations for the Federal Reserve’s future policy path.

    Silver technical analysis

    On the daily chart, XAG/USD is trading around $81.38, holding above the rising 50-day Exponential Moving Average near $79.50 and preserving the medium-term uptrend. The upward slope of the moving average continues to underpin the broader bullish bias. Meanwhile, the Relative Strength Index sits near 44, in neutral territory, reflecting a cooling in momentum after a previously overbought phase.

    As long as prices remain supported above the 50-day EMA, pullbacks are likely to attract initial buying interest around that dynamic level. However, the RSI’s position below 50 limits near-term upside, with a recovery above the midline needed to strengthen bullish momentum. If momentum stabilizes, buyers may look to extend the rebound, while a failure to regain traction could keep price action range-bound or tilt risks to the downside.

    Sources: Fxstreet

  • Oil prices tumble more than 3% on U.S.-Iran talks as OPEC+ keeps output steady.

    Oil prices slid sharply in Asian trading on Monday after reports of talks between the U.S. and Iran reduced some of the geopolitical risk premium in crude, while traders also took profits following recent gains.

    The decline came after the Organization of the Petroleum Exporting Countries and its allies (OPEC+) kept output levels unchanged at a weekend meeting, in line with expectations.

    Brent crude futures for April delivery plunged 3.3% to $67.07 a barrel by 20:31 ET (01:31 GMT).

    Oil had climbed to near six-month highs last week amid fears of increased U.S. military action against Iran, while severe cold weather in North America was also seen as a threat to supply. However, prices came under pressure on Monday as traders moved to lock in profits.

    Crude was further weighed down by a rebound in the U.S. dollar from recent four-year lows, after the greenback strengthened following President Donald Trump’s nomination of Kevin Warsh as the next Federal Reserve chair.

    Trump says Iran is in “serious talks” with the U.S.

    U.S. President Donald Trump said over the weekend that Iran was engaged in “serious talks” with his administration, raising the prospect of a possible easing of tensions between the two countries.

    His remarks followed statements from Iranian officials indicating that preparations were underway for negotiations with Washington.

    Trump has repeatedly warned of potential military action against Iran amid disputes over its nuclear program and domestic unrest, and has ordered the deployment of U.S. naval forces to the Middle East.

    The move heightened fears of renewed U.S. strikes on Iran, raising the risk of further geopolitical instability in the Middle East and potential disruptions to regional oil supply. Crude prices surged as markets factored in a higher geopolitical risk premium.

    Escalating tensions, alongside recent weather-related disruptions in the United States, helped lift oil prices despite lingering concerns over weak global demand and the possibility of an oversupplied market in 2026.

    More recently, a significant production outage in Kazakhstan has also provided support to oil prices.

    OPEC+ keeps output levels unchanged

    OPEC+ on Sunday kept its oil output for March unchanged, reinforcing its decision to pause further production increases despite a recent rise in crude prices.

    The group has raised output by roughly 2.9 million barrels per day through 2025, but announced an open-ended halt to additional hikes in November, after oil prices fell by around 20% over the past year.

    OPEC+ also offered no forward guidance on production, likely reflecting elevated uncertainty surrounding the global economic outlook and ongoing geopolitical risks.

    Sources: Investing

  • How does a weaker dollar affect gold and Bitcoin?

    Gold and Bitcoin have diverged sharply in recent months, with Yardeni Research arguing that currency movements are becoming a key driver of that split.

    In its latest report, the firm revisited the long-standing question of whether Bitcoin can be considered “digital gold,” pointing out that both assets are difficult to value since neither generates interest or dividends. However, Yardeni cautioned that Bitcoin’s purely digital form could make it “potentially vulnerable someday to hacking by quantum-computing algorithms,” whereas gold’s main drawback is the need for physical storage.

    Bitcoin’s volatility has persisted. Yardeni noted that the cryptocurrency surged to a record near $125,000 in late 2025 before retreating toward $90,000.

    Gold, by contrast, has been in a strong uptrend since it “decisively broke out” in March 2024. Prices have climbed roughly 2.5 times since then, moving above $3,000 an ounce in early 2025. The firm maintains its long-term outlook that gold could reach $10,000 by the end of the decade.

    According to Yardeni Research, recent currency shifts are widening the gap between the two assets. The firm said a weaker U.S. dollar tends to hurt Bitcoin because it lowers Bitcoin’s value in other currencies, potentially encouraging foreign investors to sell. Some of those flows, it suggested, may be rotating into gold instead.

    In addition, a softer dollar can put upward pressure on U.S. inflation, which would further support gold prices. Yardeni also noted that dollar weakness generally favors U.S. investors in overseas markets, reinforcing its overweight stance on emerging-market equities.

    Sources: Investing

  • Weekly Forex & Markets Outlook: WTI Crude, GBP/USD, EUR/USD, DAX, Gold, Silver, USD/JPY, USD/CHF

    WTI Crude Oil

    The $66 level in WTI crude oil has proven to be a notable resistance zone, and prices are now retreating from that area. There is considerable uncertainty in the market over whether potential strikes against Iran could occur over the weekend, adding a layer of geopolitical risk.

    Even so, underlying supply-and-demand dynamics remain a significant constraint on price action. As a result, large, sustained moves appear unlikely, and the prevailing strategy may continue to favor selling into rallies rather than chasing upside momentum.

    British Pound

    The British pound pushed above the 1.3750 level, but buying momentum now appears to be fading as selling pressure shows signs of exhaustion. Notably, the weekly candlestick resembles a shooting star, a pattern that often signals difficulty in sustaining further gains.

    From here, a pullback could see GBP/USD slide toward the 1.35 area, a major round number with strong psychological significance. Part of this shift in sentiment may be tied to Kevin Warsh’s nomination as the next Federal Reserve Chair, as his comparatively hawkish stance has strengthened expectations for tighter U.S. monetary policy, weighing on the pound.

    EUR/USD

    The euro staged a strong rally earlier in the week but then reversed sharply after the initial upside move. This price action suggests the market may be entering a period of consolidation, raising the possibility that the recent breakout was a false move.

    Much will depend on how traders respond to the nomination of the new Federal Reserve Chair. For now, the euro appears to be losing momentum. On the downside, the 1.16 level could come into play. However, if buyers step back in quickly over the coming week, the pair could regain strength and push higher, potentially revisiting the 1.20 area, with a further extension toward 1.23 if bullish momentum builds.

    DAX

    The German DAX has spent most of the week in negative territory but continues to hold above the 24,500 level, an area that has become important support after previously acting as resistance. This ability to stabilize at a former breakout zone suggests underlying buying interest remains intact.

    Overall, the index appears to be in the process of bottoming and potentially turning higher, with scope for a renewed push to the upside. Looking further ahead, the outlook remains constructive. Ongoing fiscal support and heavy government spending in Germany should provide a tailwind for equities, leading to expectations that the DAX could be among the stronger-performing indices this year. As a result, the broader bias remains bullish.

    Silver

    Silver has become the focal point of market discussion after an extraordinary week of price action. After surging to around $122, the metal suffered a dramatic reversal, ending Friday in what can only be described as a sharp selloff.

    In a single session, silver plunged below the $90 level, and momentum now suggests a potential move toward $80. After such an extreme rally, a correction was inevitable, and the market now appears to be experiencing that long-overdue pullback.

    The selloff was likely exacerbated by the nomination of a more hawkish-than-expected Federal Reserve Chair, adding pressure to precious metals. Even in normal conditions, silver is known for its volatility, and the current environment has only amplified those swings. For now, price action has become exceptionally unstable, making silver largely untradeable for many participants.

    Gold

    Gold has been hit hard as well, but unlike silver, it benefits from strong central bank support, which should help it recover more quickly. Silver had moved so far beyond its fundamental norms that it began to resemble the kind of speculative excess often seen in smaller cryptocurrencies.

    Gold, by contrast, continues to attract substantial institutional and central bank demand. That said, it is possible the market has already set a peak, although it may be too soon to say so definitively. Given the way trading unfolded on Friday, it is difficult to ignore the risk of continued downside follow-through.

    Still, considering that gold was trading near $1,700 just two years ago, some form of correction was inevitable. When markets become stretched and overheated, this kind of reset is ultimately unavoidable.

    USD/JPY

    The U.S. dollar initially sank sharply against the Japanese yen over the week, but that move has since reversed decisively. The rebound suggests markets may be reassessing what now appears to have been an overly aggressive bet against the dollar.

    Given the significant interest rate differential between the two currencies, this type of recovery is broadly in line with how the pair might be expected to trade. Technically, USD/JPY found support at the 50-week EMA, and if prices can reclaim the 155 level, the next upside target could be a move toward 158 yen.

    USD/CHF

    The U.S. dollar declined sharply against the Swiss franc, briefly testing the 0.76 level. While that price point may not be especially significant on its own, it does raise the possibility of Swiss National Bank intervention if franc strength becomes excessive—a risk that remains in the background.

    Technically, the pair appears to be forming a hammer pattern following the breakdown, and more importantly, the U.S. dollar has begun to strengthen more broadly across global markets. Taken together, these factors suggest USD/CHF could be setting up for a rebound in the near term.

    Sources: Christopher Lewis

  • WTI Crude Weekly Outlook: Gradual Gains as Speculative Buying Emerges

    WTI crude oil has delivered two consecutive weeks of gains, giving day traders a favorable backdrop, and closed the weekend trading near $65.73. Prices at this level were last seen in the final week of September.

    The previous period when WTI consistently held at similar elevated levels was from mid-June through the end of July 2025. While crude has traded higher at times since then, the notable development for technical traders is the growing durability of the current upward momentum.

    From a chart perspective, support around $60.00 per barrel remained intact throughout the past week and began to demonstrate strength as early as Friday, January 23. As the new trading week gets underway, this technical stability may encourage renewed speculative buying, with some traders positioning for further upside in WTI prices.

    Volatility and Turmoil Mark Commodity Markets Over the Past Week

    In reality, WTI crude oil has remained relatively orderly, particularly given the absence of any extreme or destabilizing price swings. While the commodity did move higher, the advance was measured rather than explosive.

    On Tuesday, WTI rose from the mid-$60 range to around the mid-$62 level, showing early signs of upward pressure. By Wednesday, prices continued to firm, reaching the mid-$63 area. Momentum strengthened further into Thursday and Friday, when price action clearly accelerated to the upside, reinforcing the constructive tone in crude oil trading.

    By comparison with the turmoil seen in metals markets—and even in soft commodities such as cocoa and coffee—WTI crude oil has remained relatively restrained. Whether that composure will persist is an open question.

    Commodity markets often experience bursts of speculative intensity in cycles, yet WTI has been notably subdued over the past several months. That said, the prolonged bearish trend, marked by steadily declining prices, appears to have paused and reversed, with crude moving higher over the last two weeks.

    While geopolitical risks tied to Iran remain in the background, they are unlikely to be the primary driver behind the recent upside move in WTI prices.

    Iran, Venezuela, and Shifting Dynamics in the Global Energy Market

    Few things dominate markets like noise, with well-intentioned commentary offering countless explanations for sudden price moves in commodities. Weather events, wars, politics, trade agreements—even trivial anecdotes—are all quickly cited as causes. But the question remains: how many of these explanations actually reflect the true drivers behind price changes?

    • Commodity traders are highly seasoned, and major market participants operate with extensive intelligence gathered over months and even years. They work within long-term outlooks, but there is also one unavoidable factor: speculation.
    • At times, commodities move quickly simply because large orders enter the market and collective sentiment shifts. WTI crude oil is no exception to these forces. Over the past two weeks, buying interest in the energy sector has clearly increased.
    • Is this driven by speculative positioning, concerns about potential instability in the Middle East, or a blend of both? Beyond those considerations, fundamentals such as supply and demand also play a role—and by most measures, they remain relatively strong.

    WTI Crude Oil Weekly Outlook: Market Poised After Recent Stabilization

    The speculative trading range for WTI crude oil is seen between $59.20 and $70.10.

    WTI has clearly pushed higher, with the $60.00 level and the mid-$60s now appearing to act as near-term support. As the new week begins, the key question is whether the $65.00 area can hold and establish itself as a more durable floor. Broader commodity markets have displayed renewed strength across several sectors in recent weeks.

    The sharp advance in WTI may seem sudden, but it reflects a noticeable return of buying interest. Seasoned traders know crude oil has sustained higher price levels in the past, and its ability to post and maintain incremental gains has been evident over the last two weeks.

    That said, risk management remains critical when trading WTI. Price reversals can occur quickly, and without disciplined controls, such moves can result in significant losses for speculative traders.

    Sources: Robert Petrucci

  • Alamos CEO says gold prices may approach $6,000 by year-end

    Gold prices climbed to a new record above $5,600 an ounce this week, as persistent economic and geopolitical uncertainty continued to push investors toward traditional safe-haven assets.

    The metal is up more than 17% so far this year, building on last year’s strong advance. Gold’s sustained rally has been driven by a combination of heightened global uncertainty, expectations of lower U.S. interest rates, and consistent purchases by central banks as part of a broader move to diversify away from the U.S. dollar.

    Market anxiety has intensified in recent days after President Donald Trump said he intends to impose new tariffs on imports from South Korea, while concerns over a potential partial U.S. government shutdown re-emerged ahead of the January 30 funding deadline.

    Following bullion’s surge to record highs, Investing.com spoke with John McCluskey, chief executive of Canadian miner Alamos Gold (NYSE: AGI), to explore the factors behind the rally and his outlook for gold prices over the rest of the year.

    To what extent is today’s gold price driven by long-term structural demand, as opposed to short-term momentum and fear of missing out (FOMO)?

    McCluskey noted that gold prices are currently strongly underpinned by sustained central bank purchases from at least six countries, including China, Russia, and their trading partners. This long-term structural demand has steadily pushed gold higher over the past decade, with prices hitting a new peak above $5,000 this week.

    That rise has increasingly drawn in retail investors. According to fund managers, gold funds are experiencing record inflows, which is boosting both bullion prices and gold equities. Overall, structural demand remains the primary driver of current prices, but it has now spilled over into momentum-driven buying from retail investors.

    How much does gold’s outlook hinge on additional U.S. interest rate cuts, and what would be the impact if the easing cycle ends earlier than markets anticipate?

    “While U.S. Fed rate cuts may play a role, I don’t think gold’s outlook hinges on further easing, as prices have been—and continue to be—strongly supported by central bank buying. This trend has been in place for around a decade, and I believe there is still plenty of upside, with or without rate cuts,” McCluskey said.

    Would a potential easing of global geopolitical tensions be sufficient to trigger a significant pullback in gold prices?

    “While de-escalation could weigh on gold prices, there are numerous other tailwinds supporting the market, and I don’t see those trends fading anytime soon,” McCluskey told Investing.com.

    “I expect gold prices to continue rising. And it’s not just gold mining CEOs saying this—chief executives at major banks are also pointing to a stronger gold outlook,” he added.

    What is your outlook for gold prices by year-end?

    I believe the fundamental drivers supporting gold remain firmly in place, pointing to a sustained bull market. With retail investors only now beginning to participate, gold could consolidate around the current $5,000 level and potentially move toward analysts’ year-end targets in the $5,400–$6,000 range.

    Despite hitting record highs earlier in the week, precious and industrial metals retreated on Friday, as gold, silver, and copper declined amid profit-taking. The pullback followed a reassessment of expectations for aggressive U.S. interest rate cuts, alongside a stronger dollar.

    Spot gold slid more than 6% to $5,042 by 10:55 ET (15:55 GMT).

    The dollar gained after President Donald Trump announced former Federal Reserve Governor Kevin Warsh as his choice to lead the central bank, boosting the greenback against major currencies.

    Sources: Investing

  • Copper in an Electrified World

    Over the past year, market focus has largely centered on gold and silver, with investors weighing safe-haven demand, central bank purchases, and inflation concerns. Meanwhile, copper has been quietly revaluing. So far this year, copper is up about 4%, following a roughly 40% surge in 2025. Analysts increasingly warn that copper demand could exceed supply within the next decade.

    Introduction

    When Thomas Edison brought electricity to cities in the late 1800s, copper was essential for carrying power from generating stations to homes, factories, and public lighting. Over time, it has become a cornerstone of modern economies, deeply integrated into energy networks, industrial activity, transportation, and communications. Today, its role is more critical than ever.

    Copper now underpins electrification, AI infrastructure, electric vehicles, and defence systems. Yet the pace and scale of this shift are pushing the limits of global supply. According to S&P Global, without substantial new investment, the world could face a copper deficit of roughly 10 million metric tons by 2040.

    Copper’s record-high prices point to a fundamental shift in demand dynamics.

    At the start of the year, copper prices reached new record highs on the London Metal Exchange (LME), climbing to $13,407 per metric ton. So far this year, copper is up about 3%, building on a strong rally of roughly 40% in 2025.

    Historically, copper has behaved as a cyclical commodity, moving in step with global economic growth, especially construction and manufacturing. In past upswings, prices typically weakened once growth cooled or inventories were replenished. This time, though, the forces supporting demand look wider in scope and more enduring.

    A growing proportion of copper use is now tied to long-term electrification trends that are far less sensitive to short-term economic cycles.

    From the demand side, copper is indispensable as an electrical conductor. It allows efficient power transmission, resists corrosion, has inherent antimicrobial properties, and can be recycled repeatedly without losing performance. Viable substitutes are scarce. Aluminium is often mentioned as an alternative, but with only about 60% of copper’s conductivity, it requires thicker cables to deliver the same current and typically needs extra insulation because it dissipates heat less effectively.

    S&P Global projects that global copper demand will rise by roughly 50% by 2040, increasing from about 28 million metric tons today to around 42 million. This expansion is being driven by four key forces: baseline economic demand, the energy transition and new capacity build-out, AI and data centres, and defence modernisation.

    While traditional economic uses and energy-transition applications are expected to remain the dominant sources of growth, Asia is likely to account for around 60% of the additional demand.

    Around three-quarters of global copper demand comes from electrical uses, including power generation, transmission and distribution, electronics, and electrical equipment. Construction remains the largest single end-market, with copper heavily used in building wiring, plumbing, heating and cooling systems, and renovation projects. This provides a relatively stable foundation for demand, even when economic growth slows.

    The energy transition adds another powerful layer of demand. As transport and power systems become increasingly electrified, copper usage is rising across the economy. Electric vehicles are a key driver of this shift, as they contain nearly three times as much copper as internal combustion engine vehicles—about 2.9 times more—reflecting the added requirements for wiring, batteries, power electronics, and electric motors.

    More recently, AI and data centres have become a rapidly expanding source of copper demand. S&P Global estimates that copper consumption from data centres could increase from about 1.1 million metric tons in 2025 to roughly 2.5 million metric tons by 2040. Much of this growth reflects the copper needed for internal power distribution, cooling infrastructure, and the grid connections that supply these facilities. By the end of the decade, AI training data centres alone are expected to represent more than half of total data-centre-related copper demand.

    Beyond these established drivers, emerging technologies may provide additional upside. Humanoid robotics is still in its early stages, but it is relatively copper-intensive. A single humanoid robot typically contains between 4 and 8 kilograms of copper, used across motors, actuators, wiring, sensors, batteries, and semiconductors. Even modest adoption scenarios could therefore have a meaningful impact on demand.

    Defence is another area where copper consumption is set to rise. Heightened geopolitical tensions and the modernisation of military capabilities are leading to higher defence spending and quicker deployment of advanced technologies. Copper is extensively used in military equipment and infrastructure due to its conductivity, durability, and reliability in electrical systems, communications, and propulsion.

    Given copper’s strategic role, much of this investment is relatively insensitive to price. At the 2025 NATO summit in The Hague, member states committed to lifting defence spending to 5% of GDP. As a result, annual copper demand from defence applications is expected to approach 1 million metric tons by 2040—around three times current levels.

    A Constrained and Rigid Supply Landscape

    While global demand continues to rise, supply is expected to stay tight as existing mining assets age. Without substantial additions to capacity, the market could face a shortfall of roughly 10 million metric tons by 2040.

    Bridging this gap will be one of the major challenges of the coming decades, as the supply response is both complex and structurally limited. Substitution offers little relief, given copper’s unmatched conductivity, durability, and recyclability.

    Over time, mine depletion has made copper extraction more technically difficult and more expensive, while producers are also contending with tighter regulation and rising environmental and social opposition from local communities.

    These vulnerabilities have already led to repeated supply disruptions. Freeport-McMoRan has declared force majeure at its Grasberg mine—the world’s second-largest copper operation, accounting for roughly 4% of global output—with a full recovery not expected until 2027. Disruptions are also set to continue this month following strikes at Capstone Copper’s Mantoverde mine in Chile.

    Source: Morgan Stanley

    Bringing new copper projects online is a lengthy process, typically taking close to two decades—around 17 years—from initial discovery to first production, reflecting regulatory, environmental, political, and cost hurdles. Even so, today’s price levels do not provide strong enough incentives to develop major new deposits by 2040. Most high-quality, easily accessible resources have already been exhausted or are currently in production.

    This underscores the importance of maximising output from existing mines, improving operational efficiency, and simplifying permitting processes and incentive structures for new developments. Future supply growth will increasingly rely on deeper exploration, which is both more expensive and technically challenging. Although several deposits have been identified that could theoretically help meet future demand, many are unlikely to be developed because they are not viable under current prices or with existing technologies.

    Secondary supply from recycling offers an important supplementary source but cannot fully bridge the gap. Unlike many other metals, copper retains its key properties when recycled, making recycled material virtually indistinguishable from newly mined copper. As copper use expands across the economy, more scrap will become available as equipment and infrastructure reach the end of their life cycles.

    End-of-life copper waste is expected to grow by about 4% annually, surpassing 15 million metric tons by 2040. S&P Global estimates that if recycling rates increase from 50% in 2025 to 66% by 2040, recycled copper from end-of-life sources could add roughly 6 million metric tons to total supply.

    The expansion of recycling hinges on more efficient collection and processing systems. While scrap supply is more flexible than mined output, policy support will be critical to scaling recycling globally. Regions such as the United States, the European Union, and China have already implemented measures to set recycling targets or invest in supporting infrastructure.

    These initiatives are designed to boost secondary copper supply while lowering environmental impacts. Even with significant gains in processing efficiency, recycling is expected to account for at least one-third of total copper supply by 2040.

    Meanwhile, smelting and refining are heavily concentrated in China, making them a strategic chokepoint in the global supply chain. China controls a large share of global smelting capacity—around 12 out of 29 million metric tons worldwide—and continues to expand this position, further increasing industry concentration.

    Processing margins are coming under growing pressure as treatment and refining charges decline, while costs and regulatory burdens vary widely by region. At the same time, the high concentration of capacity—estimated at around 40–50% of the global total—adds to systemic fragility and increases exposure to geopolitical disruptions.

    For these reasons, governments increasingly view mineral supply chains as strategically vital. New models of international cooperation, along with greater participation by sovereign wealth funds, are emerging as alternative ways to strengthen and diversify access to critical minerals and reduce reliance on China-centric supply chains.

    Conclusion: A Global Race for Critical Metals

    The global economy is entering a phase of exceptional expansion in renewable energy, electric vehicles, artificial intelligence, data centres, and defence, all of which are driving a sharp increase in copper demand—the cornerstone metal of electrification. New technologies, ranging from electrified military systems to advanced robotics, are likely to intensify this trend further. The pace of electrification is now running ahead of the growth in copper supply.

    This race extends beyond geological availability to the downstream stages that determine mineral quality and value. China’s dominance in copper refining and magnet production represents a major vulnerability for global supply chains, prompting advanced economies such as the European Union to launch initiatives aimed at securing alternative sources and accelerating the development of domestic capabilities.

    Sources: Charles-Henry Monchau

  • Looking ahead to the week ahead: Warsh takes center stage alongside central banks

    The US Federal Reserve experienced an eventful week. On Monday, it contacted New York–based banks to assess their USD/JPY exposure, sparking speculation that Washington could be coordinating with Japan to address the Japanese Yen’s weakness. This development prompted a sharp sell-off in the US Dollar early in the week.

    The Fed’s midweek policy meeting resulted in no change to the federal funds rate, which was kept within the 3.50%–3.75% range, in line with expectations. During his press conference, Chair Jerome Powell avoided questions related to politics, his tenure, and the subpoena. However, he pointed to improving economic momentum and reduced risks to both inflation and the labor market.

    The US Dollar Index (DXY) has since rebounded toward the 96.90 level, recovering most of its weekly losses after President Donald Trump nominated former Fed Governor Kevin Warsh as the next Fed Chair on Friday. The nomination now awaits Senate approval. Looking ahead, the US is set to release several key data points next week, including the ISM Manufacturing PMI for January, MBA mortgage applications, Challenger job cuts, and weekly initial jobless claims.

    EUR/USD is hovering around the 1.1880 area after the US Dollar rebounded and recovered nearly all of its weekly losses. In the coming week, Hamburg Commercial Bank (HCOB) will release Manufacturing, Services, and Composite PMIs for both Germany and the Eurozone. Additional Eurozone data include the ECB Bank Lending Survey and December Producer Price Index (PPI), while Germany will publish December Factory Orders and Industrial Production figures.

    GBP/USD is trading near 1.3600 ahead of the Bank of England’s monetary policy announcement on Thursday. Governor Andrew Bailey’s subsequent press conference is expected to shed further light on the central bank’s outlook for interest rates. UK data releases include the final January S&P Global PMIs and the Halifax House Price Index.

    USD/JPY is holding close to the 154.50 level, paring earlier gains after Tokyo CPI data indicated easing inflation in January. Headline inflation slowed to 1.5% year-over-year from 2% in December, while core measures eased to 2%, undershooting forecasts. The softer inflation profile reduces pressure on the Bank of Japan to tighten policy.

    USD/CAD is trading around 1.3580, with the Canadian Dollar maintaining a slight edge against the greenback despite data showing economic stagnation in November. Monthly GDP was flat following a 0.3% contraction in the prior month and fell short of expectations for modest growth. Upcoming Canadian releases include January S&P Global PMIs and the Ivey PMI.

    Gold is trading near the $4,880 area after surrendering all weekly gains. Prices retreated from a record high of $5,598 as profit-taking emerged and the US Dollar strengthened sharply.

    Looking ahead: Emerging views on the economic outlook

    Scheduled central bank speakers for the week:

    Monday, February 2:
    – Bank of England’s Breeden
    – Federal Reserve’s Bostic

    Tuesday, February 3:
    – Federal Reserve’s Barkin

    Wednesday, February 4:
    – Federal Reserve’s Cook

    Thursday, February 5:
    – Bank of England Governor Andrew Bailey
    – Federal Reserve’s Bostic
    – Bank of Canada Governor Tiff Macklem

    Friday, February 6:
    – European Central Bank’s Cipollone
    – European Central Bank’s Kocher
    – Bank of England’s Pill
    – Federal Reserve’s Jefferson

    Central bank meetings and upcoming data set to influence monetary policy decisions

    Key economic data and policy events for the week:

    Monday, February 2:
    – Germany’s December Retail Sales
    – US ISM Manufacturing PMI

    Tuesday, February 3:
    – Reserve Bank of Australia monetary policy decision
    – US December JOLTS job openings

    Wednesday, February 4:
    – Eurozone January Harmonized Index of Consumer Prices (HICP)
    – US January ADP employment report

    Thursday, February 5:
    – Australia’s December trade balance
    – Eurozone December retail sales
    – Bank of England monetary policy decision
    – European Central Bank monetary policy decision

    Friday, February 6:
    – Canada’s January employment change
    – US January nonfarm payrolls
    – US February Michigan consumer sentiment

    Sources: Fxstreet

  • Silver Poised to Exceed $120 as Equity Breakout Falters

    So it turns out technicals still matter.

    I’ve been highlighting a $120 target for silver for months, most recently again on Monday. In fact, the first time I presented the chart projecting $120 as a long-term objective was years ago. That level has now been reached.

    Silver futures peaked at $121.75 before plunging below $107, eventually stabilizing near $110. The magnitude of the intraday reversal is a stark reminder that the white metal can fall even faster than it rises.

    Recall that in 2011, silver erased two months of gains in just six trading days. If history were to repeat, prices would be sitting just above $50 before Valentine’s Day. Possible? Yes—but the decline doesn’t need to be nearly as violent.

    A Potential Top Forming in Silver

    That said, it’s still possible silver pushes higher in the near term. The metal didn’t collapse by tens of dollars—it was simply extremely volatile earlier today. However, with the long-term target now achieved, and considering conditions in the U.S. Dollar Index and the broader equity market, there’s a growing case that silver may have just put in a top.

    The equity market may be especially critical in this context. The recent rebound in the U.S. Dollar Index failed to spark meaningful declines in precious metals, but today’s selloff in equities triggered much sharper downside moves. That contrast is an important signal.

    Stocks have once again been unable to hold above their 2025 highs, suggesting the rally may be exhausted. While this is another in a series of similar invalidations, the magnitude of today’s intraday decline in precious metals hints that this episode could be different.

    Adding to the cautionary tone, short-term weakness in mining stocks is also notable.

    I highlighted the red rectangle to illustrate how current prices in GLD, SLV, and GDXJ compare with last week’s levels. In short, gold and silver are higher, while miners are lower—exactly the type of divergence that often marks the end of a rally.

    Bitcoin Selloff Gains Momentum

    Another important signal is the accelerating decline in Bitcoin.

    After confirming its breakdown below the flag pattern, Bitcoin fell roughly 5% today.

    I previously noted that for those not yet short Bitcoin, this represented an attractive opportunity to initiate or add to positions if sizing felt insufficient. From a risk–reward perspective, that view still stands. The so-called “new gold” was perched at the edge—and has now taken its first decisive step lower.

    Last but not least—gold. The yellow metal initially surged, only to reverse sharply, plunging nearly $500 on an intraday basis. When I first became interested in the precious metals market many years ago, gold’s entire nominal price was well below that amount. Time flies—and so has the price of gold. That said, it appears gravity may be about to reassert itself once again.

    Sources: Golden Meadow

  • Gold Maintains Strong Momentum While Rotating Deep Within Upper Volatility Bands

    Gold futures continue to show strong bullish momentum, holding well above the VC PMI Daily Pivot near $5,329, reinforcing higher-timeframe trend alignment across both daily and weekly cycles. The sharp, near-vertical advance that began earlier this week is characteristic of classic “escape velocity” behavior, with price accelerating away from the mean during a synchronized time-and-price harmonic window.

    Within the VC PMI framework, price is now rotating inside the upper volatility band. Daily Sell 1 near $5,465 defines the first layer of structural resistance, while Daily Sell 2 around $5,588 marks the outer boundary of the current expansion envelope. The recent intraday peak near $5,626.8 indicates price is pressing into a late-stage extension phase, where probabilities begin to shift toward consolidation or orderly mean reversion rather than continued vertical advance.

    Square of 9 geometry supports this view. Angular projections from the latest weekly VC PMI Pivot near $4,864 project resistance harmonics into the $5,560–$5,620 region, closely overlapping with the Daily Sell 2 band. This confluence of time, price, and geometric resistance elevates the likelihood of a near-term inflection window.

    On the downside, rotational support remains layered at Daily Buy 1 near $5,205 and Daily Buy 2 near $5,070, with deeper mean support at the weekly VC PMI Pivot around $4,864 should downside volatility expand.

    Cycle analysis further identifies a key timing cluster between January 29 and February 2, derived from overlapping 30-day and 60-day harmonics. Historically, such windows tend to resolve momentum conditions via either range compression or a counter-trend rotation back toward the VC PMI mean. Momentum indicators, including MACD divergence behavior, suggest upside efficiency is fading, reinforcing the risk of a pause or rotational pullback rather than immediate continuation.

    From a strategic standpoint, trend-following participants may continue to trail protective stops below $5,205, while mean-reversion traders will look for rejection signals within the $5,560–$5,620 Square of 9 resistance arc. A sustained close above $5,588 would negate the near-term mean-reversion risk and reopen the path toward higher geometric extensions.

    Sources: Golden Meadow

  • WTI slips toward $64.00 despite heightened geopolitical tensions

    • WTI prices slipped but were still on course for roughly 12% monthly gains, underpinned by elevated geopolitical risk premiums.
    • Iran warned of an unprecedented response following renewed threats from President Trump over nuclear negotiations.
    • Meanwhile, the Trump administration loosened some sanctions on Venezuela’s oil sector on Thursday to attract U.S. investment.

    West Texas Intermediate (WTI) crude edged lower after three consecutive sessions of gains, trading near $64.00 a barrel during Asian hours on Friday. Still, the benchmark remained on track for about a 12% monthly increase, supported by a strengthening geopolitical risk premium.

    Geopolitical tensions stayed elevated after Iran warned it would “defend itself and respond like never before” following renewed threats from U.S. President Donald Trump, who urged Tehran to engage in nuclear negotiations. Iranian officials cautioned that any provocation would be met with retaliation.

    Tensions escalated further after the European Union designated Iran’s Islamic Revolutionary Guard Corps as a terrorist organization. Concerns were compounded by reports that the United States was bolstering its military presence near Iran, while Tehran announced live-fire military exercises in the strategically vital Strait of Hormuz, heightening worries over regional security.

    Markets are closely watching the potential impact of these developments on shipping through the Strait of Hormuz, a critical chokepoint between Iran and the Arabian Peninsula that handles daily flows of crude oil and LNG. According to Dow Jones Newswires, Westpac Strategy Group warned that any regime change in Iran would likely be disorderly, unlike the U.S-backed removal of Venezuela’s Nicolas Maduro or targeted strikes such as those on Fordow.

    Separately, the Trump administration eased certain sanctions on Venezuela’s oil sector on Thursday to attract U.S. investment following President Nicolas Maduro’s removal earlier this month. The U.S. Treasury authorized transactions involving Venezuela’s government and state-run PDVSA, allowing U.S. firms to produce, transport, sell, and refine Venezuelan crude.

    Earlier this month, oil prices also drew support from supply disruptions in Kazakhstan, freeze-offs in the United States, and tighter U.S. restrictions on Russian oil purchases, helping underpin prices this year despite lingering expectations of global oversupply.

    Sources: Fxstreet

  • Gold volatility surges as prices behave like a meme stock

    Gold’s most recent move was sharp, chaotic, and relentless. With volatility running high and prices stretched, managing risk is just as critical as getting the direction right.

    • Gold shows capitulation-like price behavior
    • Volatility jumps to multi-year highs
    • Prices look stretched after a rapid upside surge
    • Position sizing and risk management become paramount

    Gold shows meme-stock–like trading behavior

    Gold behaved less like a classic safe haven and more like a meme stock on Thursday, surging nearly $100 within minutes during early Asian trading. Prices briefly spiked toward $5,600 before reversing just as quickly. The sheer speed and magnitude of the move felt like capitulation in real time, likely exacerbated by thin liquidity during the transition from North American to Asian market hours.

    Although the price surge began around the same time, a CNN report later surfaced indicating that the U.S. was considering new military strikes against Iran. However, given that geopolitical tensions have been elevated for weeks rather than emerging suddenly, much of that risk was likely already priced in. In that sense, the headline appears more like a catalyst than the underlying cause of the move.

    Some traders also cited comments from Fed Chair Jerome Powell after the January FOMC meeting, in which he downplayed any macroeconomic signal from gold’s record highs. Still, those remarks seem to have played only a minor role, coming several hours before the most volatile phase of the price action unfolded.

    Volatility jumps sharply higher

    While today’s spike has understandably drawn attention, it is not an isolated event, instead forming part of a broader and accelerating expansion in volatility across the gold market.

    As illustrated above, the Gold Volatility Index (GVZ) has climbed to its highest level since the early days of the COVID-19 lockdowns in 2020, highlighting just how extreme price action in the traditional safe haven has become. GVZ measures implied volatility in gold options, offering insight into the magnitude of price swings the options market is anticipating. The surge suggests the market has entered a markedly different volatility regime, one in which unusually large moves are occurring with increasing frequency.

    The broader volatility environment is also clearly visible on the daily chart. Gold is trading well above its upper Bollinger Band, highlighting the speed and magnitude of the recent acceleration relative to prior conditions. Daily trading ranges have expanded sharply, with the 14-day ATR elevated at 117.56—making $100-plus moves routine rather than exceptional. Meanwhile, the 14-day RSI sits deep in overbought territory at 91.15, reinforcing that while the broader uptrend remains intact, price action is increasingly stretched and unstable.

    Risk management takes center stage

    In short, this is an exceptionally high-volatility environment where price behavior is far from normal. Gold has surged rapidly, leaving prices highly extended and vulnerable to sharp moves in both directions, even as the broader uptrend remains in place. In such conditions, traditional technical signals often lose reliability, making risk management and position sizing especially critical—particularly with mean-reversion risks running high.

    Sources: David Scutt