Gold prices traded sideways during Thursday’s Asian session as investors remained cautious ahead of the Trump–Xi summit in Beijing. US President Donald Trump arrived in China for talks with Xi Jinping, with trade tensions and the Iran conflict expected to dominate discussions. Meanwhile, US producer inflation surged at its fastest yearly pace in four years, lending support to the US Dollar.
Gold prices remained largely unchanged during Thursday’s Asian session as investors stayed cautious ahead of the summit between US President Donald Trump and Chinese President Xi Jinping in Beijing. Market attention is also turning to the upcoming US April Retail Sales data due later in the day.
According to Bloomberg, Trump arrived in Beijing on Wednesday for the first state visit to China by a US president in nine years. The meeting comes as Washington and Beijing attempt to stabilize relations amid ongoing geopolitical tensions linked to the Iran conflict.
The US and China are reportedly exploring a framework that would allow both countries to reduce tariffs on approximately $30 billion worth of goods without compromising national security concerns.
Meanwhile, US producer inflation rose at its fastest annual pace in four years, strengthening expectations that the Federal Reserve will keep interest rates elevated to contain persistent inflation pressures.
Data from the US Bureau of Labor Statistics released on Wednesday showed that the Producer Price Index (PPI) climbed 6.0% year-over-year in April, up from 4.3% in March and above market forecasts of 4.9%. On a monthly basis, PPI increased 1.4% after a 0.7% gain in March, significantly exceeding expectations of 0.5%.
Wholesale inflation reached its highest level since December 2022, largely driven by surging oil prices amid Middle East tensions. The stronger inflation data reinforced expectations that the Federal Reserve will maintain higher interest rates for longer, which could pressure Gold prices. Although Gold is often viewed as a safe-haven asset during geopolitical uncertainty, higher interest rates reduce its appeal because the metal does not offer yield.
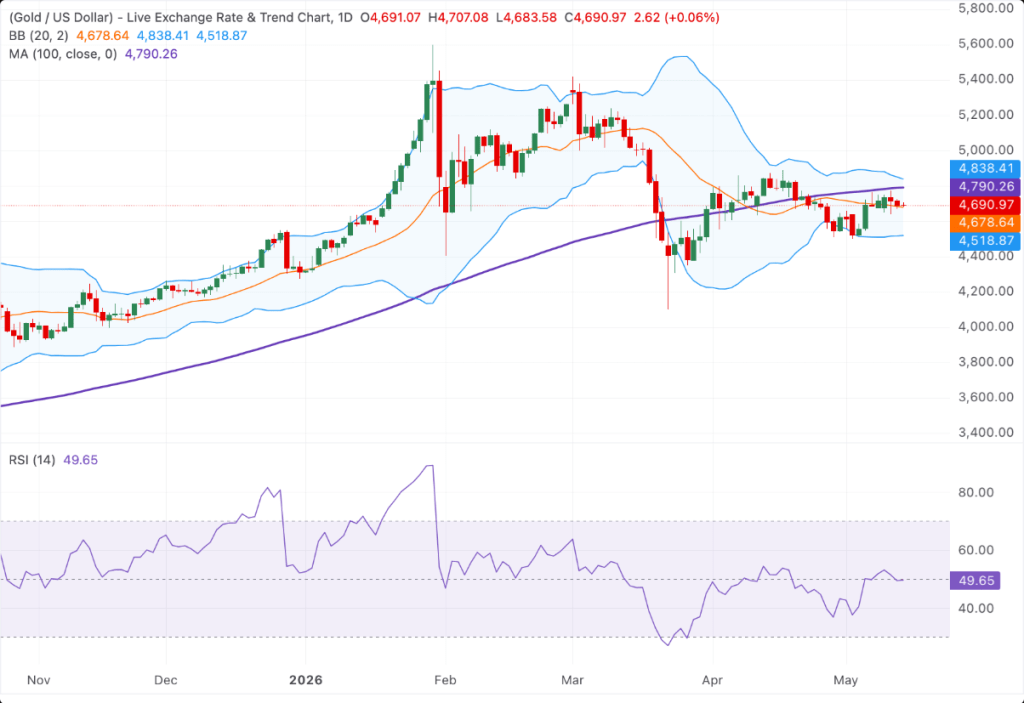
Gold Daily Chart
Technical Analysis
On the daily chart, XAU/USD is trading near $4,690 and continues to show a slightly bearish tone while remaining below the 100-day simple moving average (SMA). The metal is hovering just above the Bollinger Band midpoint, indicating short-term support within the current trading range. Meanwhile, the Relative Strength Index (RSI) stands at 49.65, reflecting neutral momentum and signaling consolidation rather than a strong directional move.
To the upside, the first resistance level is located near the 100-day SMA around $4,790. Additional gains could face resistance near the upper Bollinger Band at roughly $4,838 if bullish momentum strengthens further. On the downside, initial support is found around the Bollinger midpoint near $4,680, followed by a stronger support area close to the lower Bollinger Band around $4,518, where any deeper correction may begin to stabilize.

Leave a comment