
Oil
Huge swings across USD/Asia as Japan’s MOF keeps intervening in USD/JPY, while Axios continues to publish reports pointing to progress on an Iran deal. It’s difficult not to view the headlines with some skepticism, but markets react sharply to every update, making them impossible to ignore. Regardless of how the probabilities around an Iran resolution are assessed, the market response has been so significant that questioning the credibility of the news flow becomes secondary.
My long USD/CHF position has taken a heavy hit as the US Dollar tumbles alongside a sharp decline in oil prices. USO, the oil ETF, is down 11% today after Monday’s attacks on the UAE had traders positioned for a bullish breakout in crude that ultimately never materialized.
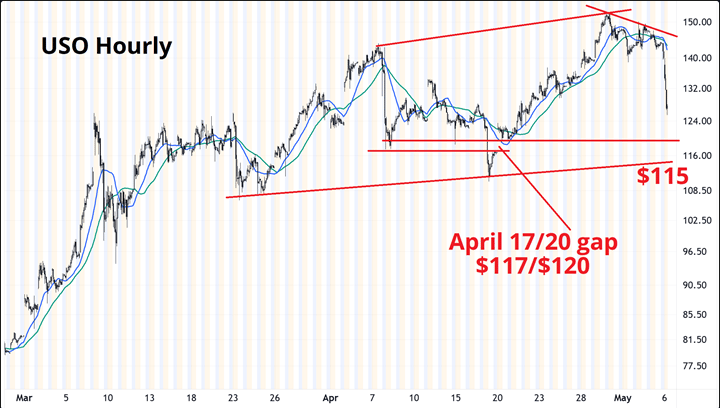
There still appears to be plenty of downside room before crude finds meaningful support. I’m using USO as the reference here, though the broader oil futures curve shows a very similar setup. Fresh optimism over a potential end to active conflict in the Middle East has fueled another rally in AI capex-related names, though it hasn’t translated into stronger USD demand as Japan’s MOF remains active and concerns over stagflation-driven rate hikes from the ECB and other central banks continue to ease.
Apparently, the launch of the DRAM ETF was not the top for memory stocks after all.
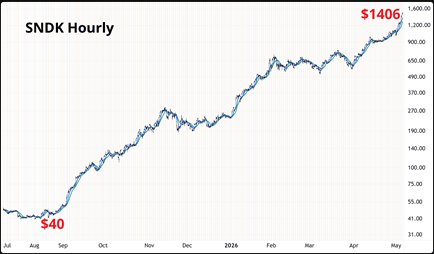
SanDisk has now turned into a 35-bagger over the past year, soaring from $40 to $1,400 in just 12 months.
USD/JPY
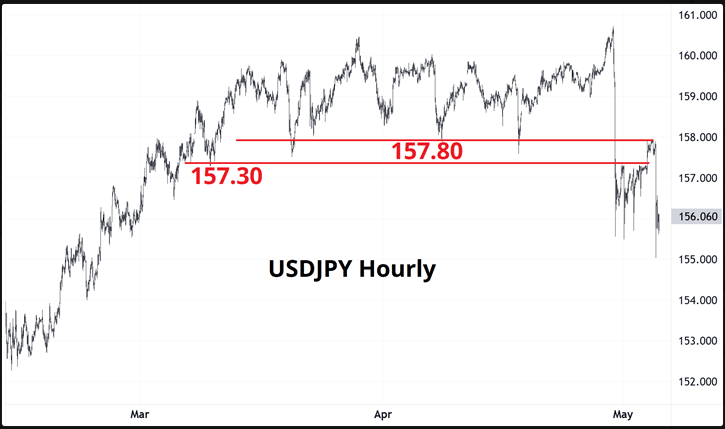
Interesting setup in USD/JPY. My initial strategy — selling into the 157.19–157.94 area in anticipation of MOF-driven upside exhaustion — turned out to be the correct call, but I got thrown off by a competing view that nonfarm payrolls would likely surprise to the upside. In hindsight, that was probably something to focus on Thursday rather than Monday. The chart still shows the former major low zone around 157.30–157.80 acting as resistance, and the repeated interventions suggest the MOF is serious about defending the area.
Here’s the 5-minute chart. It’s hard to say with certainty that every sharp drop was driven by the MOF, but several of them likely were.
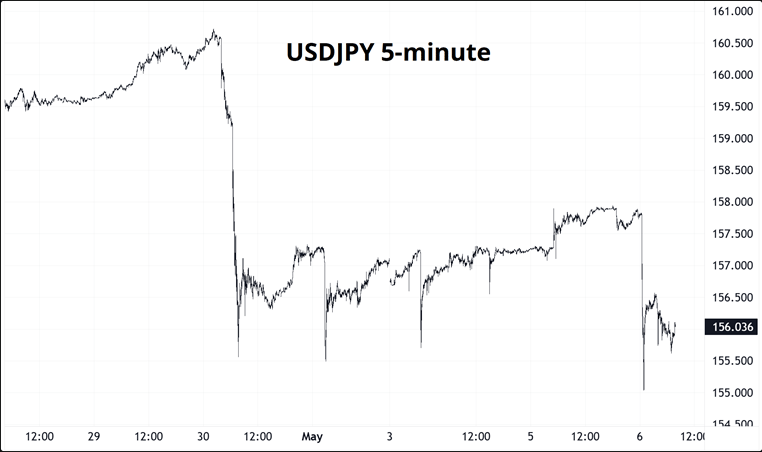
I’m staying on the sidelines for now. Going long here makes little sense regardless of one’s NFP outlook, while shorting at the bottom of the range is equally unattractive. At this point, the MOF simply needs to keep hovering above 157.50 while hoping for lower yields and softer oil prices.
With the VIX sitting at 16.4 and oil down 10%, the hawkish Trump mean-reversion trade — long oil and long USD — probably offers positive expected value. The problem is that there’s still no concrete timeline attached to the latest “deal” or MOU narrative, making risk management on long oil positions extremely difficult.
In hindsight, I was too focused on NFP too early, if it even deserved attention at all in this environment. With oil and MOF activity overwhelmingly driving FX flows, concentrating on payrolls four days ahead of the release now feels misplaced.
Extend this analysis
In recent weeks, a 50/50 barbell trade pairing semiconductors and oil has gained traction, with several bank strategists and Substack writers pitching it as a modern alternative to the traditional 60/40 stocks-and-bonds risk parity framework. In hindsight, the trade has delivered exceptional performance and offers some attractive characteristics: it largely sidesteps direct exposure to the U.S. consumer while remaining relatively resilient to stagflation pressures and tightening financial conditions.
That said, assuming the strategy will continue to work simply because it has worked recently feels like a dangerous exercise in extrapolation. Much of the enthusiasm may reflect performance chasing rather than a durable structural edge.
The following charts take a simplified approach by comparing a portfolio of 100*XLE + SOX against the Advance Research Risk Parity Index (RPARTR). I chose this particular risk parity benchmark because its data extends back to 1998, though using more sophisticated methodologies would likely produce a broadly similar picture.
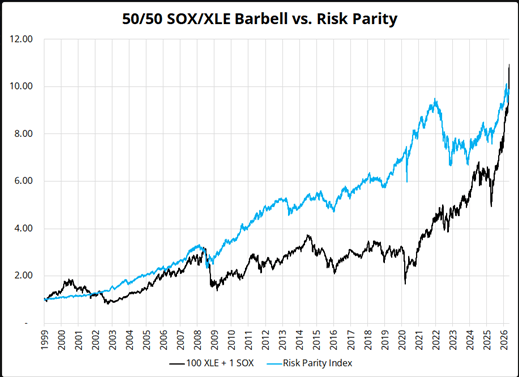
The SOX+XLE barbell began outperforming after Russia’s latest invasion of Ukraine and continued to hold up even as oil prices eased post-Ukraine, largely because ChatGPT accelerated the AI capex boom. Still, after two wars and three years of markets pricing in the LLM theme, it’s difficult to argue that the trade still offers especially attractive risk/reward. Time will tell.
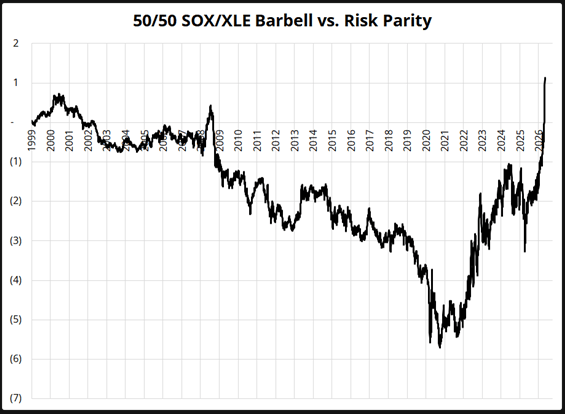
Traditional risk parity, meanwhile, outperformed across nearly every longer-term horizon except the past few years. The chart on the right indexes both strategies to January 1999 = 1, while the second chart highlights the performance gap between the two indexed series.
Worth keeping in mind.
Closing thoughts
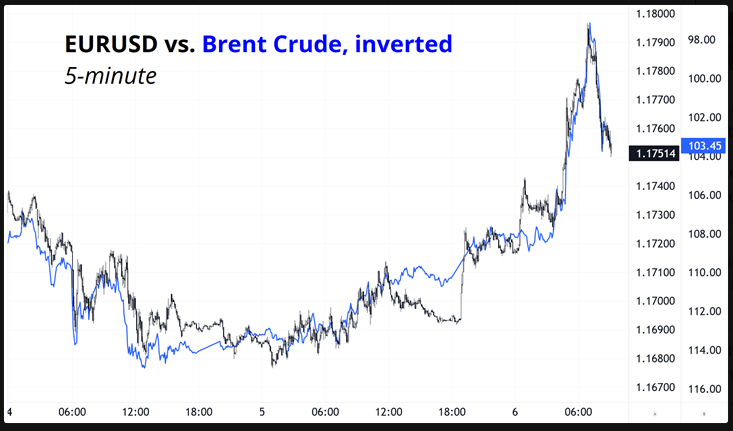
EUR/USD is basically trading like oil.
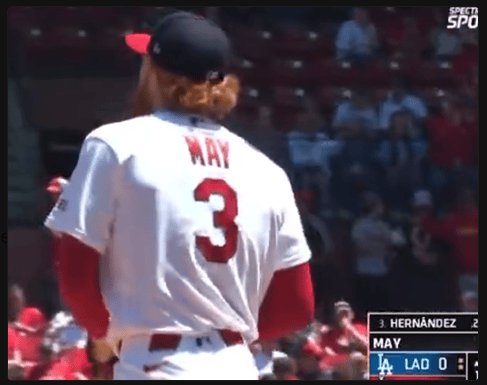
Check who took the mound for the Cardinals on May 3 — Dustin May, wearing No. 3.

Leave a comment