Gold continues to trade in a narrow range below the $4,800 mark early Friday, failing for a third straight day to hold above that level. Market participants remain cautious as they await clearer direction from upcoming US–Iran peace talks, while the metal still looks set for a fourth consecutive weekly gain.
Fundamental Overview
With the two-week US–Iran ceasefire set to expire on April 22, uncertainty around both the timing and outcome of the next round of negotiations continues to unsettle investors, keeping Gold prices fluctuating within a familiar range.
Upside momentum in Gold remains limited, pressured by the recent rebound in Oil prices amid ongoing concerns about supply disruptions tied to the US naval blockade of the Strait of Hormuz. Higher Oil prices have revived inflation fears, reinforcing expectations that major central banks—including the US Federal Reserve (Fed)—may maintain a tighter monetary policy stance.
Late Thursday, the US Central Command (CENTCOM) stated that the USS Abraham Lincoln is operating in the Arabian Sea as part of a large-scale enforcement of the blockade on Iranian ports, involving more than a dozen ships, over 100 aircraft, and around 10,000 personnel, with no reported violations so far.
Meanwhile, a modest rebound in the US Dollar from near six-week lows is adding further pressure on USD-denominated Gold.
That said, downside risks for the precious metal appear limited. A newly announced 10-day ceasefire between Israel and Lebanon has lifted hopes for a near-term de-escalation in the Middle East, reducing safe-haven demand for the US Dollar and offering some support to Gold.
Heading into the weekend, Gold remains directionless and highly sensitive to developments on the Middle East front. Thin end-of-week flows could also amplify price swings, especially amid lingering uncertainty over US–Iran negotiations and the durability of the Israel–Lebanon truce.
From a technical perspective, the daily chart setup adds another layer of intrigue, keeping traders focused on both geopolitical headlines and key chart signals for the next move.
XAU/USD Technical Overview
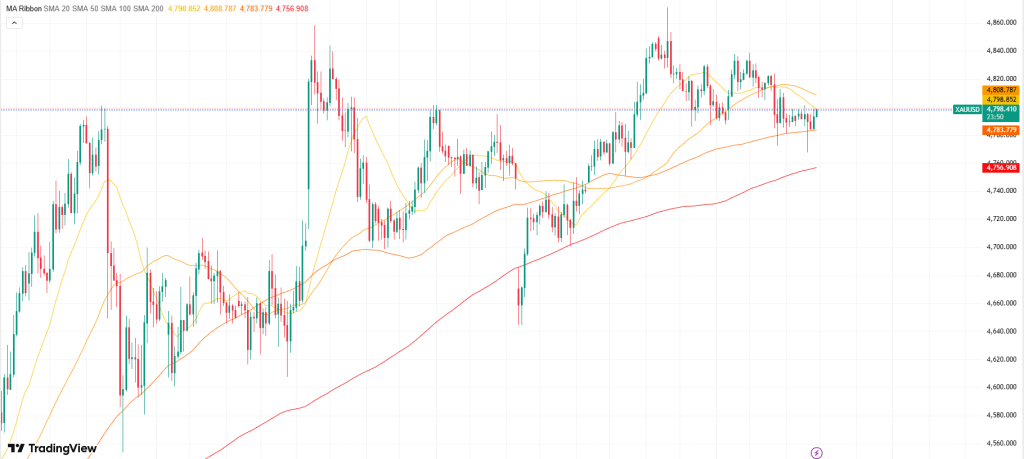
On the daily chart, XAU/USD is trading around $4,789.50, with price action confined between key support levels and overhead resistance. The metal remains supported above the 21-day and 100-day SMAs, near $4,646 and $4,715 respectively, but continues to struggle below the 50-day SMA at $4,897 and a descending trendline resistance around $4,792. The Relative Strength Index (14), hovering near 51, points to neutral momentum with a slight bullish tilt, indicating consolidation rather than a clear breakout as price lingers just beneath trend resistance.
At the same time, bearish signals persist in the background. A Bear Cross between the 21-day and 100-day SMAs confirmed on April 13, along with a similar crossover seen on March 25, continues to weigh on bullish prospects.
Looking higher, immediate resistance is seen at the descending trendline near $4,792. A decisive daily close above this level could pave the way toward the 50-day SMA at $4,897 as the next upside target. On the downside, initial support lies at the 100-day SMA around $4,715, followed by a broader ascending trendline zone in the mid-$4,500s, which reinforces demand ahead of the 21-day SMA near $4,646. Only a sustained break below these support layers would expose the longer-term 200-day SMA near $4,215.

Leave a comment