Gold edges higher with modest gains, but the broader fundamentals suggest caution for bullish traders.
Persistent inflation concerns are reinforcing expectations of more hawkish central bank policies, weighing on the metal.
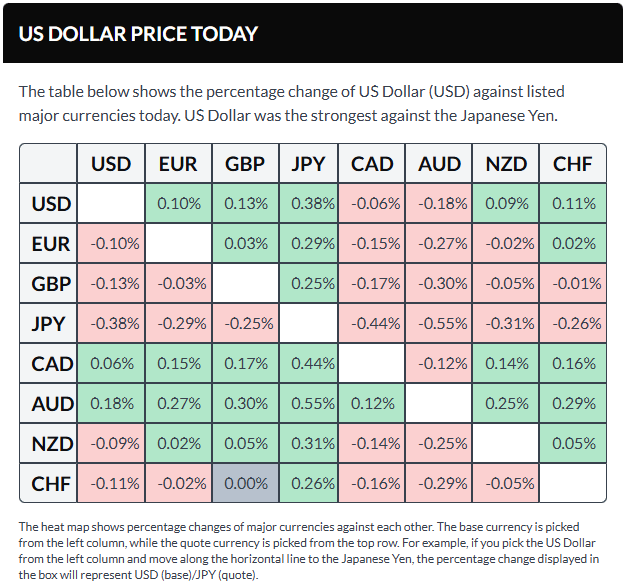
Meanwhile, rising US-Iran tensions bolster the US dollar’s safe-haven appeal, adding further pressure on gold.
Gold (XAU/USD) picks up some buying interest during Tuesday’s Asian session, partially recovering from the previous day’s drop to around the $4,500 level—its lowest in over a month. However, the rebound lacks a clear fundamental driver and could fade quickly, suggesting traders should remain cautious before expecting any sustained upside. Ongoing US-Iran tensions continue to stoke inflation fears and reinforce expectations of higher interest rates, which, alongside a stronger US Dollar (USD), is likely to cap gains in the non-yielding metal.
The fragile ceasefire between the US and Iran appears close to breaking down after renewed violence in the Persian Gulf on Monday. Both the United Arab Emirates (UAE) and South Korea reported attacks on vessels in the critical shipping lane, while the UAE confirmed a fire at the Fujairah oil port following Iranian missile and drone strikes. US President Donald Trump warned that Iran would face devastating consequences if it targeted American ships escorting vessels through the region under the “Project Freedom” initiative.
These developments heighten the risk of further escalation in the Middle East, pushing crude oil prices higher and reinforcing concerns that rising energy costs could reignite inflation. This, in turn, strengthens expectations that major central banks—including the US Federal Reserve (Fed)—may adopt a more hawkish policy stance. Data from CME Group’s FedWatch Tool now shows the probability of a Fed rate hike by year-end at around 35%, up sharply from below 10% last Friday.
The outlook supports higher US Treasury yields, which continue to underpin the USD. Additionally, tensions around the Strait of Hormuz further enhance the dollar’s appeal as a global reserve currency, adding to the bearish near-term outlook for gold. As a result, any upward moves in the metal are likely to attract selling interest, and traders may prefer to wait for stronger, sustained buying before concluding that gold has formed a bottom.
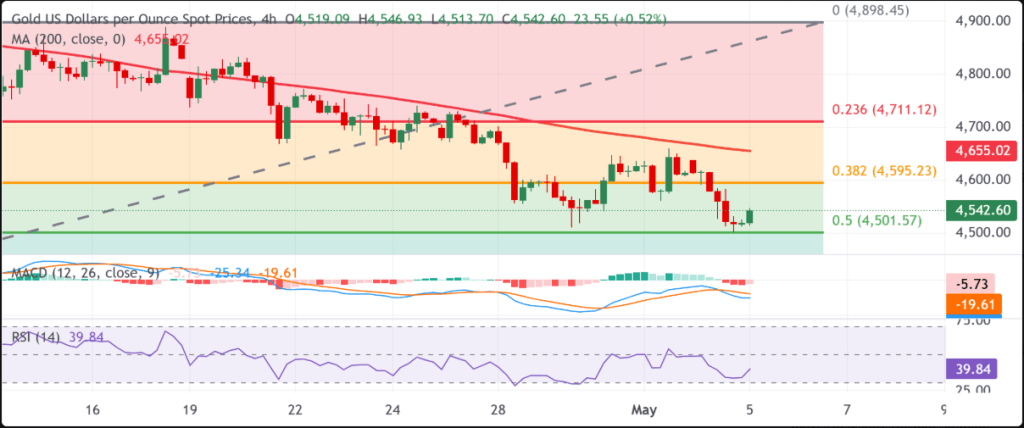
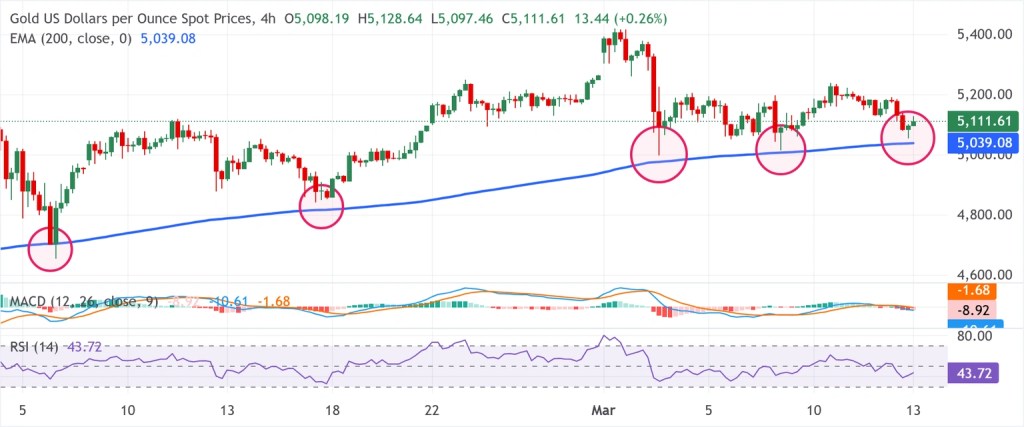
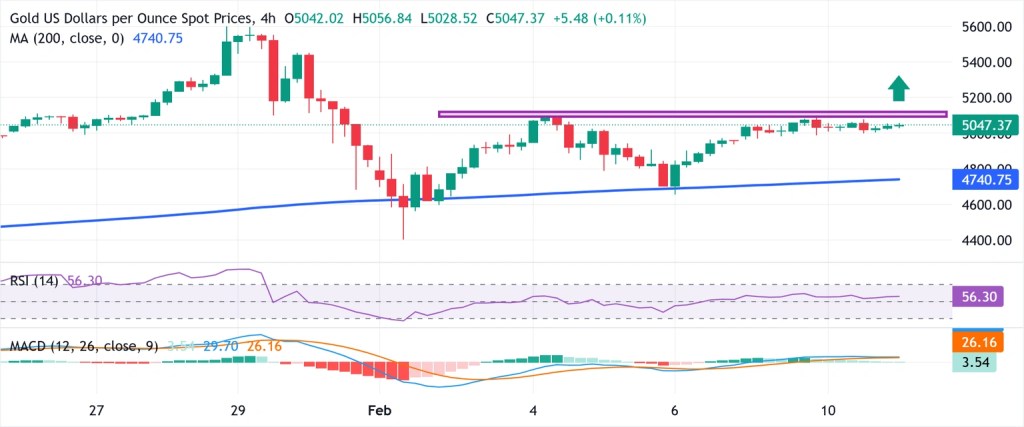
Gold (XAU/USD) 4-hour timeframe chart
Gold may find it difficult to build on its intraday gains given the prevailing bearish technical structure.
From a chart standpoint, XAU/USD continues to show a short-term negative bias as it remains below the 200-period Simple Moving Average (SMA) at $4,655.02. The metal is also constrained by the 38.2% Fibonacci retracement of the March–April rally, keeping prices trapped beneath a strong resistance zone despite a slight rebound from the $4,500 region, which aligns with the 50% retracement level.
Momentum signals are still weak, with the Relative Strength Index (RSI) staying below the neutral 50 mark at 39.84 and the Moving Average Convergence Divergence (MACD) lingering in negative territory. This suggests the current recovery attempt could lose steam near the 38.2% Fibonacci level at $4,595.23. Any further upside is likely to face resistance around the 200-period SMA at $4,655.02, followed by the 23.6% retracement at $4,711.12.
On the downside, immediate support is seen near the 50% retracement at $4,501.57, ahead of the 61.8% level at $4,407.90. If selling pressure intensifies, deeper support levels come into view at $4,274.55 and $4,104.68.
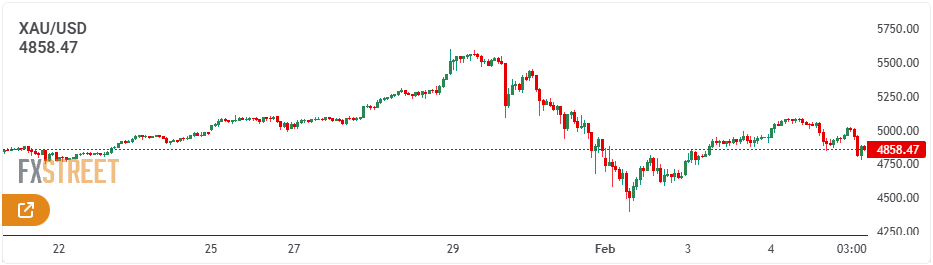
Gold edged lower from around $4,750 in Thursday’s Asian session, giving back part of the previous day’s gains as renewed US–Iran tensions over the Strait of Hormuz kept the US Dollar supported and weighed on sentiment. However, expectations that the Federal Reserve may hold off on further rate hikes continued to limit downside pressure on the non-yielding metal.
Technical Analysis
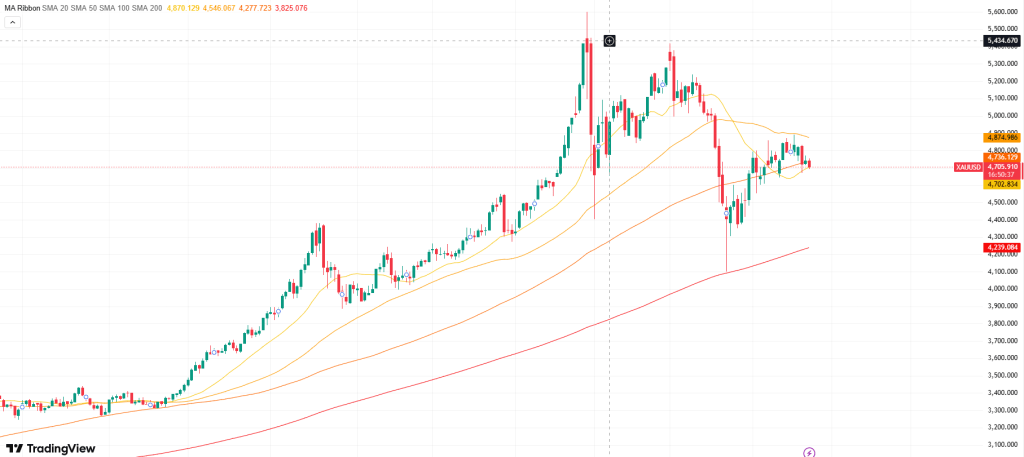
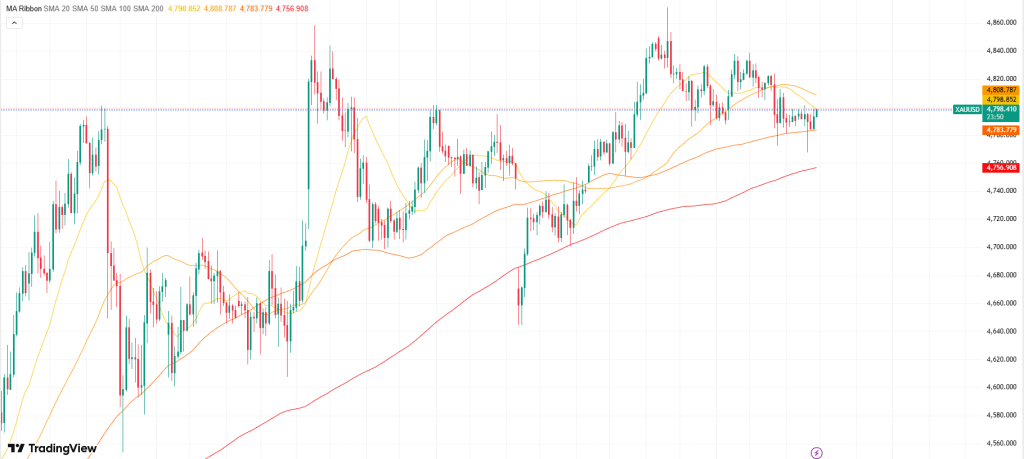
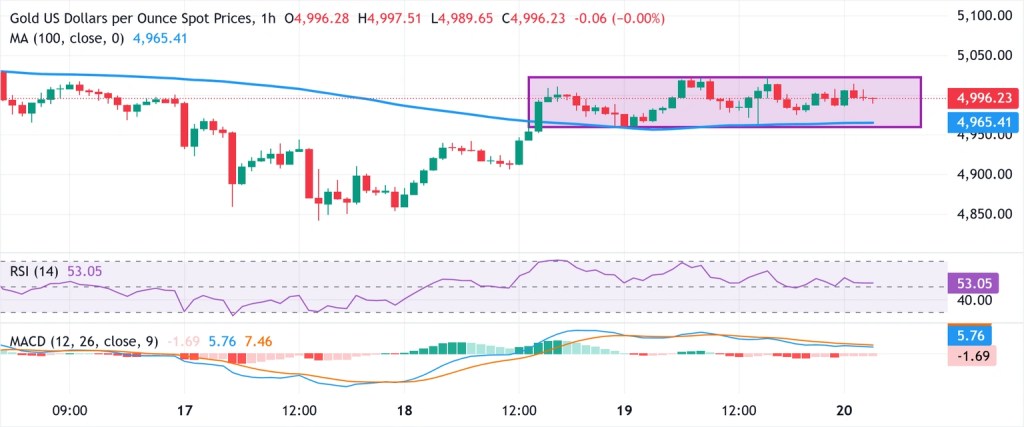
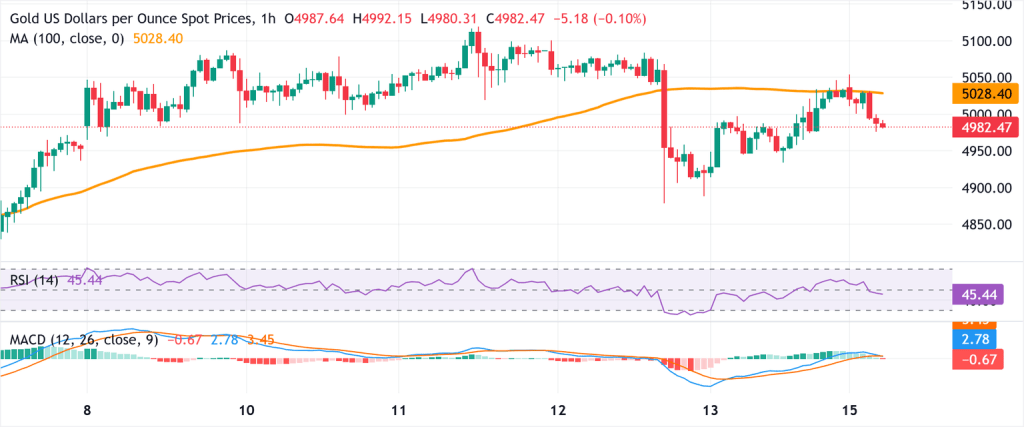
Technically, XAU/USD shows a mildly bearish short-term bias as it remains below the 100-period SMA at $4,739.32, the 200-period SMA at $4,770.64, and the 20-period SMA at $4,776.89. The RSI, hovering near 44, points slightly lower, while the Momentum indicator also trends modestly below the midline, signaling weakening upside traction.
On the upside, immediate resistance is seen at the 100-period SMA, followed by stronger hurdles at the 200-period SMA and the 20-period SMA, creating a dense resistance cluster that bulls need to clear to neutralize bearish pressure. With limited nearby support from indicators, a further decline could expose gold to retesting recent lows around $4,668 if selling pressure intensifies.
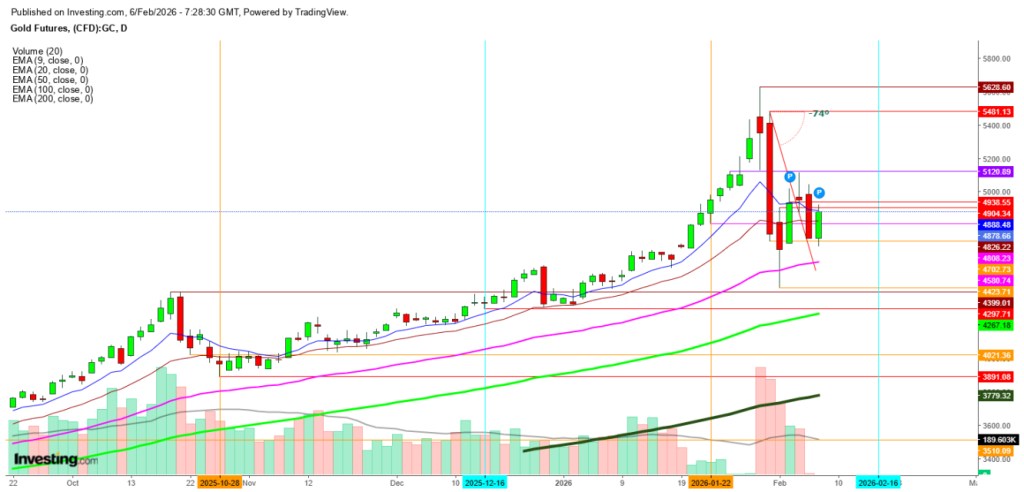
On the daily timeframe, however, the broader outlook remains more constructive. Price continues to hold above the 20-day SMA at $4,693.12 and the 100-day SMA at $4,731.60, which acts as a key near-term support area. The much lower 200-day SMA at $4,236.91 underscores the longer-term uptrend. Meanwhile, the RSI near 48 and neutral Momentum readings suggest consolidation, with bullish momentum cooling rather than reversing decisively.
Fundamental Analysis
Spot Gold was little changed on the day, hovering near the $4,730 level as markets grappled with rising uncertainty stemming from fresh Middle East tensions that have pushed the situation into a stalemate.
After a series of back-and-forth developments, the United States and Iran failed to restart negotiations and missed the scheduled meeting in Pakistan. US President Donald Trump later said the ceasefire would remain in place until Iran presents a “unified proposal,” while Tehran dismissed the extension as “meaningless” and warned of a potential military response.
Meanwhile, tensions escalated around the Strait of Hormuz, with reports suggesting renewed disruptions to shipping routes, including vessel seizures and attacks on oil transport. Midweek, Trump indicated that talks with Iran could still take place next Friday, though Iranian media quickly denied any such plans, stating there were no current intentions to negotiate with Washington.
With both the ceasefire and diplomatic prospects in doubt, markets remain directionless, further complicated by anticipation of key central bank meetings next week.
In this environment, crude oil has strengthened notably, with West Texas Intermediate (WTI) climbing to around $92 per barrel, its highest level since last Friday. The rally reflects growing concerns over supply risks and skepticism that a swift resolution in the Middle East is forthcoming.
Heightened geopolitical risks are weighing on gold’s short-term outlook.
Movements in oil, bond yields, and the US dollar continue to drive price action.
However, a decisive break above resistance could reignite bullish momentum.
Gold started the week under pressure, opening with a gap lower before gradually recovering toward Friday’s close. Recent developments in the Middle East have slightly shifted the near-term outlook, with risks now leaning modestly to the downside. The main concern is clear: a sharper increase in oil prices could strengthen the US dollar and lift bond yields—both factors that typically act as headwinds for gold.
So far, the rise in oil has been relatively moderate, with Brent crude up about 5% and trading near $95 per barrel. Even so, the broader environment remains fragile. The US seizure of an Iranian-flagged vessel near the Strait of Hormuz has drawn strong warnings from Tehran, including threats of retaliation and the potential for further disruption to already strained negotiations. With a two-week ceasefire set to expire on Wednesday and little tangible progress achieved, uncertainty continues to weigh on the situation. Iran has also reversed its brief reopening of the strait, accusing the US of failing to uphold its commitments while maintaining pressure on Iranian ports.
Before diving deeper into the macro drivers, let’s first take a look at gold’s chart…
Gold Technical Analysis
As the chart illustrates, gold is currently testing a key resistance zone in the $4,800–$4,850 range. This area is significant, as it combines multiple technical factors: previous support and resistance levels, the underside of a broken upward trendline, and the 61.8% Fibonacci retracement level.
Since early April, prices have repeatedly tested this resistance zone without achieving a clear breakout. However, the lack of strong selling pressure is telling. When resistance is tested multiple times without a significant pullback, it often signals underlying strength—raising the probability of an eventual upside break, though confirmation is still needed.
A daily close above $4,850 would serve as that confirmation, indicating a bullish reversal and paving the way for further upside. In that case, the next focus would be the $5,000 level, which aligns with the 78.6% Fibonacci retracement and also stands out as a key psychological milestone.
On the downside, initial support is seen near $4,750, followed by $4,600 and then $4,500. The most critical level, however, is $4,400. This zone has demonstrated its significance before—acting as support in early February and quickly being reclaimed after a brief breakdown in late March.
As long as $4,400 holds, the broader bullish structure remains intact, even if short-term conditions appear somewhat uncertain.
Can Gold Still Find Its Footing?
Despite increasingly heated rhetoric, there are still tentative signs that diplomacy hasn’t been fully abandoned. Donald Trump has struck a cautiously optimistic tone about the prospects for a deal, even while warning that military action targeting Iranian civilian infrastructure remains an option if talks break down.
On the other side, Iran continues to stand firm. The removal of restrictions around the Strait of Hormuz remains a key precondition for meaningful engagement, while officials emphasize that major sticking points—especially around nuclear issues—are still unresolved. Even so, financial markets have so far absorbed these developments without major disruption.
Behind the scenes, quieter diplomatic efforts appear to be ongoing. Asim Munir has reportedly engaged with Trump, underscoring that the Hormuz situation remains a central obstacle. There are indications that this view has been acknowledged, though it’s unclear whether it will lead to concrete progress.
If negotiations resume and produce a breakthrough, improved risk sentiment could support gold and potentially drive it toward the $5,000 level. If not, investors should be prepared for a more volatile and uneven trajectory ahead.
A Waiting Game for Now
For the time being, gold’s outlook remains finely poised. Much depends on the direction of bond yields and the US dollar—both of which are closely linked to inflation expectations and, importantly, movements in oil prices. In that context, ongoing developments in the Middle East continue to be the primary catalyst.
For now, a patient approach appears to be the most sensible course.
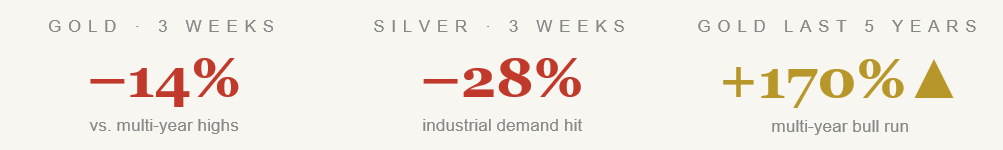
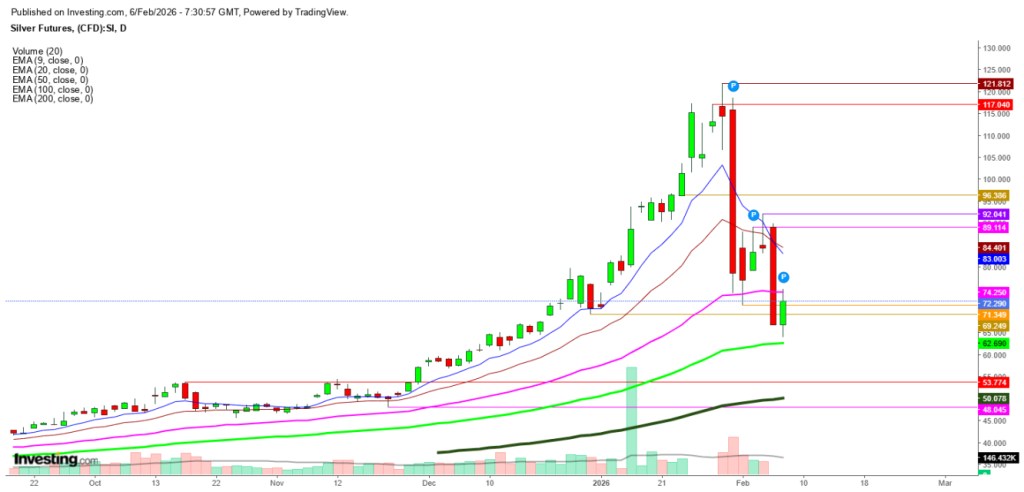
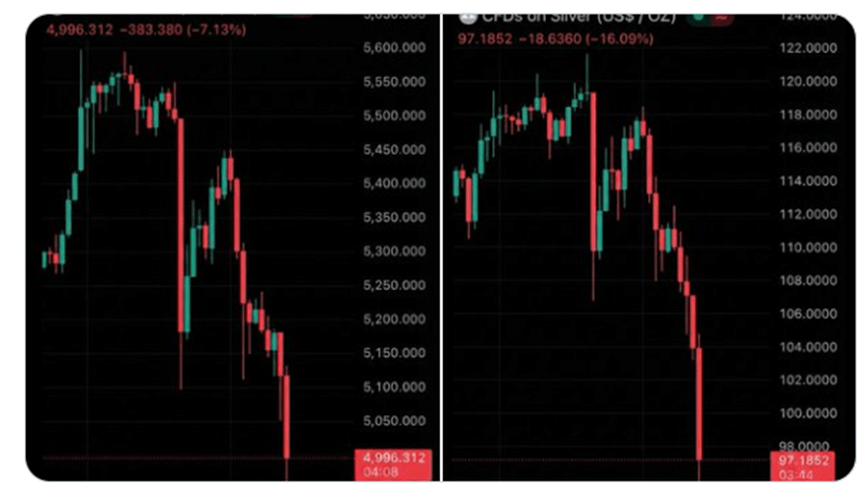
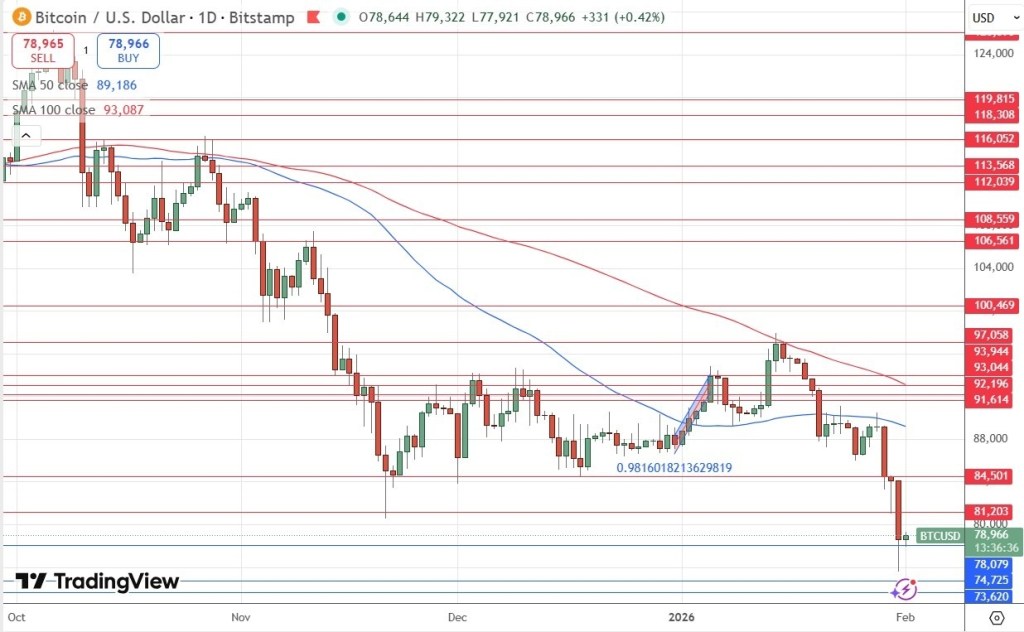
The latest decline in gold and silver has taken investors by surprise again, but for reasons quite different from the late-February correction. While that earlier drop was largely the result of positioning and technical factors, the current weakness is unfolding amid escalating geopolitical tensions and tighter financial conditions. Despite these differences, both episodes underscore how sensitive precious metals are to changes in interest rates, the US dollar, and overall liquidity. Here are five key takeaways shaping the current market move:
Macro Forces Are Now in Control
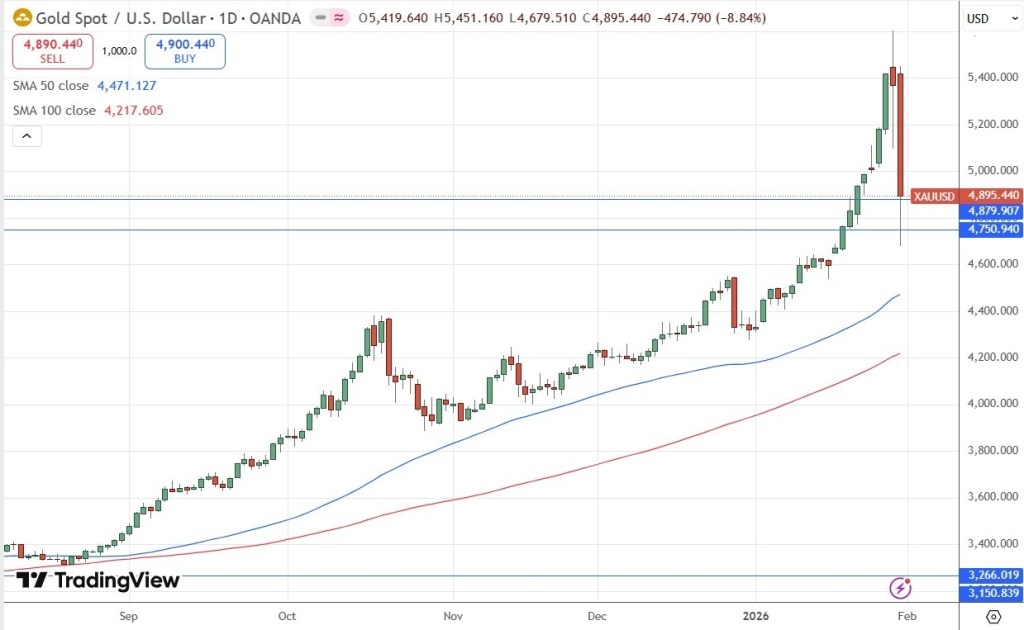
Unlike the February selloff, which stemmed mainly from position unwinding, this decline is being driven by broader macro dynamics. Rising tensions between the US and Iran have pushed oil prices higher, lifting inflation expectations and prompting markets to reassess the outlook for interest rates. As yields climb and the dollar strengthens, gold faces pressure as a non-yielding, dollar-priced asset. This marks a fundamentally driven shift rather than a technical correction.
The Dollar Is Overtaking Gold’s Safe-Haven Role
Although geopolitical risks typically support gold, the US dollar has emerged as the preferred safe haven this time. Instead of flowing into gold, capital is rotating into dollar-denominated assets as financial conditions tighten. This has created an unusual scenario where risk aversion rises even as gold prices fall, with the dollar absorbing most of the defensive demand.
Real Yields Remain the Critical Channel
Real yields have played a central role in both downturns. In February, a mild adjustment in rate-cut expectations weighed on gold. Now, higher energy prices are pushing up inflation expectations while reducing the likelihood of near-term rate cuts, keeping real yields elevated. This continues to exert downward pressure on precious metals.
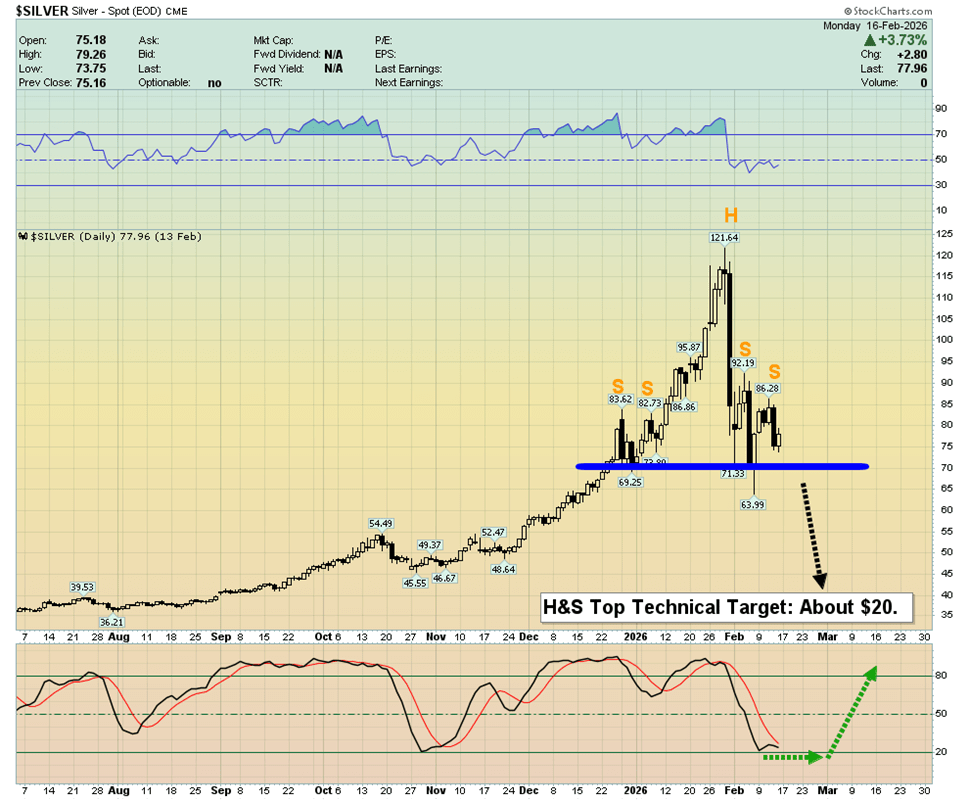
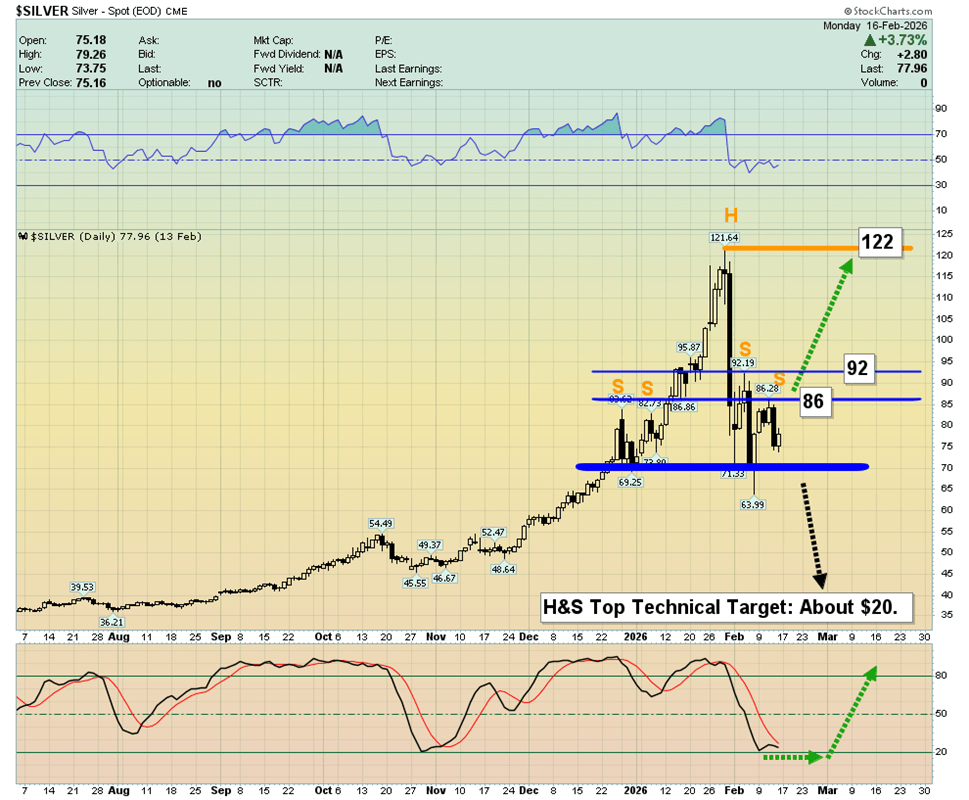
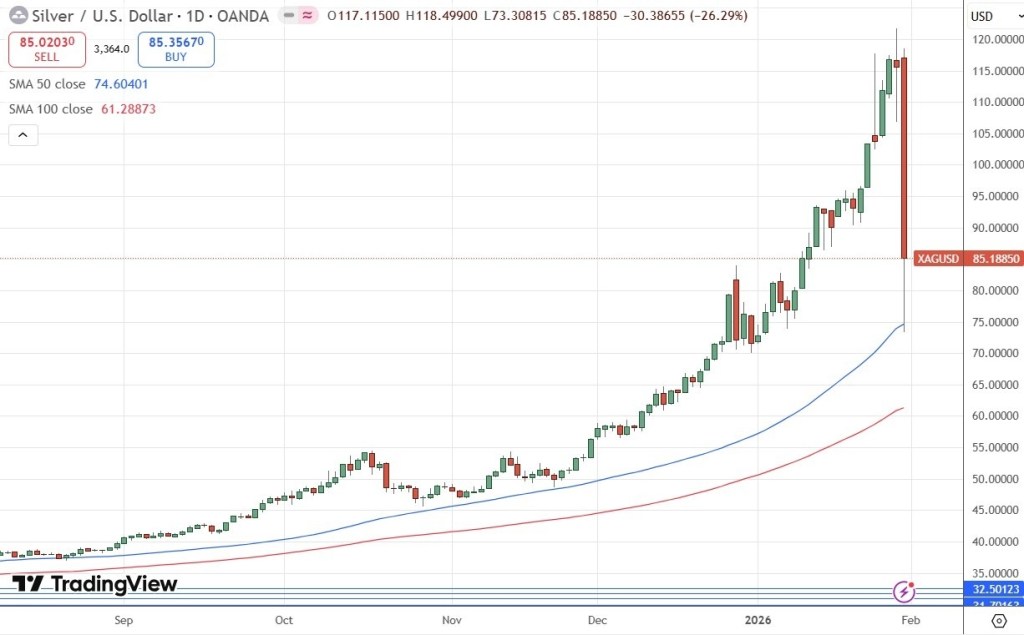
Silver Is Amplifying Market Moves
Silver’s steeper drop highlights its higher volatility and dual identity as both a precious and industrial metal. Previously impacted by speculative positioning, it is now also facing concerns about slowing global growth as rising energy costs threaten demand. This combination makes silver more vulnerable and prone to larger swings than gold.
Stability Hinges on Multiple Uncertain Factors
The outlook for gold and silver remains unclear. While February’s stabilization depended on positioning resetting, the current trajectory will be shaped by a more complex mix of factors: the persistence of the energy shock, the Federal Reserve’s response, and the direction of the US dollar. A de-escalation in geopolitical tensions could spark a quick rebound, but if inflation stays elevated and delays rate cuts, precious metals may continue to face headwinds in the near term.
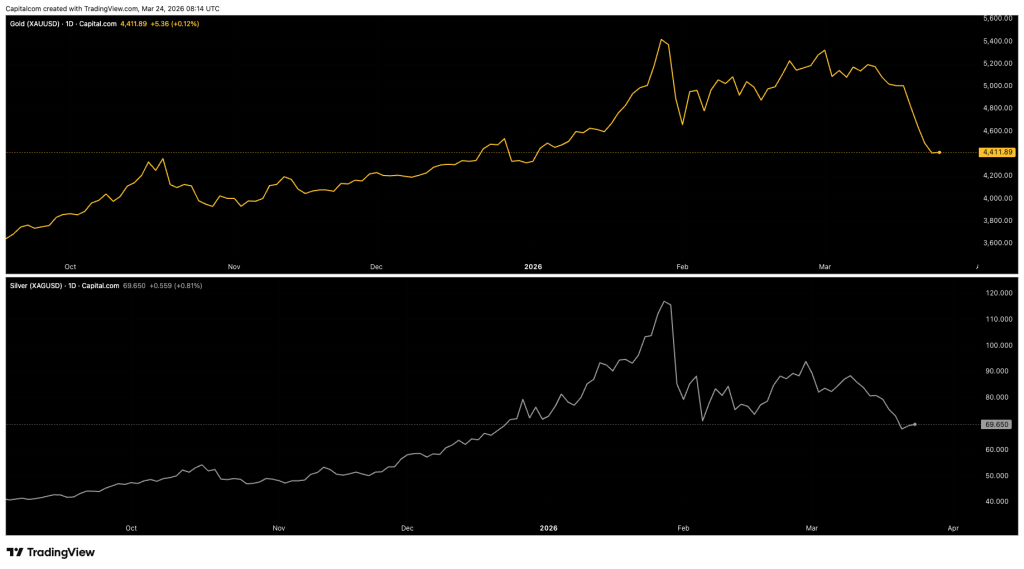
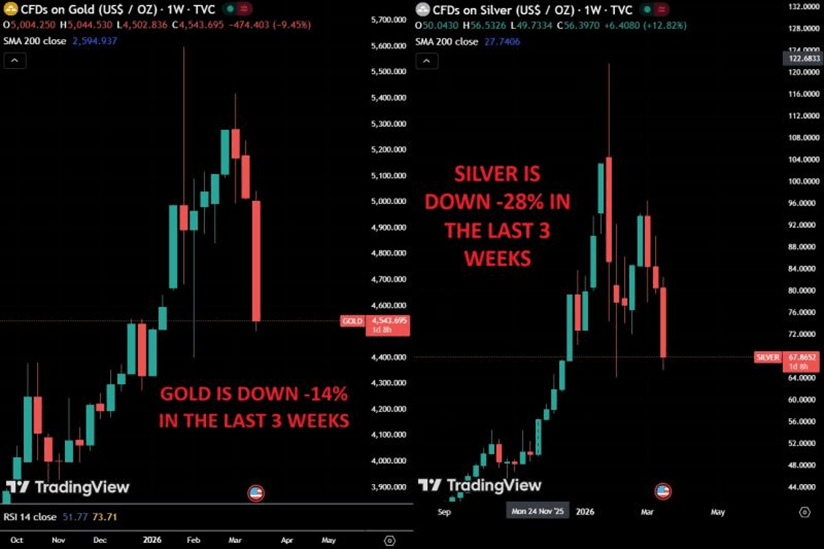
Daily Charts for Gold and Silver
Historical performance does not guarantee future outcomes.
Trading gold and silver CFDs
Whether you’re looking to go long, short, or adjust your portfolio exposure, choosing a reliable broker is essential. Ideally, this means a platform that provides round-the-clock customer support and dedicated account assistance, ensuring smooth trade execution whenever required.
Gold prices climbed during Asian trading on Wednesday, rebounding from a one-week low after the U.S. extended its ceasefire with Iran indefinitely, though uncertainty around future peace negotiations persisted.
The precious metal had come under pressure in the previous session after Federal Reserve Chair nominee Kevin Warsh indicated he had not assured President Donald Trump of any interest rate cuts if confirmed.
Spot gold gained 0.9% to $4,763.66 per ounce, while gold futures advanced 1.3% to $4,782.21/oz as of 02:45 ET (06:45 GMT). Prices continued to trade within the $4,700–$4,900 range observed over the past two weeks.
Other precious metals also posted gains, with spot silver rising 2.4% to $78.5335/oz and spot platinum increasing 2.3% to $2,087.15/oz.
On Tuesday, Donald Trump announced an indefinite extension of the ceasefire with Iran, opening the door for further negotiations between Washington and Tehran.
Despite the extension offering some near-term relief, the outlook for future peace talks remains unclear. Expected discussions between the U.S. and Iran, which were slated for Tuesday, collapsed at the last minute.
Trump also stated that a naval blockade against Iran would stay in place, prompting backlash from Iranian officials, who described the move as an “act of war.”
Gold has faced difficulties since the conflict began, as safe-haven demand has been outweighed by concerns over the war’s potential to drive inflation.
Since the outbreak of the conflict in late February, the metal has traded more like a risk-sensitive asset, often moving in line with equities as market sentiment shifts with developments in the situation.
Warsh signals no pledge on rate cuts, hints at major Fed policy changes
Precious metals came under pressure on Tuesday as the U.S. dollar strengthened, supported by market reaction to testimony from Kevin Warsh.
Warsh stressed the importance of the Federal Reserve’s independence from political influence, while also pointing to the possibility of a significant policy overhaul at the central bank if he is confirmed as chair.
A former Fed governor, Warsh is viewed as less dovish than markets had anticipated. His nomination in late January had already sparked sharp declines in gold and other precious metals.
Although his confirmation appears likely, the timeline remains uncertain. Several Republican leaders have opposed moving forward with Warsh’s appointment until the Trump administration ends its ongoing probe into current Fed Chair Jerome Powell.
As a result, Powell is expected to remain in his role beyond the scheduled end of his term on May 15, particularly if Congress delays Warsh’s confirmation.
Gold comes under renewed selling pressure in the Asian session, though losses appear contained.
Persistent inflation concerns keep U.S. bond yields elevated, supporting the dollar and pressuring the metal.
However, growing expectations of Federal Reserve rate cuts may limit further dollar strength and help support the non-yielding gold.
Gold (XAU/USD) remains under pressure and trades below the $4,800 level in the early European session on Tuesday, though it stays above the one-week low touched a day earlier. Market participants remain doubtful about a potential US–Iran deal as tensions persist around the Strait of Hormuz. The US Navy’s seizure of an Iranian-flagged cargo vessel in the Gulf of Oman, followed by Iran’s renewed closure of the key shipping route, has supported crude oil prices. This, in turn, has reignited inflation concerns, boosted the US dollar, and weighed on gold.
That said, stronger gains in the dollar appear limited as expectations for further rate hikes by the Federal Reserve continue to fade. According to the CME Group’s FedWatch Tool, markets are now pricing in roughly a 45–50% chance of a rate cut by year-end, which could cap USD strength and provide underlying support for non-yielding gold. Meanwhile, traders are likely to remain cautious amid uncertainty over whether US–Iran peace talks will materialize, making it wise to wait for clear follow-through selling before expecting deeper losses in XAU/USD.
US President Donald Trump stated that American negotiators will travel to Pakistan for another round of discussions with Iran in an effort to extend a fragile ceasefire set to expire on Wednesday. However, Iranian officials remain reluctant to engage in talks under current conditions, citing the ongoing US blockade. Parliament Speaker Mohammad Bagher Ghalibaf emphasized that Iran will not negotiate under pressure, while Foreign Minister Abbas Araghchi pointed to continued US ceasefire violations as a key obstacle to diplomacy. Despite this, reports indicate that an Iranian delegation may still head to Islamabad for negotiations.
Going forward, markets will stay highly sensitive to developments in the US–Iran situation, which could drive volatility across asset classes. In addition, traders will look to testimony from Fed Chairman-designate Kevin Warsh for further direction. Given the mixed fundamental backdrop, caution remains warranted before taking strong directional positions in gold.
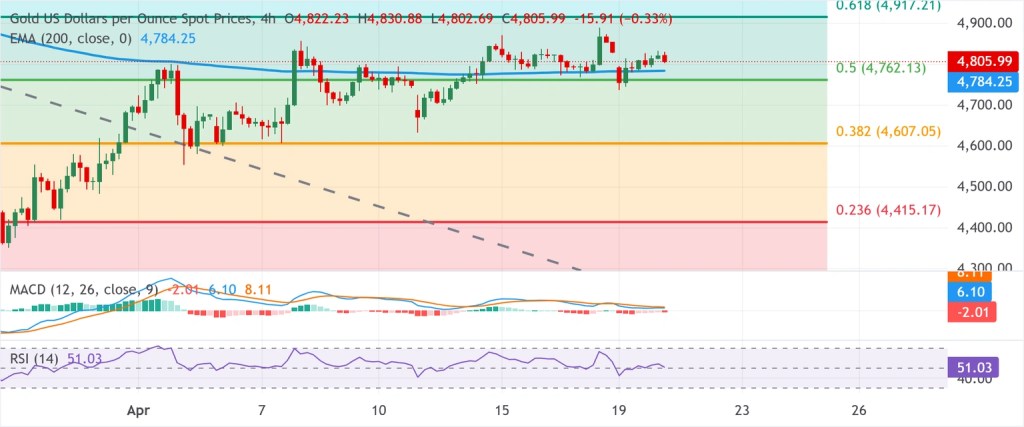
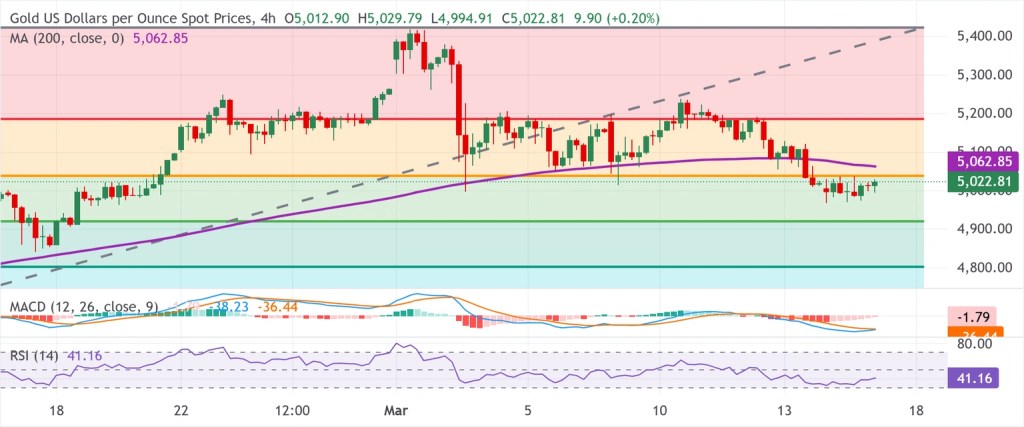
Gold (XAU/USD) – 4-hour timeframe chart
The bullish outlook for gold remains intact as long as price stays above the 200-period EMA and the 50% Fibonacci retracement, a zone that now acts as a confluence support after previously serving as resistance.
The metal continues to show a constructive short-term tone, holding above the 200 EMA at $4,784.25. Just below, the 50% retracement of the March decline at $4,762.13 reinforces this support area, suggesting underlying buying interest. However, momentum indicators are relatively neutral rather than strongly trending—RSI is hovering around 51, while MACD remains slightly in negative territory—indicating that although bulls are still in control structurally, upside momentum is not particularly strong at the moment.
In terms of levels, immediate support lies at the 200 EMA ($4,784.25), followed by the 50% retracement at $4,762.13. A decisive break below this zone could open the door to deeper Fibonacci support levels at $4,607.05 and $4,415.17, with the broader downside target near $4,105.01. On the upside, resistance begins at the 61.8% retracement level at $4,917.21, with further barriers at $5,138.01 (78.6%) and the cycle high around $5,419.25, where rejection could potentially limit further gains in the current bullish phase.
Gold continues to trade in a narrow range below the $4,800 mark early Friday, failing for a third straight day to hold above that level. Market participants remain cautious as they await clearer direction from upcoming US–Iran peace talks, while the metal still looks set for a fourth consecutive weekly gain.
Fundamental Overview
With the two-week US–Iran ceasefire set to expire on April 22, uncertainty around both the timing and outcome of the next round of negotiations continues to unsettle investors, keeping Gold prices fluctuating within a familiar range.
Upside momentum in Gold remains limited, pressured by the recent rebound in Oil prices amid ongoing concerns about supply disruptions tied to the US naval blockade of the Strait of Hormuz. Higher Oil prices have revived inflation fears, reinforcing expectations that major central banks—including the US Federal Reserve (Fed)—may maintain a tighter monetary policy stance.
Late Thursday, the US Central Command (CENTCOM) stated that the USS Abraham Lincoln is operating in the Arabian Sea as part of a large-scale enforcement of the blockade on Iranian ports, involving more than a dozen ships, over 100 aircraft, and around 10,000 personnel, with no reported violations so far.
Meanwhile, a modest rebound in the US Dollar from near six-week lows is adding further pressure on USD-denominated Gold.
That said, downside risks for the precious metal appear limited. A newly announced 10-day ceasefire between Israel and Lebanon has lifted hopes for a near-term de-escalation in the Middle East, reducing safe-haven demand for the US Dollar and offering some support to Gold.
Heading into the weekend, Gold remains directionless and highly sensitive to developments on the Middle East front. Thin end-of-week flows could also amplify price swings, especially amid lingering uncertainty over US–Iran negotiations and the durability of the Israel–Lebanon truce.
From a technical perspective, the daily chart setup adds another layer of intrigue, keeping traders focused on both geopolitical headlines and key chart signals for the next move.
XAU/USD Technical Overview
On the daily chart, XAU/USD is trading around $4,789.50, with price action confined between key support levels and overhead resistance. The metal remains supported above the 21-day and 100-day SMAs, near $4,646 and $4,715 respectively, but continues to struggle below the 50-day SMA at $4,897 and a descending trendline resistance around $4,792. The Relative Strength Index (14), hovering near 51, points to neutral momentum with a slight bullish tilt, indicating consolidation rather than a clear breakout as price lingers just beneath trend resistance.
At the same time, bearish signals persist in the background. A Bear Cross between the 21-day and 100-day SMAs confirmed on April 13, along with a similar crossover seen on March 25, continues to weigh on bullish prospects.
Looking higher, immediate resistance is seen at the descending trendline near $4,792. A decisive daily close above this level could pave the way toward the 50-day SMA at $4,897 as the next upside target. On the downside, initial support lies at the 100-day SMA around $4,715, followed by a broader ascending trendline zone in the mid-$4,500s, which reinforces demand ahead of the 21-day SMA near $4,646. Only a sustained break below these support layers would expose the longer-term 200-day SMA near $4,215.
Gold stays under pressure but lacks strong follow-through selling amid mixed signals. The US dollar finds support from ongoing Hormuz-related risks, acting as a headwind for the metal. However, optimism over Iran diplomacy and easing expectations for Fed rate hikes help cap the dollar, providing some support to bullion.
Gold (XAU/USD) trims its earlier losses from the Asian session, rebounding from the $4,768–$4,767 area—a three-day low—but struggles to build momentum and stays below the $4,800 level amid mixed signals. While diplomatic efforts to resolve the Middle East conflict are intensifying, lingering tensions between the US and Iran, particularly due to the ongoing US naval blockade of Iranian ports, continue to support the US Dollar’s safe-haven appeal and weigh on the metal.
At the same time, a 10-day ceasefire between Israel and Lebanon has raised hopes for a broader US-Iran agreement. US President Donald Trump struck an upbeat tone, suggesting Iran is close to a deal, and reports indicate both sides have agreed in principle to resume talks, though details remain undecided. These developments support a more positive market mood, which, alongside reduced expectations of further Federal Reserve rate hikes, limits the USD’s rebound from recent lows and helps cushion Gold’s downside.
Earlier in the week, US Producer Price Index (PPI) data eased concerns about inflation stemming from rising energy costs linked to the conflict. Additionally, expectations of easing geopolitical tensions have kept Crude Oil prices subdued, softening hawkish Fed expectations. Markets are now pricing in about a 30% chance of a Fed rate cut by year-end, restraining USD strength and providing support for non-yielding assets like Gold. As such, traders may prefer to wait for stronger selling pressure before anticipating a deeper pullback from the recent one-month high.
Looking ahead, the absence of key US economic data on Friday leaves the USD influenced by speeches from FOMC members. However, attention will remain focused on potential US-Iran talks over the weekend, with headlines likely to drive volatility and create trading opportunities in Gold. Despite recent fluctuations, XAU/USD is still on track for modest gains for a third consecutive week.
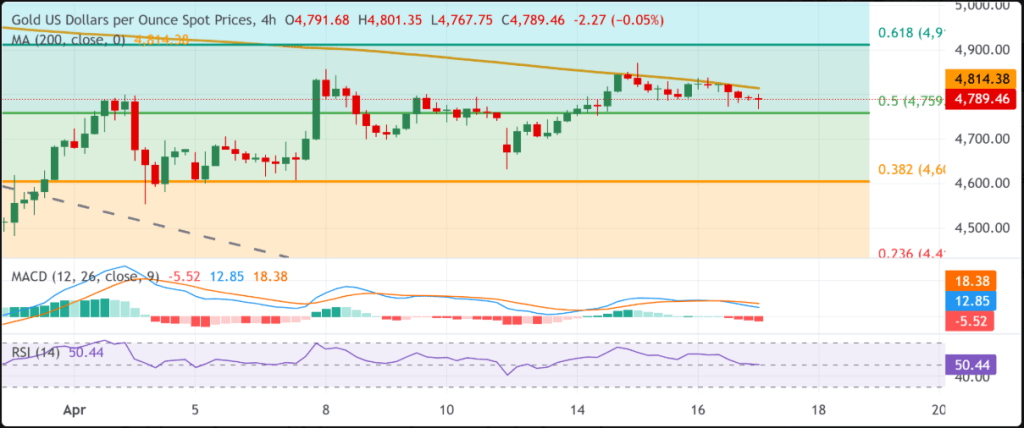
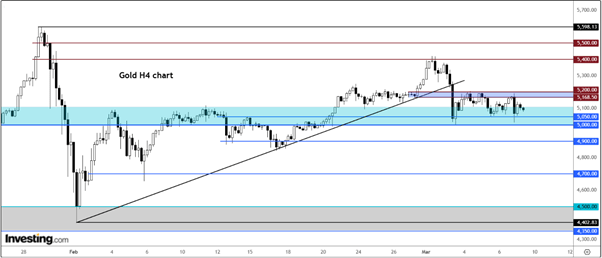
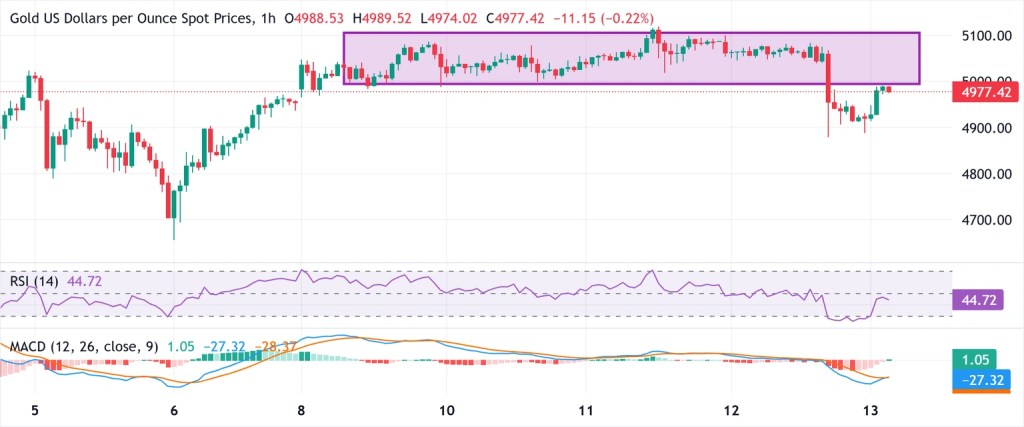
Gold H4 chart
From a technical standpoint, the failure to break above the 200-period SMA on the 4-hour chart overnight signals a note of caution for bullish traders. Although prices pulled back afterward, the decline found support ahead of the 50% retracement of the March drop, suggesting that traders may prefer to wait for a decisive move below the $4,765 support area before anticipating deeper losses.
Momentum indicators offer a mixed picture. The RSI is hovering around the neutral 50 level, while the MACD remains below the zero line in negative territory, indicating that sellers still hold a near-term edge. For sentiment to improve, price would need to reclaim the 200-period SMA near $4,814, followed by a stronger resistance at the 61.8% Fibonacci retracement around $4,912. A sustained breakout above these levels could shift the outlook more positively and pave the way toward $5,130 and $5,409.
On the downside, immediate support lies near the 50% retracement at $4,759. A break below this level could lead to further declines toward $4,606 and then $4,416, where buyers may step in more aggressively to defend the broader uptrend.
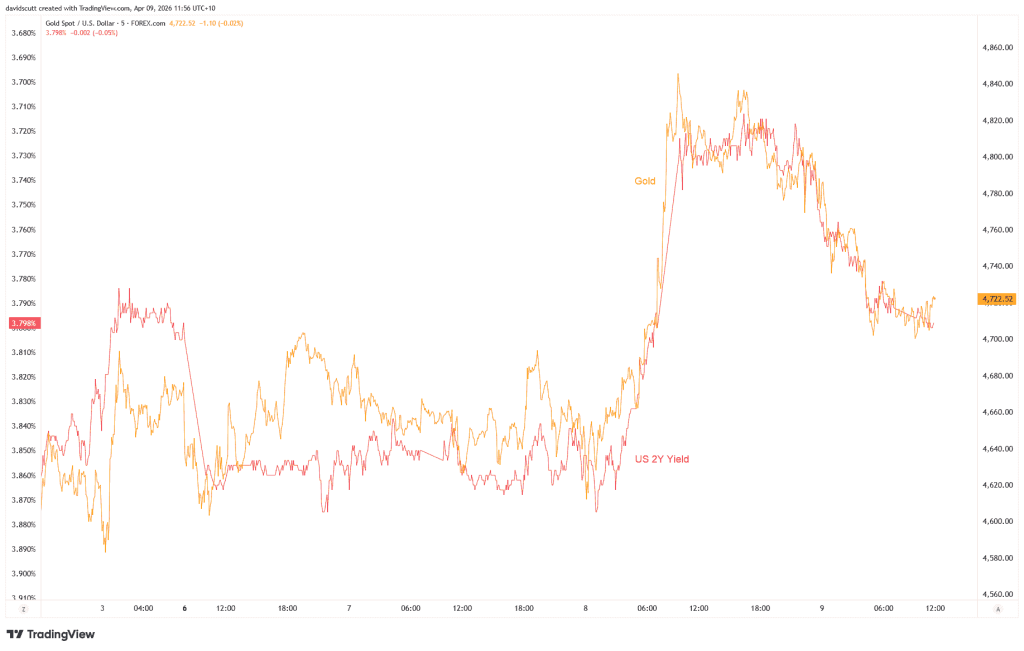
Gold is once again being driven primarily by interest rates rather than risk sentiment, with US Treasury yields taking the lead as markets head into a heavy US data schedule.
The inverse relationship between gold and yields has strengthened notably, placing key inflation readings like CPI and core PCE at the center of attention. Prices are currently moving within a clear range, with support around $4700 and resistance between $4800 and $4850. The next directional move will likely depend on whether yields continue rising or begin to ease, while ongoing developments surrounding the US–Iran ceasefire remain a secondary influence.
This renewed sensitivity to yields signals a return to more traditional macro dynamics, following a period where gold traded more like a high-volatility risk asset.
Whether this rate-driven relationship will persist is still uncertain. However, with correlation coefficients currently sitting in the high negative 0.9 range across both short- and long-term Treasury yields, gold is now highly sensitive to movements in interest rates. This sharp linkage brings not only developments in the US–Iran ceasefire into focus, but also an upcoming wave of US economic data that is likely to challenge and validate the strength of this relationship in the near term.
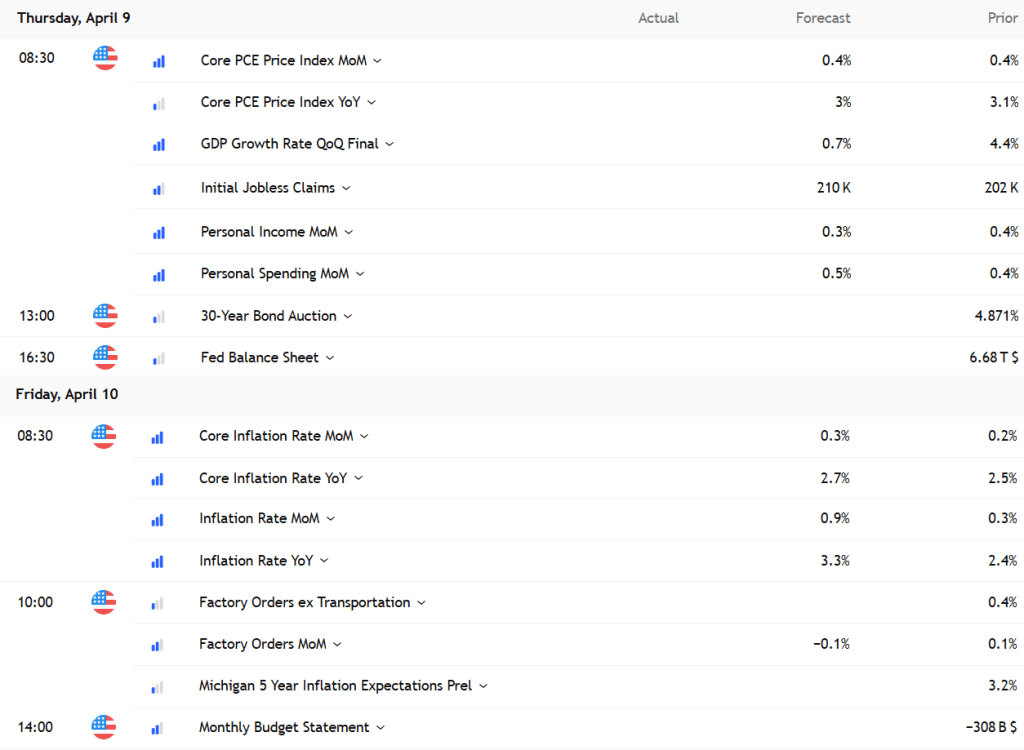
Inflation data is set to put this relationship to the test.
While the Fed’s preferred inflation gauge, the core PCE deflator, is due later today, it may carry less weight as it reflects February data and predates the energy price shock linked to the Iran conflict. Instead, markets may focus more on income and spending figures for clues on consumption and broader economic momentum in the March quarter. Strong data could reignite concerns about rising inflation, while weaker numbers may ease pressure by signaling softer demand and hiring.
Following a weak 10-year Treasury auction midweek, attention may also turn to the 30-year bond auction for its impact on yields. Still, Friday’s release of March CPI is expected to be the key event. Headline inflation is likely to rise due to energy costs, but the critical question is whether those pressures spill into core inflation. Any reading above the 0.3% forecast could push markets to reconsider the possibility of Fed rate hikes rather than cuts this year.
Inflation expectations will also be in focus, with the University of Michigan’s 5-year outlook offering timely insight into consumer sentiment around future prices, wages, and spending.
If inflation surprises to the upside, Treasury yields are likely to climb—potentially weighing on gold given their strong inverse relationship. Conversely, softer inflation data could support bullion. Beyond economic data, developments surrounding the US–Iran ceasefire remain an important underlying risk factor.
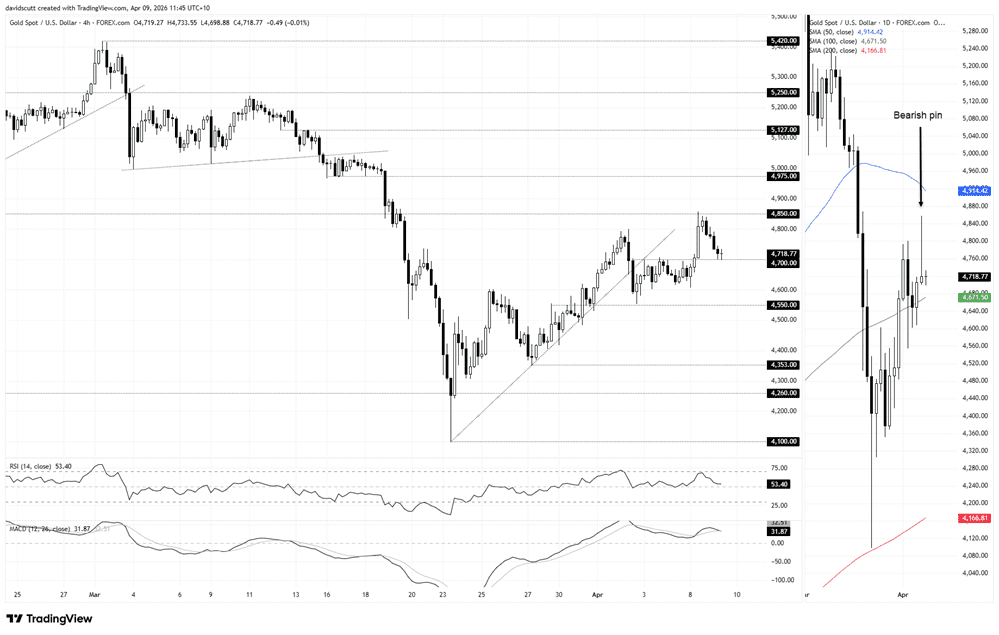
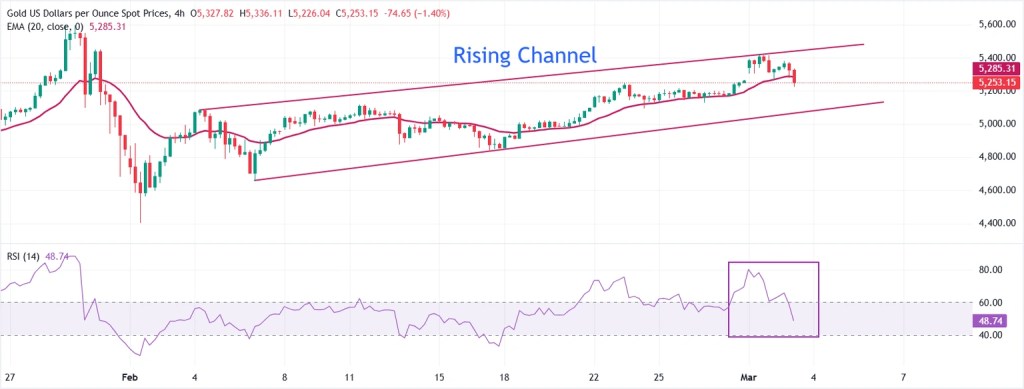
Price action remains orderly and well-defined.
On the daily chart, the presence of a bearish pin bar reinforces the earlier signal that sellers are active in the $4800–$4850 zone, establishing it as a key overhead resistance area for traders.
A closer look at the H4 timeframe confirms both this resistance and the overall clarity of gold’s price action, especially given the broader macro volatility. The $4700 level, which previously acted as resistance, has now flipped into support and serves as the first downside level to watch. Below that, $4600 and $4550 emerge as additional support zones if the current range breaks.
On the upside, a sustained move above $4850 would open the door toward $4975, with the 50-day moving average sitting in between as a potential intermediate hurdle. Momentum indicators such as RSI (14) and MACD remain neutral, offering no strong directional bias and reinforcing the importance of reacting to price behavior around key levels.
From a short-term trading perspective, long positions could be considered above $4700 with tight risk control below that level, targeting a move back toward $4850 resistance. However, conviction in this setup is limited, and a confirmed bounce from $4700 would provide a more reliable entry signal.
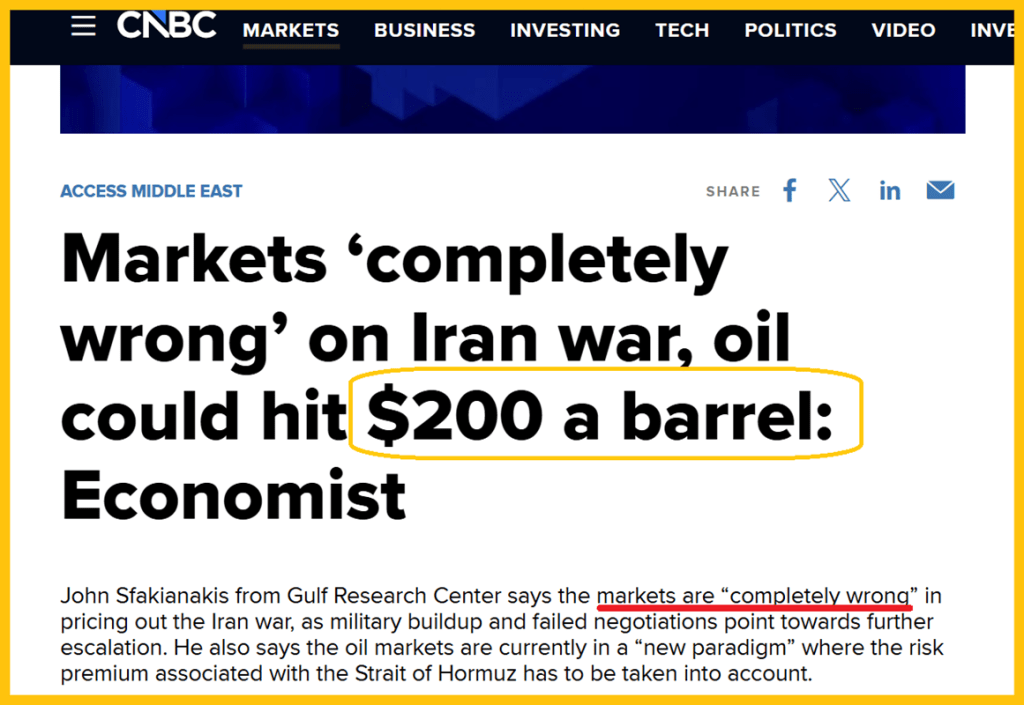
Could markets be misjudging both oil and the war, as this analyst argues?
Possibly—but what about the relationship between oil and gold? The mainstream narrative suggests that surging oil prices are a bearish signal for gold, based on claims that “gold yields no interest” and that “the Fed might raise rates by a quarter point (though it’s unlikely), while real inflation runs near 15%,” leading to the conclusion that “gold should decline sharply against fiat currencies.”
Western analysis of oil, war, and gold is deeply troubling—arguably even reprehensible. It feels like something straight out of a Nineteen Eighty-Four… except it’s happening in reality.
A closer look at currency market dynamics suggests that as interest rates rise, the heavily indebted U.S. government faces increasing borrowing needs to sustain its finances. This pressure can lead to policies that shift the burden beyond its borders, affecting global economic stability.
History offers parallels—such as Ancient Rome—where excessive debt strained state behavior and credibility. Some argue that similar pressures are emerging in modern fiscal systems.
In simple terms, critics of fiat systems view government-issued currency as vulnerable to mismanagement, while seeing gold as a more reliable store of value for individuals worldwide.
What are the most attractive price levels for investors to accumulate more gold? Looking at the daily chart, the $4,400 range previously acted as a strong buying zone, while $4,100 represented a secondary level of support.
That said, investors may benefit more from focusing on time rather than precise price points. If gold trades within a range for the rest of the year, a disciplined accumulation strategy—such as monthly purchases (or weekly for more aggressive investors)—could be more effective.
Time-based buying helps reduce the emotional stress of trying to predict short-term price movements, which often leads to cycles of fear and greed.
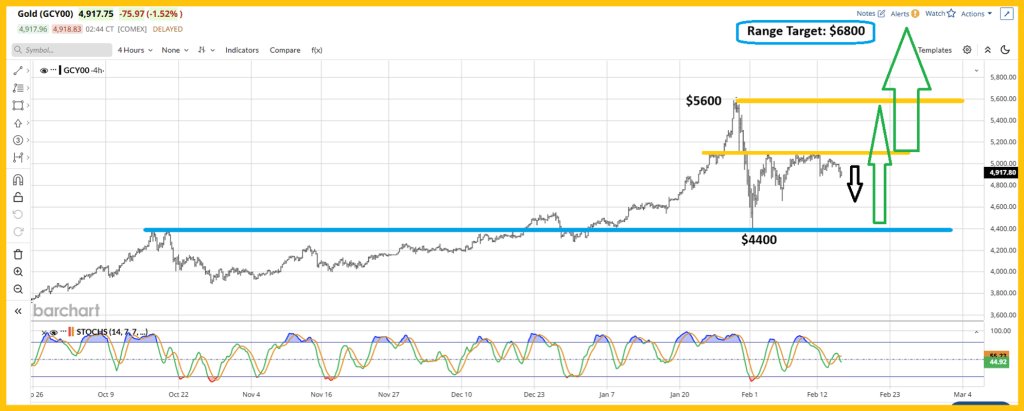
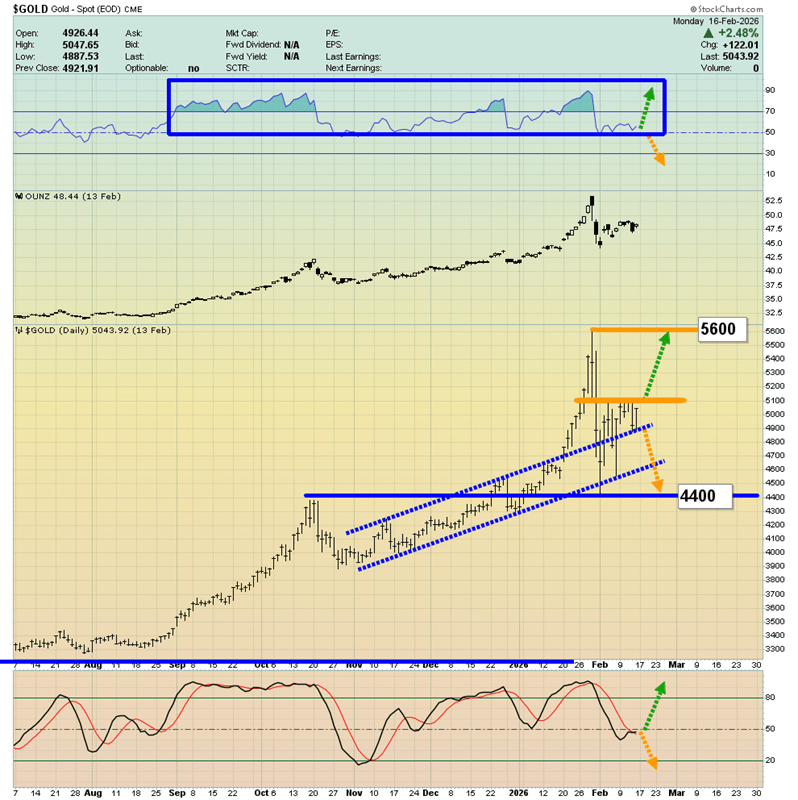
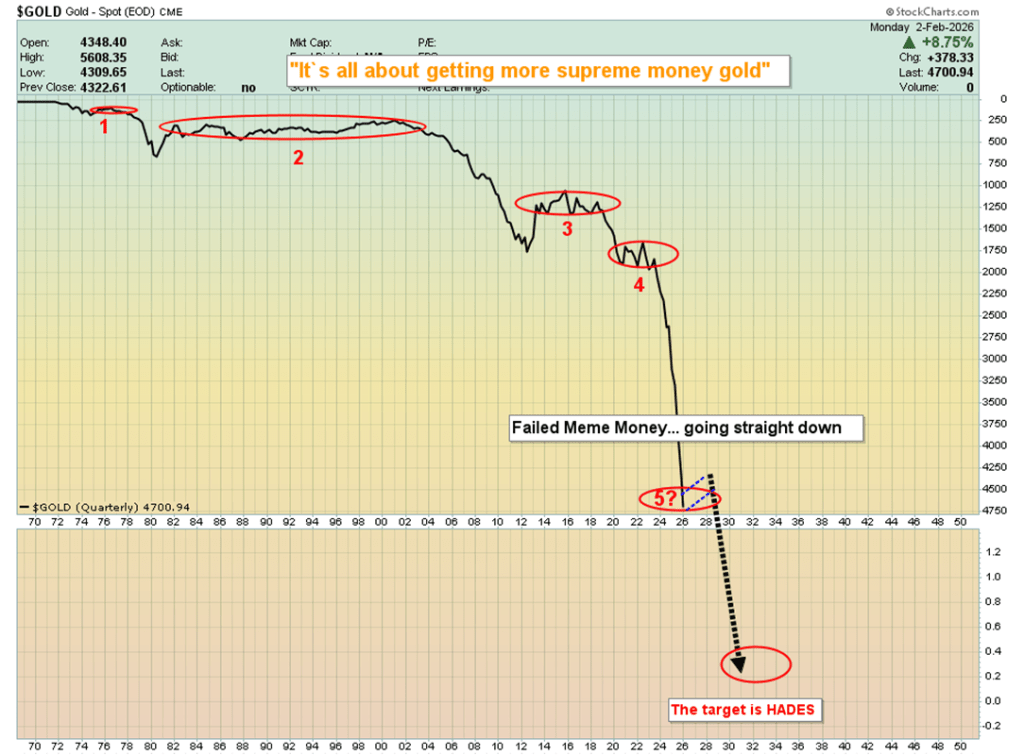
Ultimately, steadily increasing gold holdings may matter more than timing the exact entry. Still, from a price perspective, the $5,600, $3,900, and $3,500 levels could all serve as attractive accumulation zones if the market pulls back.
If gold were to climb into the $6,500–$7,500 range, then $5,600 could become a particularly significant support level—potentially one of the most important in the market’s history. From there, some bullish scenarios suggest the possibility of a powerful rally toward $15,000–$20,000.
Such dramatic price action would likely require major catalysts—such as sustained inflation, escalating debt pressures, geopolitical instability, or a significant loss of confidence in fiat currencies.
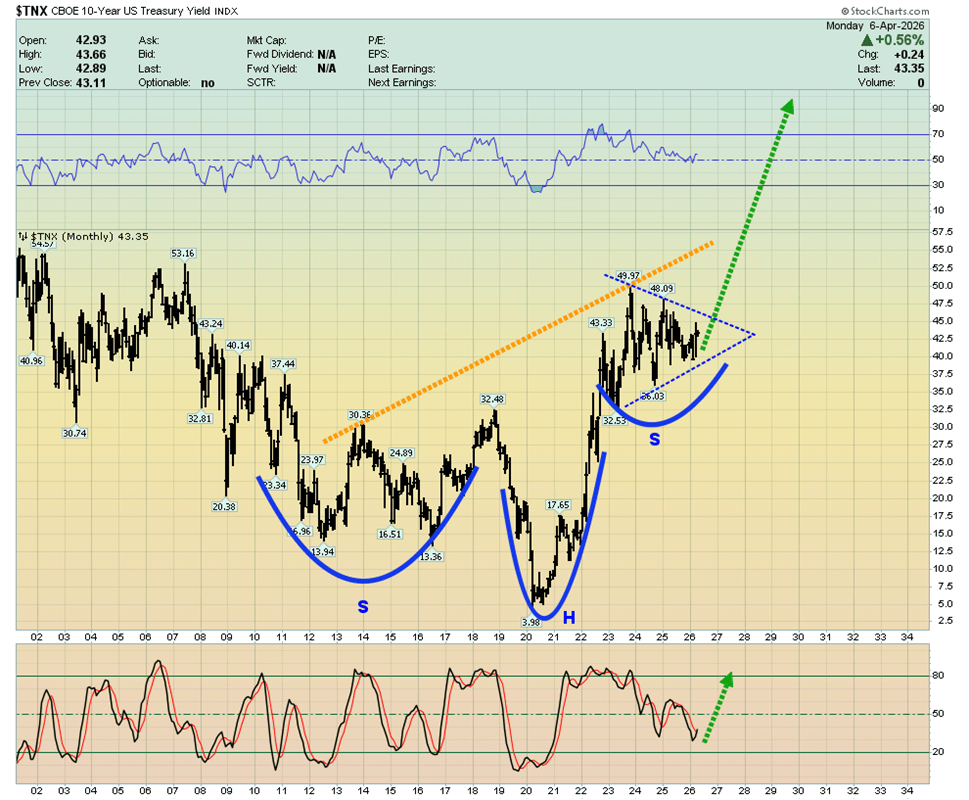
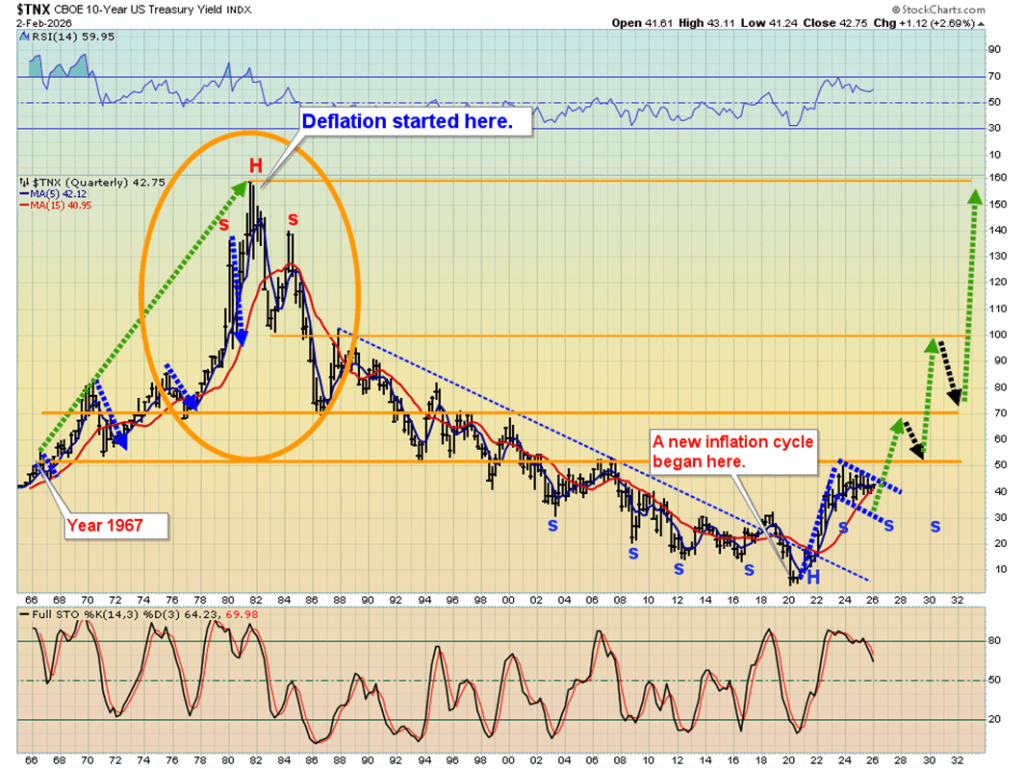
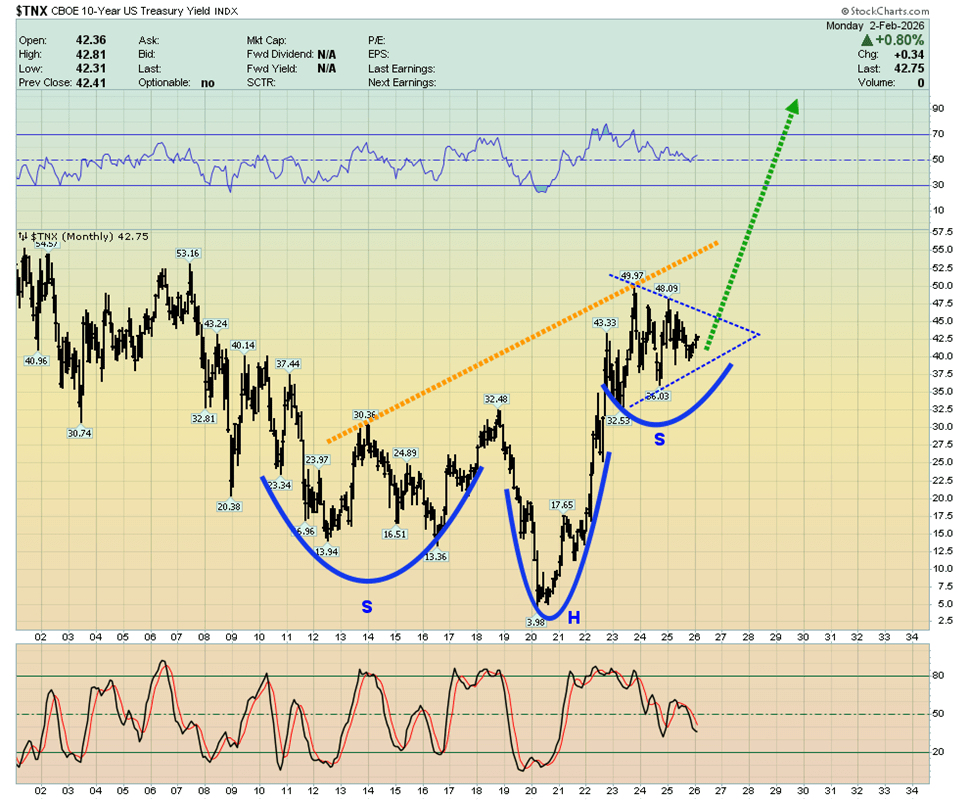
The U.S. interest rate chart is drawing attention, with what appears to be a large inverse head-and-shoulders pattern suggesting a potential move toward the 7%–8% range.
At the same time, many argue that the real inflation experienced by average Americans may be closer to 8%–15%, higher than official figures. If that view gains traction, the prevailing institutional narrative—where rising rates are seen as negative for gold—could shift.
Instead, rising rates might come to be interpreted as a signal that inflation is persistent and that government financing pressures are intensifying. In that scenario, investors could increasingly turn to gold, viewing it as a hedge and continuing to accumulate it over time.
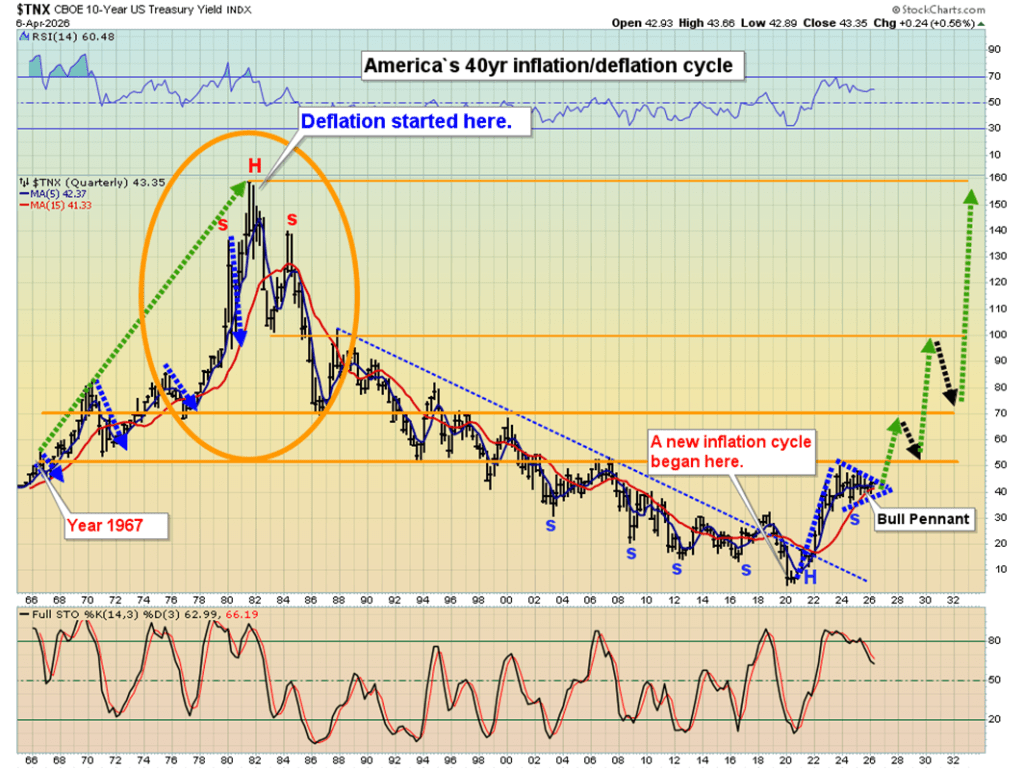
A long-term view of the 40-year U.S. inflation–deflation cycle suggests that policy shifts could have major consequences. If a future Fed leader—such as Kevin Warsh—were to scale back quantitative easing, government borrowing pressures would likely remain.
Even without aggressive rate hikes from the Federal Reserve, market forces themselves could push interest rates higher.
For investors, maintaining a focus on the broader macro picture is essential. Key factors shaping the landscape include inflation trends, tariffs, geopolitical tensions, elevated equity valuations, debt ceiling challenges, and potential shifts in global economic leadership.
Critics argue that instead of implementing significant spending cuts, policymakers have relied on measures like tariffs, which may contribute to inflationary pressure. At the same time, rising fiscal deficits and geopolitical risks could undermine confidence in government bonds, prompting central banks and institutional investors to reduce their holdings.
This dynamic may create a feedback loop: higher debt levels, rising borrowing costs, and declining bond demand reinforcing one another.
In that context, some bullish perspectives suggest that gold could see substantial long-term gains, while interest rates could continue trending higher—though projections as extreme as $20,000 gold or 20% rates remain highly speculative and dependent on extraordinary economic conditions.
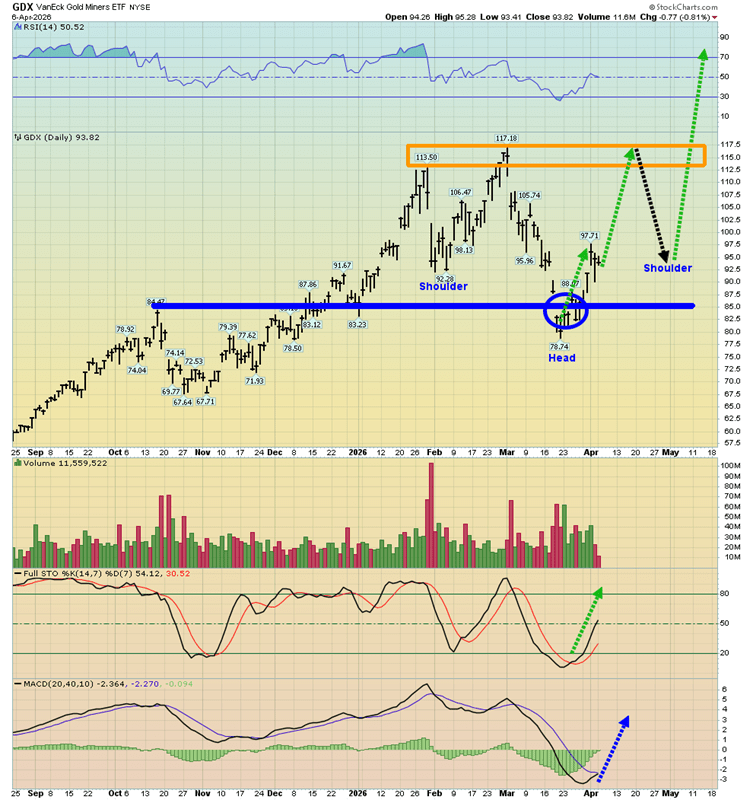
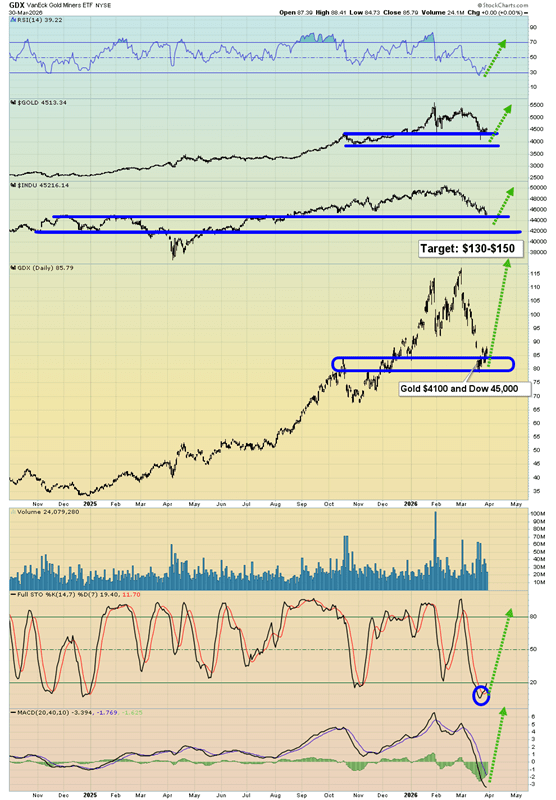
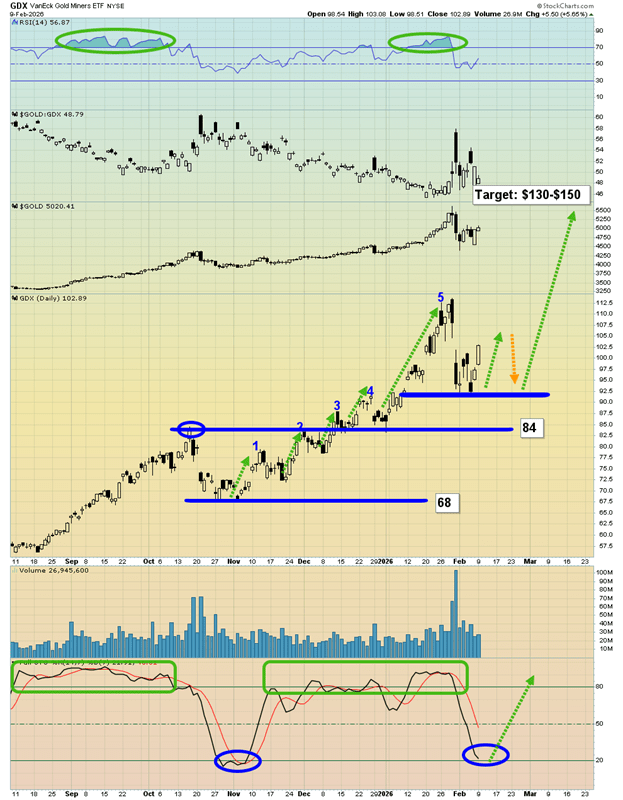
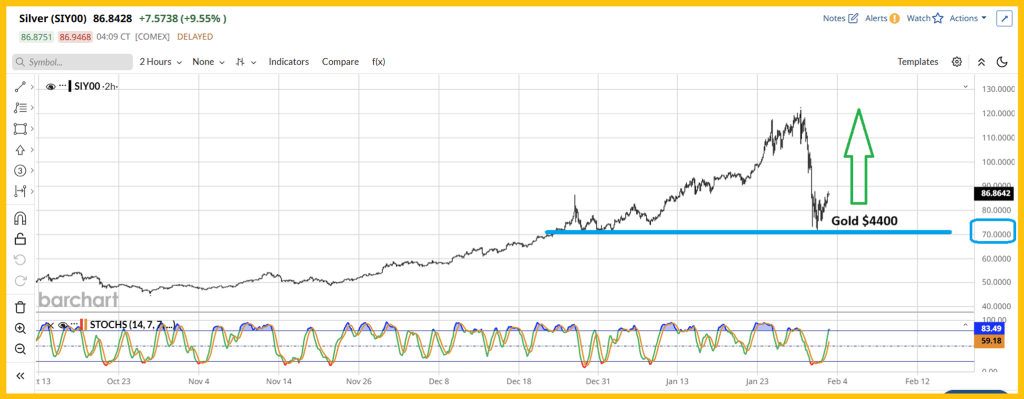
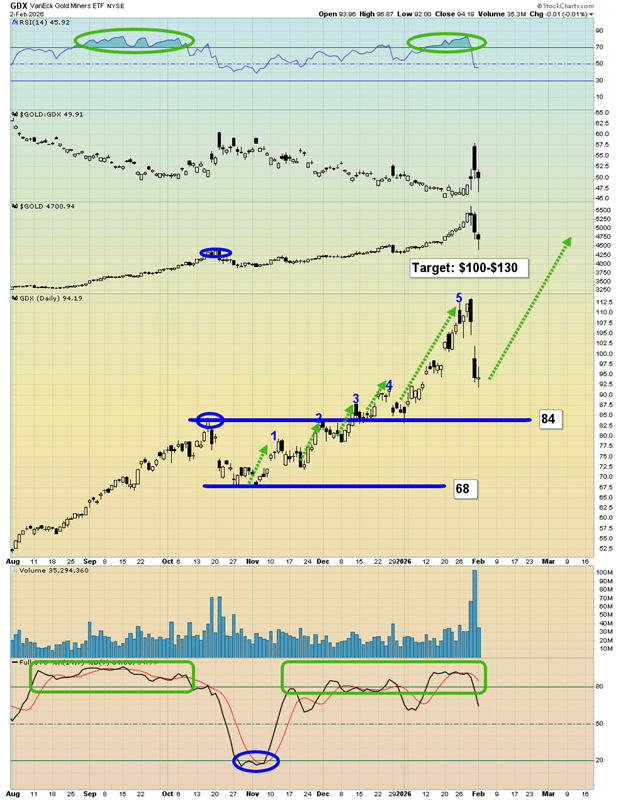
And what about the miners? The GDX chart looks particularly impressive, with a clear inverse head-and-shoulders pattern forming. The head developed around the critical $85 support level, where the 14,7,7 Stochastics oscillator also signaled a bottom.
After a brief two-day pullback, price is now hovering near $92—potentially setting up as a springboard for the next upward move. At the same time, a broader buy signal from the 20,40,10 MACD indicator appears to be on the verge of triggering—possibly as soon as today.
Gold prices dipped in Asian trade on Tuesday, marking a third consecutive day of losses, as investors grappled with inflation and interest-rate concerns ahead of U.S. President Donald Trump’s looming deadline on Iran. Spot gold eased about 0.2% to roughly $4,640 an ounce by early U.S. trading, while U.S. gold futures also retreated. Markets had closed lower on Monday after a volatile session.
Trump’s warning to Iran fuels concerns about rising inflation.
Trump’s escalating rhetoric on Iran added to inflation concerns, even as geopolitical tensions intensified. He warned that Iran could face severe consequences if it failed to reopen the Strait of Hormuz by his Tuesday 8 p.m. ET deadline, increasing fears of a wider conflict in the Middle East.
The standoff has already disrupted global energy supplies and driven oil prices higher, further fueling inflation expectations and clouding the outlook for monetary policy.
Although gold is usually supported by geopolitical uncertainty, it has instead weakened as rising oil prices feed inflation worries and reduce the likelihood of near-term interest rate cuts by the U.S. Federal Reserve.
Higher interest rates tend to weigh on non-yielding assets like gold, while a stronger dollar has also added pressure on bullion prices.
Iran has turned down a U.S. proposal for a ceasefire.
Diplomatic efforts to ease the conflict have made limited headway. Iran has rejected a U.S.-backed proposal for a 45-day ceasefire and a phased reopening of the Strait of Hormuz.
Instead, Tehran is pushing for a comprehensive settlement that includes sanctions relief, security assurances, and compensation for damages.
The absence of any breakthrough has increased uncertainty in financial markets, with investors closely monitoring developments ahead of Trump’s deadline.
Market participants are also awaiting key U.S. inflation figures due on Friday, which are expected to offer further signals on the Federal Reserve’s interest rate path.
In other precious metals, silver declined 0.9% to $72.16 per ounce, while platinum fell 1% to $1,963.60 per ounce. Meanwhile, copper prices moved higher, with benchmark London Metal Exchange futures rising 0.7% to $12,422.5 a ton, and U.S. copper futures edging up 0.3% to $5.62 per pound.
UBS remains bullish on gold, expecting prices to hit fresh highs this year as upside risks continue to build, according to strategist Joni Teves in a Thursday note.
Gold has faced pressure recently, as markets reacted to the inflationary effects of rising oil prices and the possibility of further interest rate hikes. Higher U.S. real yields and a stronger dollar have also weighed on the metal.
Despite this, Teves views recent declines as buying opportunities. He noted that the likelihood of gold extending its bull run over the next few years is increasing, particularly if weaker economic growth leads to fiscal or monetary stimulus—factors that would support higher prices. UBS reiterated that its overall outlook remains unchanged, continuing to expect new highs this year and encouraging investors to use pullbacks to build positions.
The bank now forecasts gold to average $5,000 per ounce in 2026, slightly lowered from its previous $5,200 estimate due to recent price adjustments after January’s peak. Projections for 2027 and 2028 remain unchanged at $4,800 and $4,250, respectively.
Teves also pointed out that speculative positions have been largely cleared out, while ETF outflows remain limited, creating room for renewed investor demand. Strong inflows into gold ETFs in China and steady domestic physical demand are expected to support imports through the second quarter. UBS believes the market is currently underinvested and sees any dip toward $4,000 as an attractive entry point. The bank also highlighted a structural shift, with more investors—both public and private—treating gold as a long-term strategic asset for diversification and portfolio protection.
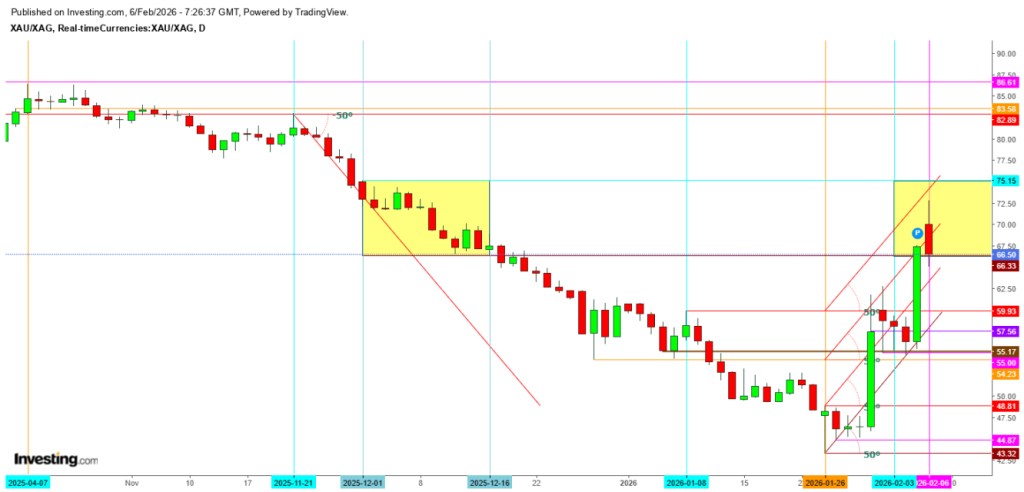
For silver, UBS lowered its 2026 forecast to $91.9 per ounce from $105, though it still expects silver to outperform gold during rallies. However, Teves cautioned that silver’s industrial exposure makes it vulnerable to global economic slowdowns, which could weaken demand and sentiment. As a result, the gold-to-silver ratio may struggle to revisit earlier lows and is more likely to bottom in the 50–60 range rather than around 40.
Platinum and palladium face similar challenges from softer industrial demand, although potential supply disruptions—especially if Middle East tensions affect South African mining—could offer some support.
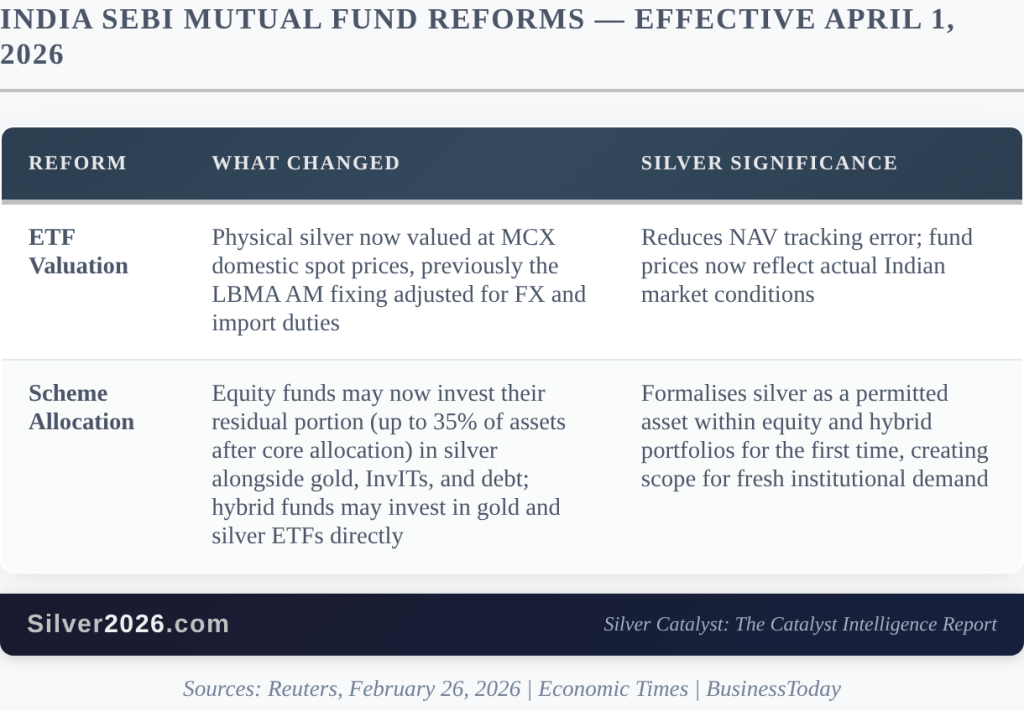
For the first time, India’s mutual fund industry is now permitted to include silver within equity and hybrid portfolio structures, marking a significant shift in asset allocation options.
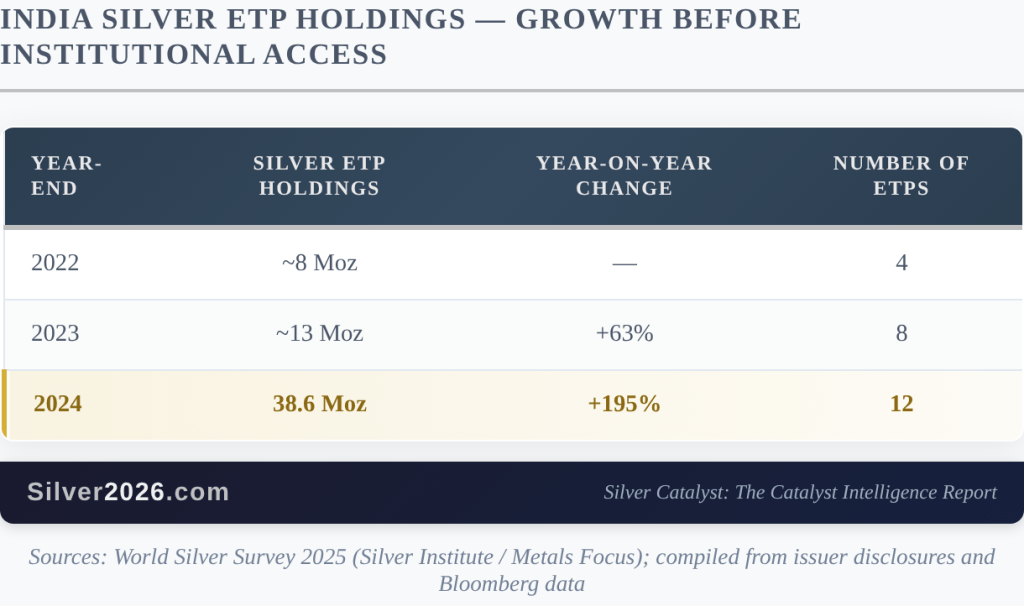
To put this into perspective, India is already the world’s most silver-intensive consumer market in bullion and investment demand. Silver imports reached a record 247.4 million ounces (Moz) in 2024, while holdings in silver ETFs surged about 195% year-on-year—from roughly 13 Moz at the end of 2023 to 38.6 Moz by the end of 2024, nearly tripling within a single year. This growth reflects a deeply rooted cultural preference for silver that is not matched in most Western markets.
Despite this strong demand base, India’s large institutional capital pools previously had no scalable or direct route to allocate to silver ETFs through standard equity and hybrid fund structures.
As of April 1, 2026, that constraint has been lifted.
What SEBI Has Changed and Why It Is Important
India’s Securities and Exchange Board of India has officially introduced two linked reforms today, reshaping the way mutual funds in India are able to invest in silver.
The valuation change is largely technical but still important: funds benchmarked to the London price previously traded at a persistent divergence from actual silver prices in Mumbai. That spread acted as a structural barrier to institutional participation. Its removal effectively eliminates an arbitrage that had made silver ETF exposure in India less precise for fund managers.
The allocation change, however, is the more consequential structural shift.
India’s mutual fund industry manages around ₹82 trillion (about $950 billion) in assets under management as of February 2026. Equity and hybrid schemes form the largest segment. Before this reform, these schemes were not permitted to allocate to silver at all. The new framework changes that, though access is limited to the residual allocation bucket—assets left after meeting core equity or hybrid mandates—capped at 35% and shared among gold, InvITs, and debt instruments as competing options.
To put the scale in perspective:
A 0.1% allocation from equity and hybrid AUM into silver ETFs would translate to roughly $950 million in new demand, or about 13 Moz at current prices.
A 0.5% allocation would imply around $4.75 billion, or approximately 65 Moz.
A 1.0% allocation would equate to about $9.5 billion, or roughly 130 Moz.
These figures represent potential scale rather than immediate inflows; actual deployment will depend on how quickly fund managers adopt the new flexibility and is expected to unfold gradually. Moreover, this is a simplified upper-bound illustration, as silver must compete within the residual bucket alongside other asset classes such as gold, InvITs, and debt. Analysts cited by the Economic Times suggest most equity schemes are unlikely to fully utilize the 35% cap and will instead treat precious metals as a tactical, not structural, allocation.
Even so, when set against a sixth consecutive structural silver deficit projected at around 67 Moz by Metals Focus and the Silver Institute, even conservative participation levels could be material relative to the underlying supply shortfall.
The growth trend that was already in motion
What makes this reform significant is the existing momentum it builds upon. Even before institutional access was expanded, Indian retail investors were already fueling strong growth in silver ETPs:
That nearly threefold increase between 2023 and 2024—and almost fivefold growth over two years—was driven entirely by retail investors and fund categories that already had permission to hold silver. The institutional equity and hybrid segment contributed nothing to that expansion.
The SEBI reform today layers institutional access onto a base that was already accelerating at a 63% annual growth rate before 2024, before surging 195% in 2024 alone. The key question is no longer whether institutional capital will eventually flow into silver through this channel, but how quickly fund managers begin acting on a mandate that did not exist until now.
Why Institutional Flows Behave Differently
Retail silver demand in India is inherently cyclical and seasonal. Wedding seasons drive jewelry and silverware purchases, while festivals spur buying of coins and bars. This demand is substantial—reflected in 247.4 Moz of imports in 2024—but it fluctuates strongly with the calendar.
Institutional allocations operate on a different mechanism. Once a fund’s mandate includes silver ETFs, exposure is expressed as a portfolio weight and rebalanced systematically over time. It does not switch off after festivals, weaken during sentiment downturns, or disappear in corrections. The first clear signal of adoption will likely appear in AMFI monthly flow data, which tracks how mutual funds are reallocating across asset classes, showing whether managers are actively implementing the new framework or taking a cautious, wait-and-see approach.
The structural significance, therefore, is not immediate multi-billion-dollar inflows. It is the creation of a permanent allocation channel in a market that already combines the world’s largest physical silver demand base with a rapidly expanding institutional asset management system.
The SEBI reform is one component. The broader story is the convergence of multiple catalysts within a very short time window.
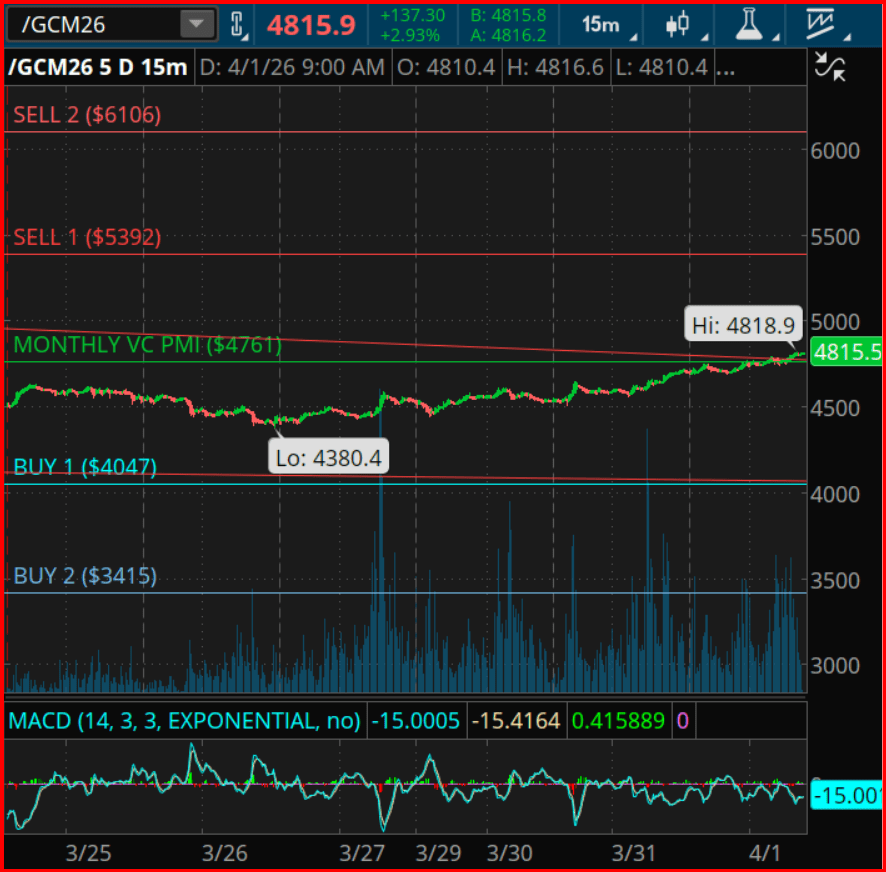
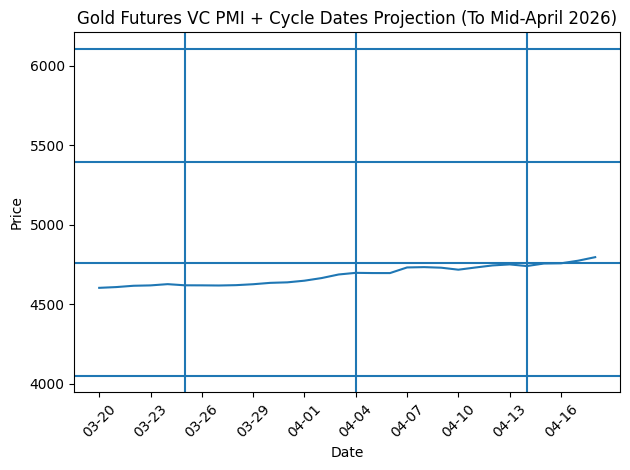
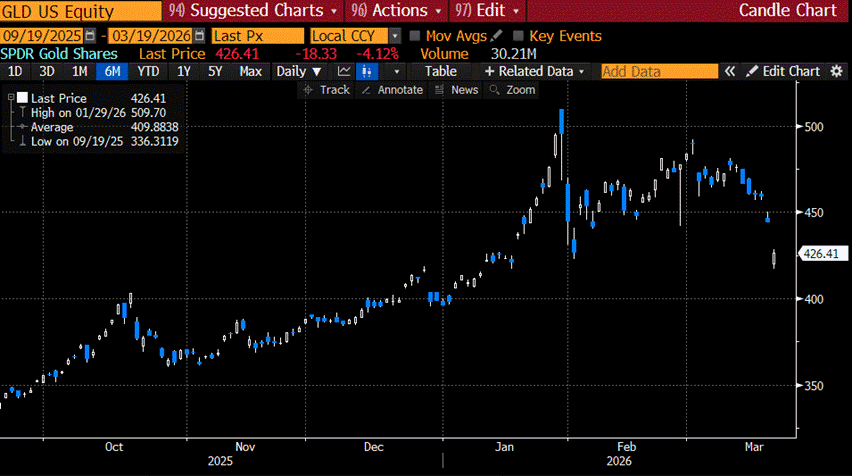
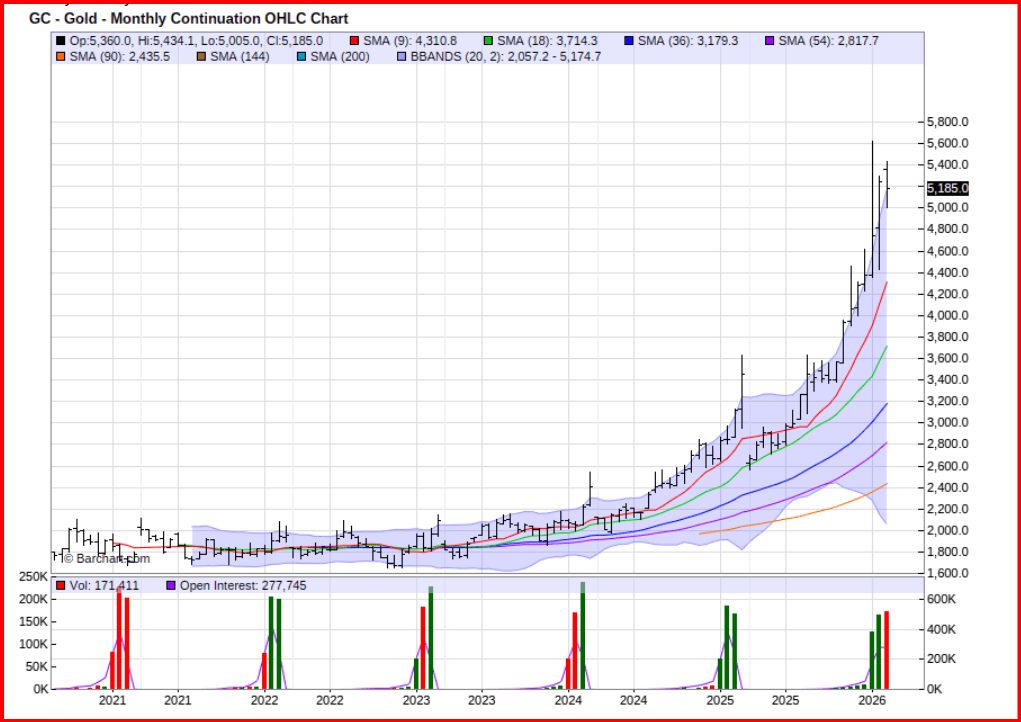
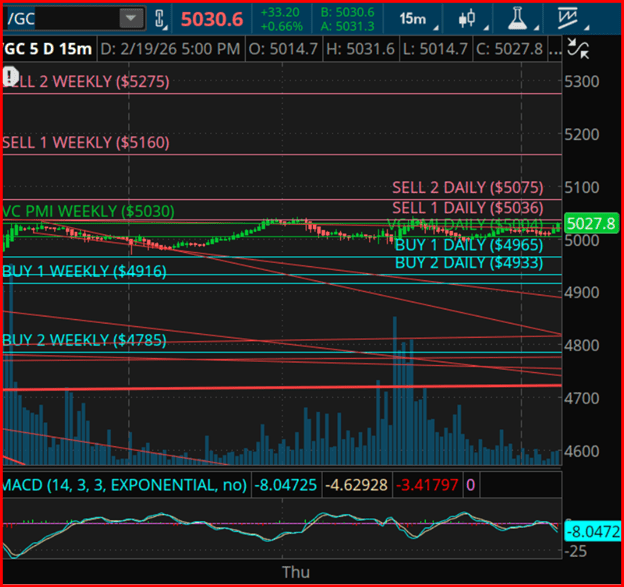
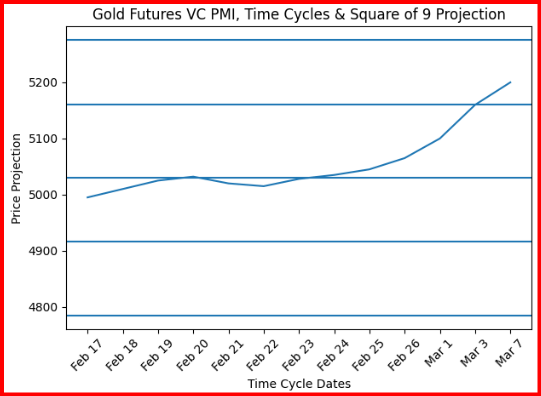
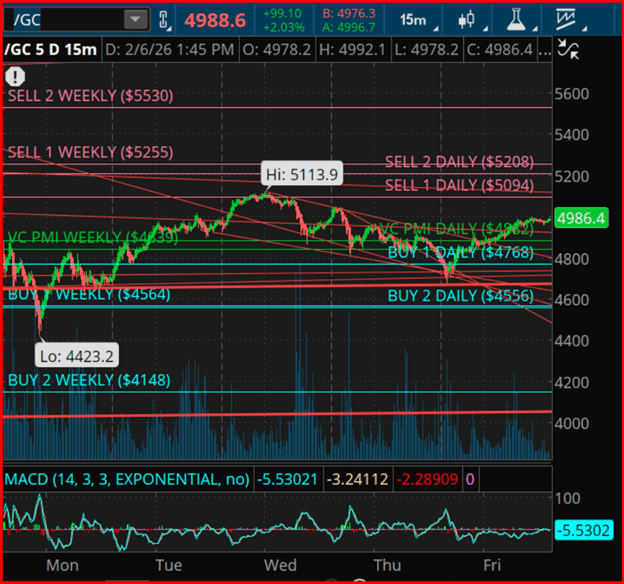
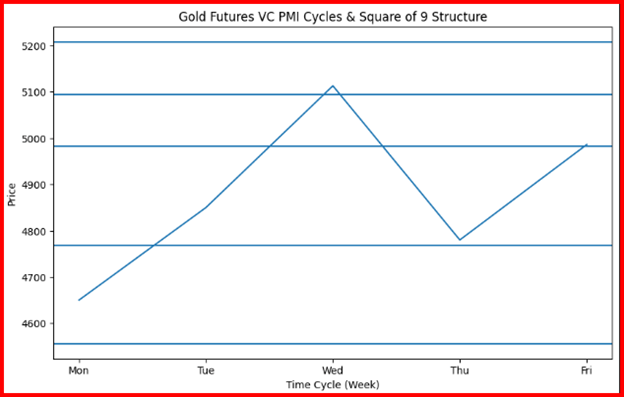
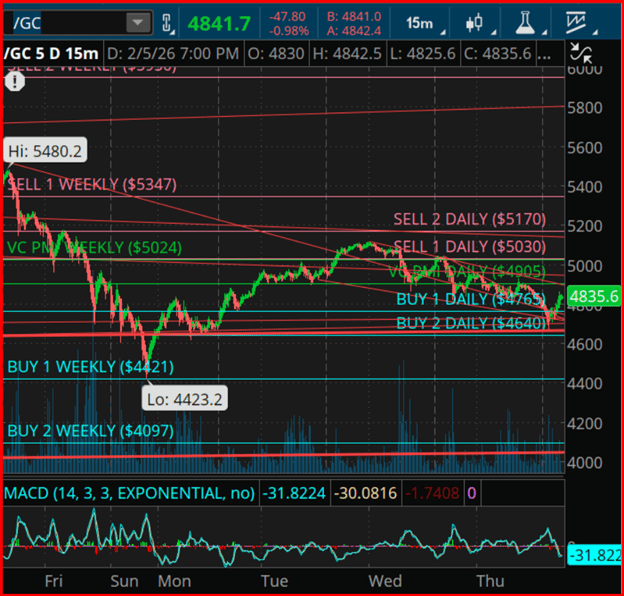
Gold futures continue to display a strong bullish monthly structure, with momentum remaining firmly upward as prices hold above the VC PMI mean at $4,761. This level acts as a key equilibrium point, and sustained trading above it is typically interpreted as a sign of institutional accumulation and ongoing trend strength.
The recent move into the $4,815–$4,820 area suggests the market is shifting from a consolidation phase into a broader expansion phase. At the same time, rising volatility is increasingly aligned with upward price continuation, supporting a bias toward further gains.
From a VC PMI perspective, the market has held above the Buy 1 level at $4,047, where historical demand typically emerges with a high probability (around 90%) of mean reversion. The fact that price has not retested this level further strengthens the bullish structure and suggests continued buyer dominance.
On the upside, the next key structural reference points are Sell 1 at $5,392 and Sell 2 at $6,106, which are viewed as extended deviation zones above the mean. As price moves closer to these areas, conditions tend to favor profit-taking rather than new long entries.
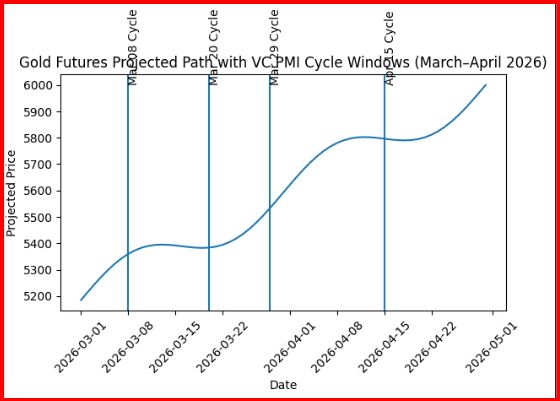
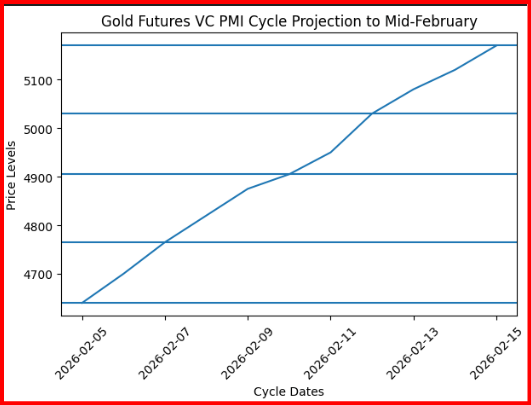
Cycle analysis also points to a favorable momentum phase extending into early to mid-April, supporting continued upside expansion in line with the recent breakout above the mean. A key cycle turning point is expected around mid-April, where the market may either accelerate toward Sell 1 or enter a period of consolidation. Looking further ahead into May–June, broader cycle structure continues to lean bullish, supporting the potential for higher highs and a sustained move toward and potentially beyond the $5,000 level.
Square of 9 geometry further supports this outlook, with key harmonic resistance emerging around the $4,950–$5,050 zone, followed by a larger expansion node near $5,392 (Sell 1). A decisive break and sustained trade above $5,050 would signal a shift into a higher-momentum geometric phase, increasing the likelihood of continuation toward upper projected levels. These price zones are interpreted as natural vibration points where both time and price align, reinforcing the probability of trend persistence.
Overall market conditions remain bullish while price holds above $4,761. The preferred strategy continues to favor buying dips rather than selling strength, as long as this structural support remains intact. A breakdown back below the mean would weaken momentum and return the market to a neutral posture.
Gold prices declined in Asian trading on Thursday, ending a four-session rally as markets responded to renewed escalation signals from U.S. President Donald Trump regarding the Iran conflict.
Spot gold was last down 1.4% at $4,693.12 per ounce as of 22:21 ET (02:21 GMT), after briefly reaching an intraday high of $4,800.58. U.S. gold futures also fell nearly 2% to $4,721.80 per ounce.
Market sentiment shifted after Trump stated in a televised address that the U.S. would intensify military action against Iran over the next “two to three weeks,” reaffirming Washington’s position on blocking Iran from acquiring nuclear weapons. He added, “We’re going to hit them extremely hard over the next two to three weeks. We’re going to bring them back to the Stone Ages where they belong.”
The comments contrasted with earlier remarks this week suggesting the U.S. could withdraw from the conflict within a similar timeframe, even without a formal agreement.
Financial markets have remained highly reactive to changing rhetoric on the conflict as investors reassess geopolitical risk. Oil prices rebounded following Trump’s remarks, raising concerns about inflationary pressures that could keep interest rates higher for longer and reduce demand for non-yielding assets like gold.
The U.S. dollar also strengthened after two consecutive losing sessions, further weighing on gold by making it more expensive for foreign buyers.
Investors are now focused on upcoming U.S. jobs data due Friday for signals on the Federal Reserve’s policy direction, a key driver for precious metals.
Elsewhere in metals, silver dropped 3.2% to $72.77 per ounce, while platinum slipped 1.7% to $1,934.60 per ounce.
Oil jumped over 4% on escalation fears.
Oil prices surged by more than $4 on Thursday after U.S. President Donald Trump said the United States would continue military strikes against Iran, including energy and oil infrastructure, over the coming weeks, while offering no clear timeline for ending the conflict.
Brent crude futures jumped $4.88, or 4.8%, to $106.04 per barrel at 0200 GMT, while U.S. West Texas Intermediate (WTI) crude rose $4.17, or 4.2%, to $104.29 per barrel.
The rally followed earlier weakness, as both benchmarks had dropped by more than $1 earlier in the session ahead of Trump’s address and closed lower in the prior trading day.
In his televised national speech, Trump said U.S. forces had nearly achieved their objectives in the conflict with Iran and that the war was approaching its conclusion, though he did not specify a timeframe. “We are going to finish the job, and we’re going to finish it very fast. We’re getting very close,” he said.
Geopolitical risks in the region have escalated, with threats to maritime shipping increasing. On Wednesday, an oil tanker chartered by QatarEnergy was struck by an Iranian cruise missile in Qatari waters, according to the country’s defence ministry.
Meanwhile, the head of the International Energy Agency warned that supply disruptions are beginning to affect Europe’s economy, with the region having previously relied on pre-war contracted oil shipments.
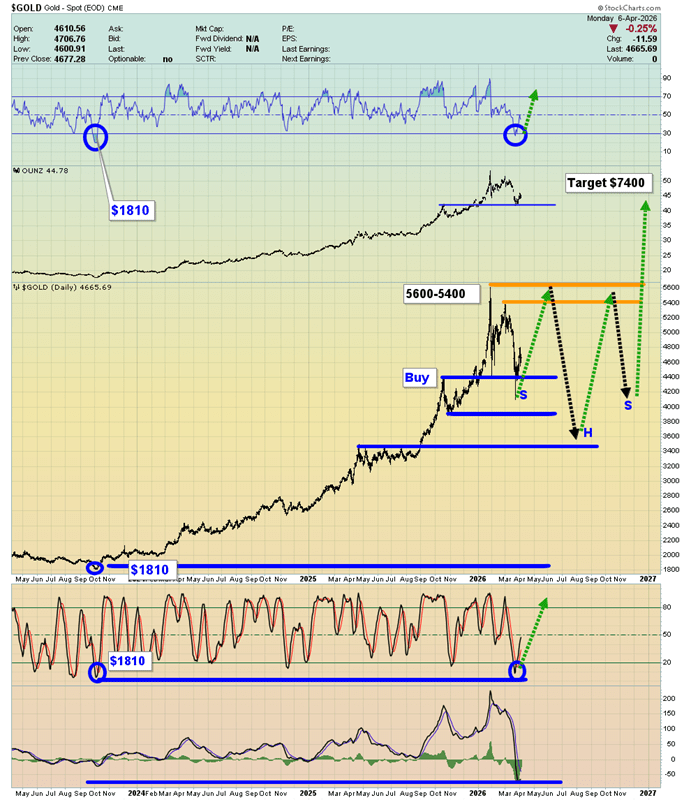
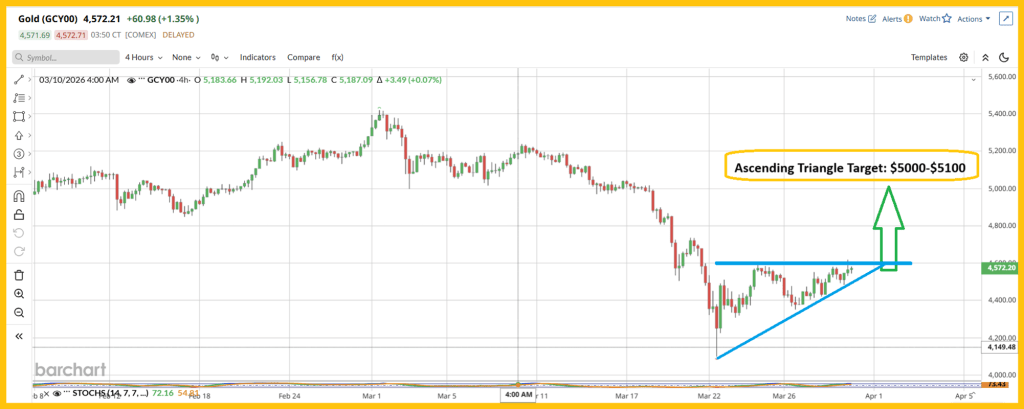
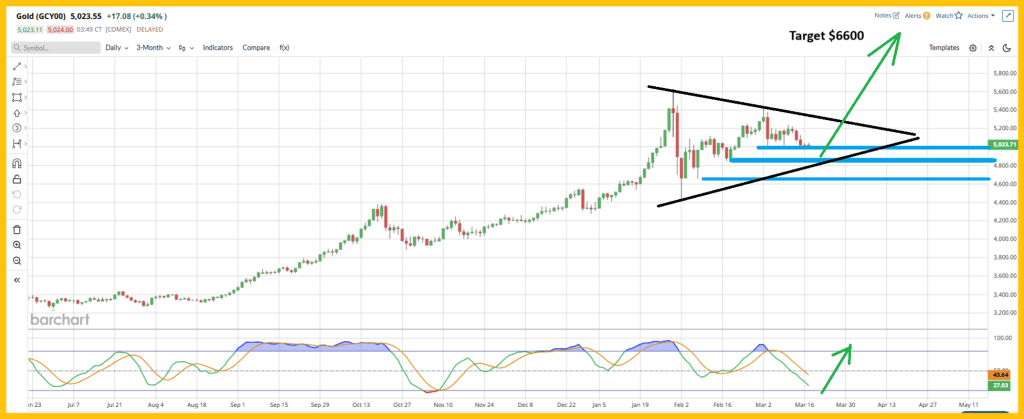
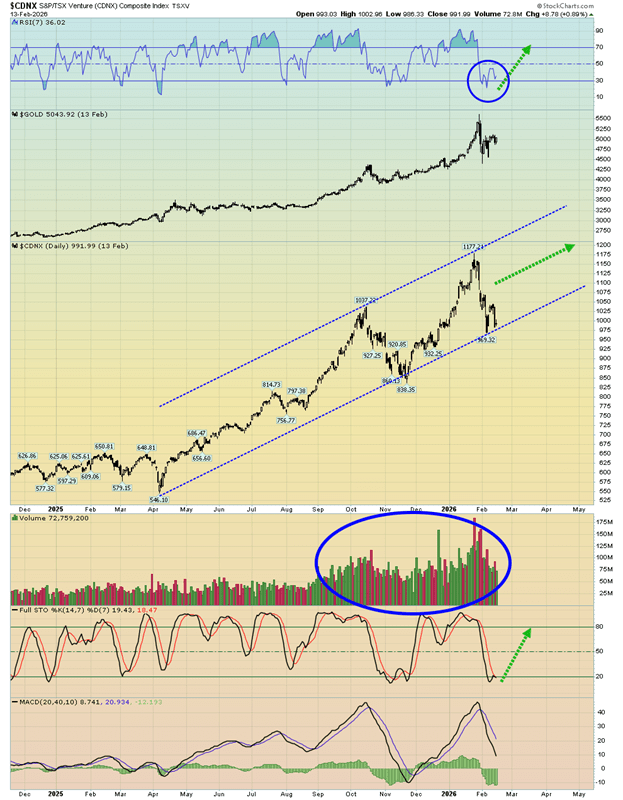
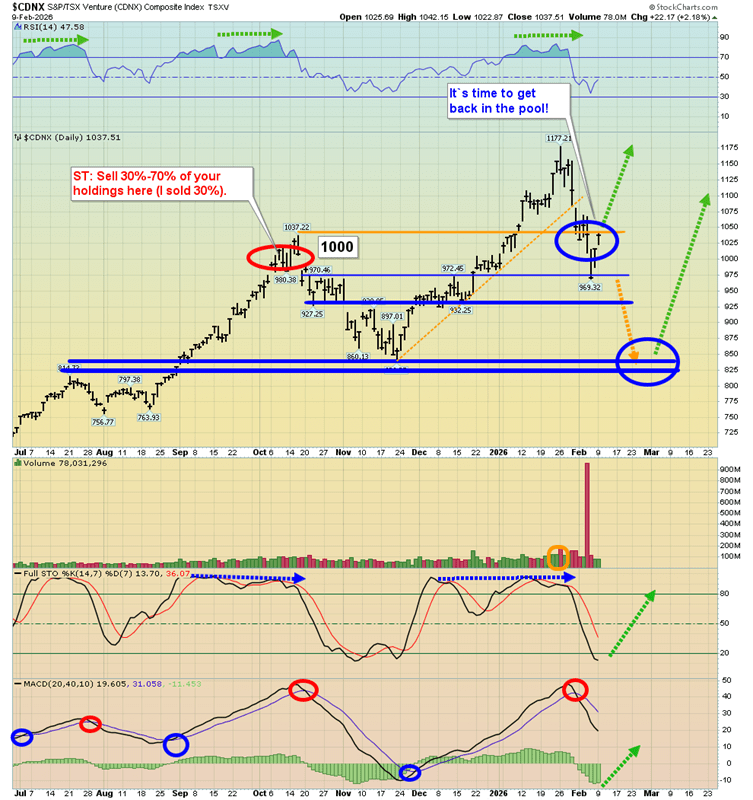
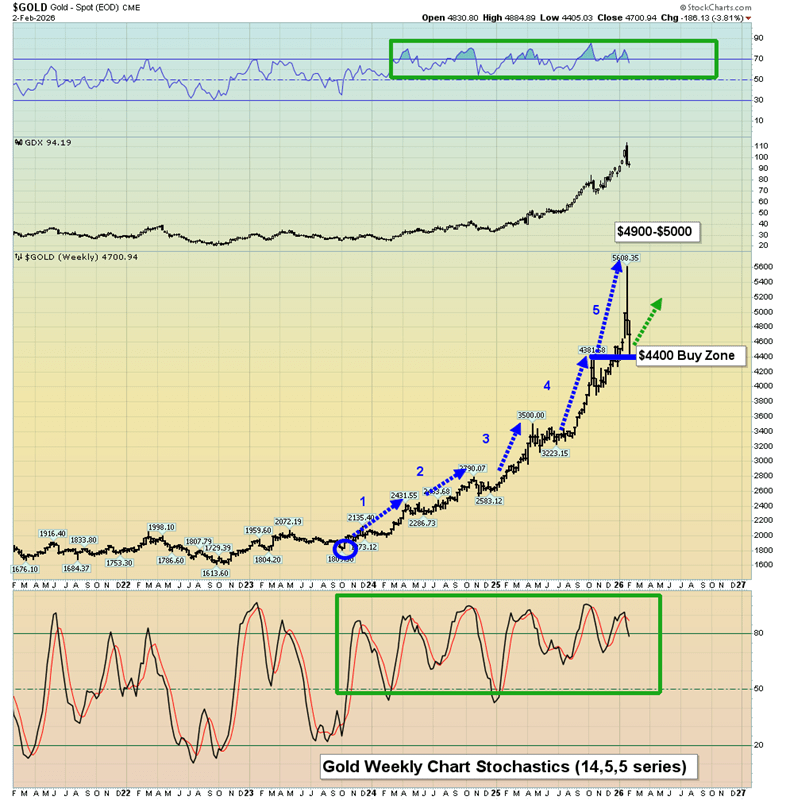
On the charts, both gold and the U.S. equity market are positioning for a meaningful upside move, with technical structures suggesting continued strength ahead.
A look at the short-term gold chart shows a clean ascending triangle formation, with price coiling beneath resistance and building pressure for a breakout. The measured move from this setup points toward the $5,000–$5,100 range.
That implies a strong continuation for those who accumulated during the dip into the $4,100 zone. Even more notable is that, despite the roughly $400/oz rally off the lows, gold still appears to be trading within a broader buy zone rather than an overextended blow-off phase.
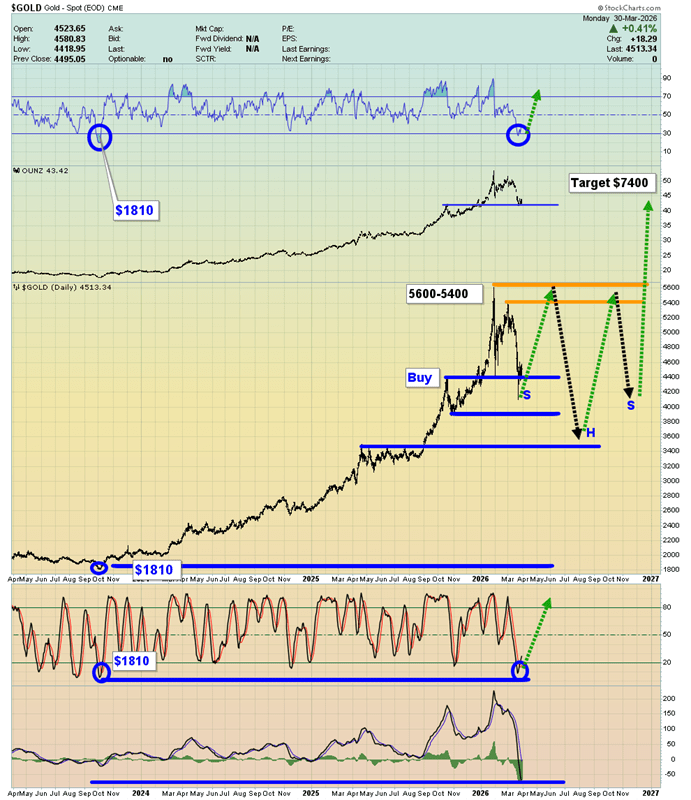
On the daily timeframe, gold may be forming a large continuation structure, with a projected move that could extend beyond the $7,000 level.
At the same time, momentum indicators are deeply stretched to the downside. The MACD (20,40,10) is at one of its most oversold readings in years, and both the Stochastic (14,7,7) and RSI are showing similarly extreme conditions. This kind of setup often precedes a strong upside continuation once momentum resets.
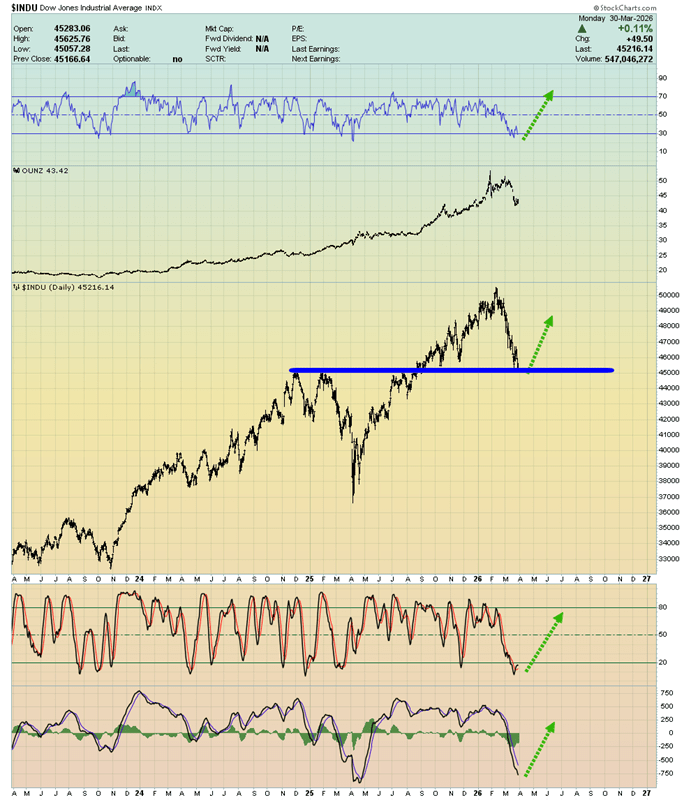
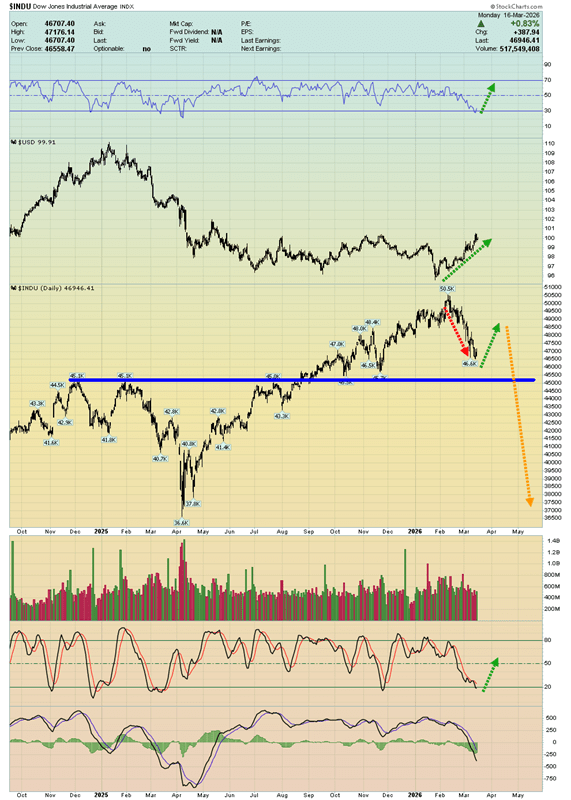
The U.S. stock market “buy zone” setup reinforces the bullish case. When the Dow Jones Industrial Average and gold simultaneously test strong support levels, it often creates some of the most favorable entry points across gold, silver, and mining equities.
Right now, the Dow is sitting near the 45,000 level—a technically significant support zone—while key momentum indicators like RSI, MACD, and Stochastics are deeply oversold. That mirrors the condition in gold, where downside momentum appears exhausted.
In simple technical terms, this is a coordinated setup: gold is the asset with explosive upside potential, while the stock market provides the broader risk-on backdrop that helps fuel the move. If both stabilize and turn higher together, it creates the kind of alignment that can drive powerful upside trends across the precious metals complex.
From a fundamental perspective, the messaging backdrop matters as much as the data. When policymakers try to stabilize sentiment, it’s far more effective when the Dow Jones Industrial Average is sitting at a major technical support zone—like the 45,000 area. Strong support gives credibility to optimistic guidance; it’s easier to “talk up” markets that are already positioned to bounce.
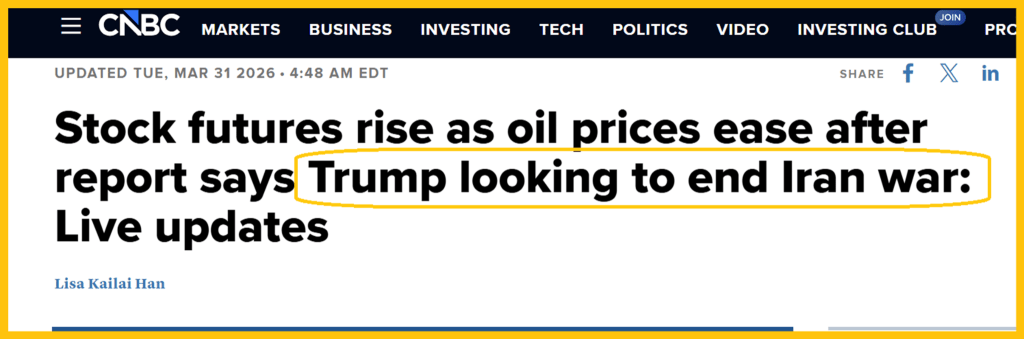
The geopolitical layer adds another dimension. A potential de-escalation or deal involving United States and Iran would be a key variable, particularly through the energy channel. While the timing and likelihood remain uncertain, the market clearly needs some form of resolution to stabilize expectations.
The chokepoint is the Strait of Hormuz—a critical artery for global oil flows. If disruptions persist and the passage isn’t fully normalized, supply constraints could intensify. Right now, the pressure is being felt more acutely across parts of Asia, but energy executives warn that shortages could begin affecting Western economies within weeks if conditions don’t improve.
That feeds directly back into inflation. Sustained energy tightness keeps input costs elevated, which complicates central bank policy just as labor markets are softening. So while the technical setup points higher, the fundamental story hinges on whether energy pressures ease—or continue to reinforce the inflation side of the equation that’s already limiting policy flexibility.
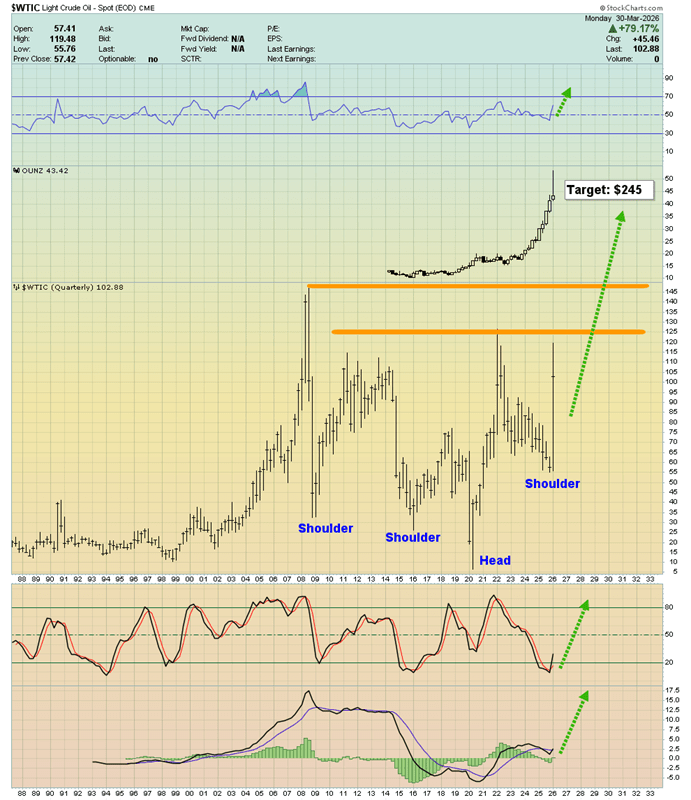
A striking long-term oil chart is emerging, showing a major head-and-shoulders formation, with a potential price target around $245.
Curiously, the U.S. central bank seems to be brushing off the risks of a debt-financed war and rapidly building stagflation.
Meanwhile, surging fuel costs are crushing truckers, pushing some into bankruptcy. Airlines are raising fees, traffic through Hormuz has plunged from around 150 ships a day to just a handful, yet Fed Chair Jay Powell appears largely unfazed.
Equities may still be gearing up for another record run, potentially coinciding with oil pulling back toward the $70–$80 range. But beyond that…
Western investors may soon face a harsh realization: soaring oil prices, stagflation, excessive debt, and war are no longer the clear bearish signals for gold they were once thought to be.
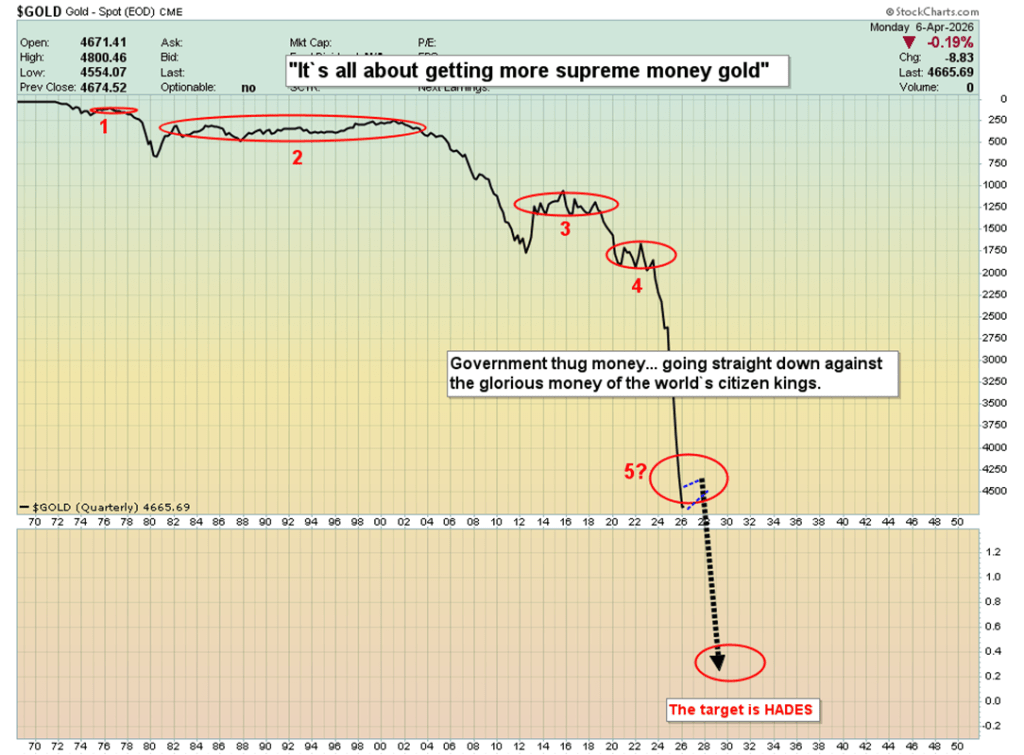
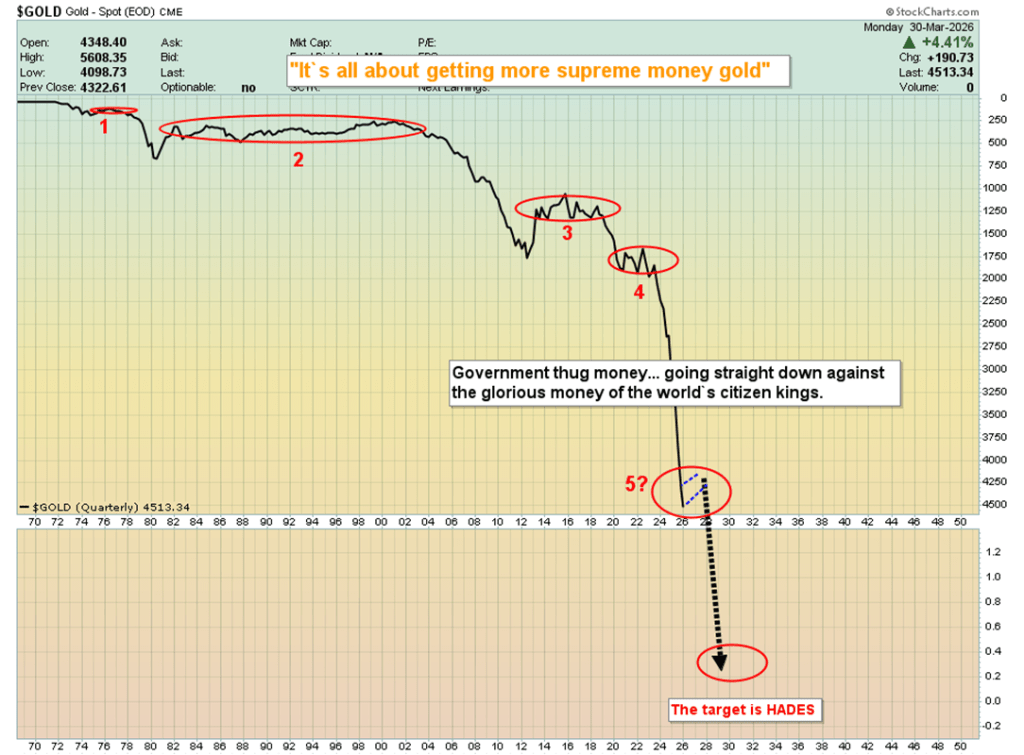
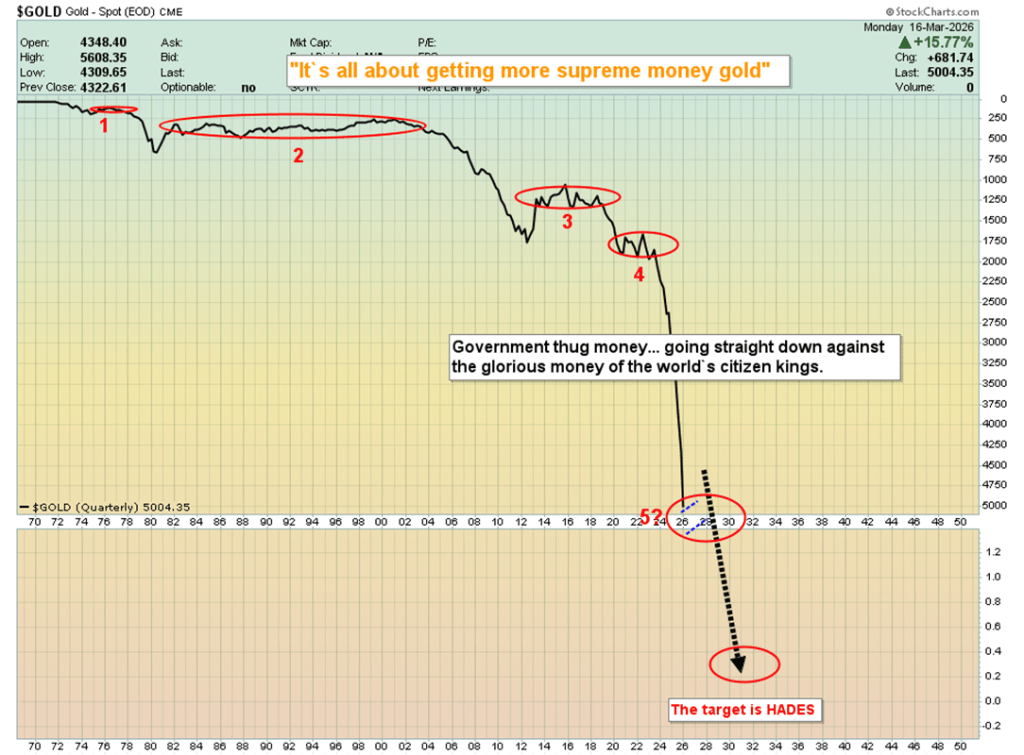
The “March to Hades” chart highlights the long-term decline of U.S. fiat relative to gold.
Mainstream narratives often frame gold as a risky asset—something investors trade occasionally for large fiat gains. But in reality, the currency dynamic is the reverse. Seasoned gold advocates view gold as the superior form of money, meaning fiat should be used as the trading vehicle to accumulate more gold—locking in gains not in dollars, but in ounces.
Miners? The GDX daily chart looks exceptional—arguably a “chart of the year” contender.
At its core, a powerful technical setup is unfolding: the Dow, gold, and GDX are all testing support levels simultaneously, with oscillators flashing buy signals across the board.
The GDX chart itself appears remarkably clean—almost pristine.
For momentum traders, this could be an attractive entry point. Personally, I’d consider small positions in U.S. equities, while taking more meaningful exposure to gold, silver, and mining stocks. For gold-focused investors, it may be time to part with some fiat and lean into the opportunity on the buy side.
Gold extended its rally for a fourth consecutive session in Asian trading on Wednesday, buoyed by a weaker dollar as investors assessed signs that the U.S. and Iran may be moving toward ending the Middle East conflict.
Spot gold rose 0.6% to $4,694.16 an ounce by 21:35 ET (01:35 GMT), while U.S. gold futures gained 1% to $4,724.55. The metal had surged 3.5% in the prior session alongside a retreat in the dollar, though it still posted a decline of more than 11% for March.
Prices found support after U.S. President Donald Trump indicated Washington could withdraw from the conflict within “two to three weeks,” fueling hopes of de-escalation. Still, uncertainty around the timing and terms of any agreement kept market sentiment cautious.
On Iran’s side, state media reported that President Masoud Pezeshkian signaled readiness to end the war, while maintaining key demands, including assurances against future attacks.
A softer dollar further underpinned gold by making it more appealing to overseas buyers, with the U.S. Dollar Index slipping 0.1% in Asian trading after a 0.6% drop in the previous session.
However, gains were limited by reports that Trump may halt the U.S. military campaign even if the Strait of Hormuz remains largely closed, underscoring ongoing risks to global trade.
Gold’s rise this week follows recent volatility, as prices rebound from a sharp March selloff driven by a stronger dollar and changing expectations for U.S. interest rates.
In other precious metals, silver fell 1.1% to $74.35 per ounce, while platinum advanced 1% to $1,972.06 per ounce.
Gold is stabilizing above $4,500, though its recovery remains uncertain following a steep sell-off earlier this month. Despite a modest rebound at the start of the week, momentum is still fragile.
Gains in oil prices, higher Treasury yields, and a stronger U.S. dollar continue to limit gold’s upside potential. In the near term, resistance around $4,700 and support near $4,400 are expected to define its trading range.
Gold began the week on a positive note, rising 0.8% in early Monday trading. However, the recent surge in geopolitical tensions between Israel and Iran triggered a sharp decline, and while prices are rebounding, it may be premature to view this as a full recovery.
Oil Price
Oil prices remain the key driver of market sentiment. Crude has stayed elevated after intensified weekend fighting between Israel and Iran, with the Houthis also entering the conflict. Although Trump claimed progress in negotiations, Iran has continued to reject those assertions.
While U.S. futures and European markets showed some early stability, this could prove short-lived, as seen in prior weeks. Meanwhile, the U.S. dollar continues to strengthen and bond yields remain firm.
Brent crude holding above $110 is reducing expectations for rate cuts and even prompting some to consider possible hikes. Typically, a stronger dollar and rising yields would pressure gold, but increased safe-haven demand is helping to keep it supported for now.
Still, investor confidence has weakened after gold’s previous strong upward trend stalled in recent months. Looking ahead, everything hinges on developments in the Middle East and their impact on energy prices, inflation, and central bank policy.
If tensions ease and oil prices decline in the coming weeks, the U.S. dollar could soften, which would support gold and other risk assets. However, the situation remains highly uncertain. Iran appears reluctant to negotiate, potentially leveraging elevated energy prices. Until there is clear progress toward de-escalation, any short-term market moves should be viewed cautiously.
XAU/USD technical analysis
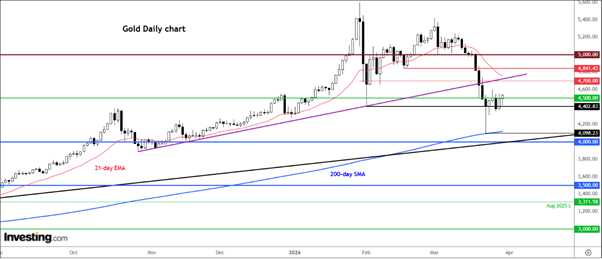
Gold finished last week largely unchanged, rebounding from Monday’s decline after experiencing notable losses in the prior weeks. Importantly, it managed to stay above the $4,400 level — its February low — which provides a modestly positive signal.
That said, stronger confirmation is still needed before traders can conclude that gold has formed a bottom. Multiple resistance levels overhead may limit further gains, particularly as the metal has been in a downtrend since its peak in January.
Key Levels to Watch
A crucial area on the upside is the former short-term bullish trendline, now acting as resistance, along with the $4,700 level. This zone is strengthened by the 21-day exponential moving average near $4,750, making the $4,700–$4,750 range a significant barrier if prices continue to rise.
Beyond that, the next resistance lies between $4,800 and $4,840 — a region that has previously served as both support and resistance. A strong breakout above this band could open the path toward the key psychological level of $5,000.
On the downside, the $4,400–$4,500 zone is a critical support area. A daily close below this range would weaken the short-term outlook and could lead to a decline toward last week’s lows near $4,100, where the 200-day moving average provides additional support.
Further down, longer-term support is seen around $4,000, where a major upward trendline aligns with this important psychological level.
Overall, gold remains in a fragile position and has yet to fully stabilize.
Gold prices edged up slightly as attention remains on the escalating Iran conflict.
Gold edged higher in Asian trading on Monday, recovering modestly after a volatile week, as investors continued to watch the risk of escalation in the U.S.–Israel conflict with Iran.
Spot gold gained 0.4% to $4,509.51 an ounce, with futures rising similarly to $4,537.40. Prices had swung sharply last week, dropping to around $4,000 before rebounding close to $4,500 by Friday.
Other precious metals were mixed, with silver slipping 0.9% while platinum advanced 1.8%.
Analysts at OCBC said the recent rebound in gold appears largely technical, following a steep decline of about 20% since the conflict began. While bearish pressure is easing and momentum indicators are improving, they cautioned that the recovery may struggle to hold unless prices break above key resistance levels at $4,624, $4,670, and $4,850 per ounce.
They also warned that persistently high energy prices could keep inflation elevated, potentially pushing Treasury yields higher and creating a less favorable environment for gold in the near term.
Meanwhile, geopolitical tensions remained high after Iran-backed Houthi forces in Yemen launched attacks on Israel over the weekend, raising fears of a broader conflict. Iran signaled readiness for a possible U.S. ground invasion, amid reports that Washington is deploying additional troops to the Middle East.
U.S. President Donald Trump said negotiations with Iran were progressing and a deal could be near, though he provided no clear timeline and warned that further strikes on Tehran remain possible. He also recently extended a deadline for potential attacks on Iran’s energy infrastructure into early April.
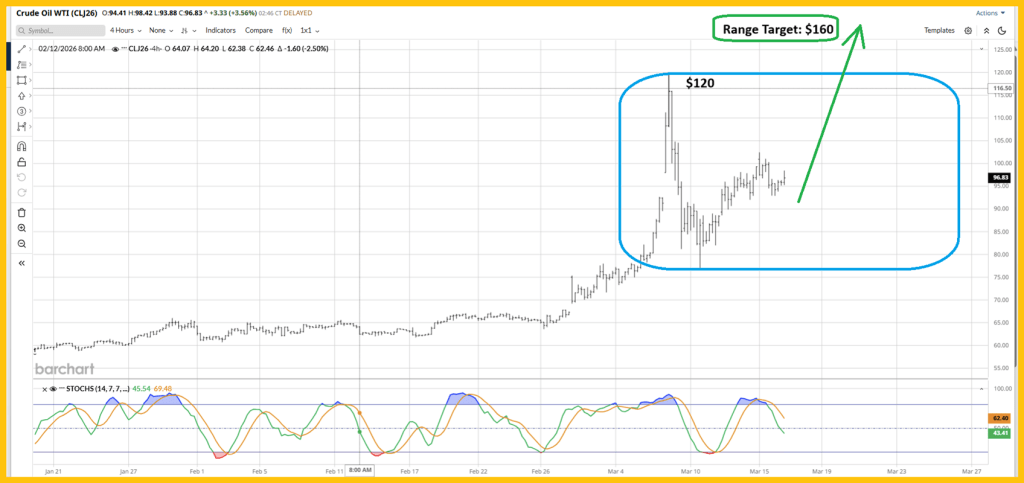
Oil prices jumped above $115 per barrel after Yemen’s Houthi forces launched an attack on Israel.
Oil prices surged in early Monday trading after Yemen’s Houthi group launched attacks on Israel, raising fears of a wider Middle East conflict.
Brent crude jumped 2.2% to $115.08 a barrel, after briefly spiking as high as $116.43.
The Iran-backed Houthis said they had fired multiple missiles at Israel and warned of further strikes, heightening concerns about escalation—especially given their ability to target vessels in the Red Sea.
Tensions remained elevated as Israeli forces struck targets in Tehran, while the U.S. deployed 3,500 troops to the region aboard the USS Tripoli. Iran also signaled readiness for a potential U.S. ground operation.
Oil prices have rallied sharply in March, with Brent up nearly 60%, driven by severe supply disruptions. Iran’s effective blockade of the Strait of Hormuz—a route carrying about 20% of global oil supply—has intensified market fears.
While Pakistan has offered to host talks between Washington and Tehran following a U.S. ceasefire proposal, Iran has largely rejected direct negotiations and accused the U.S. of preparing for a ground invasion.
Oil prices inched up as Iran considers the U.S. plan to end the conflict.
Oil prices in Asia inched up on Thursday as mixed signals over Middle East de-escalation kept markets cautious, while Iran considered a U.S. proposal to end the conflict.
By 20:31 ET (00:31 GMT), May Brent crude rose 0.8% to $103.02 per barrel and WTI crude gained 1% to $91.20, after both benchmarks dropped more than 2% in the previous session.
Traders assessed tentative diplomatic developments from Tehran, where authorities are said to be reviewing a U.S.-supported plan to stop the fighting. Although Iran has yet to accept the proposal, it has not rejected it outright, fueling guarded optimism for easing tensions.
However, uncertainty remains high. Tehran has denied direct talks with Washington and signaled that major disagreements persist, leaving markets uneasy and price moves relatively muted.
Crude has seen sharp swings in recent weeks as the conflict disrupted supply flows from the Gulf, a key global oil hub. Earlier this month, Brent surged past $119 per barrel on concerns over potential supply outages.
The Strait of Hormuz—through which about one-fifth of global oil passes—remains a critical risk point, with any disruption likely to drive prices higher.
On Wednesday, prices fell as reports of possible negotiations eased some geopolitical risk premium. Meanwhile, investors are monitoring Washington’s stance, as officials warn of tougher action if Iran fails to engage, adding further uncertainty to the outlook.
Gold holds steady as markets weigh conflicting signals over potential de-escalation between the U.S. and Iran.
Gold prices were mostly stable in Asian trading on Thursday as investors navigated mixed signals surrounding the Iran conflict, while Tehran continued to assess a U.S. proposal to end the war.
Spot gold edged up 0.1% to $4,509.06 an ounce by 22:57 ET (02:57 GMT), while U.S. gold futures declined 1.1% to $4,536.10.
Bullion had recovered earlier in the week, climbing back above $4,500 after a sharp pullback, supported by a weaker dollar and cautious optimism over potential U.S.-Iran diplomacy.
Still, gains were limited as uncertainty persisted. Iran is reviewing a U.S.-backed plan to halt hostilities, but unclear signals on whether talks will advance have kept investors wary.
Although Tehran has not formally accepted the proposal, it has avoided rejecting it outright, fueling guarded hopes for de-escalation. At the same time, Iran has denied direct negotiations with Washington and emphasized that key differences remain unresolved, leaving markets uneasy.
The U.S. has also warned of tougher action if Iran fails to engage constructively, adding another layer of tension.
Gold—traditionally a safe-haven asset—has shown unusual volatility in recent weeks. Prices dropped sharply earlier this month despite rising geopolitical risks, as expectations of prolonged high interest rates and a stronger dollar weighed on demand.
Movements in oil prices have also influenced sentiment. Rising crude has heightened inflation concerns, reinforcing expectations that central banks may keep rates elevated, which tends to pressure non-yielding assets like gold.
Wider financial markets reflected a cautious tone, with investors seeking clearer direction on both geopolitical developments and global monetary policy.
Among other precious metals, silver gained 0.1% to $71.32 an ounce, while platinum slipped 0.6% to $1,918.60.
Gold is trying to stabilize, bolstered by a softer U.S. dollar and easing oil prices, as geopolitical tensions show signs of temporary relief. The recovery has pushed bullion toward the mid-$4,500s, suggesting the market is regaining balance after a recent sharp repricing.
The gold-to-silver ratio is drifting back toward the mid-60s, after dipping closer to 60 earlier in the week. This indicates relative strength in gold, while silver remains more sensitive to cyclical trends. Flows remain defensive, rather than shifting toward higher-beta exposure.
The context is key. Gold is emerging from a period where geopolitical stress failed to generate sustained demand. The prior repricing was driven by inflation expectations and policy positioning: energy-driven inflation reinforced bets on tighter monetary policy, strengthened the dollar, and increased the cost of holding non-yielding assets. This environment diverted capital away from bullion precisely when it would normally attract flows.
That dynamic still shapes the market. Gold is trading in a system where inflation, interest rates, and liquidity guide flows. As long as macro stress influences policy expectations, the market remains biased away from passive safe-haven accumulation.
From Macro Shock to Policy Transmission
Recent price action illustrates how macro shocks propagate. Geopolitical tensions and energy disruptions fed directly into inflation expectations, reinforcing the view that central banks might maintain restrictive conditions longer. This tightened financial conditions through both rates and a stronger dollar.
The current stabilization reflects a partial release of that pressure. A softer dollar and lower oil have eased the immediate inflation impulse, letting gold recover. The adjustment is mechanical—driven by easing inputs—without changing the broader framework guiding capital allocation.
Markets in this phase continuously reprice the balance between inflation risk and policy response. Gold follows this process rather than leading it. Until the transmission mechanism shifts away from inflation-driven tightening, rallies develop in a constrained environment, with selective liquidity and limited momentum.
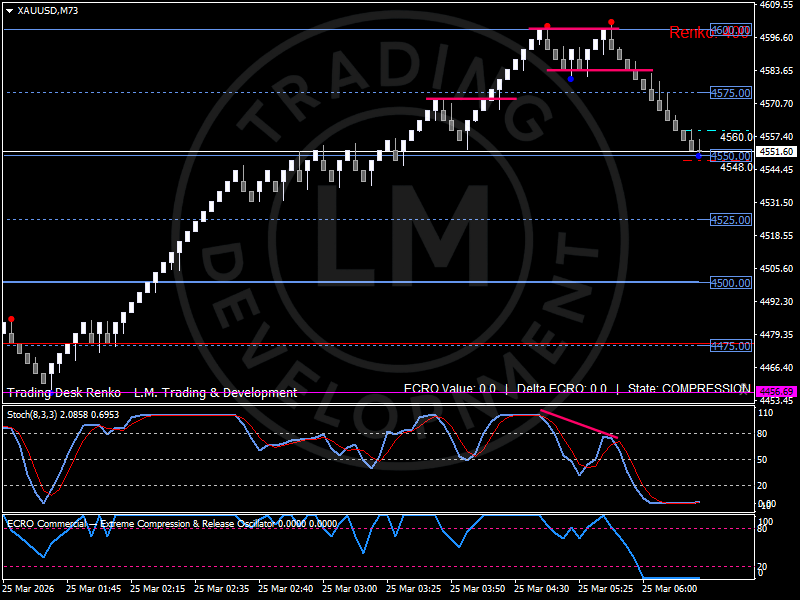
The Renko Structure: Damage First, Stabilization Second
The Renko structure highlights the sequence clearly. Gold’s advance into the upper $4,500s reached an exhaustion zone just below $4,600, where upward momentum faded and supply returned. The subsequent pullback pierced the upper structure, removing the previous layer of support.
Gold is currently pivoting near $4,560, which now acts as a reference point within a rebalanced range rather than a springboard. Just below, $4,550–$4,551 offers the first structural support; a break here would reopen the path toward $4,525, where the structure becomes fragile and reactive.
Upside resistance begins at $4,575, the zone where the prior rebound failed, making it a test of market acceptance. Above that, the low $4,580s congestion band is the next checkpoint before the broader ceiling below $4,600, where sellers previously regained control.
The structure reflects a market stabilizing after lost momentum. Stabilization has formed, but directional strength has yet to reemerge.
Internal Conditions Show Compression
ECRO is at zero, signaling full compression: prior downside momentum is exhausted, and the current recovery has not generated a new expansion phase. Price is consolidating within defined boundaries as liquidity seeks alignment. Momentum indicators confirm the market has moved from active movement into controlled stabilization, limiting extensions beyond key levels without confirmation from broader flows.
What Needs to Change for a Stronger Move
A sustained rally requires continuity: maintaining the pivot near $4,560, reclaiming the upper barrier, and transforming it into acceptance. This would rebuild structure above prior rejection zones, signaling buyer commitment. Without this, rallies remain constrained, leaving the market exposed to renewed resistance at each layer.
Gold’s challenge lies in the environment rather than the metal itself. Inflation, interest rates, and liquidity continue to govern how demand translates into flows. Until that balance shifts, directional moves will struggle to sustain.
Final Read
Gold has exited active selling pressure and entered a stabilization phase. Both price structure and internal indicators reflect recalibration. Control has not yet returned. Compression dominates, keeping price within a range while direction remains unresolved. The next move will depend on flows re-establishing continuity above previously rejected levels.
Stabilization is present; leadership is still absent.
Gold rises on softer dollar, lower oil after U.S. proposal.
Gold surged more than 2% during Asian trading on Wednesday, driven by falling oil prices and a softer U.S. dollar. Hopes of a potential Middle East ceasefire eased inflation concerns, increasing the appeal of the metal.
Spot gold rose 2.3% to $4,577.55 per ounce, while U.S. gold futures climbed 4% to $4,611.70.
The move came as reports emerged that the United States had proposed a 15-point plan to Iran aimed at ending the conflict. President Donald Trump said negotiations were ongoing and noted that Iran appeared willing to reach a deal. However, Iranian officials denied any talks, underscoring continued uncertainty.
Oil prices dropped sharply after earlier gains fueled by supply disruption fears, with Brent crude slipping below $100 per barrel. This decline helped ease inflation expectations, reducing pressure on central banks to maintain high interest rates.
Lower energy prices also weighed on bond yields and the dollar—factors that typically support gold, which does not yield interest. The U.S. Dollar Index slipped 0.2% in early trading.
Gold had recently been under pressure due to rising oil prices and bond yields, which strengthened the dollar and triggered a broader selloff in precious metals.
Despite the rebound, analysts warned that volatility is likely to continue, as markets remain highly sensitive to developments in the Middle East.
Elsewhere, silver jumped 3.3% to $73.60 per ounce, and platinum rose 2.2% to $1,977.60.
Oil drops on Middle East ceasefire hopes.
Oil prices dropped about 4% on Wednesday as hopes of a potential ceasefire in the Middle East raised expectations that supply disruptions from the region could ease. The decline followed reports that the U.S. had delivered a 15-point proposal to Iran aimed at ending the conflict.
Brent crude fell $4.89 (4.7%) to $99.60 per barrel, after hitting a low of $97.57. U.S. West Texas Intermediate (WTI) slipped $3.54 (3.8%) to $88.81, touching as low as $86.72. This came after both benchmarks had surged nearly 5% in the previous session before trimming gains amid volatile trading.
Analysts said growing optimism over a ceasefire, along with profit-taking, pressured prices. However, uncertainty over whether negotiations will succeed continues to limit further declines.
U.S. President Donald Trump stated that progress was being made in talks with Iran, while sources confirmed Washington had sent a detailed settlement plan. Reports also suggested the U.S. is pushing for a temporary ceasefire to facilitate discussions, including measures such as curbing Iran’s nuclear program and reopening the Strait of Hormuz.
Despite this, some analysts remain cautious, warning that Middle East developments will continue to drive price swings in the near term.
The conflict has severely disrupted oil and LNG shipments through the Strait of Hormuz—responsible for roughly one-fifth of global supply—creating what the International Energy Agency has described as an unprecedented supply shock.
Even if a ceasefire is reached and flows resume, experts say it is unclear how quickly production will fully recover, especially without confidence in a lasting agreement.
Meanwhile, diplomatic efforts continue, with Pakistan offering to host negotiations, and Iran indicating that non-hostile vessels may pass through the Strait if coordinated with its authorities. Still, military activity in the region persists, and the U.S. is reportedly preparing to deploy additional troops.
To offset disruptions, Saudi Arabia has ramped up exports via its Red Sea Yanbu port to nearly 4 million barrels per day.
In the U.S., inventory data added further pressure to prices, with crude stocks rising by 2.35 million barrels, gasoline up 528,000 barrels, and distillates increasing by 1.39 million barrels last week, according to industry estimates.
Gold prices continued to decline for a tenth consecutive session during Asian trading on Tuesday, as Iran denied engaging in talks with the U.S. following Donald Trump’s decision to delay further strikes on Iranian energy facilities.
Spot gold dropped 1.3% to $4,351.28 per ounce, while U.S. gold futures fell 0.3% to $4,399.59. The postponement of military action by Washington helped ease broader market tensions and led to a sharp decline in oil prices, allowing gold to recover slightly in the previous session.
Trump had earlier delayed plans to target Iran’s power grid, citing “productive” discussions, but Mohammad Baqer Qalibaf dismissed these claims, stating that no such talks had occurred—adding uncertainty to the situation.
Despite typically being seen as a safe-haven asset, gold has struggled amid shifting macroeconomic expectations. Rising energy costs have fueled concerns about persistent inflation, prompting investors to scale back expectations of interest rate cuts.
As a result, central banks—including the Federal Reserve—are now expected to maintain higher interest rates for longer, which tends to pressure gold prices since it does not generate interest.
Other precious metals also declined, with silver falling 1.5% and platinum slipping 0.3%.
Gold remains firmly under bearish pressure for another week, kicking off Monday with the yellow metal once again eyeing a test of the $4,300 level. The decline is driven by ongoing Middle East tensions, higher US Treasury yields, and a stronger US dollar.
Fundamental Analysis
Gold has fallen around 3% in Monday’s Asian session, building on last week’s decline of over 10% as key support levels continue to give way.
Gold: Escalating Gulf conflict lifts USD
Selling pressure on Gold remains relentless, with the metal weighed down by renewed strength in the US dollar and rising US Treasury yields as tensions in the Middle East enter a more intense phase.
Gold is facing a dual headwind, losing its appeal as a safe-haven asset while the US dollar strengthens in its role as the world’s primary reserve currency, making dollar-denominated bullion less attractive for foreign investors.
At the same time, the latest escalation in the conflict has reignited fears of energy supply disruptions and rising inflation, increasing expectations of global interest rate hikes. This has pushed US Treasury yields higher, further pressuring non-yielding assets like Gold.
International Energy Agency (IEA) chief Fatih Birol warned that global oil supply losses could reach 11 million barrels per day—surpassing the shocks of 1973 and 1979 combined.
Markets were further unsettled as tensions between the United States and Iran intensified, with threats exchanged over the Strait of Hormuz and potential strikes on civilian and energy infrastructure, while Israel signaled plans for extended military operations.
Israel’s military confirmed it has launched a large-scale wave of strikes targeting infrastructure in Tehran. Meanwhile, reports suggest the US is considering a ground operation aimed at seizing Iran’s Kharg Island.
If the confrontation between the US and Iran escalates further, broader market sell-offs could accelerate, potentially forcing investors to liquidate Gold positions to cover losses in other assets.
That said, Gold may see a temporary bounce if a technical rebound emerges, as the daily Relative Strength Index (RSI) remains deeply oversold, below the 30 threshold.
Technical Analysis
The near-term outlook has shifted bearish as price breaks decisively below both the 21-day and 50-day Simple Moving Averages (SMAs), signaling a disruption of the prior uptrend structure. The 21-day SMA has turned lower and now acts as immediate resistance near $5,035, while the 50-day SMA, flattening around $4,970, further reinforces downside pressure.
Despite this pullback, the asset continues to trade well above the upward-sloping 100-day and 200-day SMAs, located near $4,610 and $4,095 respectively, suggesting the current move remains a sharp correction within a broader bullish trend. Meanwhile, the Relative Strength Index (RSI) has dropped to 26, entering oversold territory and indicating stretched bearish momentum.
In the short term, resistance is seen at the former breakdown zone around $4,650, followed by stronger resistance at the 21-day SMA near $5,035. A daily close above this level would be required to signal a potential stabilization and could open the door for a move toward the 50-day SMA near $4,970, helping to ease immediate downside risks.
On the downside, immediate support lies around $4,360. A break below this level would expose the psychological $4,300 area, where the rising 100-day SMA may attract dip-buying interest. Failure to hold this zone would shift focus toward the 200-day SMA near $4,095, which remains a critical support level for maintaining the longer-term bullish structure.
For years, financial elites have brushed off gold as an unproductive asset—an inert yellow metal that generates no income and seems out of place in a fast-moving, digital economy. But by 2026, that long-standing view is beginning to lose credibility.
As the image of the “almighty U.S. dollar” starts to crack under the weight of a federal deficit exceeding $38 trillion—and still rising uncontrollably—gold is no longer just a hedge. It is increasingly seen as a primary escape route from a global era of fiscal excess.
The strongest argument for gold today doesn’t lie in consumer demand like jewelry, but in central bank behavior. Since the freezing of Russian reserves in 2022 following its invasion of Ukraine, a clear message has emerged. Many countries, especially in the Global South and BRICS+, are growing wary of holding U.S. Treasury assets that can be restricted or liquidated instantly.
This shift goes beyond simple de-dollarization—it signals a deep, structural reallocation of global capital. When central banks accumulate gold at record levels, they are not chasing short-term gains; they are securing financial independence. Gold stands apart as the only major asset that is not someone else’s liability.
Meanwhile, sovereign debt dynamics have moved from troubling to almost absurd. With debt-to-GDP ratios at extreme levels, major economies are stuck in a dilemma: raising interest rates enough to curb inflation risks making their debt burdens unmanageable.
As a result, real interest rates are likely to remain low or even negative—conditions that have historically favored gold. When inflation erodes the returns of supposedly “safe” government bonds, gold’s lack of yield becomes far less of a disadvantage and even appealing.
There’s a certain irony in this moment. As technology enables the creation of endless digital assets and AI-generated content, tangible assets like gold are gaining renewed appeal among both institutional and individual investors. Governments can expand debt or issue digital currencies at will, and AI can produce limitless synthetic content—but gold remains constrained by physical reality.
It cannot be created out of thin air. Annual mine production increases global supply by only about 1.5% to 2%, and the total amount of gold ever mined—around 212,000 tons—would fill just a few Olympic-sized swimming pools.
In a world marked by uncertainty, where even truth feels scarce, investors are gravitating toward something real—an asset that requires human effort, heavy machinery, and time to produce, and one that has consistently preserved value throughout history.
The bullish case for gold is not based solely on doomsday fears. It reflects a deeper issue: the erosion of sound financial systems, manageable debt levels, and trust in institutions. As that trust weakens, gold tends to rise.
At roughly $5,060 per ounce, gold’s recent performance—illustrated through instruments like SPDR Gold Shares (GLD)—shows a powerful surge, supported by strong volume and capital inflows. This movement suggests more than simple hedging; it indicates a strategic shift toward safeguarding wealth against potential systemic shocks.
Interestingly, while technical analysts might interpret the chart as signaling a sell, such a view overlooks a key imbalance: even the largest corporations, despite their substantial cash reserves, are dwarfed by the scale of global sovereign debt.
The scale of the debt-versus-gold imbalance is striking. Companies in the S&P 500 collectively hold an estimated $2.5 to $3 trillion in cash and equivalents, according to J.P. Morgan. While that figure appears substantial, it represents just about 5% of the total debt owed by the G7 economies.
The G7—comprising the United States, Canada, the United Kingdom, France, Germany, Italy, and Japan, along with the broader European Union—sits at the center of the global financial system. The U.S. alone, with an economy valued at roughly $30–32 trillion, accounts for about 26% of global GDP, which the IMF estimates at $123.6 trillion in 2026.
Yet the U.S. national debt has climbed to $38.87 trillion as of March 2026 and continues to grow at a pace of around $7 billion per day. At this trajectory, it is expected to surpass $40 trillion within the year.
This has pushed the U.S. debt-to-GDP ratio to approximately 123%, meaning federal debt exceeds the size of the entire economy by 23%. Such levels are near post–World War II highs and far above historical norms—an indication of growing fiscal strain. Despite this, there appears to be little political momentum to curb spending, with policymakers instead signaling further expansion.
Looking beyond the U.S., the broader picture is equally concerning. Combined sovereign debt across G7 nations now stands at roughly $65 trillion, with no coordinated effort to rein in deficits or reduce spending.
If this trajectory continues, the long-term consequences for fiat currencies could be severe. A system increasingly burdened by unsustainable debt risks eventual disruption, potentially leading to a profound global financial reset. In such a scenario, gold could continue its upward trajectory, with projections pointing toward $6,000 per ounce as a plausible next milestone.
War, oil shocks, and market turbulence would typically create ideal conditions for gold to rally—yet prices have declined sharply. The explanation isn’t about a lack of fear, but rather the underlying mechanics of global reserve flows.
For years, the narrative was straightforward: gold and silver climbed as investors sought protection from loose monetary policy, fiscal imbalances, and a weakening dollar. Central banks—from Beijing to Riyadh—were steadily shifting away from U.S. Treasuries and into bullion, reinforcing a strong long-term bullish case for precious metals.
Then, within just three weeks, the trend reversed sharply. Gold dropped 14%, while silver plunged an even steeper 28%. On the surface, the timing seems counterintuitive. Global conflict is intensifying, oil markets are under stress, and volatility is rising. Although the dollar has strengthened after hitting multi-year lows, these conditions would typically support precious metals. Yet instead of rallying, they are falling sharply.
The explanation, once understood, is both surprising and illuminating: gold is no longer trading as a traditional “safe-haven” asset. Instead, it is responding to global reserve flows—and at the moment, those flows are moving in reverse.
A Decade of Currency Dilution
To understand gold’s long-term rise, it’s essential to recognize the two key drivers behind its bull case. The first is monetary debasement. Since the 2008 financial crisis—intensifying during the pandemic—central banks across developed economies have expanded their balance sheets on an unprecedented scale. Money supply has outpaced economic output, real interest rates have turned negative, and inflation has ultimately followed.
In such an environment, hard assets—especially gold and silver—offered something increasingly rare: a store of value that cannot be created at will. Both institutional and retail investors funneled capital into precious metals as protection against the gradual erosion of purchasing power. The logic was straightforward: if fiat currencies are being diluted, hold assets that cannot be.
“Gold evolved from a traditional safe haven into a preferred reserve asset—a structural shift that changed both the profile of buyers and their motivations.”
The second pillar supporting gold’s rise was de-dollarization. The 2022 move by Washington and Brussels to freeze Russia’s foreign reserves sent a clear signal to surplus nations worldwide: dollar-based assets, including Treasuries, carry political risk. Gold, by contrast, does not.
The reaction was both rapid and unprecedented. Central banks—particularly across the Global South and the Gulf—accelerated gold purchases to levels not seen in decades. Countries such as Saudi Arabia, the UAE, Kuwait, and China emerged as major buyers. This was not speculative demand, but a strategic shift in sovereign asset allocation—reducing reliance on the dollar and increasing exposure to an asset with no counterparty risk.
The Hormuz Shock
The conflict with Iran—particularly the blockade of the Strait of Hormuz—has rapidly disrupted this dynamic. As a critical artery of the global oil market, roughly 20% of the world’s petroleum flows through the strait each day. When that passage is constrained, the impact goes beyond higher oil prices—it directly squeezes the revenue streams of the very countries that had been the most consistent marginal buyers of gold.
Saudi Arabia, the UAE, and Kuwait manage their sovereign wealth and reserves largely through petrodollar surpluses. When oil revenues fall sharply—as they do when a critical shipping route is disrupted—those surpluses shrink or vanish. The consequence is clear: the marginal buyer of gold steps back, or in some cases becomes a forced seller, liquidating assets to meet domestic fiscal needs.
China introduces an additional layer of pressure. As the world’s largest oil importer, it is now facing a meaningful terms-of-trade shock. Slower economic growth translates into reduced trade surpluses, which in turn limits reserve accumulation. With fewer reserves being built, demand weakens for gold—the preferred alternative reserve asset.
Why Silver Is Falling More Sharply
Silver’s decline has been nearly twice as severe as gold’s, reflecting its dual role. Unlike gold, which is primarily a monetary asset, silver is heavily tied to industrial demand—electronics, solar panels, electric vehicles, and semiconductors account for roughly half of its usage.
When global growth expectations deteriorate quickly, industrial demand contracts just as rapidly. As a result, silver is hit on two fronts: declining reserve demand and weakening industrial consumption. The same slowdown that compresses Gulf surpluses also dampens manufacturing activity, amplifying the downside.
The Paradox of Geopolitical Precious Metals
The common belief that gold thrives during geopolitical turmoil is not incorrect—but it is incomplete. Gold performs best in crises where capital seeks safety and liquidity flows toward hard assets. The current Iran-related shock, however, is different: it disrupts the underlying flow of global capital that has been supporting gold’s long-term rally.
This is the core paradox. Gold is not responding to headlines—it is reacting to balance sheets, particularly the weakening financial positions of sovereign buyers that have driven demand in recent years. Fear is abundant, but in this case, it is not the primary driver of price action.
“In the short term, gold follows liquidity and reserve flows—not headlines or fear. The long-term bull case remains intact, but the marginal buyer has stepped away.”
Momentum, Retail, and the Unwind
Prior to the conflict, precious metals had increasingly taken on the characteristics of momentum trades. Although the underlying drivers—monetary debasement, de-dollarization, and central bank demand—remained intact, they also drew in a more speculative wave of capital. Retail investors, propelled by sustained price gains, social media influence, ETF inflows, and commission-free trading, rapidly piled into gold and silver.
Gold ETFs experienced some of their strongest inflows in the months leading up to the conflict, while silver—more affordable and volatile—became a favorite among momentum-driven traders seeking outsized returns.
This backdrop helps explain the severity of the current selloff. When prices are supported not only by fundamentals but also by a momentum premium, reversals tend to be abrupt. As that premium unwinds, selling pressure intensifies. Notably, the Gold Trust ETF has just posted its largest monthly outflow since April 2013, highlighting how quickly market sentiment can reverse.
The same investors who drove prices higher often operate with tight stop-losses, leverage, and short investment horizons. As the trend reversed, this momentum-driven crowd unwound positions just as quickly as it had built them, magnifying the decline far beyond what fundamentals alone would justify. The Hormuz shock may have sparked the selloff, but the real accelerant was the excess speculation that had built up during the rally.
Outlook: The Structural Case Remains—For Now
Nothing in the current environment fundamentally undermines the long-term case for gold. Monetary debasement persists, and de-dollarization remains a gradual, multi-decade shift rather than a short-term trade. Central banks are unlikely to abandon gold accumulation strategies due to temporary revenue pressures. As conditions stabilize—oil flows normalize, China regains momentum, and GCC surpluses recover—the structural demand for gold is likely to return.
However, markets do not operate on long-term narratives in the near term. They respond to immediate flows—who is buying and who is selling right now. At present, the key marginal buyers are facing financial constraints. More than any geopolitical storyline, this explains gold’s decline in an environment that would typically support higher prices.
For investors, the takeaway is both humbling and instructive: understanding an asset’s long-term drivers does not guarantee insight into its short-term movements. Gold may remain a form of sound money, but like all assets, it is still influenced by shifts in global liquidity—and at the moment, that liquidity is receding.
Gold prices continue to drift lower after breaking the 50-day moving average. Traditionally a safe haven in times of uncertainty, the “fog of war” now keeps gold in focus. I plan to maintain my sizable gold position, supported by strong projected sales and earnings from my gold stocks. Other commodities are also soft, reflecting fears of slower global growth.
Geopolitical tensions remain high. On Wednesday, President Trump warned that if Iran continues targeting Gulf energy infrastructure, the U.S. would strike the South Pars Gas Field with unprecedented force. Until hostilities subside and shipping resumes through the Strait of Hormuz, energy-driven inflation is likely to persist.
The March Producer Price Index (PPI) report added to concerns. Wholesale food and energy prices are expected to rise sharply due to the Iran conflict and the Strait of Hormuz closure. In February, the PPI rose 0.7% month-on-month and 3.4% year-on-year, with wholesale food up 2.4% and energy 2.3%. Prices for final demand goods rose 1.1%, and wholesale service costs increased 0.5%.
The FOMC highlighted labor market weakness, noting that job gains remain low. Fed Chairman Jerome Powell emphasized that the private sector is not creating sufficient jobs. The “dot plot” signals one expected interest rate cut, though some FOMC members anticipate more. The statement avoided calling war-related inflation transitory, instead noting that the Middle East’s impact on the U.S. economy is “uncertain,” while economic activity continues at a solid pace and inflation remains elevated.
The housing market showed weakness as well. January new home sales fell 17.6% to an annual pace of 587,000—the slowest since 2022—likely influenced by severe winter weather. Sales plunged nearly 45% in the Northeast and about 34% in the Midwest. A sluggish housing market is expected to weigh on GDP growth.
On the tech side, data center demand remains strong. Micron Technology (MU) reported a 196.3% year-on-year revenue jump to $23.86 billion in its latest quarter, while earnings soared 682.1% to $12.20 per share from $1.20 a year ago. The company beat revenue expectations by 21.7% and earnings by 38.6%, underscoring robust demand for fast memory chips.
Mainstream media reports that the dollar is strengthening, attributing the move to rising oil prices. But is that explanation accurate?
The dollar’s strength is more likely tied to the sharp downturn in an overvalued U.S. stock market.
As equities slide, investors appear to be retreating into cash, driving demand for the dollar. Meanwhile, both major political parties continue to present the stock market as a key symbol of economic health, while commentators push for aggressive rate cuts—even as inflation risks remain elevated.
Such cuts could erode returns for retirees and savers, but may help prop up equities and prevent a collapse reminiscent of 1929, while also enabling the government to take on significantly more debt.
A broader perspective challenges the idea of a strong dollar rally. Viewed against gold over the long term, the dollar shows little real strength, with fiat currency appearing to be on a prolonged path of decline.
The persistent rise in the cost of essentials—such as food, housing, and transportation—is often linked to government reliance on fiat money. In this view, the long-term impact of fiat systems has been deeply damaging to citizens, rivaling the economic harm typically associated with major conflicts.
The argument here is that investors should consistently build positions in gold, taking advantage of key price zones such as $5,000, $4,850, and $4,650 to accumulate not only gold, but also silver and mining stocks.
From a technical perspective, momentum indicators like the Stochastics (14,7,7) are نزدیک oversold levels, and a dip toward $4,850 could help form a large bullish triangle pattern, with a potential upside target around $6,600.
In the near term, attention is on upcoming data and policy decisions—specifically the PPI report and the Federal Reserve’s rate announcement. With oil prices having surged significantly, the Fed may face challenges in addressing inflation while balancing pressure to support the economy. Policymakers could frame inflation as temporary, despite it remaining above their long-term target.
For long-term gold investors, however, the focus is less on short-term central bank actions and more on identifying attractive entry points to steadily accumulate precious metals and quality mining equities.
What about oil? The U.S. is aggressively trying—while piling on more debt—to contain the attacks around the Strait of Hormuz, and a positive headline could emerge within the next couple of weeks.
That could act as a catalyst for the stock market rally I’m expecting (including gold equities). Still, oil appears stuck in a wide $80–$120 range for now, though the odds favor an upside breakout, potentially driving prices toward $160.
The key point is this: oil production and transportation infrastructure across much of the Middle East has likely suffered meaningful damage, and restoring full capacity could take years.
As for Venezuela stepping in to offset the shortfall, that seems unlikely in the near term. Despite political maneuvering, international oil companies will likely expand production there very cautiously.
In short, $80 may now represent a structural floor for oil prices. If so, inflation floors—across CPI, PPI, and PCE—could settle in the 4%–5% range, or even higher.
What about miners? The CDNX hasn’t made any meaningful progress since I flagged a profit-taking opportunity five months ago at the key psychological resistance level around 1000.
From a technical standpoint, this consolidation phase could persist into the fall, potentially forming a highly bullish, symmetrical structure on the chart.
In the meantime, gold stock investors should use this period to properly organize their allocations—positioning themselves to patiently ride out the lull and ultimately capitalize on the powerful breakout and multi-year advance that is likely to follow.
The chart for SIL (the silver miners ETF) remains bullish. Based on classical charting principles from Edwards & Magee, rectangle patterns tend to break to the upside about 67% of the time, implying a potential target near $130.
Rather than trying to pinpoint an exact bottom, investors are better off identifying strong accumulation zones—like the current one—and buying incrementally. A gold price of $5,000 aligns with roughly $92 for SIL, while additional positions in GDX, SIL, and related mining stocks could be added if gold dips toward $4,850.
With governments globally becoming increasingly debt-driven, the macro backdrop remains chaotic. In that environment, gold, silver, and mining investors can stay on the sidelines of the noise and focus instead on taking advantage of attractive entry zones.
Gold draws safe-haven demand as tensions in the Middle East escalate further.
Inflation concerns dampen expectations of Fed rate cuts, supporting the USD and limiting the metal’s upside.
Traders remain cautious, avoiding aggressive positions ahead of this week’s major central bank events.
Gold (XAU/USD) ticks modestly higher in Tuesday’s Asian session but struggles to build momentum, hovering near a three-week low reached the day before. Ongoing tensions in the Middle East continue to provide some support, as the conflict shows little sign of easing. Israel has expanded its ground operations in southern Lebanon—an area where Hezbollah maintains a strong presence—keeping geopolitical risks elevated and sustaining demand for the safe-haven metal.
Now in its third week, the conflict has seen Iran target civilian infrastructure across six Gulf nations, including airports, ports, oil facilities, and commercial centers, using missiles and drones. Disruptions in the Strait of Hormuz—a critical route for about one-fifth of global oil supply—have also kept crude prices elevated. This adds to inflation concerns, potentially pushing the Federal Reserve to maintain higher interest rates for longer or even consider further tightening, which in turn limits upside for non-yielding assets like gold.
At the same time, rising geopolitical tensions have revived demand for the US Dollar following a pullback from its highest level since May 2025, further capping gains in XAU/USD. However, USD bulls remain cautious ahead of the outcome of the Federal Open Market Committee (FOMC) meeting on Wednesday. Policy decisions from other major central banks, including the ECB, BoJ, and BoE, are also expected later in the week and could drive fresh volatility in gold prices.
Gold (XAU/USD) on the 4-hour timeframe chart
Gold appears at risk, with a break below the 200-period SMA and the 38.2% Fibonacci level still in effect
Gold’s recent drop below the 200-period Simple Moving Average (SMA) on the 4-hour chart, along with sustained trading beneath the 38.2% Fibonacci retracement of the February–March rally, continues to favor bearish momentum in XAU/USD. The Moving Average Convergence Divergence (MACD, 12, 26, 9) remains in negative territory, with the MACD line below its signal line and a bearish histogram, pointing to ongoing downside pressure. Meanwhile, the Relative Strength Index (RSI) sits around 41, tilting toward the weaker side of neutral and suggesting sellers are still in control.
On the upside, initial resistance is seen near the 38.2% Fibonacci level around $5,040, followed by the 200-period SMA close to $5,063. A decisive move above this zone would help reduce bearish pressure and potentially pave the way toward the 23.6% retracement near $5,186. On the downside, immediate support lies at the key psychological level of $5,000, with further support around the recent lows between $4,995 and $4,985. A break below this area could open the door to a deeper pullback toward the 50.0% retracement at $4,921.41. A sustained move back above the 200-period SMA would weaken the bearish outlook, while continued rejection below $5,040 keeps the focus on further declines.
Gold attracted dip-buying during Friday’s Asian session, ending a two-day losing streak.
Declining US Treasury yields weighed on the US Dollar, helping support the precious metal as safe-haven demand increased.
However, inflation concerns have reduced expectations for interest rate cuts by the Federal Reserve, strengthening the US Dollar and potentially limiting further gains in gold.
Gold (XAU/USD) moved higher during Friday’s Asian session, recovering part of the losses recorded over the previous two days. The rebound came as the US Dollar (USD) paused its three-day rally amid a modest decline in US Treasury yields, offering some support to the precious metal. In addition, escalating tensions in the Middle East have boosted safe-haven demand, encouraging traders to buy Gold near the lower end of the trading range that has persisted over the past two weeks.
Iran’s new supreme leader, Mojtaba Khamenei, warned in his first public remarks that all US military bases in the region should close immediately or face potential attacks. He also stated that Iran would continue strikes against US bases, even while expressing a willingness to maintain goodwill with neighboring countries. Meanwhile, Donald Trump emphasized that countering Iran’s “evil empire” was more important than the impact on oil prices. In fact, Crude Oil prices have been rising since the beginning of the US-Israel conflict with Iran.
At the same time, fears of supply disruptions caused by the closure of the Strait of Hormuz have increased concerns about a potential surge in inflation. This has prompted investors to scale back expectations for interest rate cuts by the Federal Reserve in 2026. Such expectations could push US bond yields and the USD higher, potentially limiting further gains for non-yielding assets like Gold.
Investors are also waiting for the US Personal Consumption Expenditures (PCE) Price Index, due later in the North American session. This key inflation indicator will play an important role in shaping expectations for the Fed’s policy outlook, especially as markets worry that the war could push consumer prices higher.
Overall, geopolitical developments remain the dominant driver for markets. However, XAU/USD still appears on track to post a second consecutive weekly loss, and the mix of supportive and restrictive factors suggests traders may remain cautious before taking strong directional positions.
XAU/USD four-hour chart
Gold continues to receive support around the 200-period EMA on the 4-hour chart.
Gold is once again rebounding from support near the 200-period Exponential Moving Average (EMA) on the 4-hour chart. This reaction keeps the broader bullish structure intact despite the recent pullback and suggests that XAU/USD bears should remain cautious.
At the same time, the Moving Average Convergence Divergence (MACD) remains below both its signal line and the zero level. However, the shrinking negative histogram suggests that bearish momentum is fading rather than signaling a fresh downside move. The Relative Strength Index (RSI), hovering around 44, remains below the 50 midpoint but is well above oversold territory, indicating that the current move may be more of a corrective phase within a broader upward trend rather than a confirmed top.
In terms of levels, immediate support lies near $5,090, where recent intraday lows sit slightly above the 4-hour 200-period EMA around $5,039, creating an important demand zone. A break below this region could expose stronger support near $5,000.
On the upside, initial resistance is seen around the recent swing high near $5,160. A sustained move above this level could pave the way toward $5,200, followed by the late-stage peak near $5,230.
A recovery above the $5,160–$5,200 area would likely push the MACD back toward the zero line and lift the RSI closer to 50, strengthening the bullish bias. Conversely, if the $5,090–$5,039 support cluster fails to hold, the 4-hour outlook could shift toward a more neutral or even bearish tone.
Gold prices edged higher in Asian trading on Wednesday as investors weighed mixed developments surrounding the U.S.-Israel conflict with Iran, particularly concerns about energy market disruptions and the possibility that the fighting could ease.
Traders are also awaiting U.S. consumer inflation data for February for fresh insight into the health of the world’s largest economy, although the report is unlikely to fully capture the recent surge in energy prices linked to the Iran conflict.
Spot gold rose 0.2% to $5,204.29 an ounce as of 01:17 ET (05:17 GMT), while gold futures slipped 0.5% to $5,213.11 per ounce.
Gold breaks above $5,200/oz as markets weigh mixed Iran signals
Gold’s gains on Wednesday pushed prices above the $5,000–$5,200 per ounce range that had contained trading over the past week, though it remained uncertain whether the breakout would hold.
The precious metal has experienced sharp volatility in recent weeks, retreating significantly after reaching a record high near $5,600 per ounce in late January.
Conflicting developments surrounding the Iran war also contributed to choppy trading this week. U.S. President Donald Trump said late Monday that the conflict was nearing an end. However, exchanges of strikes between the U.S., Israel, and Iran continued into early Wednesday, marking the twelfth straight day of fighting.
Investors remain concerned that a surge in energy-driven inflation could prompt global central banks to adopt a more hawkish policy stance—an outlook that typically weighs on gold. As a result, the metal’s gains were capped despite rising safe-haven demand.
Elsewhere in the precious metals market, price movements were relatively muted. Spot silver slipped 0.1% to $88.2245 an ounce, while spot platinum edged up 0.3% to $2,208.89 per ounce.
U.S. CPI report in focus for fresh clues on inflation
Markets are awaiting the release of U.S. consumer price index (CPI) data for February later on Wednesday, which is expected to offer clearer signals on inflation and the outlook for interest rates in the world’s largest economy.
Headline CPI is forecast to hold steady at 2.4% year-on-year, while core CPI is projected to remain unchanged at 2.5%.
Although the data is unlikely to capture the recent spike in energy prices triggered by the Iran conflict, investors will still monitor the report closely for indications on consumer spending trends and the broader health of the U.S. economy.
The CPI release follows a weaker-than-expected February payrolls report, which has fueled some concerns that economic momentum in the United States may be slowing.
Gold declines as a surge in oil prices pushes the U.S. dollar and Treasury yields above important levels.
However, safe-haven demand tied to tensions in the Middle East is helping limit further losses despite the rise in yields.
For now, the key levels to watch are $5,000 as support and the $5,150–$5,200 resistance zone.
Gold has begun the week on a weaker note after recording its first weekly loss since the sharp drop at the end of January. Although prices attempted to rebound in the latter half of last week, the recovery was not enough to offset the earlier declines.
The move largely reflects the sharp surge in oil prices, which has pushed both the U.S. dollar and bond yields higher. With oil climbing above $100 today, gold slipped again at the start of the session. As a result, gold is currently caught in a difficult position: escalating tensions in the Middle East are generating some safe-haven demand, but the strengthening U.S. dollar and rising bond yields are acting as significant headwinds.
Stronger U.S. Dollar and Rising Yields Offset Safe-Haven Demand
Rising yields typically weigh on assets like gold and silver, which do not generate interest and involve storage costs. In recent months, however, gold has shown notable resilience even as bond yields remained elevated. That strength faded somewhat last week, and at the start of today’s session gold slipped again—an unsurprising move given the firmer U.S. dollar and higher Treasury yields.
As the session progressed, gold did recover from its earlier lows, though it was still trading in negative territory at the time of writing.
The recent spike in oil prices has had a mixed impact on gold. On one side, the rise in bond yields and the stronger U.S. dollar has put downward pressure on the metal. On the other, safe-haven demand has continued to limit the downside. If oil prices were to ease somewhat—perhaps through a coordinated release of strategic reserves—gold could find room to move higher again.
Overall, gold’s price action remains volatile and largely in a consolidation phase, offering both bullish and bearish traders opportunities amid the heightened market swings.
Key Gold Price Levels to Watch
For now, the market appears to be trading strictly between key levels, and this pattern is likely to continue until we see a decisive breakout above resistance or a breakdown below the major support levels protecting the downside.
So, which levels are the most important to watch?
Support is currently located between $5,000 and $5,050. This zone has been tested several times from above in recent days and has held up well so far.
As long as gold does not break decisively below the $5,000 level, the overall bias could still favor the upside. Despite the recent rebound in the U.S. dollar and bond yields, gold’s broader trend has remained bullish, making it difficult to dismiss that outlook—especially given the ongoing tensions in the Middle East.
On the resistance side, the key range lies between $5,150 and $5,200. This area has been tested multiple times since the breakout seen last Tuesday, which initially appeared to signal a potential turning point for gold.
However, there has been little meaningful follow-through to the downside. The fact that gold has managed to hold steady suggests it may be forming a base around $5,000 before possibly attempting another move higher.
For now, the focus remains on these levels. Whether gold breaks above resistance or falls below support will likely determine its next short-term direction.
Gold prices increased during Asian trading on Tuesday but remained within a narrow range as investors looked for clearer signals about a potential de-escalation in the U.S.–Israel conflict with Iran.
The precious metal advanced alongside a broader improvement in market risk sentiment after U.S. President Donald Trump suggested the conflict with Iran could end soon and said Washington was also considering steps to help curb the recent surge in oil prices.
Spot gold climbed 0.8% to $5,175.48 per ounce as of 01:55 ET (05:55 GMT), while gold futures gained 1.6% to $5,184.79 per ounce. Spot prices had edged slightly higher on Monday after experiencing significant volatility throughout the session.
Gold stays within the $5,000–$5,200 range as safe-haven demand remains mixed.
Gold stayed firmly within the $5,000–$5,200 per ounce range set over the past week, as traders weighed a wave of uncertainty surrounding the global economy.
Although the conflict with Iran boosted safe-haven demand for gold, gains were limited by worries that the crisis could fuel inflation, potentially prompting more hawkish policies from major central banks.
Analysts at ANZ also pointed out that gold’s strong rally this year has faced bouts of profit-taking, as investors looked to raise liquidity during a sharp selloff in global equity markets.
Other precious metals moved higher on Tuesday, with spot silver climbing nearly 6% to $89.1915 per ounce, while spot platinum gained 0.7% to $2,201.48 per ounce. In the industrial metals market, LME copper futures rose 1.3% to $13,095.30 a tonne.
Trump signals Iran tensions may ease, boosting oil supply outlook.
Risk sentiment improved on Tuesday and oil prices declined after Donald Trump said several times on Monday that the war with Iran could soon come to an end. Trump also floated potential steps to reduce supply disruptions caused by the conflict, including temporarily easing sanctions on certain oil exporters, particularly Russia.
However, he did not provide a clear timeline for any de-escalation and continued to maintain a tough stance toward Tehran. Trump warned that the Islamic Republic would face severe consequences if it attempted to block the Strait of Hormuz.
“We will strike easily destroyable targets that would make it virtually impossible for Iran to rebuild as a nation again — death, fire and fury will follow,” Trump said.
Iran dismissed Trump’s statements and reiterated that it would continue blocking the Strait of Hormuz until attacks by the United States and Israel against Tehran cease.
The conflict entered its eleventh consecutive day on Tuesday, with tensions across the Middle East showing little sign of easing. A prolonged war is expected to keep supporting gold prices, as safe-haven demand remains strong amid rising inflation risks driven by disruptions in the oil market.
Gold futures are hovering around $5,185, validating a decisive breakout from a multi-year consolidation range and signaling what looks like the hyperbolic stage of the ongoing bull run. Based on VC PMI modeling and Square-of-9 harmonic projections, the next key resistance zone is projected between $5,400 and $5,850.
Should upside momentum carry through the upcoming cycle window in late March, prices may stretch toward the $6,000 area by mid-April, where more substantial harmonic resistance is expected. The sharp upward angle of the moving averages reflects strong institutional participation, implying that any pullbacks are likely to represent brief consolidations within a broader bullish advance.
On the monthly continuation chart, gold futures display one of the most pronounced structural rallies in precious metals history. Following years of range-bound trade between roughly $1,700 and $2,100, gold broke out in 2024 and has since accelerated into what can be characterized as a hyperbolic expansion phase.
With prices now near $5,185—well above the primary moving-average framework—the technical backdrop confirms a robust momentum environment typical of the later stages of a long-term bull market.
From a VC PMI mean-reversion standpoint, price action unfolds in oscillating waves around equilibrium. When the market stretches materially above its mean, it reflects powerful upside momentum—but also a rising likelihood of heightened volatility.
On the current monthly timeframe, gold is trading well above its 9-month and 18-month moving averages. Historically, such extended positioning tends to occur during periods of accelerated institutional accumulation and heightened global monetary stress, conditions that often accompany the more explosive phases of a long-term bull cycle.
Market Timing Windows
Applying the VC PMI time-cycle framework alongside harmonic rhythm analysis, the following timing windows are anticipated for March and April:
March 7–10 – Initial volatility window where the market may pause or consolidate following the recent sharp advance.
March 18–22 – Secondary cycle pivot zone, a period that often reveals whether the trend resumes or shifts into corrective behavior.
March 27–31 – Key inflection window, coinciding with futures delivery dynamics and potential liquidity realignments.
April 12–18 – Major harmonic cycle window that could generate either a short-term peak or an accelerated continuation breakout.
These timeframes should be viewed as probabilistic windows, not precise reversal dates. In hyperbolic market phases, price action often accelerates into projected cycle periods, followed by short-lived pullbacks before the broader uptrend resumes.
Square-of-9 Harmonic Resistance
Applying W.D. Gann’s Square-of-9 framework to prior breakout levels highlights the next key harmonic price objectives. Current projections indicate that gold is advancing toward a significant resistance band between $5,400 and $5,850.
Should the market maintain monthly closes above the $5,400 threshold, the Square-of-9 model opens the door to the next harmonic cluster in the $6,000–$6,300 range—closely aligned with the broader cycle window projected into April.
How price reacts at these geometric resistance zones—particularly in conjunction with the upcoming time-cycle windows—will help determine whether gold enters a temporary consolidation phase or continues its acceleration within a larger liquidity-driven advance.
Structural Interpretation
The pronounced upward slope of the moving averages confirms that gold is operating in the momentum stage of a secular bull market. Historically, such phases unfold during periods when global capital rotates toward hard assets amid currency debasement, geopolitical tension, and expanding sovereign debt burdens.
Although intermittent pullbacks are normal in strong trends, the broader structure remains constructive as long as price holds above the monthly mean zone near $4,300–$4,400, which now serves as major structural support.
Gold prices tumble toward $5,180 despite the ongoing conflict in the Middle East. Tehran has stepped up military operations near the Strait of Hormuz in retaliation against the United States, escalating regional tensions. At the same time, stronger-than-expected US factory inflation data has prompted traders to scale back expectations of near-term Federal Reserve rate cuts.
During Tuesday’s European session, XAU/USD declined roughly 2.5% to trade near $5,180. The pullback follows four consecutive days of gains, including a sharp rally on Monday when investors sought safe-haven assets amid intensifying geopolitical risks.
Over the weekend, the United States and Israel carried out coordinated airstrikes on Iran, reportedly eliminating several senior leaders, including Supreme Leader Ayatollah Ali Khamenei.
In response, Tehran shut down the Strait of Hormuz and launched attacks on Israeli territory as well as multiple US military installations across the region. Earlier Tuesday, Iranian forces also targeted the US Embassy in Riyadh using drones.
Although gold typically benefits from heightened geopolitical uncertainty, the metal has come under pressure as expectations for a dovish Federal Reserve have moderated. According to the CME FedWatch Tool, the probability that the Fed will keep interest rates unchanged at its June meeting has risen to 53.5%, up from 42.7% on Friday.
Traders reassessed their rate-cut expectations following Monday’s release of the US ISM Manufacturing Prices Paid index for February. The inflation gauge, which measures changes in input costs such as labor and raw materials, surged to 70.5—well above forecasts of 59.5 and the prior reading of 59.0—signaling stronger price pressures at the factory level.
Gold (XAU/USD) 4-Hour Chart Analysis
XAU/USD is trading below $5,200 at the time of writing. The short-term outlook has shifted to neutral with a bearish bias after the pair retreated from the upper boundary of its Rising Channel formation near $5,400 and moved back toward the 20-period Exponential Moving Average (EMA), currently positioned around $5,280.
Momentum indicators reinforce the weakening bullish tone. The 14-period Relative Strength Index (RSI) has fallen sharply from overbought territory above 80 to approximately 49, signaling a clear loss of upside momentum and diminishing buying pressure.
On the downside, immediate support is located near $5,065, aligning with the lower boundary of the Rising Channel. A decisive break beneath this level could expose the psychological $5,000 mark. Conversely, on the upside, the upper boundary of the Rising Channel remains the primary resistance zone, just above $5,400.
Gold prices climbed in Asian trade on Tuesday, marking a fourth consecutive session of gains as investors assessed the escalating conflict in the Middle East. However, strength in the U.S. dollar limited the metal’s upside momentum.
Spot gold advanced 1.1% to $5,378.55 per ounce as of 20:26 ET (01:26 GMT), while U.S. gold futures rose 1.5% to $5,390.06. The precious metal had already gained 1% in the prior session.
Widely regarded as a safe-haven asset during periods of geopolitical uncertainty, bullion attracted fresh demand following an intense weekend of military activity in West Asia.
Large-scale strikes by U.S. and Israeli forces targeted Iran, reportedly resulting in the death of Supreme Leader Ayatollah Ali Khamenei along with several senior military officials. Tehran responded with missile attacks across the region.
Tensions expanded beyond Iran, as Israeli forces carried out strikes in Lebanon after Hezbollah attacks, and reports emerged that Kuwaiti air defenses mistakenly shot down U.S. aircraft.
U.S. President Donald Trump indicated that military operations could persist for several weeks and acknowledged uncertainty within Iran’s leadership following Khamenei’s death, highlighting the risk of extended regional instability.
Tehran also threatened to target vessels transiting the strategically vital Strait of Hormuz—a key artery for global oil shipments—intensifying concerns over potential supply disruptions and reinforcing demand for defensive assets such as gold.
Crude prices surged on fears of supply constraints, fueling inflation expectations and underpinning gold’s appeal as a hedge. Nonetheless, gains in bullion were restrained by a firmer U.S. currency.
The U.S. Dollar Index edged up 0.2% during Asian hours after surging 0.8% in the previous session to its highest level since late January. A stronger dollar typically pressures gold by increasing its cost for holders of other currencies.
Elsewhere in the precious metals complex, silver rose 1.6% to $90.75 per ounce, while platinum gained 0.5% to $2,321.06 per ounce.
Gold continues to power higher like an unstoppable juggernaut, defying decades of historical precedent. After nearly tripling in just a couple of years, the metal has maintained relentless upside momentum — even as extreme overbought readings that historically triggered sharp corrections have repeatedly failed to spark a meaningful selloff.
The term “juggernaut” itself originates from the Hindu deity Jagannath, whose towering chariots are pulled during India’s Ratha Yatra festival — massive, nearly unstoppable structures once said to crush anything in their path. Gold’s current advance resembles that kind of force: powerful, slow-moving, and extraordinarily difficult to halt.
Defying half a century of cyclical behavior
Since the U.S. abandoned the gold standard in August 1971, gold has moved in well-defined cycles. Over the past 55 years, dollar-denominated gold has recorded:
32 cyclical bull markets with gains exceeding 20%
11 additional uplegs of more than 10%
17 cyclical bear markets with losses over 20%
24 corrections of at least 10%
These alternating cycles make trading possible — buying low and selling high depends on gold’s historical tendency to mean-revert after extreme moves.
Yet the latest bull market has shattered prior benchmarks. From early October 2023 to late January 2026, gold surged an unprecedented 196.4% over 27.8 months — the largest cyclical bull on record. For comparison, the famed January 1980 surge gained 127.9% in just 2.6 months.
By late January 2026, gold reached one of its most overbought levels ever, trading 43.4% above its 200-day moving average — its most extreme reading since March 1980. Historically, such conditions have reliably preceded fast and deep corrections.
Indeed, gold briefly cracked — plunging 10.3% in a single session, its third-worst daily drop since 1971, followed by a 13.3% correction over two days. Based on historical patterns, such extremes have typically led to average declines of roughly 20% over the next two months.
But this time has been different.
A historically rare rebound
Instead of cascading lower, gold rebounded swiftly, recovering more than three-quarters of its two-day plunge and returning to within 3% of its record high. Rather than a full correction, the move increasingly resembles a high consolidation — a sideways digestion of gains rather than a deep retracement.
That possibility challenges over five decades of precedent.
Market history teaches adaptability. As economist John Maynard Keynes famously observed, “When the facts change, I change my mind.” While history strongly argues for a larger correction, gold’s recent behavior suggests underlying structural demand may be altering the cycle’s dynamics.
A structural shift in demand
Unlike earlier gold bull markets driven primarily by U.S. investors and futures speculation, this surge has been powered heavily by:
Chinese and Indian investment and jewelry demand
Strong central bank accumulation
Reduced reliance on American speculative flows
That steady international buying appears to have smoothed volatility. Remarkably, from October 2023 to January 2026, gold did not experience a single correction exceeding 10% — an extraordinary deviation from historical norms.
During that stretch, gold reached extreme overbought conditions four separate times that typically would have required sharp pullbacks. Instead, it consolidated sideways, allowing technical excesses to normalize gradually rather than through panic selling.
Overbought — but not breaking
One widely used metric, “Relative Gold” (rGold), measures gold’s price relative to its 200-day moving average. Over the past five years, extreme overbought readings began near 1.18x that average. In January 2026, gold far exceeded that threshold — yet still refused to unravel.
If gold successfully transitions from its most powerful cyclical bull ever into yet another high consolidation rather than a major bear phase, it would mark the fifth such episode in recent years — an extraordinary break from long-term statistical norms.
For traders expecting mean reversion, that presents real danger. Betting against momentum in a structurally supported market can be like stepping in front of a moving chariot.
Gold may still correct — history suggests it eventually will. But for now, extreme overbought conditions alone have proven insufficient to halt this advance.
Gold’s refusal to break down from extreme overbought levels has now evolved into something historically extraordinary. What began as a powerful cyclical bull has repeatedly transitioned not into sharp corrections — as five decades of precedent would suggest — but into a series of high consolidations that preserved momentum and reset sentiment without deep damage.
Four prior high consolidations — and counting?
The first extreme-overbought episode of this monster bull emerged in mid-April 2024, when gold closed at 1.188x its 200-day moving average (200dma). That followed a 31.2% surge in just 6.4 months. Historically, that setup demanded a sharp correction. Instead, gold drifted sideways for 3.8 months, correcting only 5.7% at worst. During that span, rGold averaged 1.127x — elevated, but nowhere near oversold territory (which historically begins below 0.93x).
The second episode arrived in late October 2024, when gold again pierced extreme territory at 1.183x its 200dma, with gains reaching 53.1% over 12.9 months. Rather than collapse, gold entered another sideways drift lasting 3.0 months. The maximum pullback was 8.0%, and average rGold readings remained lofty at 1.090x.
By mid-April 2025, the bull extended to 88.0% gains, and gold reached 1.266x its 200dma — the most overbought level in 13.7 years. In prior cycles, similar extremes triggered double-digit selloffs. Instead, gold carved out a third high consolidation lasting 4.2 months. Even during that stretch, gold averaged 15.3% above its 200dma — remarkably elevated.
The fourth episode followed gold’s surge to 139.1% gains by mid-October 2025, when rGold hit 1.330x — the most extreme since 2006. An initial 9.5% drop threatened to spiral into a full correction, but aggressive Chinese buying — particularly into Mondays when Asian trading dominates price discovery — arrested the decline. That consolidation lasted just 2.0 months, the shortest yet, with rGold still averaging 1.211x.
The January 2026 blowoff — and defiance
Then came the mania phase. In just five weeks into late January 2026, gold surged another 24.3%, extending total gains to 196.4% over 27.8 months — the largest cyclical bull in modern history. rGold spiked to an astonishing 1.434x, the most overbought reading in 45.9 years.
History strongly suggested a fast 20%+ cyclical bear was imminent.
Gold did plunge 13.3% over two sessions, formally ending the bull. But once again, heavy Chinese demand — amplified by Lunar New Year buying — helped prices rebound rapidly. Rather than cascading lower, gold began what may be its fifth high consolidation from extreme levels.
As of midweek, that consolidation was just 0.9 months old, with average rGold near 1.298x — far above the 1.145x average of the prior four consolidations. By historical standards, that remains dangerously elevated and leaves meaningful downside risk intact.
Seasonal and structural considerations
Chinese demand has been the defining structural shift of this cycle. Unlike earlier bulls driven primarily by U.S. futures traders and Western investors, recent gains have been heavily supported by Chinese investors, jewelry buyers, and central bank accumulation. That steady buying pressure has dampened volatility and truncated corrections.
However, seasonality matters. Gold demand in China typically peaks into Lunar New Year and softens from late February into mid-March — historically one of gold’s weakest seasonal windows. A minimum six-week sideways period following a major peak is generally required to sufficiently reduce the odds of a serious correction. Gold is only about halfway through that threshold.
If prices can hold into mid-March, the typical spring rally — which has averaged about 4.3% gains during bull years over the past quarter century — could provide renewed upside momentum.
Risks remain asymmetric
Despite the juggernaut narrative, risks remain substantial. Gold has demonstrated it can drop 5%–10% in a single day when sentiment shifts. And gold miners amplify gold’s moves significantly: historically 2x to 3x. A 10% gold correction could translate into 20%–30% declines in miners; a 20% bear phase could mean 40%–60% drawdowns in gold equities.
Bottom line
Gold’s momentum continues to defy half a century of precedent. Extreme overbought conditions that once reliably triggered swift corrections have instead produced high consolidations — a structural shift likely driven by persistent Chinese demand and global diversification flows.
But while this fifth potential consolidation may ultimately prove successful, it remains young and statistically vulnerable. The juggernaut rolls on — yet markets can reverse suddenly.
Caution, patience, and adaptability remain essential.
Gold prices rose on Friday and were on track for robust gains in February, supported by safe-haven demand amid mounting geopolitical tensions and economic uncertainty.
As of 16:33 ET (21:33 GMT), spot gold climbed 1.5% to $5,261.81 an ounce, while April gold futures gained 1.7% to $5,280.26/oz. Spot prices were up more than 8% for the month, rebounding sharply from early-February lows near $4,404.12/oz after a brief speculative pullback.
Gold heads for strong February gains
Escalating tensions between the U.S. and Iran were a major catalyst for gold’s recovery, after Washington increased its military presence in the Middle East and warned of possible action if Tehran rejected a nuclear agreement. Although recent talks ended without a deal, both sides agreed to continue negotiations, offering some cautious optimism.
Economic uncertainty in the U.S. also buoyed bullion, particularly after the Supreme Court of the United States struck down most of President Donald Trump’s trade tariffs. Trump subsequently announced new levies under a different legal framework and signaled further measures, keeping markets wary of additional economic disruption.
A broader equity sell-off, partly driven by shifting sentiment around artificial intelligence stocks, further increased gold’s appeal. Joseph Cavatoni of the World Gold Council noted that investors tend to raise gold allocations during periods of equity weakness, pointing to rising physical demand and stronger ETF inflows, particularly in the Americas and Asia. He added that uncertainty around tariffs, inflation, real yields, and overall economic policy continues to exert upward pressure on gold prices.
Bernstein raises long-term gold forecast
Brokerage firm AllianceBernstein significantly upgraded its long-term gold outlook, citing sustained institutional demand and supportive macroeconomic trends. The firm now projects gold reaching $4,800 per ounce in 2026 and climbing to $6,100 by 2030.
Analyst Bob Brackett emphasized that central bank purchases and ETF flows have been the primary drivers of recent demand. While central bank buying may moderate in 2025, it remains well above pre-2022 levels. Surveys indicate that 95% of central banks expect global gold reserves to rise over the next year, with 73% anticipating a reduced share of U.S. dollar holdings over the next five years. ETF flows, meanwhile, are seen as a key swing factor that can amplify price momentum when inflows accelerate.
Copper supported by China demand outlook
Other precious metals also posted strong February gains. Spot silver surged 6.3% to $93.8490/oz, up nearly 11% for the month, while platinum rose 6.2% to $2,379.10/oz, marking a more than 12% monthly increase.
In industrial metals, copper edged higher on Friday and was modestly positive for February, as markets looked for further signals from China, the world’s largest copper importer. COMEX copper futures rose 1% to $6.0663 per pound, up more than 1% this month.
Copper’s relatively subdued performance earlier in February reflected reduced activity during China’s Lunar New Year holiday, when mainland markets were closed for over a week. Analysts at ANZ noted that both Chinese and global copper inventories increased more than expected during the break due to mining and trade disruptions. With Chinese markets now reopened, attention has shifted back to potential demand growth, particularly as the global artificial intelligence buildout accelerates.
Futures tied to the main U.S. stock benchmarks edged lower as investors focused on key earnings from the technology sector. Nvidia, a heavyweight in the U.S. equity market, delivered stronger-than-expected results, though investors are seeking clearer guidance on when its substantial cash flow will translate into greater shareholder returns. Salesforce shares declined after issuing a softer revenue outlook. Meanwhile, oil prices held steady ahead of crucial nuclear negotiations between U.S. and Iranian officials.
Futures Edge Lower
U.S. equity futures moved down Thursday as markets digested earnings from AI leader Nvidia.
As of 03:05 ET (08:05 GMT), Dow futures were down 122 points, or 0.3%, S&P 500 futures slipped 0.1%, and Nasdaq 100 futures also fell 0.1%. This followed gains across all major Wall Street indices in the previous session, when investors positioned ahead of Nvidia’s earnings release.
Sentiment had improved on renewed optimism surrounding artificial intelligence, marking another shift in what has been a volatile narrative around the emerging technology. The Nasdaq led prior gains as investors regained confidence that AI could eventually deliver broad economic benefits — contrasting with earlier concerns that new AI models might disrupt software firms and limit returns on heavy data center spending.
Remarks from Richmond Fed President Tom Barkin also supported equities, as he noted uncertainty over whether automation would significantly raise unemployment and suggested AI could instead improve labor market efficiency.
Nvidia Little Changed Despite Strong Results
Nvidia reported better-than-expected earnings for the January quarter and issued revenue guidance above forecasts for the current period, yet its shares were mostly flat in after-hours trading.
Some investors questioned whether the chipmaker is returning sufficient capital to shareholders. Yvette Schmitter, CEO of Fusion Collective, pointed out that while Nvidia generated $35 billion in cash during the fourth quarter, it returned just 12% to shareholders — sharply lower than 52% a year earlier.
She also raised concerns about reduced buybacks despite record cash generation, especially as Nvidia highlights strong demand for its sold-out Ampere chips.
These concerns echoed questions raised during the company’s earnings call, including from a UBS analyst who asked whether Nvidia plans to distribute more of the anticipated $100 billion in cash expected this year. CFO Colette Kress emphasized ongoing investment in the broader AI ecosystem, while CEO Jensen Huang underscored AI’s foundational role in the future of computing.
Salesforce Drops on Soft Revenue Outlook
Salesforce shares fell in extended trading after the company issued fiscal 2027 revenue guidance below Wall Street expectations, suggesting softer demand for enterprise software amid economic uncertainty and tighter corporate budgets.
The company projected full-year revenue between $45.80 billion and $46.20 billion, slightly below consensus estimates at the midpoint.
Salesforce continues to invest heavily in artificial intelligence to counter investor concerns that emerging AI models, such as those developed by startups like Anthropic, could erode demand. These pressures have contributed to stock volatility as the company works to defend its position within the software-as-a-service industry.
However, Salesforce raised its fiscal 2030 revenue forecast to $63 billion from $60 billion, citing expected growth from agentic AI offerings. Analysts at Vital Knowledge described the report as not flawless but “good enough,” highlighting strong AI product momentum, stable core performance, and solid cash flow generation.
Oil Steady Before U.S.- Iran Talks
Oil prices were largely unchanged Thursday, remaining near seven-month highs as markets prepared for a third round of nuclear discussions between Washington and Tehran.
Brent crude gained 0.2% to $70.84 per barrel, while U.S. West Texas Intermediate rose 0.2% to $65.62 per barrel.
U.S. representatives, including special envoy Steve Witkoff and adviser Jared Kushner, are scheduled to meet Iranian officials in Geneva as negotiations continue over Iran’s nuclear program. President Donald Trump has warned that failure to make meaningful progress could lead to serious consequences, raising concerns that prolonged tensions may disrupt supply from Iran, a key OPEC producer.
Gold Edges Higher
Gold prices ticked up as uncertainty surrounding U.S. trade tariffs bolstered safe-haven demand, with investors also monitoring developments in the U.S.-Iran nuclear talks.
Spot gold rose 0.6% to $5,196.55 per ounce, while U.S. gold futures dipped 0.5% to $5,200.54 per ounce.
Markets are also evaluating the implications of newly announced U.S. tariffs following a Supreme Court ruling that struck down President Trump’s sweeping reciprocal tariff measures. Attention now turns to upcoming U.S. economic data, including weekly jobless claims. So far this year, gold has remained supported by geopolitical tensions, central bank buying, and portfolio diversification trends.
Gold edged higher in Asian trading on Wednesday, recovering slightly after the prior session’s pullback driven by profit-taking, as markets weighed the effects of newly enacted U.S. tariffs and looked ahead to upcoming U.S.–Iran negotiations later this week.
Spot gold climbed 0.8% to $5,184.55 per ounce as of 21:08 ET (02:08 GMT), while U.S. gold futures advanced 0.5% to $5,203.10 an ounce. The metal had dropped 1.6% on Tuesday, ending a four-day winning streak.
On Tuesday, the U.S. began enforcing a temporary 10% blanket import tariff, with the Trump administration aiming to raise it to 15%. The move has heightened concerns about global trade disruptions and inflationary pressures. This action came after a U.S. Supreme Court decision last week invalidated earlier broad tariffs introduced under emergency powers, prompting the government to reinstate duties using alternative legal grounds.
Investors also monitored geopolitical developments, as Washington and Tehran are scheduled to hold a third round of nuclear discussions in Geneva on Thursday.
Despite the rebound, gold’s upside remained limited amid expectations that U.S. interest rates will stay higher for longer. Two Federal Reserve officials indicated on Tuesday that there is little urgency to adjust monetary policy, reinforcing a rate outlook that tends to weigh on non-yielding assets like gold.
Additional pressure came from a firmer U.S. dollar, which makes commodities priced in dollars more expensive for foreign buyers. The U.S. Dollar Index was broadly unchanged after rising 0.1% in the previous session.
Among other precious metals, silver gained 1.6% to $88.59 per ounce, while platinum surged 2.3% to $2,224.60 an ounce.
Oil price
Oil prices stayed close to seven-month peaks on Wednesday, as fears of potential U.S.–Iran military confrontation that could disrupt crude supplies kept investors cautious ahead of fresh talks scheduled for Thursday.
Brent crude rose 43 cents, or 0.6%, to $71.20 per barrel by 0400 GMT, while WTI gained 38 cents, or 0.6%, to $66.01. Brent touched its highest level since July 31 last week, and WTI reached its strongest point since August 4 earlier this week. Both benchmarks have remained elevated as Washington deployed additional military assets to the Middle East in an effort to pressure Tehran into negotiations over its nuclear and ballistic missile programs.
A prolonged conflict could threaten exports from Iran—the third-largest producer within Organization of the Petroleum Exporting Countries—as well as other key producers in the region. Analysts at ING noted that persistent uncertainty is likely to keep a significant geopolitical risk premium embedded in prices, leaving markets highly responsive to new developments.
U.S. representatives Steve Witkoff and Jared Kushner are expected to meet Iranian officials in Geneva on Thursday for a third round of negotiations. Iran’s Foreign Minister Abbas Araqchi said a deal is achievable, provided diplomacy takes precedence. Meanwhile, Donald Trump has warned of “very bad consequences” if no agreement is reached, with uncertainty remaining over whether Iran’s potential concessions would satisfy Washington’s demand for zero uranium enrichment, according to IG analyst Tony Sycamore.
Heightened tensions have also coincided with reports that Iran and China are advancing discussions over the purchase of Chinese anti-ship cruise missiles, which could pose a threat to U.S. naval forces stationed near Iran’s coastline. Experts say such weapons would significantly bolster Tehran’s strike capabilities.
Trump is set to address Congress in his State of the Union speech on Tuesday evening, where he is expected to outline his Iran strategy, though specific details have not been disclosed.
Beyond geopolitics, traders are monitoring supply-demand dynamics. The American Petroleum Institute reportedly showed a sharp 11.43-million-barrel increase in U.S. crude inventories for the week ended February 20, even as gasoline and distillate stocks declined. Official data from the U.S. Energy Information Administration is due later Wednesday.
Gold is consolidating after climbing to a monthly peak of $5,250 during Tuesday’s Asian session. The U.S. dollar is attracting renewed demand as liquidity improves and risk appetite stabilizes, even as uncertainty surrounding U.S. tariffs persists.
Despite the pullback, bullion is holding above the 61.8% Fibonacci retracement level at $5,142, which is now acting as key support. Meanwhile, the daily Relative Strength Index (RSI) continues to signal bullish momentum, suggesting the broader uptrend remains intact for now.
XAU/USD Technical Overview
The 21-day Simple Moving Average has climbed above the 50-, 100-, and 200-day averages, and all four are trending higher, highlighting a solid bullish outlook. Price action remains above these key indicators, with the 21-day SMA at $5,029.61 acting as immediate dynamic support. Meanwhile, the 14-day RSI stands at 59.50, slightly above the midpoint, signaling sustained upside momentum.
From the swing high at $5,597.89 down to the low at $4,401.99, the market is consolidating between the 61.8% Fibonacci retracement level at $5,141.05 and the 78.6% level at $5,341.96, which is currently limiting further advances. A decisive daily close above the 78.6% retracement would pave the way for a retest of the previous high, whereas failure to break higher could trigger a decline toward the 50-day SMA at $4,742.30. As long as prices stay above the short-term moving averages, the near-term bias supports continued movement within the retracement range before a clearer breakout emerges.
Fundamental Overview
As trading resumed in China and Japan, liquidity returned to the markets, helping the US Dollar (USD) stabilize after recent pressure.
Investors had previously leaned into “sell America” positions following tariff-related confusion triggered by US President Donald Trump over the weekend, which dented overall market confidence.
Wall Street’s slide continued on Monday amid persistent uncertainty surrounding Trump’s tariff agenda, escalating geopolitical tensions, and caution ahead of AI heavyweight Nvidia’s earnings release on Wednesday.
Gold ended its four-session rally as the USD staged a modest rebound, with prices retreating from monthly peaks to test key support near $5,142.
Market participants remain highly sensitive to tariff developments, particularly after The Wall Street Journal reported early Tuesday that the Trump administration is considering fresh national security tariffs on several industries. The report followed a recent Supreme Court ruling that struck down a number of second-term levies.
At the same time, geopolitical concerns persist, with tensions between the United States and Iran continuing to simmer.
Ongoing expectations that the Federal Reserve will deliver at least two interest rate cuts this year should help limit deeper losses in Gold, which remains a traditional safe-haven asset.
Further underpinning prices, investment demand from India has stayed resilient despite record-high levels, according to Money Metals Exchange.
Gold extended its rally for a fourth consecutive session, supported by a mix of favorable drivers.
Ongoing trade uncertainties and escalating geopolitical tensions continued to bolster demand for the safe-haven metal.
Expectations of Federal Reserve rate cuts, along with a broadly softer U.S. dollar, offered further support to the non-yielding asset.
Gold (XAU/USD) posted its strongest-ever weekly close above the $5,100 level on Friday and carried that momentum into the new week. The metal has now advanced for a fourth consecutive session, climbing past $5,150 during the Asian session to reach a fresh monthly high. Persistent trade-war concerns and escalating geopolitical tensions in the Middle East continue to channel safe-haven flows into bullion.
U.S. President Donald Trump introduced a new trade framework after a Supreme Court ruling blocked his earlier sweeping tariff plan, announcing a 15% global tariff on imports—the maximum permitted under the law. The move heightened fears of retaliatory action and broader economic fallout from supply chain disruptions, dampening risk appetite and reinforcing demand for gold as a defensive asset.
On the data front, Friday’s release showed the U.S. Personal Consumption Expenditures (PCE) Price Index rose 2.9% year-over-year in December, while the core measure increased 3.0%, tempering expectations of a March rate cut by the Federal Reserve. Even so, markets continue to anticipate the possibility of two 25-basis-point reductions later this year.
Those expectations were supported by weaker U.S. growth figures, with GDP expanding at a 1.4% annualized pace in the fourth quarter—slowing sharply from 4.4% in Q3—amid the longest government shutdown on record. Combined with trade-related uncertainty, the softer growth backdrop has pulled the U.S. dollar back from last week’s highs, adding further support to non-yielding gold.
Additionally, the risk of military confrontation between the U.S. and Iran has contributed to the metal’s upward momentum. Officials from both sides are scheduled to meet in Geneva on Thursday after Iran submitted a detailed nuclear proposal. Reports indicate that President Trump is weighing potential military action if diplomatic efforts fail to restrain Tehran’s nuclear ambitions, further underpinning safe-haven demand.
XAU/USD H4 chart
Gold buyers remain in control, with Friday’s surge beyond the $5,100 level still holding firm.
From a technical standpoint, the solid upside continuation at the beginning of the week confirms last Friday’s breakout above the $5,100 horizontal resistance, reinforcing the bullish outlook for XAU/USD. The MACD remains above both the Signal line and the zero level, while the expanding positive histogram points to building upward momentum.
In addition, gold is trading comfortably above the ascending 200-period EMA, which underpins the current advance and keeps the near-term bias skewed to the upside. However, the RSI at 73.23 signals overbought conditions, suggesting that immediate gains could be capped.
As long as prices stay above the rising 200-period EMA at $4,864.04, the broader bias remains constructive, with dips likely to be limited. The MACD continues to support the bullish case, though a narrowing histogram would indicate fading momentum. With the RSI stretched into overbought territory, a period of consolidation or mild pullback may emerge before the uptrend resumes. Still, holding above the 200-period EMA would preserve the overall recovery structure, even if short-term consolidation unfolds.
Gold extended its rally for a fourth consecutive session on Monday, building on last week’s advance as new global tariff measures from U.S. President Donald Trump and softer U.S. economic data boosted demand for safe-haven assets.
Spot gold climbed 0.8% to $5,143.55 an ounce by 19:53 ET (00:53 GMT), while U.S. gold futures jumped 1.7% to $5,165.86.
Bullion gained more than 1% last week as escalating geopolitical tensions between the U.S. and Iran encouraged a risk-off tone across markets.
Late last week, Trump announced a 10% tariff on global imports for 150 days under Section 122 of U.S. trade law, following a decision by the Supreme Court of the United States to strike down a broader tariff framework. The administration subsequently increased the levy to 15%—the maximum permitted under the statute—heightening fears of retaliatory actions and disruptions to global supply chains.
The tariff move dampened investor sentiment, driving flows into traditional safe havens such as gold and U.S. Treasuries. Ongoing uncertainty about how long the tariffs will remain in place, along with potential legal and congressional challenges, added to market volatility.
Gold also found support in recent U.S. data. The economy expanded at an annualized 1.4% pace in the fourth quarter, a notable slowdown from the prior quarter. Meanwhile, the Personal Consumption Expenditures (PCE) price index—the inflation measure favored by the Federal Reserve—rose 2.9% year-on-year in December, with core inflation near 3.0%, still above the central bank’s 2% target.
The mix of moderating growth and persistently elevated inflation strengthened gold’s role as both a hedge against economic uncertainty and a store of value.
Gold futures are presently moving within a defined VC PMI mean-reversion structure, signaling a market positioned at a pivotal balance point between accumulation and expansion. The price hovering near 5,030 coincides exactly with the weekly VC PMI mean, reinforcing the idea that value and momentum are in equilibrium as traders wait for a clear directional trigger.
When prices consolidate around the mean, the probability outlook turns neutral. A decisive breakout above resistance or a pullback into lower value zones is needed to generate the next high-probability trading opportunity.
Under the VC PMI framework, a sustained close above the 5,030 weekly mean and the daily Sell-1 resistance around 5,036 shifts probabilities in favor of continued upside. That confirmation opens the path toward the daily Sell-2 level near 5,075 and the weekly Sell-1 target at 5,160. A firm break and close above 5,160 would mark the start of a volatility expansion phase, transitioning the market from consolidation into a directional trend, with former Sell-1 and Sell-2 levels converting into support.
In that bullish scenario, momentum could extend toward the weekly Sell-2 objective around 5,275, signaling stronger institutional flows and momentum-based participation. Historical probability metrics suggest that once price closes above the mean and sustains it, there is roughly a 70–80% chance of continuation toward the next resistance zone.
On the other hand, failure to hold above the VC PMI mean—particularly a close below 5,000—would tilt probabilities toward a corrective retracement into the daily Buy-1 level near 4,965 and Buy-2 around 4,933. These represent statistically extreme value areas, where the model identifies a 90–95% probability of reversion back toward equilibrium after being tested.
As long as price remains above the weekly Buy-1 level at 4,916, the broader technical structure stays constructive, implying pullbacks are corrective in nature rather than trend reversals. However, a decisive break below the weekly Buy-2 level at 4,785 would negate the current bullish outlook and point to a deeper cyclical correction.
Time-cycle analysis heading into late February and early March highlights critical inflection windows around February 24–26 and March 3–7—periods that historically coincide with shifts from consolidation to expansion phases.
These timing cycles correspond with Square-of-9 harmonic resistance in the 5,075–5,160 range and support clusters between 4,965 and 4,916, forming a technically balanced and mathematically aligned trading range.
When time and price harmonics converge in this manner, the probability of volatility expansion increases significantly, often leading to directional breakouts accompanied by stronger momentum and broader market participation.
Gold (XAU/USD) remains tilted to the upside for a third consecutive session on Friday, though gains appear restrained amid a mixed fundamental backdrop. Traders are largely staying on the sidelines ahead of key U.S. data releases — the Advance fourth-quarter GDP report and the Personal Consumption Expenditures (PCE) Price Index — before committing to fresh directional positions. These readings are expected to shape expectations for the Federal Reserve’s rate-cut trajectory, which in turn will influence the U.S. dollar and the outlook for the non-yielding yellow metal.
Heightened geopolitical tensions are offering some support. U.S. President Donald Trump warned Iran that it must reach a nuclear agreement within 10 to 15 days or face severe consequences. In response, Iran told UN Secretary-General Antonio Guterres that while it does not seek conflict, it would respond to any military aggression and consider hostile forces’ regional bases legitimate targets. The escalating rhetoric has revived fears of a broader Middle East confrontation, underpinning safe-haven demand for gold and helping sustain its modest advance into the end of the week.
However, upside momentum remains capped by shifting interest-rate expectations. Minutes from the January FOMC meeting indicated policymakers are not in a rush to ease policy further and even discussed the possibility of additional tightening should inflation remain persistent. Strong U.S. labor market data, coupled with hawkish remarks from Fed officials, has prompted investors to scale back expectations for aggressive rate cuts.
This repricing has lifted the U.S. dollar to its highest level since January 23, limiting further gains in gold and suggesting bulls may remain cautious until clearer signals emerge from incoming economic data.
XAU/USD H1 chart
Gold buyers stay in control above the 100-hour SMA; range breakout still pending.
On Thursday, XAU/USD successfully held above the 100-hour Simple Moving Average (SMA), which has shifted from resistance to support, and staged a modest rebound from that level. However, the absence of strong follow-through buying and the largely range-bound movement seen over the past couple of sessions suggest bulls should remain cautious. The 100-hour SMA, currently positioned at $4,965.41, continues to provide nearby dynamic support.
From a momentum standpoint, the Moving Average Convergence Divergence (MACD) remains below both its Signal line and the zero mark, although the narrowing negative histogram points to easing bearish pressure. Meanwhile, the Relative Strength Index (RSI) hovers around 53, reflecting neutral conditions and a tentative recovery bias.
As long as price action stays above the rising 100-period SMA, short-term risks remain tilted to the upside. A bullish MACD crossover accompanied by a move back above the zero line would reinforce the case for further gains. On the other hand, if MACD momentum weakens further and the RSI turns lower from the mid-50 region, the rebound could lose traction, potentially leading to another test of the moving average before a clearer directional move emerges.
The Chinese Spring Festival (Chinese New Year) holiday is now underway, a period that has historically coincided with softer fiat-denominated gold prices.
Meanwhile, gold is carving out a consolidation range between $4,400 and $5,600. The longer price action remains compressed within this band, the more constructive the setup becomes.
Extended consolidation typically builds pressure — increasing the probability of an eventual upside breakout and a potential rally toward $6,800.
Here’s another perspective on the price action. Notice the channel outlined by the dotted blue trendlines.
Gold has broken decisively above that channel and now seems to be digesting the move, consolidating gains after the breakout.
Seasonal softness across the metals complex could linger until the Chinese holiday concludes. For enthusiastic Western gold investors, this pullback phase may present an opportunity to increase exposure to gold, silver, and mining equities.
I’ve outlined what I call an emerging “gold bull era,” driven less by Western fear-based demand and more by the structural economic ascent of China and India—an expansion powerful enough to overshadow the West’s traditional crisis trade.
This new phase could also unfold alongside rapid automation, with hundreds of millions of robots taking on work that inflation-strained populations—both East and West—are increasingly burdened by.
In such an environment, widespread income support could evolve into significantly higher baseline incomes, and gold-oriented Asian consumers may expand their purchases well beyond already robust levels.
In the West, the backdrop looks increasingly fragile. Job growth in 2025 has been minimal, with the latest ADP data showing only around 22,000 positions added in January.
By contrast, the official government report showed a gain of 130,000 jobs. That wide gap raises questions—either the data contains significant distortions, or much of the hiring is concentrated in government roles funded by expanding public debt.
The core fear-trade argument is straightforward: if private-sector job creation continues to stall while debt-financed employment props up the headline numbers, underlying economic weakness may deepen.
Unless productivity gains from automation are formally reflected in economic measurements, the strain between slowing human employment and rising fiscal burdens could intensify.
For investors focused on hedging systemic risk, the question becomes familiar: is your portfolio positioned with assets designed to weather instability?
How about silver? The head-and-shoulders top currently forming is a bearish technical pattern pointing toward the $20 area. What might invalidate this setup?
A rally to $87 would push silver back above three of the shoulders in the formation. An additional climb to $93 would fully invalidate the pattern and deal a severe blow to heavily leveraged bears.
Being a pure silver bug—someone almost entirely invested in silver—demands serious conviction and resilience. For the average investor newly drawn to this remarkable metal, it’s wise to keep ample cash on hand to take advantage of unexpected price pullbacks.
What about the miners? On the CDNX daily chart, the RSI and Stochastics are showing positive signals, but the key 20,40,10 MACD is still sluggish and lacking momentum. If that indicator begins to strengthen, the uptrend in junior mining stocks should pick back up.
The CDNX weekly chart looks impressive. The base formation is strong and likely signals further upside not only for juniors, but also for intermediate and senior mining companies.
The most probable near-term outlook is a brief pause as Chinese investors step back for the New Year holiday, followed by a solid rally into April for the mining sector. After that, a seasonal consolidation through the summer seems likely, before a powerful, decisive breakout above the 1177 highs.
In the meantime, many individual mining stocks could “front-run” the CDNX, advancing to fresh highs ahead of the broader index.
Looking at the long-term chart of the VanEck Vectors Gold Miners ETF versus gold, mining stocks appear strikingly undervalued—arguably the cheapest sector relative to its underlying asset in modern market history.
The encouraging part is that this imbalance may be only months away from correcting through the only reset that truly counts: a major revaluation of gold equities relative to gold itself.
The weekly chart of Lundin Gold is particularly compelling. While most gold producers report all-in sustaining costs (AISC) below $2,000 per ounce—and silver producers around $20—Lundin’s AISC is closer to $1,000, underscoring its strong cost position. Still, even the most efficient miners require periodic technical pauses. The behavior of the key 5 and 15 moving averages highlights these natural consolidation phases.
Pullbacks across the mining sector—both juniors and seniors—can offer strategic entry points, especially as gold continues to consolidate following its broader fundamental breakout.
Some investors even speculate that the fiat price of gold could eventually exceed that of Bitcoin, viewing bitcoin primarily as a liquidity vehicle to accumulate more gold. Over time, rising global demand—particularly from China—could further reinforce gold’s long-term appeal.
Gold prices were largely steady in Asian trade on Thursday, following a surge of more than 2% in the previous session. Momentum was restrained by thin Lunar New Year holiday liquidity, while investors weighed ongoing geopolitical tensions and mixed signals from the Federal Reserve.
Spot gold edged down 0.1% to $4,971.55 an ounce as of 20:51 ET (01:51 GMT), while U.S. gold futures fell 0.4% to $4,991.59.
The precious metal rallied 2.1% on Wednesday, briefly climbing above the $5,000-an-ounce mark and reclaiming most of its earlier weekly losses. However, subdued trading volumes across several major Asian markets amplified short-term volatility.
Geopolitical uncertainty continued to underpin demand for bullion. Market participants tracked rising friction between the United States and Iran, including concerns over security in the Strait of Hormuz and stalled nuclear negotiations. Limited headway in Russia-Ukraine peace talks also sustained broader risk aversion, supporting safe-haven flows into gold.
On the policy front, sentiment turned more cautious after minutes from the Federal Reserve’s latest meeting revealed differing views among officials on the interest-rate trajectory. Some policymakers warned that persistently high inflation could warrant further tightening, while others signaled scope for rate cuts later this year.
Expectations that U.S. rates may stay higher for longer bolstered the dollar and Treasury yields, creating headwinds for non-yielding gold after its sharp rally. The U.S. Dollar Index was flat after climbing 0.6% overnight in response to the Fed minutes.
Gold typically faces pressure when borrowing costs rise, as higher yields raise the opportunity cost of holding the metal. Investors are now focused on Friday’s U.S. personal consumption expenditures (PCE) price index data — the Fed’s preferred inflation measure — for clearer direction on monetary policy.
Gold prices held steady in Asian trading on Wednesday following a sharp decline in the previous session, as reduced geopolitical tensions and a stronger U.S. dollar curbed safe-haven demand, with investors looking ahead to new signals on the Federal Reserve’s policy direction.
Spot gold rose 0.1% to $4,884.16 an ounce as of 20:24 ET (01:24 GMT), while U.S. gold futures slipped 0.1% to $4,899.91.
Trading activity in Asia remained subdued due to Lunar New Year holidays across several key regional markets, keeping price movements limited.
The precious metal had fallen more than 2% on Tuesday amid improved risk sentiment following indications of progress in U.S.–Iran negotiations. Both sides reportedly reached an understanding on key “guiding principles,” boosting optimism for a diplomatic breakthrough and reducing demand for bullion as a safe-haven asset.
Gold’s earlier losses were amplified by a firmer dollar, which makes the metal costlier for holders of other currencies, as well as diminishing expectations of imminent U.S. rate cuts. The U.S. Dollar Index rose 0.1% during Asian hours after gaining 0.3% in the previous session.
Investors remained cautious ahead of the release of minutes from the Federal Reserve’s January meeting, due later in the day, which may provide further clarity on the timing and extent of potential policy easing.
Attention is also focused on Friday’s U.S. personal consumption expenditures (PCE) price index for December—the Fed’s preferred measure of inflation—which could significantly influence rate expectations.
Generally, higher interest rates tend to pressure non-yielding assets like gold, while expectations of monetary easing typically lend support to prices.
Gold starts the week under pressure, weighed down by a slight rebound in the US Dollar and improved market sentiment. Even so, ongoing geopolitical tensions—particularly ahead of the upcoming US-Iran talks—could offer support to the safe-haven metal. At the same time, expectations that the Federal Reserve will deliver additional rate cuts may restrain the Dollar and help cushion gold’s downside.
During early European trading on Monday, Gold (XAU/USD) stays subdued but has bounced off its intraday low to hover near the key $5,000 psychological level. A mix of supportive factors suggests caution for traders considering aggressive short positions or anticipating a deeper decline.
A modest uptick in the USD, coupled with a broadly upbeat risk mood, is putting mild pressure on bullion. However, geopolitical risks remain elevated ahead of the second round of US-Iran nuclear negotiations. The US has deployed another aircraft carrier to the region and signaled readiness for a prolonged military response if talks collapse. In turn, Iran’s Revolutionary Guards have warned of retaliation against US bases in the event of strikes. These tensions could underpin gold prices.
Meanwhile, strong and sustained USD gains appear limited due to dovish Fed expectations, which tend to favor the non-yielding precious metal. Although last week’s robust Nonfarm Payrolls report initially supported the Dollar, softer US inflation data released Friday revived bets that the Fed could begin cutting rates as soon as June. Headline CPI rose 0.2% and core CPI increased 0.3% in the latest reading, reinforcing expectations of further policy easing and potentially limiting gold’s losses.
Additionally, lighter trading conditions due to the US Presidents Day holiday may discourage traders from taking bold directional positions in XAU/USD. Upcoming remarks from Fed officials could influence both the Dollar and gold, but attention will center on Wednesday’s FOMC meeting minutes for clearer signals on the rate-cut outlook. Later in the week, global flash PMI data on Friday may provide fresh trading opportunities.
XAU/USD 1-hour chart
Gold is rejected at the 100-hour SMA resistance.
XAU/USD’s failure to sustain gains above the 100-period Simple Moving Average (SMA) from Friday’s rally continues to favor the bears. The pair remains below this downward-sloping indicator near $5,028.40, which is limiting upside attempts and maintaining a negative intraday outlook. Meanwhile, the MACD has slipped beneath its signal line into negative territory, with an expanding bearish histogram highlighting growing downside momentum. The RSI sits at 45, in neutral territory but trending lower, in line with the softer bias.
As long as XAU/USD trades below the falling 100-period SMA, pressure is likely to persist, with the negative MACD setup pointing to ongoing seller dominance. A stronger recovery would require the MACD to cross back above its signal line and the RSI to move above 50, a shift that would reduce bearish pressure and open the door for a corrective rebound.
The US Dollar (USD) posted notable weekly losses, briefly rebounding after stronger-than-expected US jobs data showed 130K new positions added in January and the Unemployment Rate dipping to 4.3% from 4.4%. However, softer January CPI figures pressured the currency.
The US Dollar Index (DXY) slipped to around 96.80 from 97.15 highs as weak inflation data boosted expectations of a Federal Reserve rate cut later this year. Attention now turns to Friday’s release of the December Personal Consumption Expenditures (PCE) report, the Fed’s preferred inflation measure.
EUR/USD hovers around 1.1880, erasing earlier losses after Eurozone flash Q4 GDP came in at 1.4% YoY, above the 1.3% forecast. Focus next week includes the Eurogroup Meeting and December Industrial Production on Monday, followed by the EcoFin Meeting and February Eurozone and German ZEW Surveys on Tuesday.
AUD/USD trades near 0.7080, close to a three-year peak, supported by the hawkish stance of the Reserve Bank of Australia. Upcoming data include NAB Business Confidence and the Wage Price Index on Wednesday, then Australian jobs figures and the February flash S&P Global Composite PMI on Thursday.
USD/CAD sits near 1.3600, recovering nearly half of its weekly losses after US inflation data. Markets will watch Canada’s December Retail Sales on Friday.
USD/JPY trades around 152.80 following a sharp sell-off triggered by the election victory of Sanae Takaichi, which raised fiscal policy concerns. Japan’s National CPI is due on Thursday.
GBP/USD holds near 1.3650, with UK Producer Price Index and Retail Price Index data due Wednesday, and Retail Sales scheduled for Friday.
Gold trades around $5,038, rebounding from Thursday’s drop but still below January’s record high of $5,598, as easing geopolitical tensions push investors toward riskier assets.
Looking ahead to the economic outlook: Key voices take center stage.
Saturday, February 14
Christine Lagarde (ECB President)
Sunday, February 15
Christine Lagarde (ECB President)
Monday, February 16
Michelle Bowman (Fed)
Joachim Nagel (ECB)
Tuesday, February 17
José Luis Escrivá (ECB)
Michael Barr (Fed)
Mary Daly (Fed)
Wednesday, February 18
Piero Cipollone (ECB)
Isabel Schnabel (ECB)
Michelle Bowman (Fed)
Thursday, February 19
Piero Cipollone (ECB)
Luis de Guindos (ECB)
Raphael Bostic (Fed)
Michelle Bowman (Fed)
Neel Kashkari (Fed)
Christian Hawkesby (rbnz official)
Friday, February 20
Christine Lagarde (ECB President)
Raphael Bostic (Fed)
Central bank meetings and upcoming economic data releases are set to guide the next moves in monetary policy.
Sunday, February 15
Japan flash Q4 GDP
Tuesday, February 17
Reserve Bank of Australia (RBA) Meeting Minutes
Germany January Harmonized Index of Consumer Prices (HICP)
UK January Claimant Count Change
UK December Employment Change
UK December ILO Unemployment Rate
Canada January CPI
Wednesday, February 18
Reserve Bank of New Zealand (RBNZ) Interest Rate Decision
UK January CPI
Federal Open Market Committee (FOMC) Minutes
Thursday, February 19
Australia January Employment Change
Australia Unemployment Rate
Friday, February 20
UK January Retail Sales
Germany February flash HCOB Composite PMIs
Eurozone PMIs
UK flash February S&P Global PMIs
US December Core Personal Consumption Expenditures (PCE)
Gold drew renewed buying interest after sliding to a weekly low in the previous session. Expectations that the Federal Reserve may adopt a more dovish stance continue to weigh on the US Dollar, offering support to the precious metal. Market participants are now awaiting the latest US consumer inflation data for fresh direction.
Gold (XAU/USD) has pulled back from near the $5,000 psychological level but maintains modest intraday gains heading into Friday’s European trading session. Investors are focused on the upcoming US CPI release, which is expected to provide clearer signals on the Fed’s future policy path. The outcome will likely influence short-term US Dollar dynamics and generate meaningful momentum for the non-yielding metal.
Earlier in the week, a stronger-than-expected US Nonfarm Payrolls report prompted traders to trim expectations for a March rate cut, helping the US Dollar Index (DXY) rebound from a two-week low and contributing to Gold’s pullback. Even so, markets continue to anticipate that the Fed could still deliver two rate cuts in 2026. Meanwhile, softer US Jobless Claims data has limited the Dollar’s upside.
According to the US Department of Labor, initial jobless claims declined to 227K for the week ending February 7, above the 222K forecast but below the previous week’s revised 232K. Continuing Claims rose to 1.862 million for the week ending January 31, underscoring ongoing labor market softness seen over the past year. This underlying weakness provides support for Gold while tempering the Dollar’s strength.
Additionally, a deterioration in global risk sentiment, reflected in broadly weaker equity markets, has boosted demand for safe-haven assets like Gold. However, it remains uncertain whether XAU/USD can extend its gains, as traders may prefer to stay cautious until the key US CPI report is released before initiating fresh positions.
XAU/USD 1-hour chart
Gold’s Mixed Technical Signals Call for Caution
Gold’s technical picture remains conflicted, suggesting aggressive traders should proceed carefully. The overnight break below the weekly trading range initially appeared to give bears the upper hand. However, the absence of sustained follow-through selling and the metal’s resilience beneath the $4,900 level argue against firmly committing to a bearish outlook.
On the momentum front, the MACD has crossed above its Signal line near the zero mark, with the histogram turning positive—an indication that bullish momentum may be gradually building. This shift hints at a possible near-term recovery in price action.
At the same time, the RSI has rebounded from oversold territory and currently sits at 44.72, a neutral reading. While this supports a tentative intraday bounce, the RSI remaining below the 50 threshold suggests that upside attempts could face resistance.
Should the MACD slip back below the Signal line and fall under zero, bearish pressure would likely re-emerge, potentially extending the current consolidation phase. For now, momentum leans modestly supportive as long as the MACD holds above zero and the positive histogram continues to expand. Conversely, a narrowing histogram would signal waning momentum and caution against overconfidence in further gains.
Gold held steady in early Asian trading on Friday after slipping below key technical levels amid growing uncertainty about the outlook for U.S. interest rates, with investors now awaiting upcoming inflation data for clearer direction.
Silver also stabilized after shedding roughly 10% in the previous session, though metals remained vulnerable following a sharp selloff earlier in the month.
Persistent doubts about the timing of future U.S. rate cuts continued to pressure precious metals, particularly after January data signaled resilience in the labor market. The U.S. dollar rebounded from weekly lows following Wednesday’s stronger-than-expected nonfarm payrolls report.
Spot gold edged down 0.1% to $4,915.40 an ounce by 18:31 ET (23:31 GMT), while April gold futures slipped 0.1% to $4,937.60 per ounce. In the prior session, spot prices had dropped more than 3%.
Spot silver was little changed at $75.060 per ounce, while platinum recovered to trade back above $2,000 per ounce after steep losses a day earlier.
Thursday’s decline effectively wiped out most of this week’s gains for gold and other precious metals, putting the yellow metal on track for a third consecutive weekly loss.
Markets have struggled to find direction since a late-January flash crash, with interest rate uncertainty remaining a central headwind. Gold’s retreat from recent record highs was initially sparked by U.S. President Donald Trump’s nomination of Kevin Warsh as the next Federal Reserve Chair, a choice seen as less dovish.
The robust January jobs report reinforced expectations of fewer rate cuts ahead, while sharp price volatility has also weakened metals’ appeal as safe-haven assets.
Attention now turns to the January U.S. consumer price index data due later Friday, which could offer further insight into the trajectory of the world’s largest economy. Inflation and labor market conditions remain the Federal Reserve’s primary factors in setting monetary policy.
Gold and silver prices declined during Asian trading on Thursday after stronger-than-expected U.S. payrolls data dampened expectations for deeper Federal Reserve rate cuts, though losses were cushioned by ongoing safe-haven demand.
Precious metals largely held onto this week’s gains, supported by continued dollar weakness and elevated tensions between the U.S. and Iran, which kept demand for safe assets intact.
Spot gold dropped 0.7% to $5,051.26 per ounce, while April gold futures slipped 0.5% to $5,072.04/oz as of 01:36 ET (06:36 GMT). Spot silver fell 1.3% to $83.2505/oz, and platinum declined 1.6% to $2,107.30/oz.
Gold pressured as dollar rebounds on solid payrolls data
Gold came under pressure after January’s U.S. nonfarm payrolls report, released Wednesday, exceeded expectations. The stronger labor market reading reduced bets that slowing employment would prompt additional rate cuts from the Fed.
According to CME FedWatch, markets are now assigning a 94.1% probability that the Fed will keep rates unchanged in March, and a 78% chance of no change in April.
The upbeat data also triggered a rebound in the U.S. dollar overnight, weighing on metal prices. However, the dollar stabilized in Asian trade and remains slightly lower for the week, partly due to strength in the Japanese yen.
OCBC analysts noted that a sustained dollar recovery would require further evidence of resilience in the U.S. economy — a scenario that could still offer some support to gold.
“Structural headwinds — including uncertainty around Fed leadership succession and broader U.S. policy risks — suggest the dollar will need additional upside data surprises to maintain any rebound,” OCBC analysts said.
Even so, precious metals remained volatile after sharp swings over the past week amid heightened uncertainty surrounding U.S. monetary policy.
U.S. inflation data and Iran tensions in focus
Investors are awaiting further signals on the U.S. economy, particularly January consumer price index data due Friday. Inflation and labor market conditions remain the Fed’s primary considerations for rate decisions. Weekly jobless claims figures are also scheduled for release later Thursday.
Safe-haven demand continued to lend support to metals amid ongoing U.S.–Iran tensions. Although both sides reported some progress in nuclear talks over the weekend, Washington was reportedly preparing to send a second aircraft carrier to the Middle East.
President Donald Trump also urged Tehran to accept a deal with Washington and met Israeli President Benjamin Netanyahu on Wednesday, underscoring persistent geopolitical risks.
Gold rebounds and trims some of the modest losses recorded in the previous session.
Ongoing weakness in the US Dollar, driven by expectations surrounding the Federal Reserve, continues to support the metal.
However, positive market sentiment could limit further gains as investors wait for the upcoming US Nonfarm Payrolls (NFP) report.
Gold (XAU/USD) maintains modest intraday gains above the $5,050 mark as it heads into Wednesday’s European session. Expectations of additional interest rate cuts by the US Federal Reserve (Fed) have pushed the US Dollar (USD) to a near two-week low, providing support for the non-yielding precious metal. However, prevailing risk-on sentiment could limit further upside for the safe-haven asset. Traders may also prefer to stay on the sidelines ahead of the US Nonfarm Payrolls (NFP) report before committing to fresh bullish positions.
On Tuesday, the US Census Bureau reported that Retail Sales were flat in December, following a 0.6% increase in November and falling short of the 0.4% growth forecast. Combined with signs of cooling in the US labor market, the data has led economists to lower their fourth-quarter growth projections, reinforcing expectations of further Fed rate cuts. Money markets are currently pricing in around 58 basis points of easing in 2026, a factor that continues to weigh on the Greenback.
At the same time, worries over the Federal Reserve’s independence resurfaced after US President Donald Trump stated on Saturday that he could take legal action against his newly nominated Fed Chair, Kevin Warsh, if interest rates were not reduced. Adding to the debate, Fed Governor Stephan Miran remarked that complete central bank independence is unattainable. These developments overshadowed hawkish remarks from regional Fed Presidents Lorie Logan and Beth Hammack and offered little support to the US Dollar. As a result, Gold appears to retain a favorable upward bias.
Dallas Fed President Lorie Logan noted that the labor market is stabilizing and downside risks are fading, while inflation has remained above the 2% target for nearly five years. She added that current monetary policy may be close to neutral, exerting limited restraint on the economy. Similarly, Cleveland Fed President Beth Hammack said the policy rate is near neutral territory, putting the Fed in a strong position to assess incoming data. Hammack also suggested that rates could remain unchanged “for quite some time,” given persistently elevated inflation and ongoing tariff-related uncertainties.
Despite this supportive backdrop, XAU/USD bulls appear cautious and may prefer to await the US monthly employment report for clearer signals on the Fed’s policy path. The outcome will likely shape near-term US Dollar movements and provide fresh direction for Gold. Meanwhile, improved risk sentiment and indications of easing tensions in the Middle East could temper demand for the safe-haven metal. Therefore, waiting for solid follow-through buying may be prudent before anticipating further gains.
Gold must break above the $5,090 resistance area to reinforce the outlook for further upside.
From a technical standpoint, XAU/USD demonstrated resilience below the 200-period Simple Moving Average (SMA) on the 4-hour chart earlier this month. The SMA continues to slope upward and remains comfortably beneath the current price, reinforcing the broader bullish bias. As long as the pair holds above this level, the overall trajectory remains skewed to the upside.
That said, momentum indicators point to some consolidation. The Moving Average Convergence Divergence (MACD) remains above the Signal line and in positive territory, though the narrowing histogram indicates waning upward momentum. Meanwhile, the Relative Strength Index (RSI) hovers around 56, reflecting neutral-to-slightly bullish conditions and supporting a consolidative outlook. This suggests it may be wise to wait for a decisive move above the $5,090 resistance level before targeting additional gains.
A continued contraction in the MACD histogram could signal a pause or range-bound trading, whereas a renewed expansion would indicate a resurgence in bullish momentum. Additionally, with the RSI holding above 50, the underlying bias remains constructive; a climb toward 60 would further strengthen upside prospects. Overall, the technical setup favors buying on modest pullbacks while momentum stabilizes.
The author argues that fiat currency is increasingly unstable due to excessive government debt and geopolitical tensions, while gold represents enduring monetary strength. Historically, there have been only four major rallies in fiat currencies over the past 50 years, each weaker than the last, suggesting a long-term decline in confidence.
Concerns are growing as the U.S. continues expanding debt while using its currency as a geopolitical tool, prompting individuals and institutions to shift toward gold. Although some investors missed earlier buying opportunities around $4,400, the current ascending triangle pattern on gold’s chart suggests further upside potential, with a projected target near $5,900.
U.S. stock valuations are extremely elevated, while government deficit spending relative to GDP is already at levels typically seen during severe crises. If deficits remain this high during strong markets and under an administration that claims fiscal discipline, the concern is that a future crisis—combined with less restraint—could drive the deficit-to-GDP ratio even higher.
In short, individuals should prepare not only for a potential U.S. recession but possibly a stagflationary downturn, with the suggested strategy being to strengthen personal savings through holdings in gold and silver.
On the geopolitical front, rising tensions are viewed as supportive for gold. One concern is the idea of pressuring Taiwan to shift advanced semiconductor production to the U.S., potentially through heavy tariffs on Taiwanese-made chips. Such actions could increase inflation and strain U.S.–Taiwan relations, possibly reshaping regional dynamics with China. Overall, the situation appears increasingly unstable—conditions that historically tend to benefit gold as a safe-haven asset.
In Cuba, worsening economic conditions—such as public transportation disruptions—reflect deeper structural problems, with little sign of meaningful reform. If instability escalates, it could increase global uncertainty, a backdrop that typically supports higher gold prices.
The US government’s disturbing plot to elevate election denier, admirer of torture, and destroyer of civic life Delcy Rodríguez has already taken another troubling turn. This nightmare is just one of many geopolitical mechanisms propping up gold interests. Could it get even more absurd? In theory, yes — if María Corina Machado were arrested next. Would President Trump then flaunt a Nobel Prize she once held to his followers obsessed with fiat currency and oil, while she languished in prison under Rodríguez’s brutal treatment?
In such a scenario, Venezuela could spiral into civil war, with chaos on a scale that might rival what we’re seeing in Iran.
So, do you have any gold?
What about silver? Silver also looks very strong. A glance at the chart highlights the 14,7,7 Stochastics oscillator at the bottom.
It has moved into the buy zone — only the third time this has happened since August. A rally back toward the $122 highs appears entirely achievable.
Silver reached solid support near $70 just as gold touched $4,400. I encouraged investors to anchor their purchases to gold’s powerful technical performance. Those who stepped in at that point are being rewarded, with silver already climbing back above $80 this morning — and the opportunity may still not be gone for those considering entry.
And the miners? Take a look at the daily CDNX “Jump in the Pool” chart. The Stochastics indicator is signaling strong momentum, and even if prices retreat toward support around 825, that would likely present another attractive buying opportunity.
The long-term chart looks remarkable. A massive inverse head-and-shoulders pattern appears to be forming. Notice the blue circle on the left side of the chart — a pause around the neckline area now would simply enhance the symmetry between the right and left sides. For enthusiastic junior mining stock investors, the outlook suggests the potential for years of rising prices ahead.
What about the senior miners — are they worth buying as well? Looking at the long-term GDX versus gold chart, a large inverse head-and-shoulders pattern is taking shape. The formation closely mirrors what’s developing on the CDNX versus fiat chart.
A glance at the daily chart suggests there may be some consolidation over the next couple of weeks. However, Stochastics has returned to levels last seen in November. Considering the alarming deficit-to-GDP dynamics, ongoing geopolitical turmoil, and the shifting global power landscape, I’d argue that senior gold stock investors worldwide should be ready to step up and take action.
Gold and silver edged higher in early Asian trading Wednesday after weak U.S. retail sales fueled expectations of a slowing economy, with investors awaiting payrolls data for clearer direction.
Despite the gains, precious metals remained volatile after retreating from record highs in late January, and have struggled to rebound. A softer dollar and weak U.S. data provided only modest support, while Middle East tensions sustained some safe-haven demand.
Spot gold rose 0.3% to $5,038.21 an ounce and April futures gained 0.6% to $5,061.45, still roughly $600 below recent peaks. Spot silver climbed 0.9% to $81.5135, and platinum added 0.9% to $2,105.86.
Metals rise following weak U.S. retail sales data.
Precious metals posted modest losses on Tuesday before rebounding Wednesday after December U.S. retail sales came in weaker than expected.
The softer data signaled cooling consumer spending amid persistent inflation and labor market pressures, raising concerns about the economic outlook. Expectations that the Federal Reserve may cut interest rates further this year weighed on Treasury yields and kept the dollar subdued, lending support to metal prices.
Investors are now focused on the upcoming nonfarm payrolls report for clearer signals on the economy. Signs of continued labor market weakness could strengthen bets on rate cuts, which typically favor non-yielding assets like gold.
However, uncertainty over U.S. monetary policy persists, particularly after President Donald Trump nominated Kevin Warsh as the next Fed chair. Warsh is seen as less dovish, a perception that has pressured metal markets since late January.
Gold prices slipped in early Asian trading on Tuesday, pulling back from strong gains in the previous session as investors turned cautious ahead of a series of important U.S. economic data releases this week. Silver and platinum also moved lower, despite some limited support from an overnight dip in the dollar, which later showed signs of recovery in Asian hours.
Spot gold declined 0.8% to $5,016.28 an ounce, while April gold futures fell 0.8% to $5,041.60 an ounce. Spot silver dropped 2.4% to $81.29 an ounce, and spot platinum slid 2% to $2,081.71 an ounce.
Precious metals have seen sharp volatility over the past week, with profit-taking and stretched positioning driving prices down from record highs. Markets have also been unsettled by uncertainty around U.S. monetary policy, particularly ahead of a potential leadership change at the Federal Reserve.
Attention this week is firmly on key U.S. economic indicators for signals on growth and the future path of interest rates. January nonfarm payrolls data is due on Wednesday, followed by consumer price index inflation data on Friday, both of which are critical inputs for the Fed given its focus on inflation and labor market conditions.
Investors are also assessing the potential policy direction under Kevin Warsh, President Donald Trump’s nominee to succeed Jerome Powell as Fed chair when Powell’s term ends in May. Warsh is widely seen as less dovish, and his nomination triggered steep selloffs in metals markets that have yet to be fully reversed, with gold plunging from near-record highs around $5,600 an ounce and silver falling from above $120 an ounce.
Gold futures remain in a well-defined bullish consolidation, with prices oscillating around the VC PMI daily mean near 4,982. The market’s continued defense of the Buy-1 level at 4,768 and Buy-2 at 4,556 reinforces the view that institutional demand is emerging on pullbacks. This price action aligns with the core VC PMI mean-reversion framework: sustained trade above the mean increases the probability of a move toward the Sell-1 and Sell-2 targets.
Within the VC PMI framework, the weekly mean around 4,839 has acted as the key pivot for directional bias. As long as price action remains above this level, bullish momentum is sustained, with upside projections toward the daily Sell-1 resistance at 5,094 and Sell-2 at 5,208. These zones mark statistically extreme levels where the probability of mean reversion typically exceeds 90% under normal market conditions. A decisive breakout and close above Sell-2 would indicate a transition into a higher-volatility regime, opening the door to the weekly Sell-1 level at 5,255 and potentially the weekly Sell-2 target near 5,530.
Square-of-9 geometry closely mirrors the current price structure, highlighting that the recent peak near 5,113 aligns with a harmonic resistance angle projected from prior cycle lows around 4,423. This geometric relationship suggests gold is completing a rotational phase ahead of its next directional move. When prices oscillate between key geometric angles, it often signals energy compression that ultimately resolves through a momentum expansion.
Time-cycle analysis into mid-February points to a critical inflection window. With prices consolidating above the mean, the higher-probability outcome favors continuation toward upper resistance bands. Conversely, a failure to hold the 4,982 pivot would likely prompt a corrective rotation toward 4,768 and potentially 4,556, levels where longer-term accumulation demand is expected to reappear.
The combined use of VC PMI price levels, time-cycle analysis, and Square-of-9 geometry creates a multidimensional framework for identifying high-probability inflection points. Rather than forecasting direction, traders should concentrate on price reactions at the mean and statistically extreme bands. Directional bias is ultimately confirmed by the market itself, once price closes decisively above or below these levels.
HSBC Asset Management said gold and silver posted dramatic price swings in 2025, fueled by geopolitical risks and worries about the Federal Reserve’s independence, before evolving into a retail-driven speculative phase. Analysts caution that leveraged selling could increase their correlation with equities, but note that central bank de-dollarisation efforts and crisis-related demand continue to support the long-term structural case for precious metals.
Safe-haven demand weighed against speculative flows
“This year’s moves in gold and silver have been extraordinary. Sparked by geopolitical tensions and concerns over the Federal Reserve’s independence, the 2025 rally morphed into a retail-driven speculative surge, making a correction increasingly probable.
So where does that leave investors who rely on gold as a portfolio diversifier? Although retail inflows lifted returns, they also brought equity-like volatility — at odds with gold’s traditional safe-haven role.
That said, recent turbulence shows that no safe haven is perfect, reinforcing the case for ‘diversifying the diversifiers’: taking an active, multi-asset approach to seek uncorrelated returns across a wide range of assets.”
Gold is consolidating recent gains around the $5,000 level, with buyers gradually building momentum for a potential sustained uptrend as a pivotal week gets underway. Market attention is firmly on the delayed U.S. Nonfarm Payrolls report due Wednesday and the Consumer Price Index data scheduled for release on Friday.
Fundamental Analysis
As the new, data-heavy week begins, dovish sentiment surrounding the U.S. Federal Reserve is setting the tone, with renewed reflation trades helping gold extend Friday’s strong rebound from the $4,650 area.
After last week’s weak U.S. labor data, markets have continued to price in the first Fed interest-rate cut as early as June, even as investors remain divided over the likely policy stance of Fed chair nominee Kevin Warsh.
Risk appetite has also been supported by a resurgence in reflationary trades, sparked by Japan’s ruling Liberal Democratic Party securing a decisive majority in snap elections. The outcome has reinforced expectations of debt-funded fiscal stimulus, further underpinning the broader reflation theme.
Adding to gold’s support, the U.S. dollar has softened amid renewed weakness in USD/JPY following strong verbal intervention from Japanese authorities. The resulting dollar pressure has helped keep the precious metal buoyant.
That said, gold’s recovery momentum appears somewhat constrained as overall risk sentiment remains upbeat on expectations of expansionary fiscal policies in Japan. Japanese equity markets have surged to record highs, lifting broader Asian stocks and reducing demand for traditional safe havens.
Looking ahead, it remains uncertain whether gold can sustain its rebound, as traders may grow more cautious and adjust positions ahead of Wednesday’s closely watched U.S. January jobs report.
XAU/USD Technical Overview
On the daily chart, XAU/USD is trading around $5,023.88, with the technical structure firmly tilted to the upside. The 21-day Simple Moving Average (SMA) has crossed above the 50-, 100-, and 200-day SMAs, and all are sloping higher, highlighting a strong and well-established bullish trend. Prices remain comfortably above these moving averages, keeping buyers in control.
Momentum indicators also support the constructive outlook. The Relative Strength Index (RSI) is at 57.72, holding above the neutral 50 level and well below overbought territory, suggesting steady positive momentum without signs of exhaustion. Immediate dynamic support is provided by the rising 21-day SMA at $4,873.06.
This bullish alignment implies that any pullbacks are likely to be limited as long as prices stay above the faster moving average. A daily close below the 21-day SMA would signal a deeper corrective move, potentially exposing the 50-day SMA near $4,563.97. For now, the continued rise in medium- and long-term SMAs favors a buy-on-dips approach and keeps the broader trend firmly pointed higher.
Gold prices climbed in Asian trading on Monday, with silver also advancing after precious metal markets experienced sharp volatility last week amid weaker safe-haven demand, profit-taking, and heightened uncertainty over U.S. monetary policy.
This week’s focus is on a series of key U.S. economic releases—most notably nonfarm payrolls and consumer price index inflation data—which are expected to offer fresh signals on the outlook for the world’s largest economy. Demand for haven assets eased as the United States and Iran showed signs of progress in weekend talks, with both sides agreeing to continue negotiations over Tehran’s nuclear program.
Spot gold rose 0.7% to $4,996.47 an ounce by 20:49 ET (01:49 GMT), after briefly touching an intraday high of $5,046.79. April gold futures gained 0.8% to $5,016.21 an ounce.
Spot silver jumped 3.3% to $80.5330 an ounce, extending its rebound from lows near $60 an ounce seen last week. Platinum underperformed, slipping 2.3% to $2,068.45 an ounce.
Precious metals saw sharp swings last week as investors weighed the outlook for U.S. monetary policy under President Donald Trump’s nominee for Federal Reserve chair, Kevin Warsh. His nomination boosted the dollar, triggering broad selling across metal markets as traders also took profits after strong recent gains in gold and silver.
So far in 2026, gold and silver remain up about 15% and 5%, respectively, despite both metals retreating sharply from record highs reached in early February.
Macquarie has updated its 2026 outlook for gold and silver, pointing to extreme volatility and recent geopolitical and policy-driven shocks as the main catalysts.
Strategist Peter Taylor noted that the bank had previously flagged the risk of gold reaching $5,000 per ounce amid concerns surrounding the Federal Reserve chair—a scenario that ultimately materialized. He also warned that silver was vulnerable to a sharp pullback, given its tendency to gap lower.
Macquarie raised its average gold price forecast for the first quarter of 2026 to $4,590 per ounce from $4,300, while its second-quarter estimate was lifted to $4,300 from $4,200. The bank also increased its full-year 2026 gold forecast to $4,323 per ounce, up from $4,225.
For silver, the Q1 target was raised sharply to $75 from $55, with the 2026 average forecast increased to $62 from $57.
Taylor emphasized that market conditions in January were exceptionally volatile, citing events such as threats of a criminal indictment against the Fed chair by the U.S. Department of Justice, the arrest and extradition of Venezuela’s Maduro, renewed focus on Greenland alongside potential tariffs on some NATO countries, and a buildup of military forces around Iran.
He added that while commodities broadly delivered strong gains, price movements were often detached from underlying fundamentals.
“Overall, this resulted in one of the strongest monthly performances for the commodities complex in recent history,” Taylor said.
Macquarie said it is holding off on revising longer-term forecasts for gold and silver, pointing to the ongoing disconnect between fundamentals and the unusually high volatility in precious metals markets.
Gold futures are currently trading around 4,841.7, holding steady above the VC PMI daily Buy 1 level at 4,765 and the Buy 2 support at 4,640. This price action suggests the market has entered a well-defined mean-reversion accumulation zone. It reflects the natural interaction between price and time cycles, where markets extend into extreme areas before reverting toward equilibrium.
The VC PMI daily mean at 4,905 now acts as the key price magnet. A sustained close above this level would signal the return of bullish momentum, potentially paving the way for a move toward Sell 1 at 5,030 and Sell 2 at 5,170.
On the weekly timeframe, the VC PMI mean at 5,024 aligns closely with an upper resistance cluster and Square of 9 harmonic geometry. This confluence implies that once price establishes itself above the 4,905 mean, upside momentum could accelerate rapidly toward the 5,000–5,170 zone.
The Square of 9 framework suggests current price action is progressing through a harmonic relationship between time and price, with the next cycle window extending into mid-February. These cycle windows often mark potential inflection points, where volatility expands and directional conviction strengthens.
From a structural perspective, maintaining levels above 4,765 preserves the bullish accumulation framework and indicates that institutional demand continues to absorb selling pressure. The deeper support at 4,640 marks the lower extreme of the daily cycle. A decisive break below that level would suggest the market is not yet ready to complete its bullish phase and could prompt a retracement toward lower weekly support zones.
However, as long as price holds above the 4,640–4,765 support zone, the odds continue to favor a mean-reversion advance toward the 5,030 and 5,170 upside targets.
By integrating VC PMI price levels, time cycles, and Square of 9 geometry, this framework offers a structured way to identify high-probability turning points. Markets operate in recurring phases of expansion and contraction, and these tools are designed to quantify those cycles with consistency, discipline, and objectivity.
Assessing the daily charts for gold and silver futures against a backdrop of rising trader anxiety, it is clear that the outcome of the meeting between U.S. and Iranian diplomats could soon determine the next directional move once markets receive clearer signals.
Volatility in both gold and silver futures has surged, leaving prices highly sensitive to the meeting’s outcome. Gold futures opened at $4,722.30, dipped to an intraday low of $4,671.74, and then rallied to trade near the session high around $4,907—just below immediate resistance at $4,938.55. This price action reflects mounting concern as U.S.–Iran talks begin amid fears of a potential direct conflict.
Despite the heightened tension, the situation remains unresolved. The U.S. is reportedly pressing Iran to freeze its nuclear program, dismantle its uranium stockpile, and expand discussions to include ballistic missiles, regional proxy support, and human rights issues. Iran, however, has stated that talks will be limited strictly to its nuclear program, and it remains unclear whether these fundamental differences have been bridged.
In recent weeks, President Donald Trump has warned of military action if a deal is not reached, while the U.S. has deployed thousands of troops and significant naval and air assets to the region. Iran has responded with threats of retaliation, including strikes on U.S. military targets in the Middle East and Israel.
This marks the first direct engagement between U.S. and Iranian officials since last June’s Israel–Iran conflict, during which U.S. forces struck Iran’s three primary nuclear facilities. Iran has since claimed that its uranium enrichment activities ceased following those attacks.
Meanwhile, precious metals have endured an extended selloff since last week. Initial pressure stemmed from President Trump’s nomination of Kevin Warsh as the next Federal Reserve chair, a move interpreted as less dovish and supportive of a stronger U.S. dollar. The dollar is now on track for its strongest weekly performance since early October, with soft labor data doing little to halt its advance.
Looking ahead, any indication that talks may ease tensions between the U.S. and Iran could spark renewed selling in gold and silver, even though both futures have already rebounded modestly from their intraday lows. At this stage, dissecting technical rebounds or exhaustion signals may be premature. Instead, the focus remains squarely on the diplomatic outcome and whether it ultimately de-escalates the situation—or deepens existing tensions.
Looking at the current positioning of the spot gold–silver ratio, today’s session saw it test an intraday high of 72.77 and a low of 65.10, with the ratio currently trading around 66.39. This movement suggests that gold and silver futures may revisit price levels last seen between December 1 and 16, 2025—when gold futures were trading in the $4,207 to $4,340 range and silver futures were between $57 and $65.
Gold futures are currently trading above the key 50-EMA support near $4,580, while remaining capped below the immediate 9-EMA resistance around $4,885, after successfully holding above the short-term 20-EMA support at approximately $4,824.
Meanwhile, silver futures are holding above the key 100-EMA support near $62.692, but continue to trade below the immediate resistance at the 50-EMA around $74.252.
In summary, any constructive outcome from the meeting could prompt renewed selling pressure across both precious metals, while renewed disagreement between the two countries may spark a bout of buying. However, any upside could remain vulnerable to fresh selling, as follow-up commentary from the U.S. President after the meeting is likely to play a decisive role in shaping market sentiment.
Gold and silver prices declined further in early Asian trading on Friday, extending steep losses from the previous session as profit-taking, easing geopolitical risks, and a stronger U.S. dollar continued to weigh on the metals complex. Silver remained the weakest performer after plunging around 15% on Thursday, while gold was trading nearly $1,000 per ounce below the record high reached last week.
Spot gold slipped 0.6% to $4,751.13 an ounce by 19:56 ET (00:56 GMT), while April gold futures dropped 2.5% to $4,766.11. Spot silver fell 2.2% to $69.383 per ounce, although it stayed above Thursday’s lows near $63, while silver futures tumbled 8.1% to $70.378.
OCBC analysts noted that the $70–$90 range has emerged as a key stabilization zone for silver, warning that a sustained break below this level could open the door to a deeper correction toward the $58–$60 area. They added, however, that holding within this range could allow bullish momentum to rebuild over time.
Losses extended across the broader precious metals space, with spot platinum sliding 7.2% to $1,853.81 an ounce. Metal markets have been under sustained pressure since last week, initially triggered by U.S. President Donald Trump’s nomination of Kevin Warsh to succeed Jerome Powell as Federal Reserve chair. Warsh has been perceived as less dovish, fueling a rally in the dollar that has weighed heavily on metals.
The U.S. currency was on track for its strongest weekly performance since early October, with softer labor market data failing to curb its advance. Meanwhile, easing tensions between the U.S. and Iran also dampened safe-haven demand for gold and silver, as the two sides were set to hold talks in Oman later in the day.
Gold saw choppy price action during Thursday’s Asian session, oscillating within a roughly $200 range. Traders are now looking to the U.S. JOLTS Job Openings report and developments on the geopolitical front—particularly U.S.–Iran tensions—for clearer directional cues.
XAU/USD Technical Analysis
The 21-, 50-, 100- and 200-day SMAs are all sloping higher, with the 21-day positioned above the longer-term averages, highlighting a well-established bullish structure. Prices remain above these indicators, confirming that buyers retain control. Initial support is seen at the 21-day SMA near $4,827.45, followed by the 50-day SMA at $4,532.68. The 14-day RSI has eased to a neutral 52.58, suggesting momentum is consolidating after retreating from overbought levels.
The positive alignment of the moving averages favours a buy-on-dips approach while prices hold above the short-term average. A more pronounced correction would bring the 100-day SMA at $4,271.21 into focus, with the 200-day SMA at $3,821.77 reinforcing the broader uptrend. As long as the RSI remains above the 50 midpoint, the bullish bias stays intact, while a sustained break below it could signal scope for a deeper retracement.
Fundamental Analysis
Gold ended Wednesday little changed near $4,950 after choppy two-way trading. The metal initially rebounded sharply, testing the $5,100 area amid uncertainty surrounding the Federal Reserve’s future policy direction under Kevin Warsh, which weighed broadly on the U.S. dollar.
Renewed geopolitical tensions in the Middle East and between Russia and Ukraine also lent support to gold prices, alongside concerns about potential economic data disruptions stemming from the U.S. partial government shutdown that concluded on Tuesday.
Sentiment shifted during the U.S. session after the ISM Services PMI signalled firmer inflation pressures, prompting a rebound in the dollar. At the same time, an intensifying tech-sector sell-off on Wall Street unsettled markets, driving demand for the greenback as a safe haven.
Additional USD strength came from renewed weakness in the Japanese yen amid rising fiscal and political concerns, which pushed USD/JPY higher and further supported the dollar.
The USD rebound triggered a sharp pullback in gold, although buyers stepped back in near the key $4,950 psychological support level.
Early Thursday, gold remains under pressure after once again failing above the $5,000 resistance zone. The U.S. dollar continues to advance, hitting fresh two-week highs against its major peers as risk sentiment deteriorates amid a global technology sell-off.
The decline in global data analytics, professional services, and software stocks followed Anthropic’s launch of plug-ins for its Claude Cowork agent, which raised fresh concerns about AI-driven disruption across these industries, according to Reuters.
Looking ahead, the delayed U.S. JOLTS Job Openings report could offer gold some relief, particularly if it reinforces expectations for two Federal Reserve rate cuts this year. Conversely, an extended sell-off in the Japanese yen could spark another wave of heavy selling pressure in gold.
Gold prices gave up early gains and declined during Asian trading on Thursday, pressured by a firmer U.S. dollar as investors positioned ahead of major central bank meetings and key U.S. labor market data. Reduced safe-haven demand also weighed on bullion after the U.S. and Iran confirmed plans to hold talks on Friday, easing fears of an imminent military escalation in the Middle East.
Spot gold slid 1.1% to $4,912.26 an ounce by 21:17 ET (02:17 GMT), while April gold futures fell 0.4% to $4,929.25 an ounce. Prices had climbed as high as $5,092.31 an ounce on Wednesday before surrendering most of those gains and slipping back below the $5,000 level by the session’s close.
The pullback came as diplomatic developments between Washington and Tehran helped calm geopolitical concerns. At the same time, a stronger dollar weighed on precious metals, with traders favoring the greenback ahead of interest rate decisions from the Bank of England and the European Central Bank, both scheduled for Thursday.
Additional support for the dollar came from anticipation of U.S. nonfarm payrolls data due on Friday, which could influence expectations for the Federal Reserve’s interest rate path. The greenback also extended gains from last week following President Donald Trump’s nomination of Kevin Warsh as the next Fed chair. Warsh is widely seen as a less dovish candidate, potentially signaling a tighter monetary stance even as rates decline.
Other precious metals also retreated after a brief rebound earlier in the week. Spot silver plunged 6.9% to $82.3130 an ounce after rallying nearly 6% in the previous session. While silver continues to benefit from its dual role as an industrial and precious metal and has significantly outperformed in recent months, it has faced sharp losses over the past week amid profit-taking and dollar strength.
Spot platinum fell 3% to $2,167.59 an ounce, while benchmark copper futures on the London Metal Exchange slipped 0.6% to $12,986 per tonne.
The mainstream narrative claims that a new Fed chair will safeguard the central bank’s independence from U.S. government influence—and that this alone justifies a $1,200/oz drop in gold and a $50 collapse in silver.
Put simply, that narrative is complete nonsense.
Fiat currency is best thought of as meme—or even junk—money, and despite its obvious flaws, it can still enjoy periodic rallies against what many see as the ultimate form of money: gold. These countertrend moves typically emerge during bouts of speculative excess, much like the frothy conditions that have dominated markets over the past couple of months.
From a fundamental standpoint, the gold bull market remains fully intact. Billions of gold-focused savers across China and India—along with a smaller group of informed Western investors—do not rely on central banks for validation. Their priority is building long-term wealth in gold, not accumulating ever more fiat currency and debt.
In the context of this broader bull cycle, it makes little difference who occupies the Fed chair. What matters is whether gold is attractively priced. When it is, prudent savers see it as an opportunity to accumulate more, regardless of short-term fiat-driven narratives.
The long-awaited “exciting buy zone” has finally come into play. Gold investors were encouraged to prepare for a meaningful dip into the $4,400 area, and that discounted opportunity has now materialized.
Sustainable wealth building is not about predicting prices, but about preparing for unexpected moves. This pullback unfolded over just a few days, leaving unprepared investors confused and still focused on guessing what happens next.
The key development now is that the $5,600 region has emerged as a major accumulation zone on any future pullback. Gold investors should already be positioning themselves to take advantage of that opportunity if and when it presents itself.
As for silver, the recent price sell-off was “super-sized,” driven by large and heavily leveraged bets against fiat currencies. That decline ultimately found support at the $70 buy zone, aligning perfectly with gold’s move into the $4,400 area.
Gold remains the undisputed leader of the precious metals complex. If silver investors and mining-stock enthusiasts take their cues from gold bullion, they position themselves to build substantial and durable wealth. The most likely near-term path for silver is a broad trading range between $70 and $120, followed by a powerful upside breakout that could propel prices toward the next target zone of $170–$200.
Over the longer term, silver has the potential to trade well above $1,000, largely because governments worldwide—both in the East and the West—continue to cling to fiat currencies and debt rather than returning to sound money anchored in gold.
A new 40-year inflation cycle began in 2020 and is unlikely to end until U.S. interest rates reach record highs. Unlike the cycle’s conclusion in 1980, however, elevated rates this time are unlikely to curb inflation, as it is being driven by ongoing government policies rather than purely monetary conditions.
Another perspective on U.S. rates: the incoming Fed chair is more likely to lean toward fiscal restraint on a debt-addicted U.S. government than to dispense easy-money policies of QE and rate cuts. Such a stance would have implications for long-term sovereign yields worldwide, and global money managers are likely to continue shifting capital into gold as a strategic response.
As interest rates continue their relentless climb in the years ahead, governments will inevitably confront their “Queen Gold maker.” They will be forced to begin replacing fragile fiat currencies with gold—or face effective financial ruin.
As for robots, they will simply become another cost burden for citizens already trapped in stagflation. As automation expands rapidly and robot populations eventually outnumber humans, workers will be left competing for a shrinking pool of jobs. Confronted with government-driven stagflation and lacking the protection of gold savings, many will endure severe financial stress—conditions that would be further worsened by a stock market crash.
As for the miners, they too presented exceptional buying opportunities when gold dipped to $4,400. The CDNX is now starting to emerge from a decade-long base, with price action that closely resembles gold’s breakout above $2,000. The initial rally may appear deceptive, but it is genuine—because this type of breakout unfolds as a process rather than a single, short-lived move. Notably, trading volumes across CDNX-listed stocks have surged, reinforcing the strength of the move.
While pockets of speculative excess briefly appeared in gold and silver bullion, such froth has been absent in the mining sector. Several silver explorers nearing production are projecting all-in sustaining costs well below $20, while gold explorers with large-scale projects are reporting AISC figures under $2,000. The conclusion is clear: junior gold and silver miners may represent the most undervalued segment in market history.
And what about the senior miners? The GDX versus gold chart is striking. Since the 2015 low—when the head of a massive inverse head-and-shoulders pattern began to form—I’ve been guiding investors through this setup. That structure points not merely to years, but potentially decades of strong performance for gold equities. In alignment with the CDNX-to-fiat picture, the breakout process is now underway.
The GDX daily chart delivers a real “wow factor.” The latest five-wave advance was remarkable—and signs suggest a new leg higher may already be unfolding. Notably, GDX’s recent pullback held well above its October highs, even as gold retraced back to that level. That kind of relative strength is a powerful signal that further upside is likely.
Even if gold consolidates between $5,600 and $4,400, and silver oscillates between $120 and $70, GDX and many of its underlying stocks could still push on to new highs. With 2026 marking the Chinese Year of the Fire Horse—symbolizing bold action and the fight for freedom—the question arises: are gold and silver equities poised for their own moment of liberation, breaking out to extraordinary new levels? The evidence suggests they are.
Gold prices climbed back above key technical levels during Asian trading on Wednesday, as renewed signs of tension between the United States and Iran fueled safe-haven demand for the precious metal.
Bullion extended its rebound from Tuesday after sharply recovering from recent losses, with dip-buying activity also remaining strong following last week’s more than $1,000 price sell-off.
Spot gold gained 2% to $5,048.37 per ounce by 21:00 ET (02:00 GMT), while April gold futures advanced 2.8% to $5,017.19 per ounce.
Other precious metals also moved higher on Wednesday, building on the rebound seen in the previous session. Spot silver gained 0.5% to $85.5245 per ounce, while spot platinum climbed 1.7% to $2,256.04 per ounce.
Iran concerns return ahead of upcoming nuclear talks
Renewed concerns over escalating tensions between the United States and Iran were a key catalyst for safe-haven demand, particularly after overnight reports that U.S. forces shot down an Iranian drone over the Arabian Sea.
In a separate development, Iranian gunboats were reported to have approached a U.S.-linked oil tanker in the Strait of Hormuz.
These incidents partially offset earlier statements from both Tehran and Washington indicating that talks would be held this Friday. News of the planned negotiations had previously eased market anxiety and weighed on safe-haven demand for gold.
Gold’s recent pullback was largely driven by expectations that U.S. President Donald Trump’s nominee for Federal Reserve chair, Kevin Warsh, may adopt a less dovish stance than markets had anticipated. This fueled a sharp rally in the U.S. dollar, pressuring precious metals, while gold also faced profit-taking after surging to a record high near $5,600 per ounce last week.
Despite the recent decline, gold remains up nearly 15% so far in 2026.
ANZ analysts noted that the core fundamentals underpinning gold’s strength—safe-haven demand, robust physical buying, and ongoing central bank purchases—remain firmly intact.
Although gold, silver, and platinum were the top-performing commodities over the past year, they came under pressure late last week.
Metals suffer a sharp pullback after hitting record highs.
Silver and gold suffered a sharp sell-off early Friday, dragging mining stocks and related ETFs lower. After an exceptional run in 2025, both metals have begun to give back part of their gains. Silver slid roughly 15%, falling back below the $100 level, while gold dropped about 7% and struggled to hold above $5,000. Weakness spread across the sector, with platinum and palladium also declining by around 14% and 12%, respectively.
Mining equities and ETFs came under heavy pressure. Producers such as Fresnillo, along with silver miners Endeavour and First Majestic, posted double-digit losses in pre-market trading. Silver-focused ETFs were hit even harder, with some falling as much as 25%.
Following last year’s explosive rally—when silver surged 150% and gold gained 65%—the market appears to be undergoing a correction. Overcrowded positioning, uncertainty surrounding the Federal Reserve’s policy outlook, and shifts in geopolitics and the U.S. dollar have all fueled the sell-off.
The move underscores that even traditional safe-haven assets are vulnerable to sharp volatility. When positioning becomes one-sided, even fundamentally strong markets can reverse quickly. Investors are now reassessing exposure, with some stepping in to buy the dip while others remain on the sidelines.
Top-Performing Commodities Over the Past Year
The three best performers are silver (+273%), platinum (+178%), and gold (+89%). These mark the strongest year-over-year gains for the metals since 1979–1980.
Can oil keep pace with the broader commodities rally?
The Bloomberg Commodity Index has surged, but the gains are not being driven by energy. Instead, strength is coming from other commodities, highlighting an unusual source of the rally.
Germany’s gold reserves are valued at nearly €500 billion.
Germany’s gold reserves are now valued at €496 billion. The Bundesbank holds 3,352 tonnes in total, with more than 1,200 tonnes stored in New York and the rest kept in Frankfurt and London.
The Swiss franc strengthens against the U.S. dollar.
While market attention remains focused on the U.S. dollar and the yen, the Swiss franc has quietly climbed to its strongest level in more than a decade.
Here’s why the move matters globally:
The “safe-haven” appeal
Investors are gravitating toward stability. With gold pushing above $5,000 an ounce and political uncertainty weighing on major economies, the Swiss franc has reasserted itself as a preferred refuge. The currency is up about 3% so far this year, building on a strong 14% gain last year.
The Swiss National Bank’s policy challenge
Such strength is a double-edged sword. While it helps keep inflation exceptionally low—currently around 0.1%—it also increases pressure on Switzerland’s export-driven economy. This leaves the Swiss National Bank facing a difficult decision:
Cut interest rates? With rates already at 0%, a return to negative territory would be a step policymakers are reluctant to take.
Here is a refined paraphrase that flows naturally from the previous section:
Intervene? Direct action in currency markets risks accusations of manipulation and could spark diplomatic frictions.
The global backdrop
When the world’s primary reserve currency—the U.S. dollar—shows signs of instability, capital doesn’t disappear; it reallocates. Increasingly, those flows are moving toward perceived safe havens, with the Swiss franc emerging as a key beneficiary.
In an era of heightened market volatility, genuine stability has become one of the rarest—and most valuable—assets.
U.S. companies account for 20 of the world’s 25 largest market capitalizations.
The remaining five companies are based outside the U.S., with one each from Europe, China, Taiwan, South Korea, and Saudi Arabia.
Within the United States, California dominates with six of the world’s largest companies by market value. Texas and Washington follow with three each, while New York is home to two. Nebraska, Arkansas, Indiana, New Jersey, Idaho, and Colorado each host one of the top global firms.
The endowment model faces mounting challenges.
For years, the endowment model—heavily tilted toward private assets—was held up as the gold standard for long-term investment success. Its track record was so compelling that institutions across the globe rushed to replicate it.
But every “secret sauce” loses its edge once it becomes common knowledge. As capital flooded into the same private markets, the once-distinct advantage began to erode.
Today, the space is increasingly crowded, and the classic endowment model is showing signs of strain. At the same time, more traditional portfolios with greater exposure to public markets are quietly regaining relevance.
The drivers are clear: too much money is chasing a limited pool of private opportunities, alpha in private equity is harder to extract, and liquid, public-market portfolios are proving more resilient than many expected.
This raises a critical question: is the era of private-heavy allocations coming to an end, or merely pausing? It may be time to revisit the “Yale model,” with a sharper focus on less congested private strategies and new sources of return—especially if the strong 60/40 performance of the past one and three years turns out to be more cyclical than enduring.
JPMorgan has lifted its year-end 2026 gold price forecast to $6,300 an ounce, pointing to sustained and strengthening demand from central banks and investors despite the recent bout of sharp price volatility.
Gold and silver both saw steep pullbacks late last week after rapid rallies left prices overstretched, with the move partly driven by a rebound in the U.S. dollar. Even so, JPMorgan analysts said the broader environment continues to favor gold, arguing that the “longer-term rally momentum will remain intact” and that they remain “firmly bullish” over the medium term, supported by a structural diversification trend.
A key factor behind the higher forecast is stronger-than-expected buying from the official sector. Central banks purchased around 230 tonnes of gold in the fourth quarter, taking total buying for 2025 to roughly 863 tonnes, even as prices moved above $4,000 an ounce. JPMorgan now expects about 800 tonnes of central bank demand in 2026, citing ongoing reserve diversification that still has room to run.
Investor demand has also picked up, with analysts highlighting rising ETF holdings, solid physical bar and coin purchases, and broader portfolio allocations to gold as a hedge against macroeconomic and geopolitical risks.
“Gold remains a dynamic, multi-faceted portfolio hedge, and investor demand has continued to exceed our previous expectations,” analysts led by Gregory Shearer wrote. “As a result, we now see sufficient demand from central banks and investors to push gold prices to $6,300 per ounce by the end of 2026.”
While acknowledging the speed of the rally, the analysts dismissed concerns that prices are nearing unsustainable levels, noting that demand remains well above the historical threshold needed to keep the market tightening. “While the air gets thinner at higher price levels, we are not yet close to a point where the structural gold rally risks collapsing under its own weight,” they added.
On silver, JPMorgan struck a more cautious tone following the metal’s sharp surge and subsequent pullback. Without central banks acting as consistent dip buyers, the analysts said they are “somewhat apprehensive” about the risk of a deeper near-term correction in silver relative to gold.
Even so, they see a higher average price floor of around $75 to $80 an ounce, arguing that silver is unlikely to fully give up its recent gains. Over the longer term, JPMorgan expects higher prices to reshape fundamentals, gradually easing the supply-demand imbalance that underpinned silver’s recent rally.
U.S. stock index futures edge lower as a sharp selloff in gold and silver weighs on investor sentiment ahead of a packed week of major corporate earnings and key economic releases. Bitcoin continues to slide after dropping below $80,000 over the weekend. Elsewhere, Oracle signals plans for fresh fundraising, while speculation over potential executive changes at Walt Disney grows ahead of its upcoming quarterly results.
Futures edge lower
U.S. equity index futures moved lower on Monday, pointing to a continuation of last session’s losses at the start of the new trading week.
As of 03:11 ET (08:11 GMT), Dow futures were down 323 points, or 0.7%, S&P 500 futures had declined 62 points, or 0.9%, and Nasdaq 100 futures were lower by 291 points, or 1.1%.
Market participants are closely watching a heavy slate of upcoming corporate earnings alongside a new monthly jobs report. Together, these releases could shed light on the health of the U.S. economy and test the resilience of a stock market rally now in its fourth year.
Beyond ongoing questions over the durability of the artificial intelligence-driven rally, investors are also weighing the implications of President Donald Trump’s nomination of Kevin Warsh as the next Federal Reserve Chair. If confirmed by the Senate, Warsh would bring his long-held calls for a shift in the monetary policy framework to the world’s most influential central bank.
Gold and silver extend their selloff
A sharp decline in both gold and silver, continuing the historic drop seen on Friday, weighed heavily on market sentiment—especially in Asia, where equities broadly fell.
Following a nearly 10% plunge late last week, spot gold fell another 4.9% to $4,626.80 per ounce by 03:27 ET, slipping well below the $5,000 mark it had just recently surpassed. Silver, which had benefited from speculative interest and industrial demand, also faced selling pressure but had somewhat stabilized around $79 an ounce as of 03:30 ET.
Analysts attribute the metals’ losses to a stronger U.S. dollar and widespread profit-taking after their significant rally in recent months.
Investors also showed concern about Kevin Warsh’s potentially hawkish stance in the long term. Although Warsh—formerly a Federal Reserve governor—has supported President Trump’s calls for sharply lower interest rates, he has been critical of the Fed’s asset purchase programs.
“Warsh is viewed as the most inflation-focused candidate for the Fed chair, reducing the chances of aggressive monetary easing. This sparked a wave of selling, with gold enduring its steepest decline in four decades,” ANZ analysts noted.
Bitcoin continues to decline
The risk-averse mood extended to cryptocurrencies, with Bitcoin dropping over 2% to $76,892.4. On Saturday, the leading digital currency fell below the $80,000 mark, continuing its decline from Friday. Some investors worried that Kevin Warsh might support shrinking the Federal Reserve’s balance sheet, which could reduce liquidity in the financial system.
Larger Fed balance sheets have historically supported cryptocurrencies by injecting cash into money markets, providing backing for riskier assets.
This latest slide marks another downturn for Bitcoin since reaching its all-time high last October. Once buoyed by optimism over increased cash flows and a friendlier regulatory environment under Trump, the token has now lost about one-third of its value.
With turmoil spreading across stocks, commodities, and crypto, Jonas Goltermann, Deputy Chief Markets Economist at Capital Economics, described the past few days as “unusually hectic […] for financial markets” in a recent note.
Oracle announces plans for new fundraising
On Sunday evening, Oracle Corporation announced plans to raise new capital in 2026 to support the expansion of its AI and cloud infrastructure amid rising demand for computing power.
The company aims to generate between $45 billion and $50 billion in gross proceeds during 2026, utilizing a mix of debt and equity financing.
About half of the funds will come from a combination of equity derivatives and common stock, according to a company statement.
Oracle plans to raise its debt funding through a single, one-time issuance of investment-grade senior unsecured bonds in early 2026, with no additional debt expected afterward.
Analysts at Vital Knowledge highlighted that roughly half of the total funding will come from equity-linked securities, including a $20 billion at-the-market (ATM) common equity program.
They noted, “Oracle’s $20 billion ATM offering is the first time a major tech company has been compelled to raise equity since the AI boom began. If this signals a shift toward greater fiscal caution in the industry, it could lead to a slower overall pace of spending.”
Disney set to release earnings
Walt Disney is set to release its earnings before the opening bell on Monday.
While the company’s continued focus on its streaming services, alongside its vital parks and studios divisions, will be closely watched, much of the attention may center on leadership succession.
According to the Wall Street Journal, Disney CEO Bob Iger has informed colleagues that he intends to step down and reduce his day-to-day involvement before his contract expires on December 31.
Board members are expected to convene soon to decide on Iger’s successor, with several media outlets naming Experiences division head Josh D’Amaro as the likely frontrunner.
Long EUR/USD after a daily close above 1.1866, resulting in a 0.24% loss.
Long Silver, which ended with a loss of 18.62%.
Long Gold after a daily close above $5,000, producing a 2.26% loss.
Taken together, these positions generated a total loss of 21.12%, or 7.04% per asset. While this was a sizable drawdown, the broader performance of my weekly forecasts over recent weeks remains positive, as earlier gains were exceptionally strong and more than offset this setback.
Key market data from last week:
U.S. Federal Reserve policy meeting: No surprises, with interest rates left unchanged.
U.S. Producer Price Index (PPI): The standout data release of the week. Inflation came in far hotter than expected, with headline PPI rising 0.5% month-on-month and core PPI increasing 0.7%, versus forecasts of just 0.2% for both. This reinforced a more hawkish Fed outlook, lifted the U.S. dollar, and accelerated the sharp reversal in Silver (and Gold). As a result, expectations for a second U.S. rate cut in 2026 were pushed back to October.
Bank of Canada policy meeting: No change to interest rates, as anticipated.
Australian CPI: Inflation exceeded expectations, with an annual rate of 3.8% versus 3.5% forecast, strengthening the case for possible RBA rate hikes and supporting the Australian dollar early in the week.
Canadian GDP: Slightly weaker than expected, showing zero month-on-month growth.
U.S. unemployment claims: In line with forecasts.
While PPI and Australian inflation influenced market moves, two broader developments likely had an even greater impact:
Federal Reserve leadership: President Trump announced his nominee for the next Fed Chair, Kevin Warsh. Although regarded as a hawk, Warsh is now thought to favor lower interest rates. The nomination contributed to the collapse of the Silver rally and provided additional support to the U.S. dollar.
Geopolitical tensions: The U.S. continued its military buildup near Iran, raising the risk of a wider regional conflict. Polymarket currently assigns a high probability to a U.S. strike on Iran in March, despite President Trump still referencing the possibility of a diplomatic agreement. These tensions appear to be supporting crude oil prices, with WTI crude reaching a new four-month high last week.
Meanwhile, the S&P 500 briefly pushed to a fresh record above 7,000. Although the index remains resilient, upside momentum is limited. In my view, a clearer resolution to U.S.–Iran tensions is needed before a more decisive directional move can develop.
The Week Ahead: 2nd – 6th February
The most significant data releases for the coming week, ranked by expected market impact, include:
U.S. Average Hourly Earnings and Non-Farm Payrolls
Preliminary University of Michigan Inflation Expectations
European Central Bank main refinancing rate decision and monetary policy statement
Bank of England official bank rate decision, voting breakdown, and monetary policy report
Reserve Bank of Australia cash rate decision, rate statement, and monetary policy statement
U.S. JOLTS job openings
Preliminary University of Michigan consumer sentiment
U.S. ISM services PMI
U.S. ISM manufacturing PMI
U.S. unemployment rate
New Zealand unemployment rate
Canadian unemployment rate
U.S. weekly unemployment claims
This will be a particularly busy and potentially market-moving week, with three major central banks delivering policy decisions. Please note that Friday is a public holiday in New Zealand, which may reduce liquidity in related markets.
Monthly Forecast February 2025
For the month of January 2026, I forecasted that the USD/JPY currency pair would rise in value. Unfortunately, this was a losing trade.
For the month of February, I forecast that the EUR/USD currency pair will rise in value.
Weekly Forecast 2nd February 2026
Last week, three currency crosses experienced unusually high volatility, prompting the following weekly trade forecasts:
Short NZD/JPY, which resulted in a 0.57% loss.
Short AUD/JPY, ending with a 0.32% loss.
Short NZD/CAD, producing a 0.39% loss.
Overall, the Swiss franc and the New Zealand dollar emerged as the strongest major currencies of the week, while the U.S. dollar was the weakest. Market conditions were relatively subdued, with directional volatility dropping sharply—only 11% of major currency pairs and crosses moved by more than 1% over the week.
Technical Analysis
Key Support/Resistance Levels for Popular Pairs
US Dollar Index
Last week, the U.S. Dollar Index formed a notably large bullish pin bar, rejecting a fresh four-year low. On its own, this price action is bullish. However, the broader technical structure remains bearish, with the index still trading below its levels from 13 and 26 weeks ago. As a result, the technical outlook for the U.S. dollar is mixed.
The nomination of Kevin Warsh as Federal Reserve Chair provided some support to the dollar during the week. Nevertheless, the forward outlook remains uncertain, and I believe the most attractive trading opportunities in the near term are likely to be independent of U.S. dollar direction.
EUR/USD
The EUR/USD pair recently staged a strong long-term bullish breakout as the U.S. dollar accelerated lower and printed a new 3.5-year low. However, the move quickly failed, with price retreating sharply and finding minimal follow-through support.
This price action suggests the breakout may have been a temporary spike, although the potential for a sustained bullish trend should not be dismissed, as EUR/USD has historically shown a tendency to trend cleanly once momentum is established.
That said, the appointment of a new Fed Chair and the renewed strength in the U.S. dollar late in the week—driven by hotter inflation data—argue for a more cautious stance.
Accordingly, I would only consider a long position following a daily (New York close) above 1.2039.
WTI Crude Oil
WTI crude oil has surged strongly in recent sessions as the risk of a regional conflict centered on Iran has intensified. Prediction markets are currently assigning a high probability to a U.S. strike on Iran in March, a scenario that could significantly disrupt global crude supply. Against this backdrop, prices pushed to a new four-month high by the end of last week, with a daily close above $66.25 marking a potential six-month high.
However, two important cautions should be noted:
While a daily close above $66.25 would typically attract trend-following buying, the current moving average structure does not confirm a bullish setup. Even in the event of military conflict, the move could prove to be a short-lived spike, especially if a rapid U.S. victory follows, potentially resulting in a failed breakout.
Unlike recent Democratic administrations, the Trump administration is likely to take aggressive steps to suppress crude oil prices, which could cap or reverse upside momentum.
Bitcoin
BTC/USD has finally completed a decisive bearish breakdown below the long-term support zone just above $81,000. Price is now firmly established beneath this level and has pushed to a new nine-month low, a development that is technically significant and clearly bearish.
While equities and precious metals have rallied strongly in recent months, Bitcoin peaked at a record high several months ago and has since trended steadily lower. This divergence highlights a broader downturn across the crypto sector, with Bitcoin now showing clear signs of structural weakness.
Despite early expectations that Bitcoin would fundamentally reshape global finance, real-world adoption remains limited outside parts of Africa. Practical usability is still constrained, and its underlying value proposition remains uncertain.
Although I generally avoid short-selling, Bitcoin appears entrenched in a long-term bearish trend. I would not consider buying at current levels. Short positions may be worth considering, but only with strict risk management, as shorting is best suited to experienced traders.
XAG/USD
Silver experienced an exceptionally volatile week, surging more than 15% to hit a new all-time high and the long-discussed $120 options target, before suffering a dramatic reversal. The sell-off unfolded sharply on Thursday and Friday—particularly Friday—when prices plunged 28% in a single session.
I had previously cautioned that the move was highly vulnerable to a sharp correction, and that while a long position was justified, it should be taken with a reduced position size.
The sheer magnitude of the collapse, even with some bullish undertones and modest resilience in the bounce from the weekly lows, strongly suggests that another record high is unlikely in the near term. This extraordinary rally appears to be finished, and the most probable next phase is a period of erratic consolidation, marked by large swings and gradually diminishing volatility.
XAU/USD
Much of the analysis above regarding Silver also applies to Gold. That said, gold’s volatility was noticeably lower, and its price action showed greater resilience at the lows.
While gold is also likely to enter a period of sideways consolidation, the underlying structure suggests it may recover to the upside more quickly than silver.
Bottom Line
My preferred trade for the coming week is:
Long EUR/USD, contingent on a daily (New York) close above 1.2039.