Gold and Bitcoin have diverged sharply in recent months, with Yardeni Research arguing that currency movements are becoming a key driver of that split.
In its latest report, the firm revisited the long-standing question of whether Bitcoin can be considered “digital gold,” pointing out that both assets are difficult to value since neither generates interest or dividends. However, Yardeni cautioned that Bitcoin’s purely digital form could make it “potentially vulnerable someday to hacking by quantum-computing algorithms,” whereas gold’s main drawback is the need for physical storage.
Bitcoin’s volatility has persisted. Yardeni noted that the cryptocurrency surged to a record near $125,000 in late 2025 before retreating toward $90,000.
Gold, by contrast, has been in a strong uptrend since it “decisively broke out” in March 2024. Prices have climbed roughly 2.5 times since then, moving above $3,000 an ounce in early 2025. The firm maintains its long-term outlook that gold could reach $10,000 by the end of the decade.
According to Yardeni Research, recent currency shifts are widening the gap between the two assets. The firm said a weaker U.S. dollar tends to hurt Bitcoin because it lowers Bitcoin’s value in other currencies, potentially encouraging foreign investors to sell. Some of those flows, it suggested, may be rotating into gold instead.
In addition, a softer dollar can put upward pressure on U.S. inflation, which would further support gold prices. Yardeni also noted that dollar weakness generally favors U.S. investors in overseas markets, reinforcing its overweight stance on emerging-market equities.
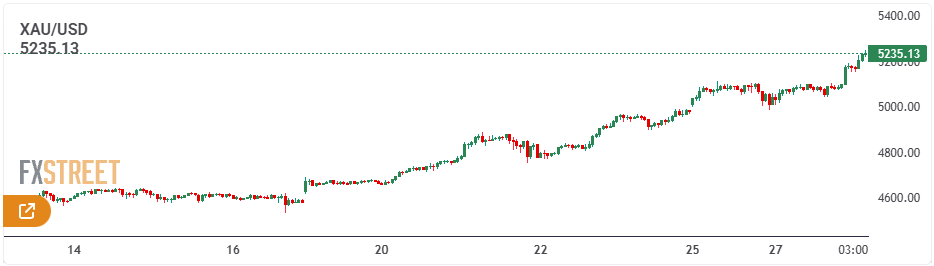
Gold prices climbed to a new record above $5,600 an ounce this week, as persistent economic and geopolitical uncertainty continued to push investors toward traditional safe-haven assets.
The metal is up more than 17% so far this year, building on last year’s strong advance. Gold’s sustained rally has been driven by a combination of heightened global uncertainty, expectations of lower U.S. interest rates, and consistent purchases by central banks as part of a broader move to diversify away from the U.S. dollar.
Market anxiety has intensified in recent days after President Donald Trump said he intends to impose new tariffs on imports from South Korea, while concerns over a potential partial U.S. government shutdown re-emerged ahead of the January 30 funding deadline.
Following bullion’s surge to record highs, Investing.com spoke with John McCluskey, chief executive of Canadian miner Alamos Gold (NYSE: AGI), to explore the factors behind the rally and his outlook for gold prices over the rest of the year.
To what extent is today’s gold price driven by long-term structural demand, as opposed to short-term momentum and fear of missing out (FOMO)?
McCluskey noted that gold prices are currently strongly underpinned by sustained central bank purchases from at least six countries, including China, Russia, and their trading partners. This long-term structural demand has steadily pushed gold higher over the past decade, with prices hitting a new peak above $5,000 this week.
That rise has increasingly drawn in retail investors. According to fund managers, gold funds are experiencing record inflows, which is boosting both bullion prices and gold equities. Overall, structural demand remains the primary driver of current prices, but it has now spilled over into momentum-driven buying from retail investors.
How much does gold’s outlook hinge on additional U.S. interest rate cuts, and what would be the impact if the easing cycle ends earlier than markets anticipate?
“While U.S. Fed rate cuts may play a role, I don’t think gold’s outlook hinges on further easing, as prices have been—and continue to be—strongly supported by central bank buying. This trend has been in place for around a decade, and I believe there is still plenty of upside, with or without rate cuts,” McCluskey said.
Would a potential easing of global geopolitical tensions be sufficient to trigger a significant pullback in gold prices?
“While de-escalation could weigh on gold prices, there are numerous other tailwinds supporting the market, and I don’t see those trends fading anytime soon,” McCluskey told Investing.com.
“I expect gold prices to continue rising. And it’s not just gold mining CEOs saying this—chief executives at major banks are also pointing to a stronger gold outlook,” he added.
What is your outlook for gold prices by year-end?
I believe the fundamental drivers supporting gold remain firmly in place, pointing to a sustained bull market. With retail investors only now beginning to participate, gold could consolidate around the current $5,000 level and potentially move toward analysts’ year-end targets in the $5,400–$6,000 range.
Despite hitting record highs earlier in the week, precious and industrial metals retreated on Friday, as gold, silver, and copper declined amid profit-taking. The pullback followed a reassessment of expectations for aggressive U.S. interest rate cuts, alongside a stronger dollar.
Spot gold slid more than 6% to $5,042 by 10:55 ET (15:55 GMT).
The dollar gained after President Donald Trump announced former Federal Reserve Governor Kevin Warsh as his choice to lead the central bank, boosting the greenback against major currencies.
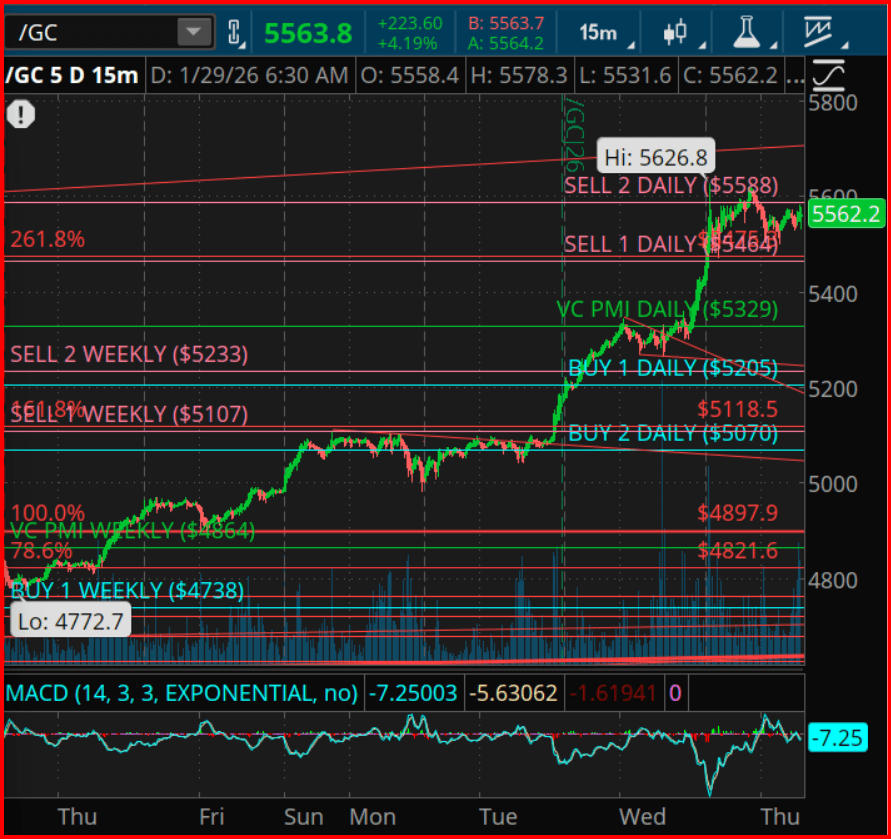
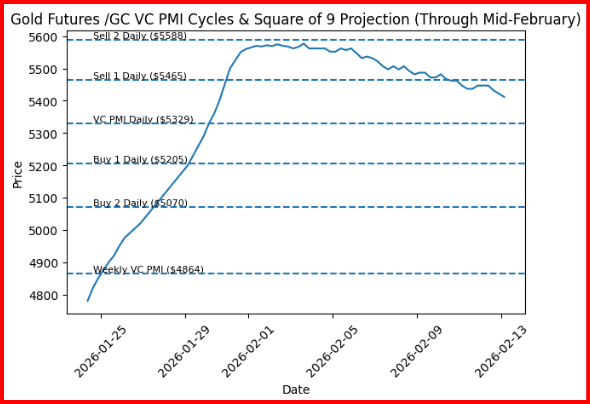
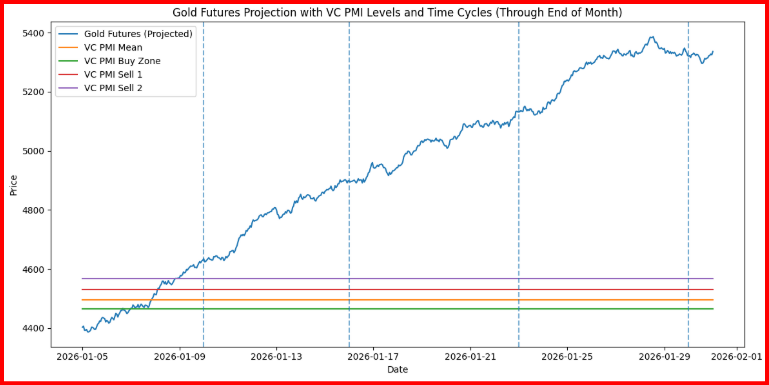
Gold futures continue to show strong bullish momentum, holding well above the VC PMI Daily Pivot near $5,329, reinforcing higher-timeframe trend alignment across both daily and weekly cycles. The sharp, near-vertical advance that began earlier this week is characteristic of classic “escape velocity” behavior, with price accelerating away from the mean during a synchronized time-and-price harmonic window.
Within the VC PMI framework, price is now rotating inside the upper volatility band. Daily Sell 1 near $5,465 defines the first layer of structural resistance, while Daily Sell 2 around $5,588 marks the outer boundary of the current expansion envelope. The recent intraday peak near $5,626.8 indicates price is pressing into a late-stage extension phase, where probabilities begin to shift toward consolidation or orderly mean reversion rather than continued vertical advance.
Square of 9 geometry supports this view. Angular projections from the latest weekly VC PMI Pivot near $4,864 project resistance harmonics into the $5,560–$5,620 region, closely overlapping with the Daily Sell 2 band. This confluence of time, price, and geometric resistance elevates the likelihood of a near-term inflection window.
On the downside, rotational support remains layered at Daily Buy 1 near $5,205 and Daily Buy 2 near $5,070, with deeper mean support at the weekly VC PMI Pivot around $4,864 should downside volatility expand.
Cycle analysis further identifies a key timing cluster between January 29 and February 2, derived from overlapping 30-day and 60-day harmonics. Historically, such windows tend to resolve momentum conditions via either range compression or a counter-trend rotation back toward the VC PMI mean. Momentum indicators, including MACD divergence behavior, suggest upside efficiency is fading, reinforcing the risk of a pause or rotational pullback rather than immediate continuation.
From a strategic standpoint, trend-following participants may continue to trail protective stops below $5,205, while mean-reversion traders will look for rejection signals within the $5,560–$5,620 Square of 9 resistance arc. A sustained close above $5,588 would negate the near-term mean-reversion risk and reopen the path toward higher geometric extensions.
Gold’s most recent move was sharp, chaotic, and relentless. With volatility running high and prices stretched, managing risk is just as critical as getting the direction right.
Gold shows capitulation-like price behavior
Volatility jumps to multi-year highs
Prices look stretched after a rapid upside surge
Position sizing and risk management become paramount
Gold shows meme-stock–like trading behavior
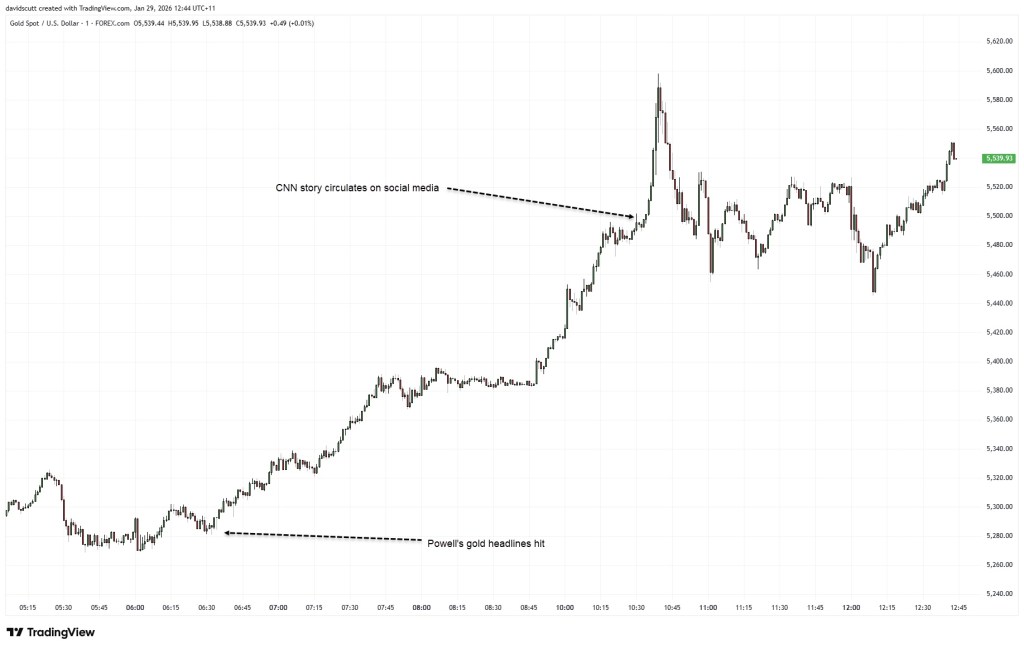
Gold behaved less like a classic safe haven and more like a meme stock on Thursday, surging nearly $100 within minutes during early Asian trading. Prices briefly spiked toward $5,600 before reversing just as quickly. The sheer speed and magnitude of the move felt like capitulation in real time, likely exacerbated by thin liquidity during the transition from North American to Asian market hours.
Although the price surge began around the same time, a CNN report later surfaced indicating that the U.S. was considering new military strikes against Iran. However, given that geopolitical tensions have been elevated for weeks rather than emerging suddenly, much of that risk was likely already priced in. In that sense, the headline appears more like a catalyst than the underlying cause of the move.
Some traders also cited comments from Fed Chair Jerome Powell after the January FOMC meeting, in which he downplayed any macroeconomic signal from gold’s record highs. Still, those remarks seem to have played only a minor role, coming several hours before the most volatile phase of the price action unfolded.
Volatility jumps sharply higher
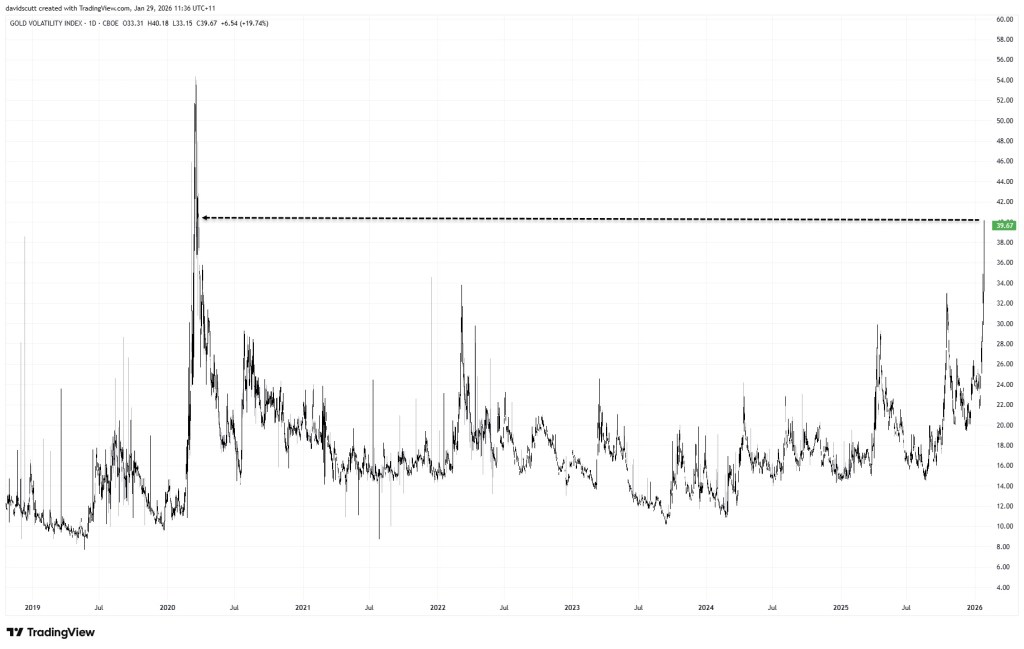
While today’s spike has understandably drawn attention, it is not an isolated event, instead forming part of a broader and accelerating expansion in volatility across the gold market.
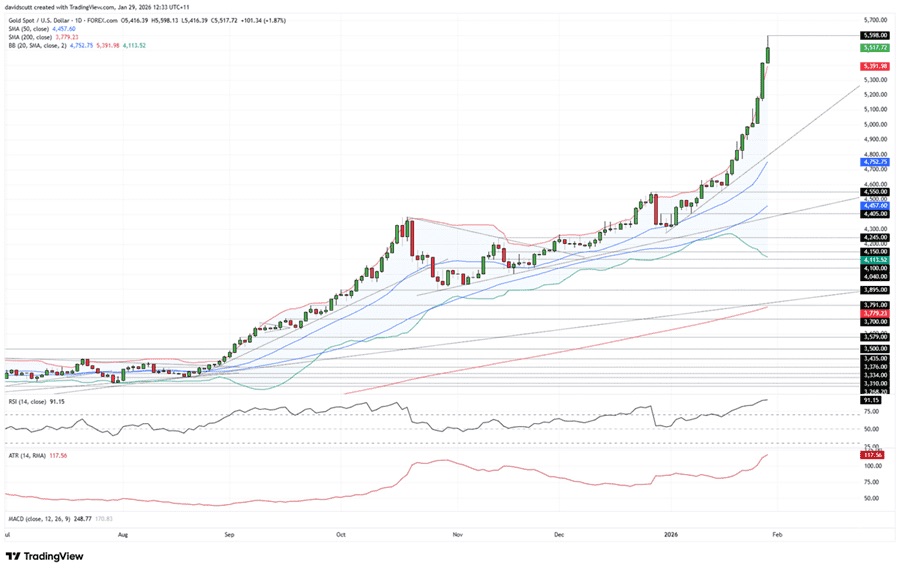
As illustrated above, the Gold Volatility Index (GVZ) has climbed to its highest level since the early days of the COVID-19 lockdowns in 2020, highlighting just how extreme price action in the traditional safe haven has become. GVZ measures implied volatility in gold options, offering insight into the magnitude of price swings the options market is anticipating. The surge suggests the market has entered a markedly different volatility regime, one in which unusually large moves are occurring with increasing frequency.
The broader volatility environment is also clearly visible on the daily chart. Gold is trading well above its upper Bollinger Band, highlighting the speed and magnitude of the recent acceleration relative to prior conditions. Daily trading ranges have expanded sharply, with the 14-day ATR elevated at 117.56—making $100-plus moves routine rather than exceptional. Meanwhile, the 14-day RSI sits deep in overbought territory at 91.15, reinforcing that while the broader uptrend remains intact, price action is increasingly stretched and unstable.
Risk management takes center stage
In short, this is an exceptionally high-volatility environment where price behavior is far from normal. Gold has surged rapidly, leaving prices highly extended and vulnerable to sharp moves in both directions, even as the broader uptrend remains in place. In such conditions, traditional technical signals often lose reliability, making risk management and position sizing especially critical—particularly with mean-reversion risks running high.
Gold prices climbed toward a fresh record near $5,220 during Asian trading on Wednesday, extending gains on a weaker U.S. dollar, persistent geopolitical tensions and ongoing economic uncertainty. Investors are now awaiting the Federal Reserve’s interest rate decision later in the day for further direction.
Fundamental Analysis Overview
Expectations of further policy easing by the U.S. Federal Reserve, persistent selling pressure on the U.S. dollar, continued central bank purchases, and record inflows into exchange-traded funds have provided strong support for gold prices.
Although U.S. President Donald Trump stepped back from a tariff threat after saying a framework agreement had been reached on a future Greenland deal with NATO, the brief episode raised concerns about the reliability of global alliances. These doubts, combined with the prolonged Russia–Ukraine conflict, continue to fuel safe-haven demand for gold. Russia launched another large-scale drone and missile assault on Ukraine during the second day of U.S.-mediated peace talks in Abu Dhabi over the weekend, which concluded without an agreement. While trilateral discussions are set to resume on February 1, expectations for a breakthrough in the nearly four-year conflict remain low, keeping geopolitical risks elevated.
Further weighing on market sentiment, Trump warned on Saturday that the U.S. could impose a 100% tariff on Canada should it proceed with a trade agreement with China. The possibility of renewed tensions over Greenland and other unpredictable policy moves from the Trump administration has undermined confidence in the U.S. dollar. As a result, the Dollar Index (DXY) has fallen to its lowest level since September 2025, pressured further by market expectations that the Fed could cut rates twice more in 2025. This environment continues to favor non-yielding assets such as gold, particularly as attention turns to the two-day FOMC meeting that began on Tuesday.
The Federal Reserve is set to announce its policy decision on Wednesday and is widely expected to keep interest rates unchanged. As such, investor focus will center on the accompanying statement and Fed Chair Jerome Powell’s press conference for signals on the future policy path. Any guidance on the timing and pace of potential rate cuts will be critical in shaping near-term dollar movements and determining gold’s next directional move. In the shorter term, U.S. Durable Goods Orders data due later Monday could generate trading opportunities during the North American session.
On the demand side, the People’s Bank of China extended its gold-buying streak for a fourteenth consecutive month in December. Other emerging market central banks, including those of Poland, India, and Brazil, were also active buyers in late 2025 and early 2026. Meanwhile, global investment demand through gold ETFs rose 25% in 2025, with total holdings increasing to 4,025.4 tonnes from 3,224.2 tonnes a year earlier. Assets under management climbed to $558.9 billion, reinforcing gold’s bullish case and supporting expectations for a continuation of the well-established uptrend amid a favorable fundamental backdrop.
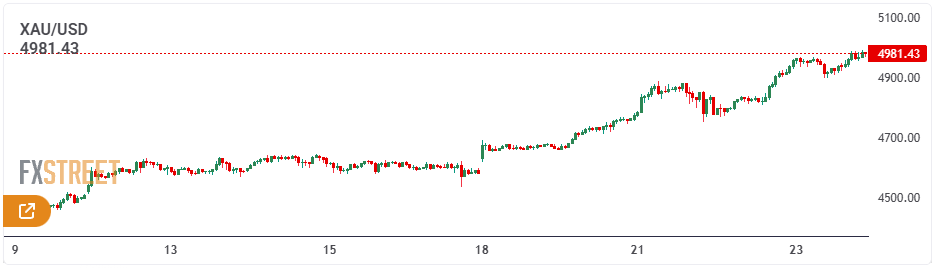
XAU/USD Technical Outlook
The rising channel originating from $4,464.07 continues to support the broader uptrend, with upside currently constrained near $5,101.21. The MACD remains in positive territory, although the histogram is starting to narrow, indicating fading momentum even as the MACD line stays above the signal line. Meanwhile, the RSI is elevated around 78, signaling overbought conditions that may limit near-term gains and favor consolidation near the upper boundary of the channel.
Should prices fail to break decisively above the channel top, a corrective move toward support at $4,934.92 could develop. Further contraction in the MACD histogram would strengthen the case for a pullback, while a downturn in the RSI from overbought levels would point to mean reversion within the channel. On the other hand, if bullish momentum persists and MACD remains supportive, the prevailing uptrend would stay intact, maintaining the upside bias defined by the ascending channel.
Gold prices climbed to a record above $5,200 an ounce on Wednesday, supported by robust safe-haven demand and persistent weakness in the U.S. dollar. Other precious metals also stayed firm, with silver and platinum trading near recent record highs.
Spot gold edged lower to $5,179.41 an ounce by 19:55 ET (00:55 GMT) after briefly touching a record peak of $5,202.06. Meanwhile, April gold futures jumped 1.8% to $5,215.46 an ounce.
Safe-haven demand remained strong after U.S. President Donald Trump said a second armada was heading toward Iran, while expressing hope that Tehran would agree to a deal with Washington.
Gold’s rally this year has been largely driven by uncertainty surrounding U.S. policy, with heightened geopolitical tensions fueled by developments in Venezuela and a dispute over Greenland.
A weaker dollar also provided support to gold and broader metals markets, as investor concerns grew over elevated fiscal spending and the Federal Reserve’s independence under the Trump administration. Policy uncertainty pushed the dollar to multi-year lows earlier this week.
Trump said on Tuesday that he was close to naming a successor to Fed Chair Jerome Powell, adding that interest rates would decline under new leadership. Ongoing friction between the White House and the Federal Reserve has further underpinned gold prices, as markets remain wary of political pressure on the central bank.
Elsewhere in metals markets, spot silver gained 1.2% to $113.4325 an ounce, while spot platinum climbed 0.6% to $2,669.61. Both were trading near record levels.
OCBC has raised its end-2026 gold price target to $5,600 per ounce from $4,800, citing recent sharp gains and enduring structural demand rather than a shift in its core market view. Gold has climbed about 17% so far in 2026 and has stayed elevated despite periodic pullbacks.
The bank said prices are now supported less by isolated event risks and more by a prolonged environment of uncertainty that is driving diversification into non-sovereign assets. OCBC highlighted a persistent pricing premium that cannot be fully accounted for by traditional factors such as yields, the US dollar, ETF flows, volatility, or policy uncertainty. This premium reflects a geopolitical and uncertainty component increasingly embedded in gold prices, fueled by ongoing geopolitical tensions, policy unpredictability, and concerns over confidence in the dollar. OCBC added that the broader uptrend remains intact, underpinned by structural geopolitical risks, accommodative monetary conditions, and continued support from official sector and ETF demand.
Gold has climbed beyond $5,100, underpinned by a softer US dollar and strong, persistent structural demand. Solid technical momentum and ongoing global policy uncertainty continue to favor hard assets such as gold and silver. While the focus on potential FX intervention raises the risk of near-term profit-taking, the broader rally still shows little sign of losing steam.
Gold surged to a fresh record of $5,100 an ounce, while silver extended its rally with another 5% jump to around $110. The latest advance has been fueled by persistent US dollar weakness, signs of yen intervention, and broader unease over fiat currencies—long a structural pillar of gold’s appeal. Ongoing global policy uncertainty is also channeling capital into hard assets.
With such an extensive list of supportive factors, even the most bullish investors may question how long the rally can continue without at least a pause, especially given how stretched valuations have become. The temptation for profit-taking at these levels is clear. Yet prices continue to refuse to roll over, and that resilience is becoming the key narrative. Despite a fading geopolitical risk premium and last week’s tariff U-turn by Trump—which, in theory, should have dampened safe-haven demand—gold barely reacted and instead pushed even higher, underscoring the strength of the current trend.
US dollar remains under pressure amid easing rate expectations and declining investor confidence.
At first glance, the explanation seems simple: the US dollar has weakened, giving gold a natural boost. A softer greenback makes gold more affordable for non-US buyers, and that effect is clearly visible. However, this move goes beyond a straightforward FX translation. Gold prices have also been rising in euro and sterling terms, pointing to broader, more structural demand rather than just currency-driven gains.
That said, dollar weakness is still playing an important role. The greenback has slid amid recent geopolitical fractures, and suspected Japanese intervention in USD/JPY has added further pressure. Markets are increasingly convinced that Japanese authorities stepped in when USD/JPY pushed beyond 159. What really caught investors’ attention were reports that the Federal Reserve was “rate-checking” banks in New York around the London close. The idea that this may have been more than unilateral action by Tokyo—potentially involving coordination with Washington—is significant, as joint Japan–US intervention would send a far stronger signal than Japan acting alone.
Bullish momentum remains firmly intact, with strong follow-through buying and little sign of exhaustion despite overextended conditions.
Momentum is clearly carrying much of the move. The uptrend remains firmly intact, with trend-following behavior dominating as traders continue to buy dips rather than sell into strength. As long as that pattern persists, it is difficult to make a convincing case against further near-term gains.
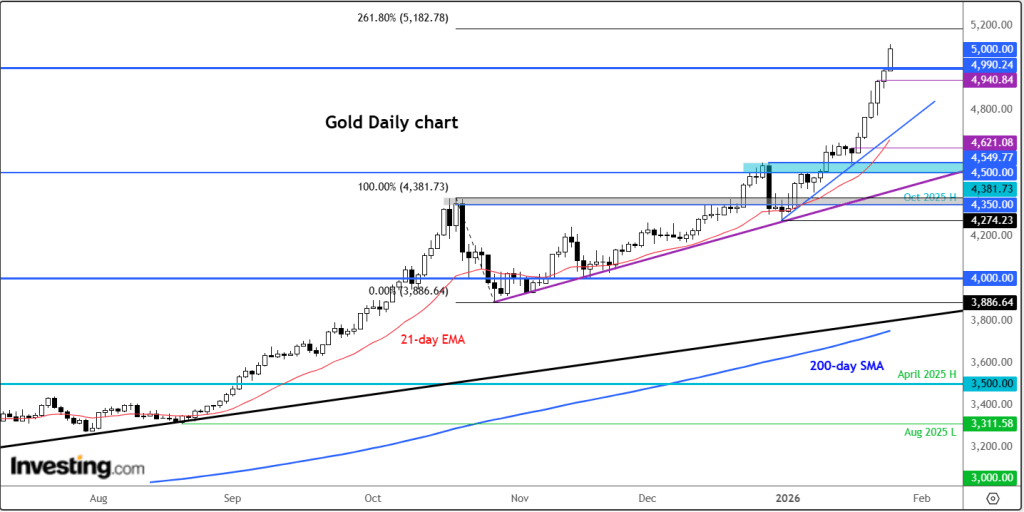
From a psychological standpoint, the $5,000 threshold has now been decisively cleared. It may have seemed ambitious only a few sessions ago—much like $4,000 did not long before—but strong technical momentum, a weakening US dollar narrative, and rising anxiety in global bond markets have made these once-distant milestones appear increasingly attainable.
That said, macro fundamentals still deserve attention. Real yields, growth expectations, and inflation dynamics have not vanished, and eventually they will reassert influence. When they do, gold may find it harder to sustain these elevated levels without a renewed or deeper systemic risk backdrop.
Key Levels to Monitor
For now, the bias remains to the upside. The next resistance target is near $5,182, corresponding to the 261.8% Fibonacci extension of the major October downswing, with the $5,200 psychological level just above. On the downside, multiple support zones are in focus, starting with $5,000. Other round-number levels such as $4,900 and $4,800 may also provide support, while more significant longer-term support is seen around $4,500–$4,550.
As long as the dollar stays weak, central banks continue to be net buyers of gold, and governments openly signal a willingness to intervene in FX markets, it is difficult to identify a catalyst that would meaningfully reverse gold’s advance at this stage, aside from bouts of profit-taking.
Gold’s record-setting bull market has resumed its charge—but under a new set of drivers. Aggressive buying from China has increasingly taken over from gold’s traditional engines of demand, namely U.S.-based gold ETFs and futures traders. With American participation fading, gold’s ability to hold lofty levels now rests heavily on sustained Chinese demand. This shift has helped gold remain elevated, postponing the corrective phase typically required to rebalance overheated markets.
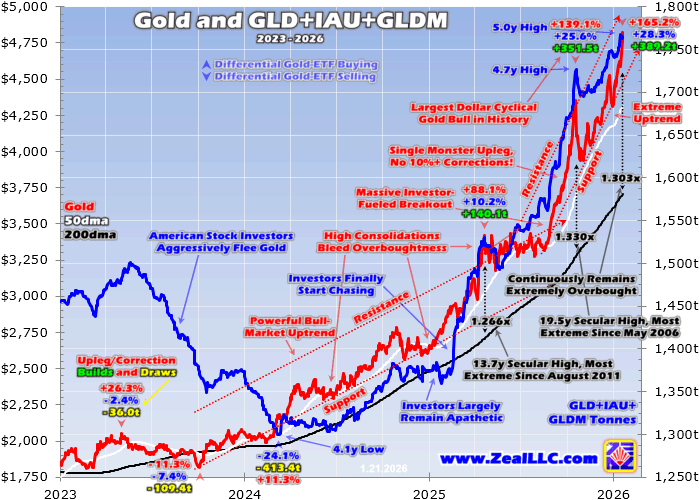
Between late July and mid-October 2025, gold surged an extraordinary 32.9% in just 2.7 months. During that stretch, the metal logged 24 record closes—roughly three-sevenths of all trading days—while its strongest gains were spread relatively evenly across the calendar. At the time, U.S. investors were aggressively piling into gold, providing powerful upside momentum.
That enthusiasm was clearly reflected in holdings of the world’s largest gold ETFs—SPDR Gold Shares (GLD), iShares Gold Trust (IAU), and SPDR Gold MiniShares (GLDM). According to the World Gold Council’s Q3’25 data, these three vehicles together accounted for more than three-sevenths of all gold held by global ETFs. During the rally, their combined bullion holdings jumped 10.9%, or 169.4 metric tons, helping propel gold to around $4,350 by mid-October and pushing technical conditions to extreme levels.
At its peak, gold was trading 33% above its 200-day moving average—ranking among the most overbought readings since 1981. The bull market had delivered gains of 139.1% over 24.5 months without a single correction exceeding 10%, making it the largest cyclical gold bull ever in U.S. dollar terms since the gold standard was abandoned in 1971. Historically, such excesses have almost always been followed by sharp pullbacks.
A correction initially appeared to be unfolding, with gold dropping 9.5% into early November—its steepest decline of the cycle and close to formal correction territory. Then the pattern abruptly changed.
Since mid-October, gold has climbed another 10.9% over roughly three months, yet this time without meaningful participation from U.S. investors. ETF holdings at GLD, IAU, and GLDM rose just 2.2% (37.8 tons), less than one-quarter of the prior buildup—and all of that increase occurred only in the past month. Those holdings didn’t even recover their mid-October peak until mid-December, shortly before gold began printing fresh record highs.
Gold’s ability to avoid a deeper correction despite some of the most extreme overbought conditions in decades raised questions. Normally, such excesses demand a reset in sentiment and positioning. Since U.S. investors were not driving the rebound, another source of demand had to be absorbing supply.
Clues emerged in the timing of gold’s strongest advances. Since mid-October, nearly all of gold’s gains have occurred on Mondays—a striking anomaly given that Mondays have historically been gold’s weakest trading day. Major upside moves were logged on November 10, November 24, December 22, January 5, January 12, and again this week following a Monday market holiday. Collectively, these few sessions accounted for the vast majority of gold’s rally since October.
Closer inspection revealed that most of these gains occurred overnight during Asian trading hours—well before European or U.S. markets opened. In other words, Chinese traders were responsible for driving price action when the rest of the world was largely inactive. These sessions effectively became “China Mondays,” periods when Chinese market flows dominated global pricing due to minimal competing liquidity.
Because China is uniquely active during the late Sunday-to-early Monday window, its influence on gold prices during that time is disproportionate. On other weekdays, extended trading hours in Western markets dilute that impact. The clustering of gains during these windows strongly suggests that China has become the primary marginal buyer supporting gold at record levels.
Until U.S. investors re-engage meaningfully, gold’s resilience at these heights will depend largely on whether Chinese demand remains strong enough to keep the rally alive.
China’s influence on Sunday-night trading is further magnified by the weekend effect. Weekends represent the longest stretch when traders are unable to react to new, market-moving developments. As a result, many participants square positions and shut down algorithmic trading systems ahead of the weekend. Meanwhile, algorithms that remain active into early Monday often have a backlog of news to process, which can intensify price moves during thin overnight liquidity. This dynamic can significantly amplify China-driven buying in gold.
Before delving further into China’s growing dominance in the gold market, it’s useful to look at how dramatically conditions shifted around gold’s mid-October peak. In the months leading up to that high, heavy share buying in GLD, IAU, and GLDM was the primary force behind gold’s explosive rally. Since then, demand from U.S. equity investors has been largely muted. Even so, gold has managed to surge back into extreme overbought territory—an outcome that underscores how unusual and China-dependent this phase of the rally has become.
China’s dominance during Sunday-night trading is reinforced by the structure of weekends themselves. Weekends are the longest periods when traders cannot respond to new, market-moving information. As a result, many participants flatten positions and shut down algorithmic systems before markets reopen. Meanwhile, algorithms that remain active into early Monday often need to process a backlog of news, which can magnify price movements in thin overnight liquidity. This dynamic amplifies China-driven gold buying when global participation is minimal.
Before exploring China’s growing grip on gold prices further, it helps to contrast the months before and after gold’s mid-October peak. In the run-up to that high, aggressive share buying in GLD, IAU, and GLDM was the dominant force behind gold’s explosive advance. Since then, U.S. stock investor demand has been largely muted—yet gold has still surged back into extreme overbought territory, underscoring how unusual and externally driven this rally has become.
While American equity investors were slow to chase this China-led surge until recently, U.S. gold-futures speculators jumped in aggressively. Futures positioning is reported weekly, and in late November—just after gold’s second “China Monday” surge—total speculative long positions stood at 307,000 contracts. Over the following seven weeks, that figure ballooned. By the January 13 Commitments of Traders report, total spec longs had risen to 362,400 contracts—an increase equivalent to roughly 172 metric tons of gold. That dwarfed the roughly 52-ton increase in GLD, IAU, and GLDM holdings over the same period, meaning futures traders significantly amplified China-driven momentum.
However, futures-driven buying power is limited and quickly exhausted. Gold futures allow extreme leverage—often 20x to 25x—which dramatically restricts the pool of participants willing to assume such risk. Assessing speculative positioning within its historical range provides insight into whether traders are more likely to add exposure or begin selling.
As of mid-January, speculative long positions were already 58% into their bull-market range, while shorts were just 6% in. The most bullish setup occurs when longs are near the bottom of their range and shorts are near the top, leaving ample room for buying. The current configuration is far closer to the opposite—suggesting diminishing upside fuel from U.S. speculators.
That leaves gold’s ability to continue defying a necessary corrective phase largely dependent on China. Unfortunately, reliable, consistent data on Chinese gold markets is scarce, especially in English. Even if such data were available, it would require extensive historical analysis to establish meaningful relationships with price behavior.
Still, anecdotal evidence is abundant. Major financial publications regularly report frenzied gold buying in China. Silver’s recent parabolic surge—largely driven by Chinese demand—appears to have spilled over into gold, fueling enthusiasm both domestically and globally. Without transparent data, Western analysts are left guessing how long this demand can persist.
Cultural factors may offer some clues. In Western markets, gold had long been dismissed as outdated, resulting in minimal portfolio allocations for years. In contrast, gold has always held deep cultural significance in China. Chinese investors therefore began this cycle with far greater enthusiasm, potentially making them more willing to buy aggressively and stay invested longer.
Capital controls also play a role. Chinese investors have limited avenues to diversify wealth outside the domestic financial system, while gold and silver offer a rare escape from policy risk. Additionally, Chinese culture places a stronger emphasis on wealth accumulation and status—traits that can fuel speculative behavior.
These dynamics make China uniquely susceptible to a speculative gold mania. Evidence increasingly suggests one is underway, reinforced by the repeated “China Monday” surges. Yet Chinese markets remain opaque. Financial transparency is limited, economic data series have been quietly discontinued when trends turn unfavorable, and even official gold reserve figures from the People’s Bank of China are widely viewed with skepticism.
For example, China reported identical gold reserves for more than six years before suddenly announcing a 57% jump in a single month—an implausible scenario. Many analysts believe China has accumulated far more gold than officially disclosed for years. If official reserve data lacks credibility, confidence in broader market transparency is equally questionable.
That uncertainty is unsettling. History shows that speculative manias eventually end in sharp, symmetrical collapses once buying power is exhausted. Whether China’s gold frenzy lasts months—or reverses abruptly—is unknowable.
What is clear is that gold’s recent breakout has been almost entirely driven during Chinese trading hours. Since December 19, gold has climbed roughly $487, yet nearly all of those gains occurred on just four “China Mondays.” This concentration of upside is highly abnormal and inherently risky.
Chinese markets have repeatedly demonstrated how quickly sentiment can flip once fear takes hold. Any government action—such as curbing speculative activity—could trigger rapid selling. Without strong participation from U.S. investors or futures traders to absorb that supply, gold could fall sharply.
In short, Chinese trading has seized control of the gold market. After peaking at extreme overbought levels in mid-October, gold required a corrective reset. That process was prematurely halted by surging Chinese demand. With U.S. participation limited and futures buying power fading, gold’s current position is precarious. If Chinese enthusiasm wanes or policy shifts intervene, a forced and potentially violent rebalancing could follow.
Gold vaulted above the psychological $5,000-per-ounce threshold on Monday, building on last week’s explosive rally as investors flocked to the traditional safe haven amid escalating geopolitical risks.
Spot gold climbed 1.1% to a fresh all-time high of $5,035.83 per ounce by 18:52 ET (00:52 GMT), while U.S. gold futures also advanced 1.1% to a record $5,074.71 per ounce.
The precious metal surged more than 8% last week, repeatedly setting new highs, and is now up nearly 17% year-to-date.
The broader precious metals complex also strengthened. Silver jumped over 2% to a record $106.56 per ounce, while platinum edged higher to a new peak of $2,798.46 per ounce.
Gold has climbed sharply since the beginning of the year, supported by geopolitical tensions, expectations of looser U.S. monetary policy later in 2026, and continued buying from central banks and investors hedging against market volatility.
A key catalyst behind gold’s sharp rally this month has been mounting friction between the United States and its NATO partners over Greenland, a dispute that has rattled global markets.
President Trump’s comments on U.S. strategic ambitions in the Arctic have further strained transatlantic ties, fueling fears of wider diplomatic and economic repercussions.
Adding to those geopolitical pressures, Trump escalated trade tensions with Canada over the weekend, warning of a 100% tariff on Canadian imports should Ottawa move forward with a trade agreement with China.
Trump said on his social media platform that Canada could serve as a “drop-off port” for Chinese goods entering the United States, warning that Beijing would “eat Canada alive” if the agreement proceeds.
Fed rate decision in focus
Gold has also found support from expectations around U.S. monetary policy. The Federal Reserve is set to wrap up its policy meeting on Wednesday, with markets broadly expecting officials to leave interest rates unchanged.
Although a hold decision is largely priced in, investors will closely examine the Fed’s statement and remarks from Chair Jerome Powell for signals on the timing and pace of potential rate cuts later this year.
Gold typically benefits from lower interest rates, which reduce the opportunity cost of holding non-yielding assets.
“Both the data and Chair Powell’s strong defence of central bank independence suggest there is little chance of a Fed rate cut on January 28,” ING analysts said in a note.
“Attention will instead turn to President Trump’s forthcoming nomination for the next Fed chair, upcoming economic data, and whether that nominee can steer the committee toward additional rate cuts,” they added.
Gold prices remain firmly in an uptrend and are poised to test the key $5,000 per troy ounce level on Friday. The precious metal’s strong rally accelerates amid mounting US Dollar weakness and mixed US Treasury yields across the curve.
Fundamental Analysis Overview
Expectations of additional monetary easing by the US Federal Reserve (Fed) continue to support demand for the non-yielding yellow metal, even as geopolitical risks have eased following US President Donald Trump’s reversal on Greenland. The bullish momentum also appears largely undeterred by extremely overbought short-term technical conditions, reinforcing the view that Gold’s path of least resistance remains upward.
On Wednesday, Trump announced the cancellation of planned tariffs on European allies related to US control over Greenland, after reaching a preliminary framework with NATO leaders on future Arctic security cooperation. He also dismissed the possibility of taking Greenland by force, encouraging risk appetite. However, the positive market response proved short-lived, as dovish Fed expectations dominated, outweighing Thursday’s US economic data and pushing the US Dollar (USD) back toward its lowest level since January 6, last seen earlier this week.
Data from the US Bureau of Economic Analysis showed that final third-quarter GDP growth came in at 4.4%, marginally above the previous estimate of 4.3% and notably stronger than the 3.8% expansion recorded in the prior quarter. Meanwhile, the Core Personal Consumption Expenditures (PCE) Price Index — the Fed’s preferred inflation measure — rose 2.8% year-on-year in November, up from 2.7%, while the monthly increase remained steady at 0.2%.
Further weighing on the USD, the US Department of Labor reported that initial jobless claims edged up by 1,000 to 200,000 for the week ending January 17, below market expectations of 212,000. Despite the better-than-expected figure, the data failed to offer meaningful support to the greenback amid the broader de-dollarization trend. Investors now turn their attention to upcoming flash PMI releases for insight into global economic conditions, which could influence risk sentiment and shape Gold’s trajectory as it heads toward solid weekly gains.
XAU/USD Technical Analysis
The broader uptrend remains supported by an ascending channel originating from $3,805.69, with XAU/USD now having decisively broken above the channel’s upper boundary around $4,742.80. The Moving Average Convergence Divergence (MACD) remains firmly above the zero line and continues to trend higher, indicating strengthening bullish momentum. Meanwhile, the Relative Strength Index (RSI) stands at 81.25, deep in overbought territory, which may limit immediate upside as momentum becomes stretched.
That said, a sustained hold above the former channel ceiling opens the door for a continuation of the rally toward new highs. On the downside, initial support is seen near the ascending channel’s lower boundary at $4,437.79 should prices consolidate. A flattening MACD would point to fading upside momentum at elevated levels, while a pullback in RSI toward the 70 mark would help ease overbought conditions and reinforce trend stability. A failure to defend the breakout zone could trigger a move back into the previous range, whereas continued momentum would keep bullish control intact.
Gold prices climbed to an all-time high during Asian trading on Friday, edging closer to the widely monitored $5,000-per-ounce mark after U.S. President Donald Trump said American ships had been deployed toward Iran, boosting demand for safe-haven assets.
Silver and platinum also reached record levels on Friday. Although precious metals eased slightly after Trump announced a trade agreement involving Greenland, continued uncertainty over the deal and heightened tensions with Iran sustained investor demand for safe havens.
Spot gold climbed as much as 0.7% to a new record of $4,967.48 an ounce, while February gold futures advanced more than 1% to $4,969.69 per ounce.
Spot silver surged almost 3% to an all-time high of $99.0275, and spot platinum gained nearly 1% to reach a record peak of $2,692.31 per ounce.
Trump says a large U.S. naval “armada” is being sent toward Iran as tensions escalate
Speaking to reporters aboard Air Force One on Thursday night, Trump said the United States had dispatched a naval fleet toward Iran, warning Tehran against harming protesters or resuming its nuclear program.
“We have an armada moving in that direction, and hopefully it won’t need to be used,” Trump said, adding that he would prefer to avoid any escalation. According to reports, a U.S. aircraft carrier along with several destroyers is expected to arrive in the Middle East in the coming days.
Earlier in January, Trump had warned Tehran against the killing of protesters as Iran faced nationwide demonstrations against the Nezam.
However, although he later softened his tone toward Iran, Trump’s remarks on Thursday reignited concerns about the possibility of U.S. military intervention in the Middle East.
Gold and metals post strong start to 2026
Metal markets surged through January as escalating geopolitical risks drove investors toward physical safe-haven assets. A U.S. military move into Venezuela early in the year, along with Trump’s threats related to Greenland, boosted demand for low-risk investments.
So far in 2026, spot gold has risen nearly 15%, while silver has jumped close to 39% and platinum has gained about 21%.
A weaker U.S. dollar has also supported metal prices, as mixed economic signals fueled expectations that the Federal Reserve will cut interest rates later this year. The Fed is set to meet next week and is widely expected to keep rates unchanged for now.
Trump’s criticism of the Fed further lifted safe-haven demand, alongside growing concerns about worsening fiscal conditions in developed economies, particularly Japan. Sharp sell-offs in Japanese and U.S. government bonds in recent weeks have prompted investors to rotate into gold.
Gold prices edged lower in Asian trading on Thursday after touching a record high near $4,900 an ounce in the prior session, as U.S. President Donald Trump’s retreat from tariff threats linked to Greenland tensions dampened safe-haven demand. Spot gold declined 0.7% to $4,799.55 an ounce by 20:36 ET (01:36 GMT), after hitting a record peak of $4,888.1 an ounce a session earlier. March U.S. gold futures also slipped 0.8% to $4,801.75 an ounce.
Gold jumped on Wednesday as geopolitical tensions intensified following a transatlantic dispute over Greenland and threats of tariffs on European imports. The rally earlier this week lifted bullion close to the psychological $5,000 level, with investors seeking a safe haven amid heightened global uncertainty.
Prices later pulled back after President Trump, speaking at the World Economic Forum in Davos, said he would refrain from imposing the tariffs and ruled out the use of force in the dispute over the Danish territory. He added that a “framework” agreement was taking shape to ease tensions with NATO allies.
“It’s a long-term deal — the ultimate long-term deal — and it puts everyone in a very strong position, particularly when it comes to security and minerals,” Trump told reporters. Gold also faced mild pressure from a modest rebound in the U.S. dollar, with the Dollar Index trading slightly higher after rising 0.1% in the previous session.
The modern state increasingly rests on three foundations: debt, fiat currency, and coercive power. Concepts such as “national security” and “critical minerals” have become the latest government talking points, widely promoted and readily accepted by the public. Meanwhile, personal preparedness—once a priority during health crises—has faded from focus, even as harmful consumer habits and ultra-processed foods continue to be normalized and aggressively marketed.
Political leaders often project strength through military posturing and geopolitical confrontation while avoiding personal sacrifice, financing these actions primarily through expanding debt and currency creation. In several regions, power structures are maintained through force, information control, and repression rather than genuine legitimacy or accountability.
Across parts of the world, regimes with deeply troubling records are frequently rebranded as sources of “stability” when it suits geopolitical or economic interests, particularly in energy and resource markets. This pattern underscores a broader contradiction: governments race to announce ambitious initiatives and sweeping strategies, yet largely ignore the importance of real savings and sound money.
Against this backdrop, a growing share of the global population—particularly in Asia, along with a minority of investors in the West—has turned toward long-term wealth preservation through tangible assets such as gold and silver. For those already positioned this way, the erratic behavior and short-term thinking of governments is more a source of frustration than fear.
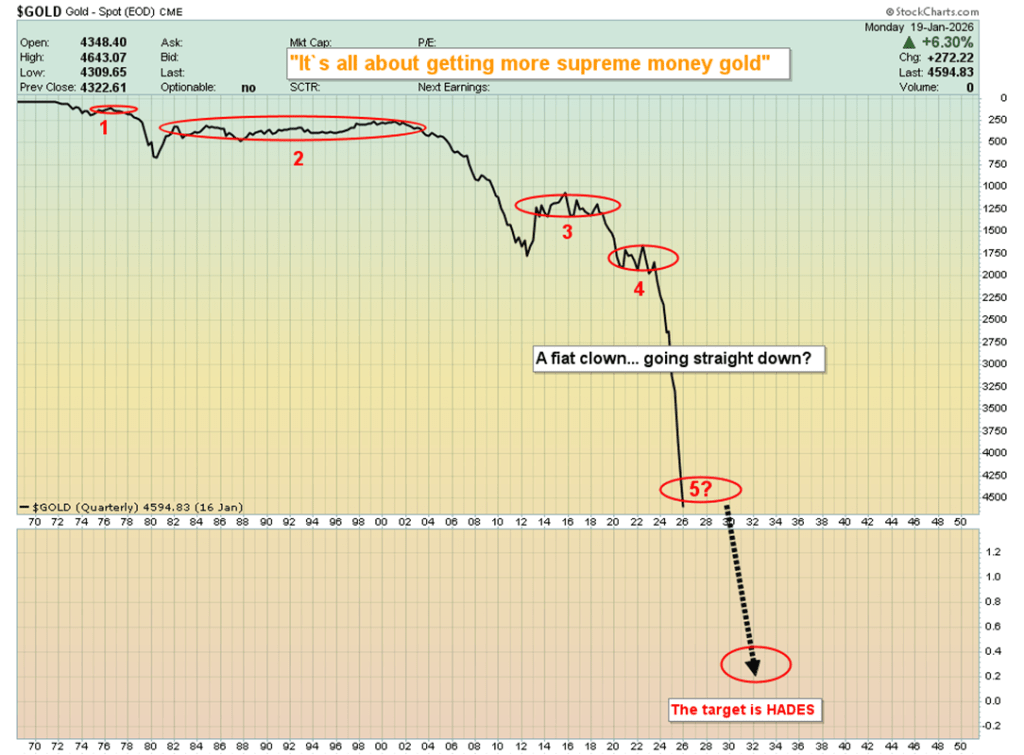
Gold is the currency of independent citizens. While the U.S. dollar is technically due for its fifth cyclical rebound against gold in the past 50 years, that does not mean it must happen immediately—and when it does…. Gold-focused savers should stay prepared to add to their gold holdings—and silver as well.
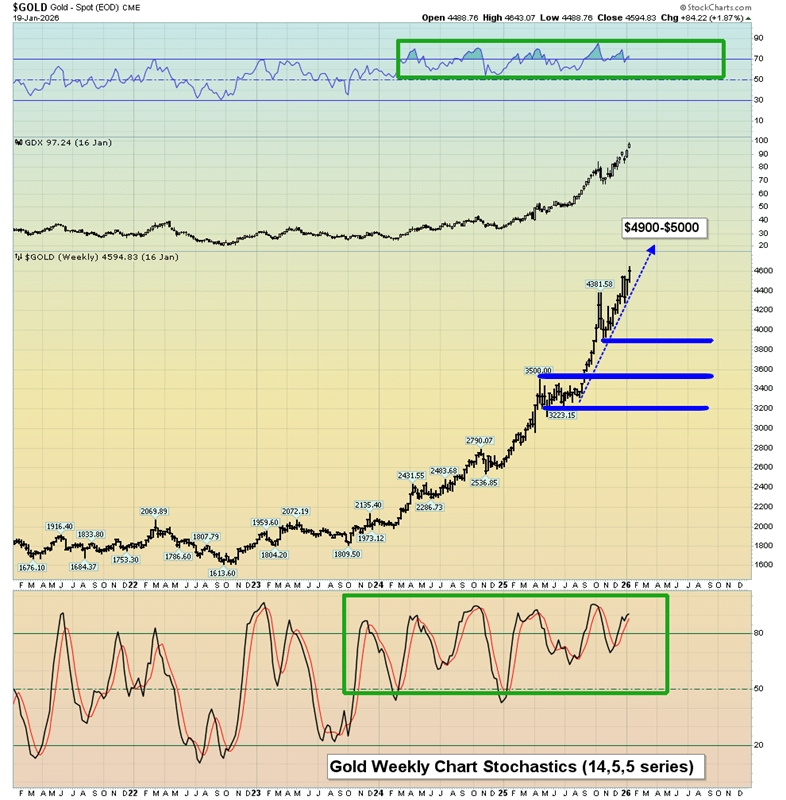
On the weekly chart, gold appears technically overbought, yet its price behavior is beginning to resemble the equity market’s powerful advance in the mid-1990s. Momentum indicators such as RSI and Stochastics are finding support near the 50 level before pushing above 70 and remaining elevated for extended periods—an indication of strong, persistent trends rather than imminent reversals.
Against a backdrop of rising debt, expanding fiat issuance, and escalating geopolitical risks, prominent gold investors such as Pierre Lassonde have projected that gold prices could approach the $20,000 level in the years ahead.
From a portfolio-management perspective, selectively taking profits—up to roughly 30% in many cases—can be prudent, not as a call on a fiat-denominated price peak, but as a way to build liquidity. That capital can then be redeployed during the next meaningful pullback, which is likely to occur at price levels well above today’s.
Psychologically, sharp corrections can be challenging, particularly for investors without available cash. Maintaining some dry powder through partial profit-taking enables investors to add to gold, silver, and mining positions when opportunities arise—this is the primary rationale for trimming exposure now.
Fundamentally, the case for gold remains exceptionally strong. Recent statements suggesting potential military actions involving NATO allies underscore the degree of geopolitical uncertainty. Even without direct conflict, such rhetoric alone could propel gold significantly higher against fiat currencies. In the event of an actual escalation, price moves of $2,000 per ounce—or more—could unfold rapidly.
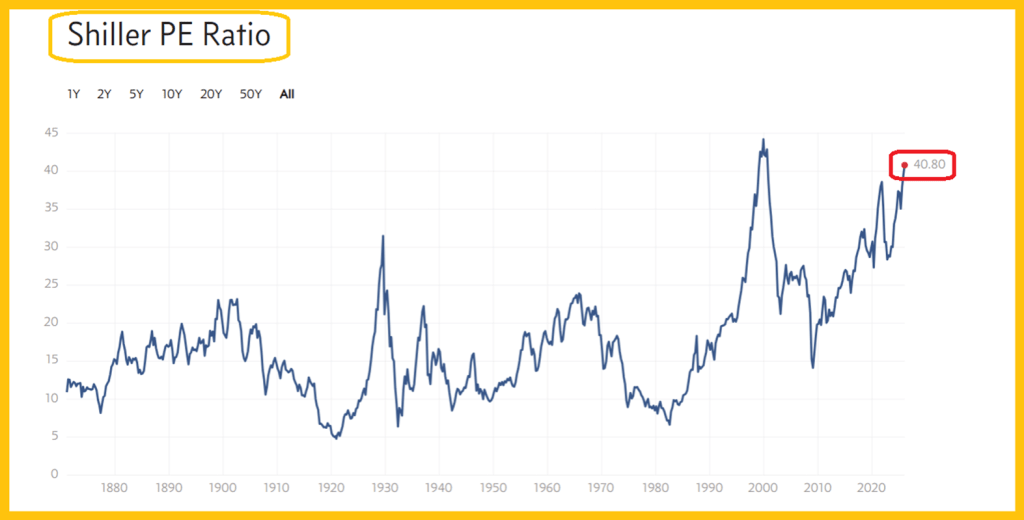
The Shiller (CAPE) ratio—an inflation-adjusted price-to-earnings measure for the S&P 500—highlights the extreme valuation levels currently embedded in U.S equities.
If U.S. policymakers continue to pressure European allies through aggressive tariff measures while openly discussing military options, the resulting backlash could be severe. At some point, a tipping point may be reached, prompting European governments and institutions to rapidly reduce exposure to U.S. government bonds and U.S. equities.
Such a scenario would carry profound risks. Asset freezes or retaliatory measures could follow, severely disrupting global financial markets. Under those conditions, gold could experience explosive upside moves, potentially rising by thousands of fiat-denominated dollars in very short order. At the same time, forced selling from Europe could trigger a rapid collapse in U.S. equity markets, with a speed and scale rivaling—or even exceeding—historic market crashes.
The broader takeaway is that gold increasingly functions as a form of sovereign money for billions of individuals, particularly across Asia, who already view it as a long-term store of value. As pressures build on systems dominated by fiat currency, debt expansion, and coercive policy tools, the resilience of those systems may be tested. Should confidence fracture, the adjustment—especially in the U.S.—could be both abrupt and far-reaching.
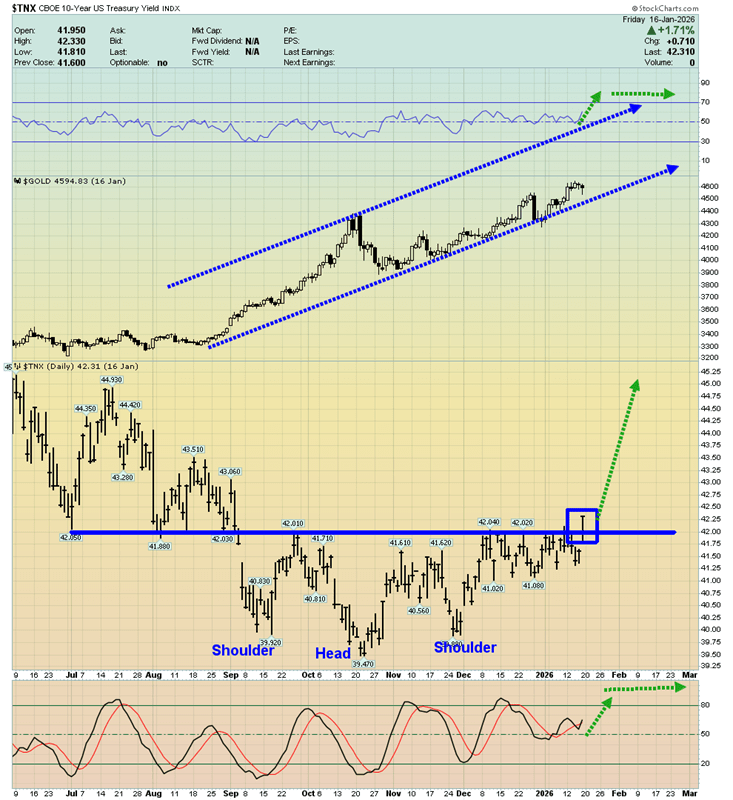
Turning to the 10-year Treasury yield chart, the recent upside breakout carries profound implications for both the U.S. government and gold. For years, the notion of unlimited quantitative easing was promoted as a sustainable solution, but that framework was always unrealistic. Instead, it appears to be giving way to a regime of persistently higher interest rates—and, in parallel, steadily rising fiat-denominated gold prices.
This shift reflects a deeper issue: confidence in governments and their currencies is eroding. As debt burdens expand and monetary credibility weakens, markets are beginning to price in a structural change rather than a temporary cycle. In that environment, higher yields and higher gold prices are not contradictions but complementary signals of systemic stress.
The loss of trust in fiat-based systems is no longer a distant risk; it is an active force shaping global markets—and one that is likely to persist.
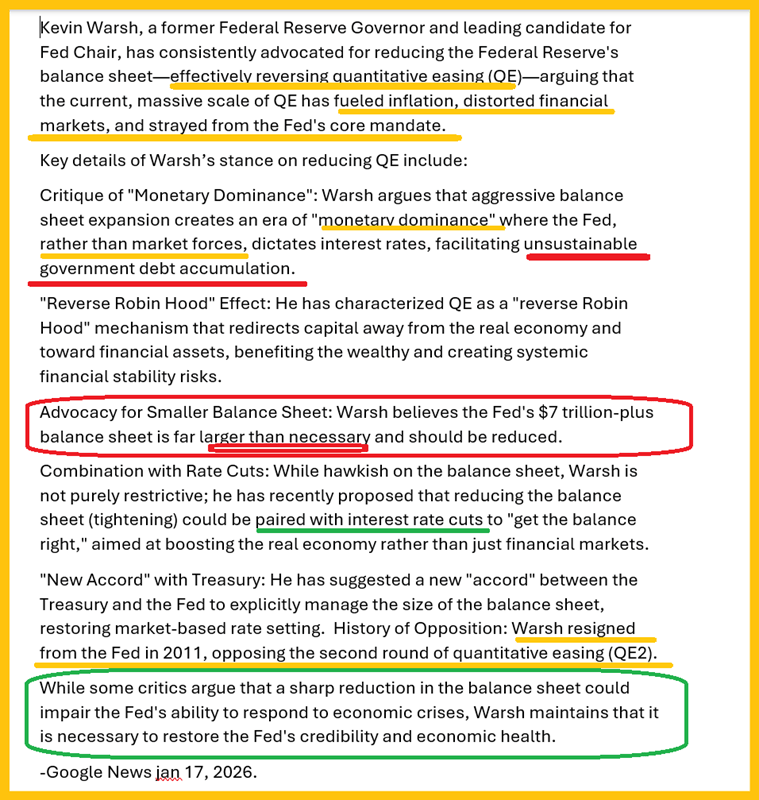
While a new Federal Reserve chair has yet to be appointed, the leading candidate, Kevin, is known to favor aggressive quantitative tightening and has openly described equity markets as severely overvalued. To restore credibility in the U.S. government, its bond market, and the dollar, a substantial and sustained QT program would likely be required.
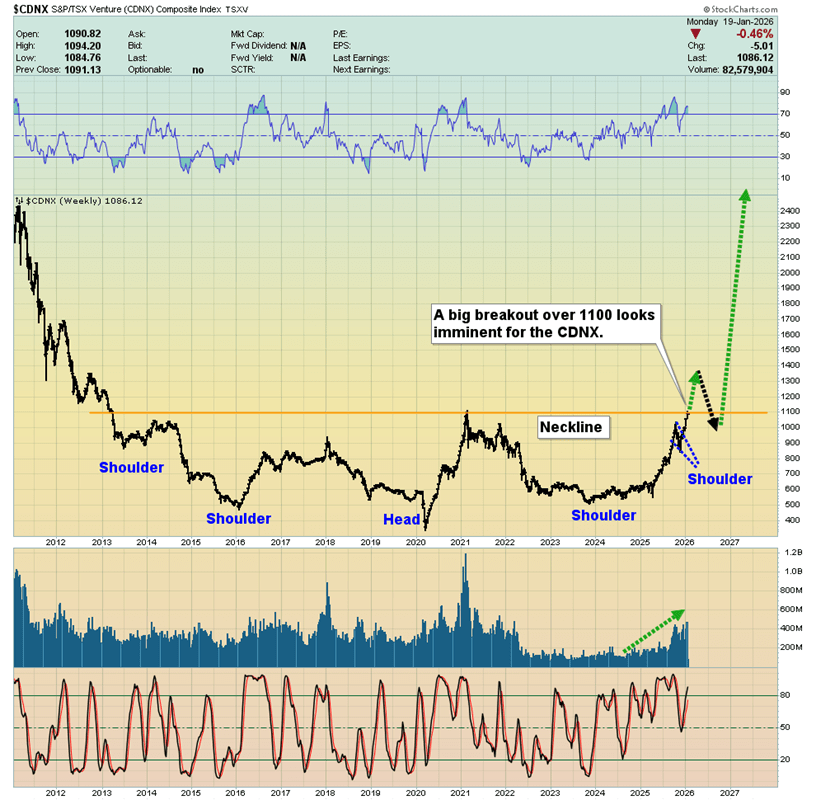
What I continue to regard as one of the most significant base formations in market history is the inverse head-and-shoulders pattern on the CDNX. I have long argued that a breakout from this structure would likely coincide with a major move higher in long-term interest rates, and recent developments suggest that this scenario is unfolding decisively.
My long-term objective for the CDNX stands at 10,000, and well before that level is reached, many junior resource stocks could deliver outsized returns—potentially achieving multi-hundred- or even thousand-fold gains.
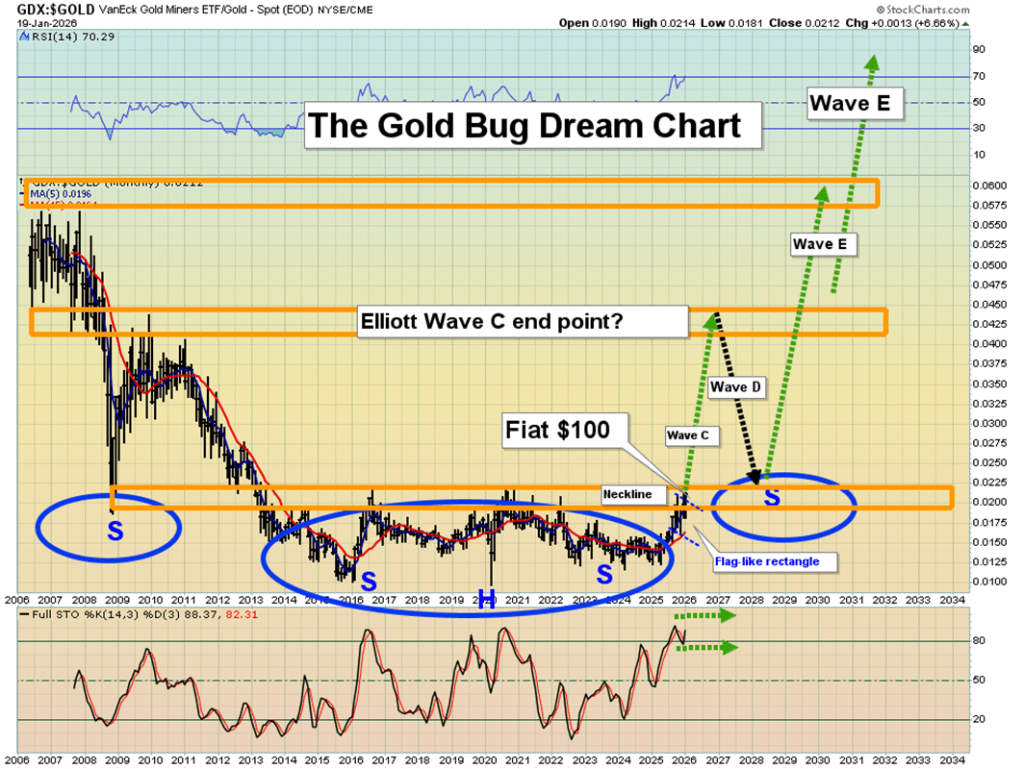
Another chart I encourage investors to monitor closely is the GDX-to-gold ratio. Of particular note is the 14,3,3 Stochastics oscillator at the bottom of the chart. As the upside breakout gains traction and the rally develops, this momentum indicator could remain in overbought territory not merely for months or years, but potentially for an extended secular period.
The broader takeaway is clear: Markets appear to be entering a new phase—one defined by a sustained gold bull cycle. In this environment, informed and disciplined investors stand to benefit the most, as capital increasingly shifts toward real assets and away from fiat-based complacency.
Gold prices declined during Asian trading on Thursday following three days of record-breaking highs, as U.S. President Donald Trump softened his position on the unrest in Iran and Federal Reserve Chair Jerome Powell eased concerns, reducing the demand for gold as a safe haven.
Spot gold was last down 0.8% at $4,588.55 per ounce by 23:04 ET (04:04 GMT), while U.S. Gold Futures fell 0.3% to $34,594.10. In the previous session, gold reached a record peak of $4,642.72 per ounce.
Other precious metals experienced even sharper drops, with silver plunging nearly 6% to $87.74 per ounce and platinum prices falling 4% to $2,309.52 per ounce.
Gold retreats from highs as Trump adopts a milder approach toward Iran
The precious metal had climbed to consecutive record highs amid concerns that escalating unrest in Iran might provoke U.S. military intervention and destabilize the Middle East, along with worries about political pressure on the U.S. Federal Reserve.
Those fears subsided after President Trump indicated a softer approach toward Iran. He stated that he was reassured Iranian authorities would cease killing protesters and expressed his belief that there were no plans for large-scale executions at this time.
His remarks lowered the chances of an immediate U.S. military response to the protests against the government of Supreme Leader Ayatollah Ali Khamenei, easing the geopolitical tensions that had driven gold’s recent surge.
Trump states there is no intention to dismiss Fed Chair Powell.
Gold prices also came under pressure after Trump attempted to ease worries about the Federal Reserve. In an interview with Reuters, he stated that he had no plans to remove Federal Reserve Chair Jerome Powell, despite ongoing investigations, which helped to alleviate investor concerns about the independence of U.S. monetary policy.
The recent decline in gold was partly due to profit-taking following its rapid rise, which pushed prices well beyond key technical levels.
Despite Thursday’s drop, gold remained supported by expectations of U.S. interest rate cuts later this year, ongoing geopolitical tensions, and robust central bank purchases.
Lower interest rates generally benefit gold by decreasing the opportunity cost of holding a non-yielding asset.
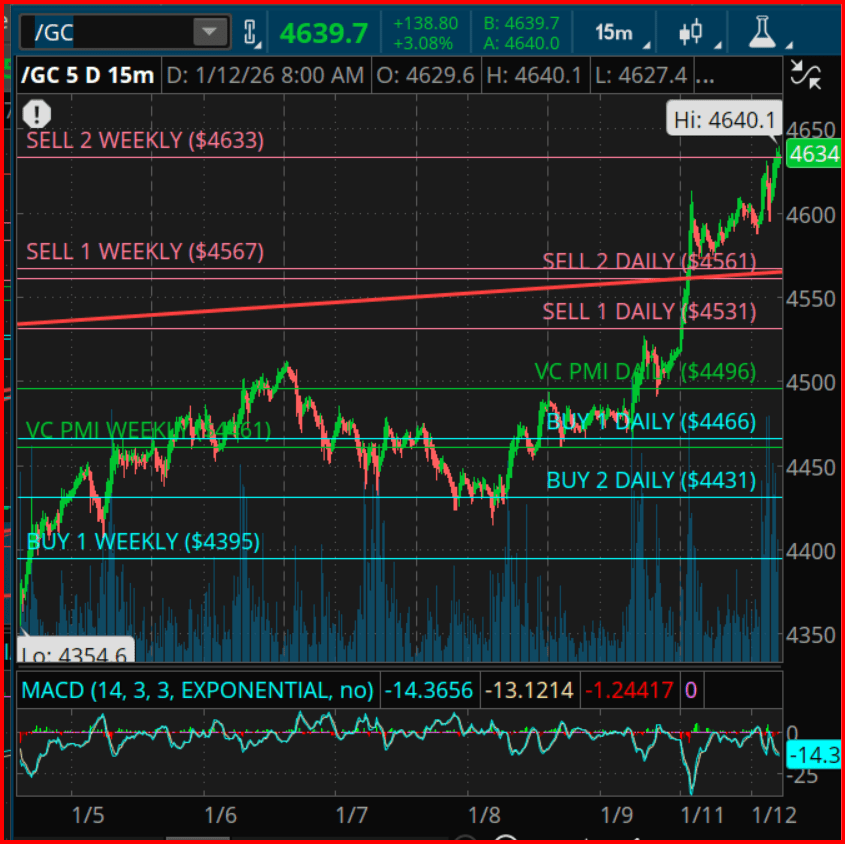
Gold futures have entered a crucial expansion phase, with prices accelerating beyond key VC PMI levels on both daily and weekly charts, indicating momentum-driven growth rather than a mean-reversion scenario. The 15-minute /GC chart shows prices breaking through the VC PMI Daily Mean near $4,496 and pushing above the Sell 1 Daily level at $4,531, confirming robust upward price acceptance. Such moves typically happen when price action and timing converge, creating what traders call “escape velocity.”
According to the VC PMI framework, the market is currently trading near the upper probability band, approaching Sell 2 Daily around $4,561 and Sell 1 Weekly near $4,567, with Sell 2 Weekly projected at about $4,633. Historically, these levels mark significant zones of exhaustion or pause, where momentum traders tend to take profits and the risk of mean reversion rises. Although strong trends can push prices beyond these points, the odds favor increased volatility followed by consolidation once these upper bands are tested.
Time cycle analysis highlights the significance of the present period. The current advance is reaching a short-term cycle peak that aligns with the mid-January rhythm, typically linked to sharp intraday moves and heightened emotional trading. When price momentum accelerates into a cycle window while nearing VC PMI sell bands, markets often shift from trend continuation to sideways rotation. This doesn’t signal a major top but does indicate a high-risk zone for initiating new long positions, emphasizing the need for disciplined trade management.
From the Square of 9 perspective, the current price range corresponds with significant harmonic rotations stemming from previous major swing lows. The $4,560–$4,640 zone marks an important angular relationship where price, time, and geometric factors intersect. Such geometric convergence points often serve as critical decision areas, influencing whether the market pauses, pulls back to the VC PMI mean, or accelerates into a larger upward move.
In summary, gold maintains its bullish structure but is currently trading within a statistically and geometrically significant high zone. Traders are advised to focus on risk management, gradually take profits, and consider the likelihood of mean reversion around the VC PMI levels, while closely watching cycle developments to confirm whether the trend will continue.
Gold has drawn buyers for the third consecutive day, supported by escalating geopolitical tensions that increase safe-haven demand.
Worries over the Federal Reserve’s independence are weighing on the US Dollar, providing additional support to the XAU/USD pair.
However, diminished expectations for further Fed rate cuts could limit gold’s upside ahead of important US inflation data.
Gold (XAU/USD) continues to trade with a bullish bias near record levels, holding just under the $4,600 mark reached earlier this week as investors seek safety amid persistent geopolitical tensions and concerns about the Federal Reserve’s independence. Escalating unrest in Iran and broader global risks have kept safe‑haven demand elevated, supporting bullion’s strong performance.
At the same time, worries over the U.S. central bank’s autonomy have weighed on the U.S. Dollar, encouraging flows into non‑yielding assets like gold. However, expectations that rate cuts may be less aggressive could temper upside momentum ahead of key U.S. inflation data due out this week.
Daily Market Movers: Gold Boosted by Safe-Haven Appeal and Softening USD
Following a significant U.S. operation in Venezuela earlier this month, President Donald Trump announced that Washington would oversee the country’s administration during a transitional period after Venezuelan leader Nicolás Maduro was captured — even posting an image on social media depicting himself as the “Acting President of Venezuela.”
Geopolitical risks remain elevated globally. Protests in Iran, which have resulted in hundreds of deaths, continue to unsettle markets, while the ongoing Russia–Ukraine conflict — including confirmed strikes on Russian oil infrastructure — adds further supply‑side pressure.
In Asia, rising tensions between China and Japan have intensified after Beijing restricted exports of rare earths and rare‑earth magnets in response to Tokyo’s recent political remarks. These developments have helped push gold toward fresh all‑time highs as investors seek safe‑haven assets.
On the monetary policy front, U.S. Federal Reserve Chair Jerome Powell has defended the central bank’s independence after threats of a criminal indictment linked to a Senate testimony, emphasizing that rate‑setting should be based on economic evidence rather than political pressure.
Recent U.S. jobs data showed a smaller‑than‑expected increase in nonfarm payrolls and a falling unemployment rate, which has tempered expectations for aggressive rate cuts by the Fed this year — a factor that has weighed on the U.S. dollar and supported flows into gold.
With no major U.S. economic data scheduled for Monday, markets are likely to remain sensitive to comments from Federal Open Market Committee (FOMC) members, while this week’s U.S. inflation figures will be a key focus for traders.
Gold’s Technical Outlook Remains Bullish Despite Overbought RSI Signals
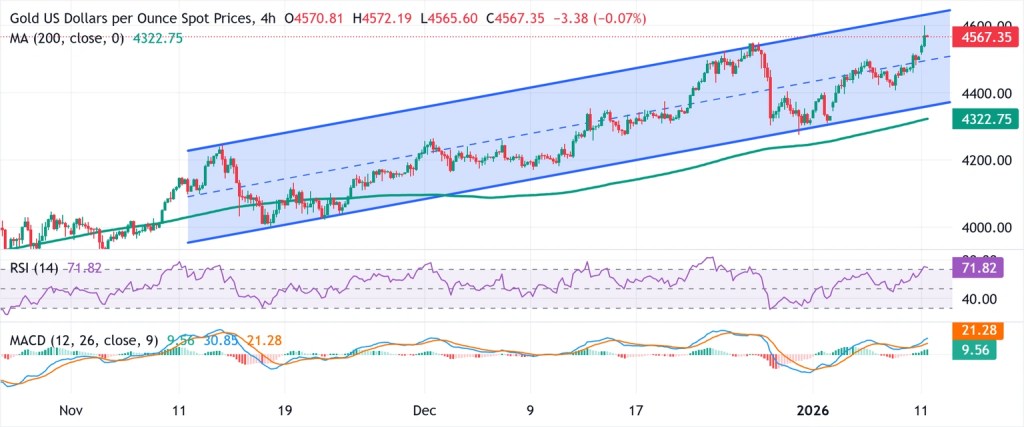
From a technical standpoint, gold’s recent rise over the past month has formed an upward-sloping channel, signaling a solid short-term uptrend that supports bullish momentum for XAU/USD. The price remains above the ascending 200-period Simple Moving Average (SMA), reinforcing the positive trend and providing dynamic support near the $4,320–$4,325 zone.
The MACD indicator shows the line staying above the Signal line in positive territory, with an expanding histogram indicating strengthening bullish momentum.
However, the Relative Strength Index (RSI) at 71.82 suggests overbought conditions, which could limit immediate upside and lead to some consolidation near the channel’s upper boundary.
Any pullback is likely to find support near the channel’s lower boundary around $4,365, with the rising 200 SMA further underpinning the overall bullish outlook. Maintaining momentum above these support levels would keep the upward trend intact, while a decisive break above the channel resistance could trigger a fresh rally toward higher levels.
Reflecting on the start of this century, the first striking observation is our national shortsightedness. After surviving Y2K and the dot-com crash in 2000, our leaders assumed the path ahead would be smooth sailing from year one onward.
However, reality proved otherwise, beginning with a series of black swan events, notably the attacks on the World Trade Center and Pentagon on September 11. While such events are inherently unpredictable, it’s remarkable that the Congressional Budget Office (CBO) economists confidently forecasted in 2001 a future of continuous budget surpluses, anticipating the complete elimination of national debt by 2011.
For reasons unknown, the CBO issues 10-year federal spending and revenue projections, despite having no solid factual or practical foundation to accurately forecast beyond a year or two—akin to trying to predict the weather a year in advance.
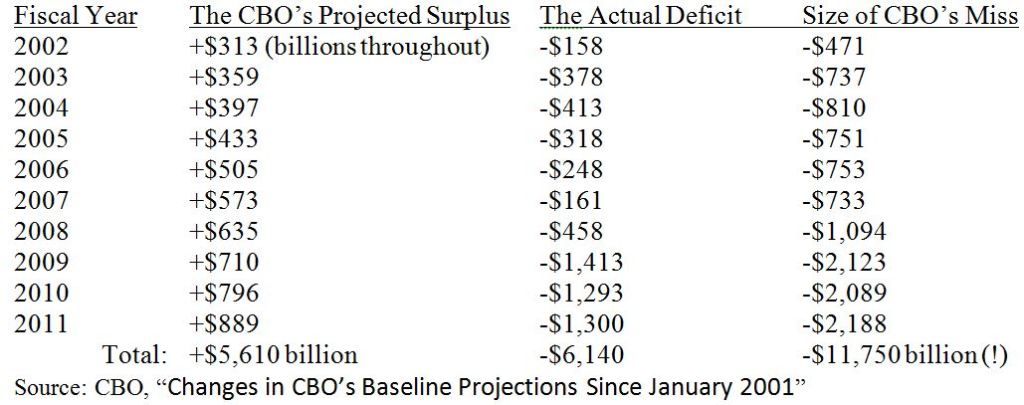
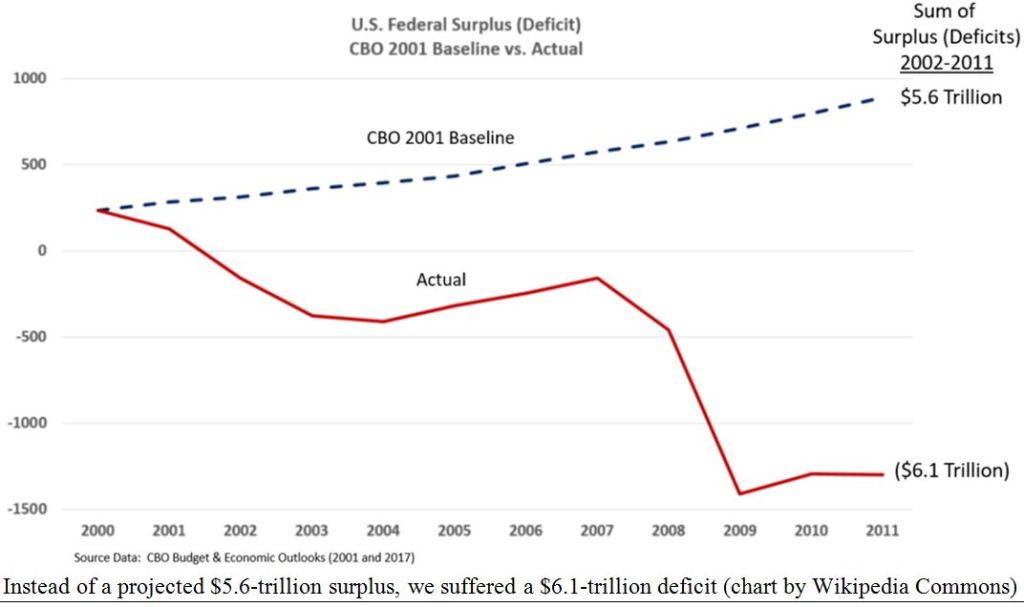
The January 2001 CBO report highlights this myopia. Their projections simply extended current trends indefinitely without grounding in reality. Under this unrealistic mandate, the CBO projected a cumulative surplus of $5.6 trillion for 2002–2011.
In reality, deficits over that decade totaled $6.1 trillion—a swing of $11.7 trillion. It would have been much simpler to just flip a plus sign to a minus. The projections failed to account for the soaring costs of Bush’s “War on Terror” post-9/11, which led to prolonged wars in Afghanistan and Iraq, the bursting of the real estate bubble, and massive TARP bailouts to rescue large banks.
In short, this is a summary of CBO’s flawed foresight:
The first takeaway from this bleak forecast is that the CBO economists assumed deficits would increase in a smooth, predictable fashion—almost as if they were drawing a straight line with minor fluctuations, rather than reflecting the unpredictable realities of economic growth.
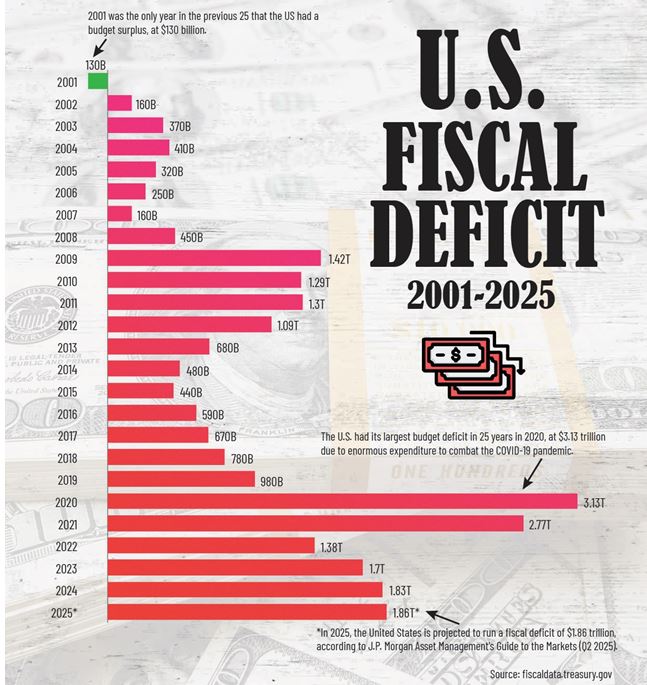
A second point is that the 2003 Bush tax cuts were not the main driver of the deficits. In fact, annual deficits dropped significantly—from $413 billion in fiscal year 2004 (which began October 1, 2003) to just $161 billion in fiscal year 2007. This means the deficit shrank by more than half during the four years following the tax cuts and before the 2007 real estate crash.
While much of this now feels like distant history, the ongoing wars and the Federal Reserve’s drastic response to the 2008 financial crisis—keeping interest rates near zero for eight years, essentially through the entire Obama administration—contributed to massive deficits that have persisted through to today, especially in the five years following the COVID-19 pandemic.
Since 2001, U.S. federal deficits have averaged about $1 billion annually, but that figure has surged to over $2 trillion per year since 2020, according to the U.S. Treasury.
Today, the total federal deficit stands at $38 trillion, which amounts to roughly $110,000 owed per American—far from the anticipated surpluses once projected.
Following a Challenging 2000–2009, Markets Surged in the First Quarter
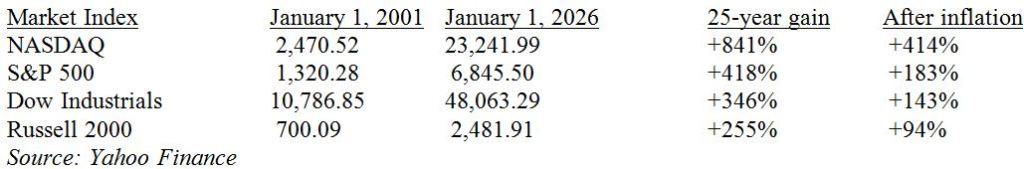
What about the markets? After nearly a “lost decade” lasting nine years from March 2000 to March 2009, all major market indexes have experienced remarkable growth—particularly gold relative to the U.S. dollar.
By March 9, 2009, three of the four major indexes—the S&P 500, NASDAQ, and Russell 2000—had fallen by 50% since the decade began (while the Dow was down 40%), but they bounced back strongly from 2009 through 2025:
Over the same 25-year period, the Consumer Price Index (CPI) increased by 83%, which means the real market gains were somewhat diminished.
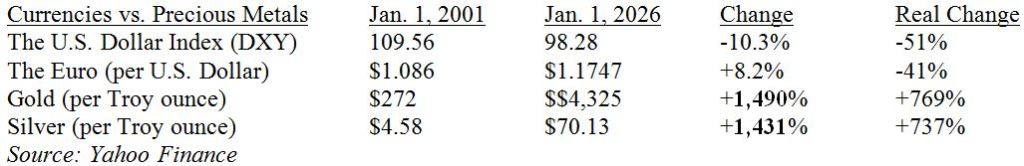
The U.S. dollar performed even worse, losing about 10% in value overall (and 8% against the euro), while gold and silver surged more than 15 times in value:
The first-quarter returns were decent, but the strong performance of gold and silver signals that the dollar—and the CBO’s deficit forecasts—cannot be relied on in the long run. In fact, President Trump has set a goal for 2026 to deliberately weaken the dollar against the Chinese yuan to “help” exporters boost overseas sales. Much of the talk about the dominance of the “King Dollar” is just rhetoric. In reality, many politicians aim to devalue their currencies to encourage trade, turning paper money into a “race to the bottom,” while gold quietly holds its value, watching from the sidelines.
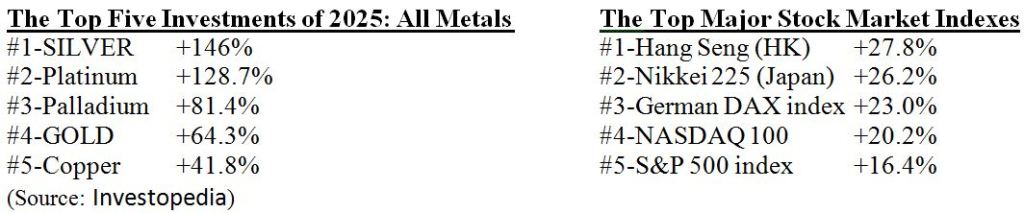
This brings us to the 2025 summary—a major victory for precious metals as the dollar dropped by 10%.
2025 Brought Massive Gains for Precious Metals
The year 2025 exemplified the key trends seen over the past 25 years—while the stock market continued to climb, gold and silver surged even faster. Although inflation is easing, gold today serves less as an inflation hedge and more as a safeguard against crises, a hedge against the dollar, and increasingly, a hedge against cryptocurrency volatility.
In 2025, the U.S. Dollar Index (DXY) dropped by 10%, allowing major global currencies to gain between 5% and 15%. Meanwhile, the poorest-performing investments of 2025 brought good news for consumers through lower food and energy prices:
So, if 2026 mirrors the gains of 2025, it will surely be a rewarding year for most investors.
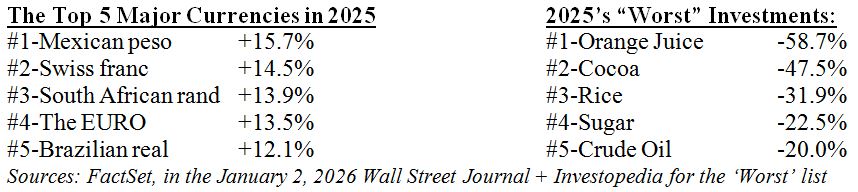
Gold has recovered most of the losses it experienced during a steep decline in late October, climbing back to record levels by the end of December.
The precious metal hit a new all-time peak on December 29, marking its best year since 1979 with a 64% rise in 2025 and an increase of nearly 140% since early 2023.
“Gold hit new record highs in late December, fueled by demand for tangible assets amid a weak US dollar, geopolitical tensions, uncertainty among institutions, and low seasonal liquidity,” UBS strategists led by Giovanni Staunovo stated in a report.
Despite the magnitude of the recent rally, UBS maintains that the fundamental conditions continue to support further gains in gold for 2026. The strategists highlight a significant drop in U.S. real interest rates, which they describe as “the opportunity cost of holding non-yielding assets like gold,” currently at its lowest point since mid-2023.
Additionally, demand from both investors and central banks remains close to record levels, while ongoing concerns about rising government debt in advanced economies continue to boost gold’s appeal as a store of value. These factors collectively support expectations for new record highs next year.
“Our outlook for gold remains positive,” the strategists stated, having recently increased their gold price target for March 2026 to $5,000 per ounce.
“We believe gold’s function as a diversifier and hedge remains strong. For investors who favor this asset class, we recommend a mid-single-digit allocation to gold within a diversified portfolio,” they added.
Recent geopolitical developments have strengthened gold’s reputation as a safe-haven asset. UBS pointed out the unexpected U.S. military capture of Venezuelan President Nicolas Maduro last weekend, which caused widespread market reactions.
The bank also notes that ongoing structural demand trends continue to support gold. UBS strategists anticipate central bank gold purchases will total between 900 and 950 metric tons in 2025, just shy of the previous year’s record.
They project total global gold demand to reach approximately 4,850 metric tons, which would be the highest since 2011.
In addition, UBS highlights the sharp increase in government debt among advanced economies, expected to hit around 110% of GDP this year—up from about 75% twenty years ago—and forecasted to rise to about 118% by the decade’s end, according to the International Monetary Fund.
Separately, HSBC commodity strategists predict gold prices could reach $5,000 as early as the first half of 2026.
“We expect prices to trade at or near $5,000 per ounce in the first half of 2026. However, it is possible that the rally may lose momentum as the year progresses,” strategist James Steel wrote in a note.
Gold held steady as traders balanced a stronger dollar with upcoming U.S. economic data on Friday that could influence this year’s interest rate policy.
Gold hovered around $4,465 an ounce, up 3.4% for the week through Thursday, but faced some selling pressure after U.S. initial jobless claims for the week ending January 3 came in slightly below expectations. Meanwhile, the Bloomberg Dollar Spot Index, which measures the strength of the U.S. dollar, has risen 0.5% so far this year, making gold more costly for many buyers.
The December jobs report due Friday is expected to provide insight into whether the Federal Reserve will pursue additional interest rate cuts following three consecutive reductions in 2025. While nonfarm payrolls are forecasted to show stronger job growth, the unemployment rate is expected to remain steady—mixed signals that may reduce the likelihood of the Fed accelerating further rate cuts.
Gold just completed its strongest annual gain since 1979, surging about 65% last year and hitting a record high of $4,549.92 in late December. The powerful rally was driven by central bank purchases and increased investment in exchange-traded funds, fueled by the “debasement trade.” Additionally, lower borrowing costs—beneficial for non-yielding assets like gold—have further propelled its rise.
Traders are closely monitoring the upcoming selection of a new Federal Reserve chair. Treasury Secretary Scott Bessent indicated that President Donald Trump is expected to make a decision this month regarding Jerome Powell’s successor, as Powell’s term concludes in May. According to Bessent, four candidates are currently being considered.
Gold continued its strong rally in Asian trading on Tuesday, moving back toward record territory as rising geopolitical tensions after a U.S. strike on Venezuela boosted safe-haven demand for the metal.
Spot gold inched up 0.2% to $4,458.20 an ounce at 01:22 ET (06:22 GMT), while U.S. gold futures gained 0.4% to $4,469.10 per ounce.
Bullion had jumped 2.7% in the previous session—its biggest one-day advance in weeks—as investors sought refuge in precious metals amid growing global market uncertainty.
Although prices reached a record high of $4,549.71 per ounce last week before retreating on profit-taking, gold has since recovered and is again trading close to those peak levels.
Gold jumps as U.S. action in Venezuela and Fed rate-cut expectations fuel demand
The surge was mainly sparked by events in Venezuela, where U.S. troops carried out a surprise operation over the weekend that led to the arrest of President Nicolás Maduro, sharply intensifying geopolitical risks and unsettling commodity markets.
Officials said Maduro was taken to the United States to face long-standing narcotics-related charges and entered a not-guilty plea in a New York court on Monday.
According to Reuters, U.S. President Donald Trump is preparing to meet with executives from major American oil companies to discuss measures to increase Venezuela’s oil output.
Expectations of prolonged geopolitical tensions and potential policy changes have further strengthened gold’s role as a hedge against market volatility.
Gold also drew support from growing expectations that U.S. interest rates will continue to decline in 2026.
Markets are now factoring in two additional Federal Reserve rate cuts this year, an environment that typically benefits non-yielding assets like gold.
On Monday, Minneapolis Fed President Neel Kashkari noted that U.S. inflation has been easing gradually, strengthening the view that the central bank could have room to ease policy if price pressures keep moderating.
Investors are closely tracking upcoming U.S. economic data for further signals on the Fed’s policy direction. December’s nonfarm payrolls report, due Friday, is expected to be a crucial gauge of labor market strength and could shape rate expectations in the months ahead.
Silver and platinum climb as copper sets a new record
Other precious and industrial metals also traded firmly higher on Tuesday.
Silver surged 3% to $78.78 an ounce, while platinum gained 2% to $2,331.25 per ounce.
On the London Metal Exchange, benchmark copper futures rose 2.2% to a record $13,331.0 per ton. U.S. copper futures also advanced 1.5% to $6.07 a pound, marking their highest level on record.
According to ING analysts, copper’s continued rally has been driven by disruptions to mine supply and shifts in trade flows caused by tariffs imposed by U.S. President Trump.
Financial markets extended the holiday-thinned mood on the first trading day of the new year, with investors largely staying on the sidelines. Markets remain in a wait-and-see mode ahead of a data-heavy week.
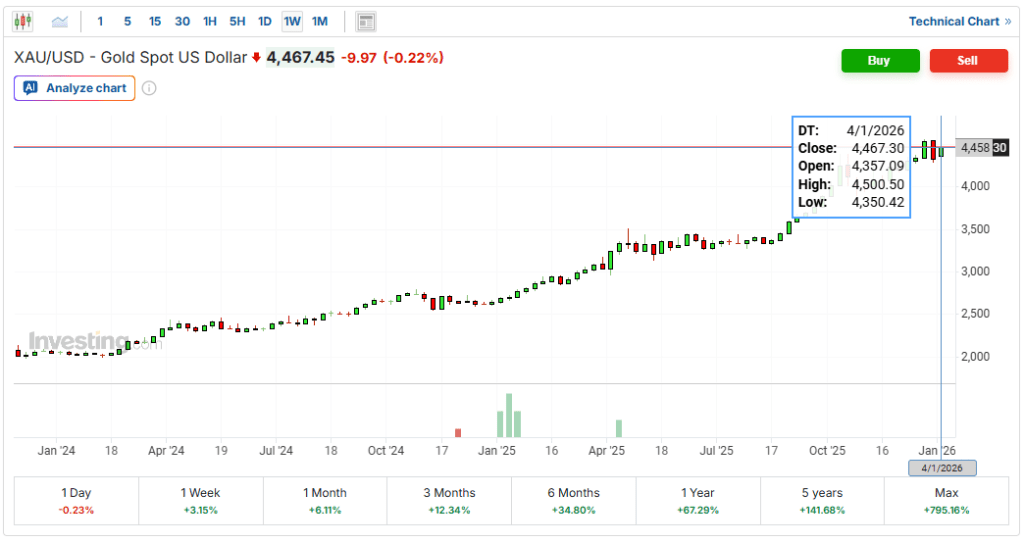
The US Dollar Index (DXY) traded near the 98.40 area on Friday, paring a significant portion of its New Year losses.
Gold (XAU/USD) traded around the $4,320 level, surrendering all intraday gains following the New Year’s break. Expectations of lower US interest rates and elevated geopolitical tensions have continued to support precious metals in recent sessions.
EUR/USD hovered near 1.1740 after edging lower earlier in the week, remaining under pressure as investors await upcoming economic data.
GBP/USD traded close to the 1.3480 area, little changed during the first US session of the year.
USD/JPY hovered around the 156.50 region, trading slightly lower on the day with limited intraday movement.
AUD/USD traded near the 0.6690 area on Friday, posting modest gains after paring nearly half of its intraday advance.
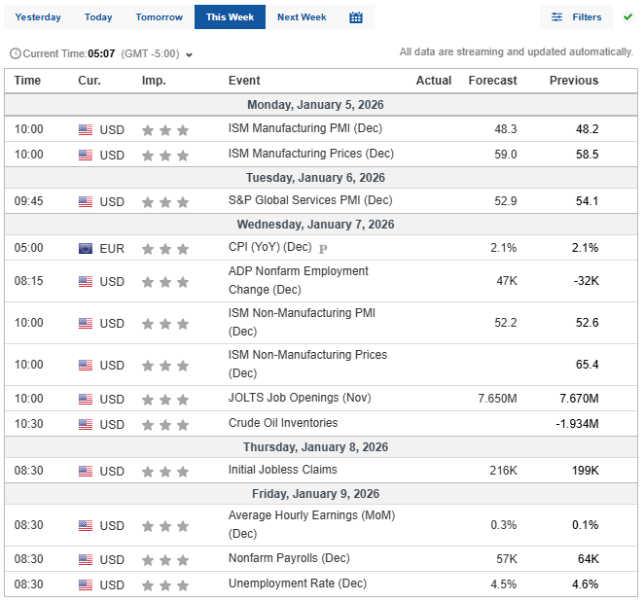
Key Economic Data Ahead: Upcoming Releases Set to Shape Market Sentiment
Over the coming days, investors will closely watch US employment figures and global inflation data, which are expected to influence central bank policies.
Monday: The US Institute for Supply Management (ISM) releases the Manufacturing Purchasing Managers’ Index (PMI) for December.
Tuesday: Germany’s Harmonized Index of Consumer Prices (HICP) and Australia’s Consumer Price Index (CPI) are scheduled for publication.
Wednesday: The US ADP Employment Change report (December), ISM Services PMI (December), and the preliminary Eurozone HICP (December) will be released.
Thursday: The US Trade Balance for October and Consumer Credit data for November are due.
January 9: The highly anticipated US Nonfarm Payrolls (NFP) report for December and the preliminary January Michigan Consumer Sentiment Index will be published.
These releases are expected to set the tone for market direction and provide clues on the pace of monetary tightening by major central banks.