Gold prices tumble toward $5,180 despite the ongoing conflict in the Middle East. Tehran has stepped up military operations near the Strait of Hormuz in retaliation against the United States, escalating regional tensions. At the same time, stronger-than-expected US factory inflation data has prompted traders to scale back expectations of near-term Federal Reserve rate cuts.
During Tuesday’s European session, XAU/USD declined roughly 2.5% to trade near $5,180. The pullback follows four consecutive days of gains, including a sharp rally on Monday when investors sought safe-haven assets amid intensifying geopolitical risks.
Over the weekend, the United States and Israel carried out coordinated airstrikes on Iran, reportedly eliminating several senior leaders, including Supreme Leader Ayatollah Ali Khamenei.
In response, Tehran shut down the Strait of Hormuz and launched attacks on Israeli territory as well as multiple US military installations across the region. Earlier Tuesday, Iranian forces also targeted the US Embassy in Riyadh using drones.
Although gold typically benefits from heightened geopolitical uncertainty, the metal has come under pressure as expectations for a dovish Federal Reserve have moderated. According to the CME FedWatch Tool, the probability that the Fed will keep interest rates unchanged at its June meeting has risen to 53.5%, up from 42.7% on Friday.
Traders reassessed their rate-cut expectations following Monday’s release of the US ISM Manufacturing Prices Paid index for February. The inflation gauge, which measures changes in input costs such as labor and raw materials, surged to 70.5—well above forecasts of 59.5 and the prior reading of 59.0—signaling stronger price pressures at the factory level.
Gold (XAU/USD) 4-Hour Chart Analysis
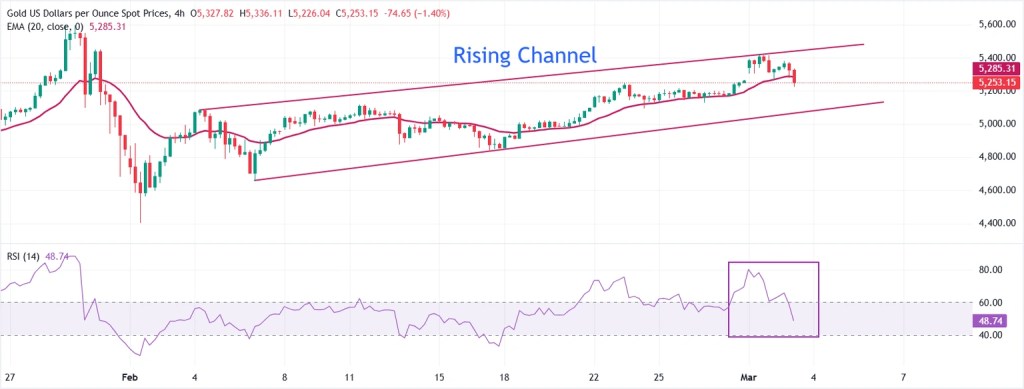
XAU/USD is trading below $5,200 at the time of writing. The short-term outlook has shifted to neutral with a bearish bias after the pair retreated from the upper boundary of its Rising Channel formation near $5,400 and moved back toward the 20-period Exponential Moving Average (EMA), currently positioned around $5,280.
Momentum indicators reinforce the weakening bullish tone. The 14-period Relative Strength Index (RSI) has fallen sharply from overbought territory above 80 to approximately 49, signaling a clear loss of upside momentum and diminishing buying pressure.
On the downside, immediate support is located near $5,065, aligning with the lower boundary of the Rising Channel. A decisive break beneath this level could expose the psychological $5,000 mark. Conversely, on the upside, the upper boundary of the Rising Channel remains the primary resistance zone, just above $5,400.
Sources: Sagar Dua

Leave a comment