Reflecting on the start of this century, the first striking observation is our national shortsightedness. After surviving Y2K and the dot-com crash in 2000, our leaders assumed the path ahead would be smooth sailing from year one onward.
However, reality proved otherwise, beginning with a series of black swan events, notably the attacks on the World Trade Center and Pentagon on September 11. While such events are inherently unpredictable, it’s remarkable that the Congressional Budget Office (CBO) economists confidently forecasted in 2001 a future of continuous budget surpluses, anticipating the complete elimination of national debt by 2011.
For reasons unknown, the CBO issues 10-year federal spending and revenue projections, despite having no solid factual or practical foundation to accurately forecast beyond a year or two—akin to trying to predict the weather a year in advance.
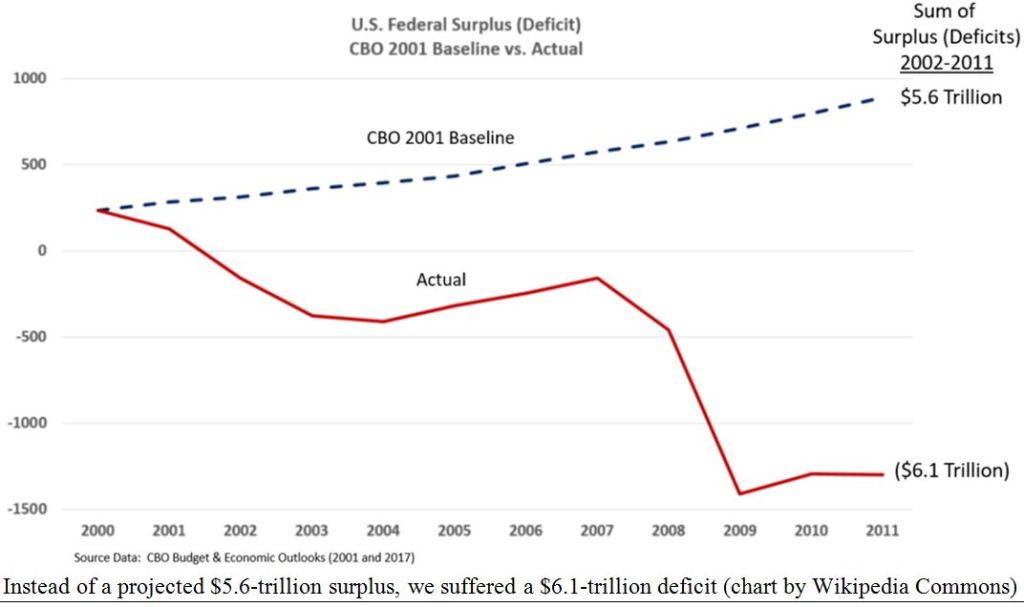
The January 2001 CBO report highlights this myopia. Their projections simply extended current trends indefinitely without grounding in reality. Under this unrealistic mandate, the CBO projected a cumulative surplus of $5.6 trillion for 2002–2011.
In reality, deficits over that decade totaled $6.1 trillion—a swing of $11.7 trillion. It would have been much simpler to just flip a plus sign to a minus. The projections failed to account for the soaring costs of Bush’s “War on Terror” post-9/11, which led to prolonged wars in Afghanistan and Iraq, the bursting of the real estate bubble, and massive TARP bailouts to rescue large banks.
In short, this is a summary of CBO’s flawed foresight:
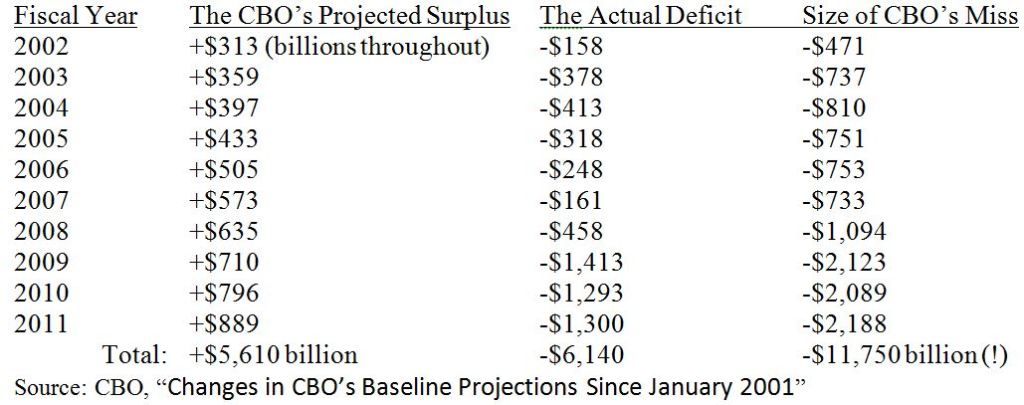
The first takeaway from this bleak forecast is that the CBO economists assumed deficits would increase in a smooth, predictable fashion—almost as if they were drawing a straight line with minor fluctuations, rather than reflecting the unpredictable realities of economic growth.
A second point is that the 2003 Bush tax cuts were not the main driver of the deficits. In fact, annual deficits dropped significantly—from $413 billion in fiscal year 2004 (which began October 1, 2003) to just $161 billion in fiscal year 2007. This means the deficit shrank by more than half during the four years following the tax cuts and before the 2007 real estate crash.
While much of this now feels like distant history, the ongoing wars and the Federal Reserve’s drastic response to the 2008 financial crisis—keeping interest rates near zero for eight years, essentially through the entire Obama administration—contributed to massive deficits that have persisted through to today, especially in the five years following the COVID-19 pandemic.
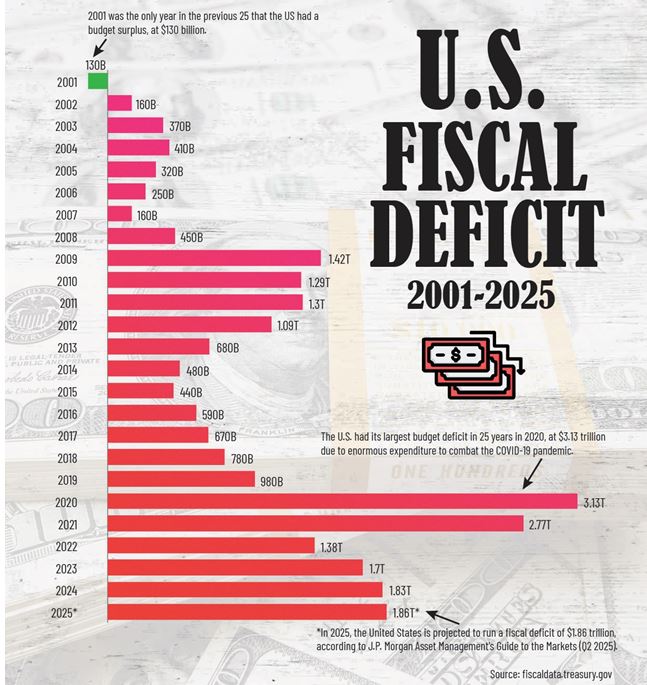
Since 2001, U.S. federal deficits have averaged about $1 billion annually, but that figure has surged to over $2 trillion per year since 2020, according to the U.S. Treasury.
Today, the total federal deficit stands at $38 trillion, which amounts to roughly $110,000 owed per American—far from the anticipated surpluses once projected.
Following a Challenging 2000–2009, Markets Surged in the First Quarter
What about the markets? After nearly a “lost decade” lasting nine years from March 2000 to March 2009, all major market indexes have experienced remarkable growth—particularly gold relative to the U.S. dollar.
By March 9, 2009, three of the four major indexes—the S&P 500, NASDAQ, and Russell 2000—had fallen by 50% since the decade began (while the Dow was down 40%), but they bounced back strongly from 2009 through 2025:
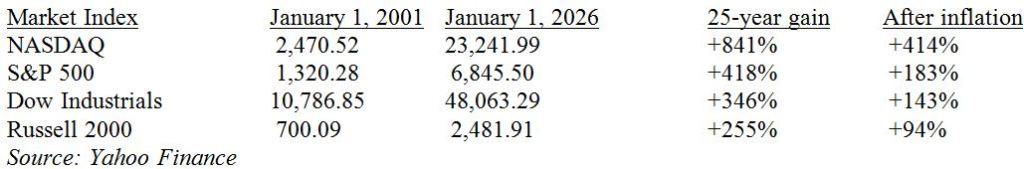
Over the same 25-year period, the Consumer Price Index (CPI) increased by 83%, which means the real market gains were somewhat diminished.
The U.S. dollar performed even worse, losing about 10% in value overall (and 8% against the euro), while gold and silver surged more than 15 times in value:
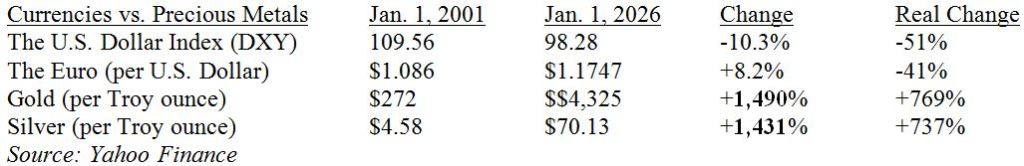
The first-quarter returns were decent, but the strong performance of gold and silver signals that the dollar—and the CBO’s deficit forecasts—cannot be relied on in the long run. In fact, President Trump has set a goal for 2026 to deliberately weaken the dollar against the Chinese yuan to “help” exporters boost overseas sales. Much of the talk about the dominance of the “King Dollar” is just rhetoric. In reality, many politicians aim to devalue their currencies to encourage trade, turning paper money into a “race to the bottom,” while gold quietly holds its value, watching from the sidelines.
This brings us to the 2025 summary—a major victory for precious metals as the dollar dropped by 10%.
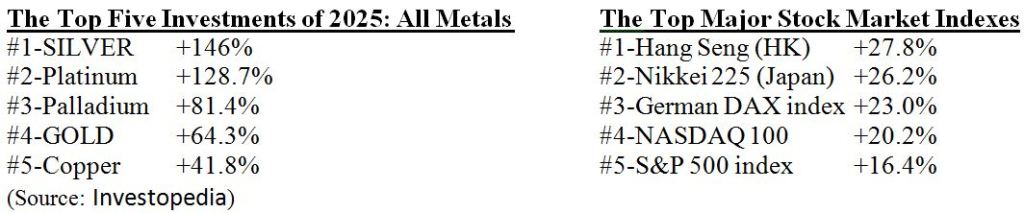
2025 Brought Massive Gains for Precious Metals
The year 2025 exemplified the key trends seen over the past 25 years—while the stock market continued to climb, gold and silver surged even faster. Although inflation is easing, gold today serves less as an inflation hedge and more as a safeguard against crises, a hedge against the dollar, and increasingly, a hedge against cryptocurrency volatility.
In 2025, the U.S. Dollar Index (DXY) dropped by 10%, allowing major global currencies to gain between 5% and 15%. Meanwhile, the poorest-performing investments of 2025 brought good news for consumers through lower food and energy prices:
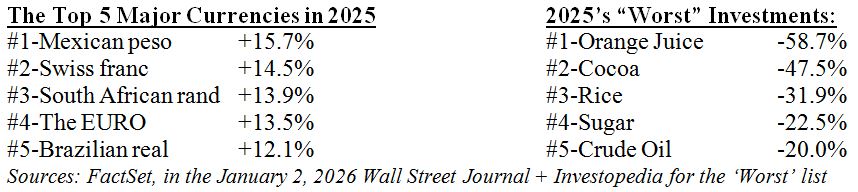
So, if 2026 mirrors the gains of 2025, it will surely be a rewarding year for most investors.
Sources: Investing

Leave a comment