EUR/USD advances toward 1.1550 as investors await the ECB’s upcoming monetary policy decision. Expectations that the central bank could tighten policy further to address persistent inflation pressures are lending support to the euro. Meanwhile, escalating tensions in the Middle East are boosting safe-haven demand for the US Dollar, which may limit the pair’s upside potential.
The EUR/USD pair edges higher toward the 1.1550 level during Thursday’s Asian session as traders position themselves ahead of the European Central Bank’s (ECB) policy decision scheduled for 12:15 GMT.
Market participants widely expect the ECB to raise its Deposit Facility Rate by 25 basis points to 2.25%, aiming to address mounting inflationary pressures fueled by elevated energy costs. Such a move would mark the central bank’s first policy adjustment after eight consecutive meetings without changes.
Recent comments from several ECB policymakers have reinforced expectations of tighter monetary policy, with officials highlighting growing upside risks to inflation stemming from ongoing energy supply disruptions. Investors will closely scrutinize remarks from ECB President Christine Lagarde for clues on whether inflationary pressures could generate broader second-round effects across the Eurozone economy.
Meanwhile, the US Dollar has recovered part of its earlier losses as concerns mount that the fragile ceasefire between Iran and the United States could unravel following renewed military exchanges. Despite the rebound, the US Dollar Index (DXY) remains modestly lower on the day, trading around 99.97 at the time of writing.
Technical Analysis
EUR/USD is trading slightly higher near 1.1550 at the time of writing, but the broader technical outlook remains bearish following a breakdown from a Symmetrical Triangle pattern and the presence of a downward-sloping 20-period Exponential Moving Average (EMA), currently positioned at 1.1603.
Momentum indicators also point to persistent downside risks. The Relative Strength Index (RSI) remains below the 40.00 threshold, signaling renewed selling pressure while still staying comfortably above oversold territory.
On the upside, immediate resistance is seen at the 20-period EMA near 1.1603. Additional barriers emerge at 1.1623, where a previously supportive ascending trend line has turned into resistance, followed by a stronger descending trend-line resistance around 1.1707. On the downside, a break below the June 8 low near 1.1500 could accelerate losses toward the March 16 low at 1.1411.
The Bitcoin ecosystem continues to face mounting challenges, with another major setback emerging from the Layer-2 sector. In a surprising development, Botanix, a prominent Bitcoin Layer-2 network, has announced that it will cease operations, giving users until July 9 to withdraw their assets.
The shutdown comes amid a sharp downturn in the cryptocurrency market. Bitcoin has fallen to around $61,000 during the latest wave of selling pressure, raising concerns that the current correction could evolve into a more prolonged bearish phase.
Botanix confirmed a phased closure of its EVM-compatible Layer-2 network, warning users to remove their funds before the July 9 deadline. Any assets left on the platform after that date will be transferred to the custody of a validator group known as the Federation, making direct withdrawals no longer possible.
The closure marks a disappointing end for a project that previously secured $11.5 million in funding from leading venture capital firms, including Polychain Capital and Placeholder Capital.
In an unusually candid post-mortem, the Botanix team acknowledged that limited user adoption ultimately led to the project’s downfall. According to the developers, demand for Bitcoin-based programmability and decentralized finance remains underdeveloped. Most DeFi participants continue to favor wrapped Bitcoin on Ethereum and other established platforms, while many Bitcoin holders still view BTC primarily as a long-term store of value rather than an asset for active on-chain trading.
As a result, the network struggled to generate sufficient transaction fees to support its operational and infrastructure costs, leading to the decision to shut down the platform.
Bitcoin Price Plunge
The shutdown of Botanix comes at a particularly difficult time for the cryptocurrency market, which is already facing intense selling pressure. Bitcoin has experienced a sharp decline this week, falling below several key psychological support levels and dropping to around $61,600, according to market data from CoinMarketCap.
The latest sell-off has further weakened investor sentiment, triggering concerns that the market could be entering a deeper correction phase. As Bitcoin struggles to regain momentum, risk assets across the crypto sector—including smaller Layer-2 networks and DeFi projects—have come under increased pressure.
For emerging ecosystems such as Botanix, the unfavorable market environment has only amplified existing challenges. With declining trading activity, weaker user engagement, and reduced fee generation, many smaller blockchain projects are finding it increasingly difficult to sustain operations during the downturn.
The sharp decline has significantly weakened retail investor sentiment and sparked a wave of liquidations across major cryptocurrency exchanges. The rapid correction highlights deteriorating market liquidity, creating a more challenging environment for smaller blockchain networks and emerging ecosystems. As capital flows out of riskier assets, projects with limited adoption and weaker financial foundations become increasingly exposed to market stress.
Analysts Predict Bitcoin Bear Market Could Persist
Several well-known cryptocurrency analysts argue that the current downturn may have further room to run. Influential market commentators on X, including Ash Crypto and 0xChiefy, suggest that prevailing macroeconomic conditions and historical Bitcoin market cycles indicate the potential for additional downside pressure.
According to their analysis, a combination of economic uncertainty, tightening liquidity conditions, and recurring bearish patterns from previous market cycles could lead to deeper corrections before a sustainable recovery takes hold. As a result, traders and investors are closely monitoring key support levels and broader market developments for signs of stabilization.
Analysts believe the current bearish momentum could continue to weigh on Bitcoin prices, potentially driving the market lower before a durable macroeconomic bottom is established. Their outlook is further reinforced by a significant wave of institutional selling, with reports indicating that more than 52,500 BTC have been liquidated through spot Bitcoin ETFs.
The large-scale distribution by institutional investors has added considerable selling pressure to the market, creating a supply overhang that may limit the prospects for a near-term recovery. As long as this excess supply remains in circulation, upward price movements could face substantial resistance.
Nevertheless, historical market data offers a more optimistic longer-term perspective. According to CoinMetrics, deeper declines during Bitcoin bear markets have often been followed by stronger and more explosive recoveries. While the current environment remains challenging, past cycles suggest that periods of extreme weakness can ultimately lay the foundation for powerful bullish reversals once market sentiment and liquidity conditions improve.
The chart provides Bitcoin investors with a reason for cautious optimism. Historical market cycles suggest that while bear markets can be painful and prolonged, they have often been followed by powerful recoveries. As a result, many investors believe that once the current downturn reaches its macro bottom, Bitcoin could stage a significant rebound and potentially climb to new all-time highs.
Past performance indicates that deeper corrections have frequently laid the groundwork for stronger bull runs, driven by renewed investor confidence, improving liquidity conditions, and growing institutional participation. Although short-term risks remain elevated, long-term market participants continue to view the current weakness as part of Bitcoin’s broader cyclical pattern.
BTC Technical Indicators Signal Continued Weakness
A review of Bitcoin’s technical indicators reinforces the prevailing bearish sentiment across the market. According to live technical data from Investing.com, Bitcoin is currently generating a strong sell signal on the daily, weekly, and monthly timeframes, suggesting that downward pressure remains firmly in control.
The 14-day Relative Strength Index (RSI) is hovering around 34.8, a level that reflects weakening buying interest and sustained selling activity. While not yet in deeply oversold territory, the indicator points to a market where bears continue to hold the upper hand.
Adding to the negative outlook, key moving averages—from the short-term 5-day MA to the long-term 200-day MA—remain above Bitcoin’s current trading price. This bearish alignment indicates that major trend indicators continue to act as resistance, limiting the potential for a near-term recovery.
As long as Bitcoin trades below these critical moving averages, technical momentum is likely to remain tilted to the downside, with sellers maintaining control of the broader market trend.
Commodity markets experienced heightened volatility as investors assessed rising US inflation, shifting Federal Reserve expectations, and increasing geopolitical tensions in the Middle East. Precious metals came under pressure from a firmer US Dollar and elevated inflation expectations, while crude oil extended its advance amid concerns over potential disruptions to global energy supplies.
Gold (XAU/USD) Stays on the Defensive
Gold prices continued to trend lower, approaching the $4,100 area as US inflation accelerated to 4.2%, strengthening the view that the Federal Reserve could keep interest rates higher for longer. Meanwhile, renewed geopolitical friction between the United States and Iran supported the US Dollar, reducing demand for gold despite its traditional safe-haven appeal.
Key Levels
Resistance: 4,180 | 4,250 | 4,300
Support: 4,100 | 4,050 | 4,000
Market bias: Bearish below 4,180.
A sustained break below $4,100 could expose further downside toward the $4,050 and $4,000 support zones. Conversely, any recovery would need to clear the $4,180 resistance level to signal a potential shift in short-term momentum.
Silver (XAG/USD) Remains Under Selling Pressure
Silver prices extended their decline, slipping toward the 64.50 level as stronger US economic data and rising inflation expectations continued to support the US Dollar. With markets increasingly pricing in a prolonged period of elevated interest rates, the precious metal remains vulnerable to additional downside pressure.
Key Levels
Resistance: 66.00 | 68.00 | 70.00
Support: 64.50 | 63.00 | 61.50
Market Bias: Bearish below 66.00.
A sustained move below 64.50 could pave the way for a deeper decline toward the 63.00 and 61.50 support levels. On the upside, silver would need to reclaim and hold above 66.00 to ease bearish pressure and improve the near-term outlook.
Crude Oil (WTI) Extends Rally on Supply Risk Fears
WTI crude oil continued to move higher, trading near $91 per barrel as growing tensions between the United States and Iran heightened concerns over potential supply disruptions in the Strait of Hormuz, a critical route for global energy shipments. Additional bullish momentum came from a larger-than-expected drawdown in US crude inventories, signaling tighter supply conditions and robust demand.
Key Levels
Resistance: 91.00 | 93.50 | 95.00
Support: 88.50 | 86.00 | 84.00
Market Bias: Bullish above 88.50.
A sustained break above the $91.00 resistance level could open the door for further gains toward $93.50 and potentially $95.00. On the downside, the $88.50 area remains key support; holding above this level would preserve the current bullish structure, while a break below could trigger a deeper correction toward $86.00.
Overall Market View
The broader commodity market landscape continues to favor energy assets, while precious metals face headwinds from persistent inflation pressures, elevated interest-rate expectations, and a resilient US Dollar. As investors navigate a complex macroeconomic backdrop, attention remains focused on upcoming US economic data, Federal Reserve guidance, and geopolitical developments that could drive the next major market moves.
Outlook
Gold (XAU/USD): Bearish to Neutral
Silver (XAG/USD): Bearish
Crude Oil (WTI): Bullish
For now, crude oil appears best positioned to benefit from supply-side risks and tightening market conditions, whereas gold and silver may continue to struggle unless inflation eases or the US Dollar loses momentum. Market participants should remain alert to fresh economic signals and geopolitical headlines, as these factors are likely to shape sentiment across commodity markets in the near term.
The DXY is trading in a tight range just below the 100 level after last week’s strong rebound, with today’s May CPI report set to determine whether the recovery can extend further.
Markets expect headline inflation to climb above 4.0% year-over-year for the first time since May 2023, while core CPI is forecast to rise 0.3% month-over-month and 2.9% annually. A result in line with expectations would reinforce expectations of a Federal Reserve rate hike in December, providing continued support for the dollar.
The main downside risk lies in a softer core inflation reading. With shelter accounting for nearly 45% of the core CPI basket and rental inflation showing signs of moderation, a 0.2% monthly increase instead of 0.3% could push DXY back toward the 99.50–99.60 area. However, such a move would likely be viewed as a temporary pullback rather than a broader trend reversal, especially with tomorrow’s PPI release and next week’s FOMC meeting likely to keep demand for the greenback intact.
Outside of inflation data, equity markets remain volatile as investors reposition ahead of Friday’s SpaceX IPO. Meanwhile, Oracle’s earnings report after today’s market close will offer fresh insight into the strength of the AI-driven data centre sector during a sensitive period for technology stocks. Adding to the dollar’s support, investors directed $99 billion into USD money market funds last week—the largest weekly inflow of 2026—highlighting strong institutional demand for safe-haven assets.
Technical Analysis
The DXY has staged a strong rebound from its mid-May low near 97.80, climbing back above the psychologically important 100 level before easing slightly to around 99.85 in early trading. Immediate resistance is located in the 100.40–100.60 zone, which corresponds to the lower boundary of the former April trading range. A decisive break above this area would strengthen the case for a broader bullish reversal.
If CPI data comes in weaker than expected, the index could initially retreat toward the 99.50–99.60 region. A deeper decline would bring the critical support area between 99.00 and 99.20 into focus. While the broader momentum continues to favor further gains, today’s inflation report is likely to determine whether the dollar can extend its recovery or face a temporary setback.
Gold prices fell toward $4,235 during early Asian trading on Wednesday as renewed US-Iran tensions boosted market uncertainty. Fresh US strikes on Iran, following the downing of a helicopter, intensified fears of a prolonged conflict. Meanwhile, investors are closely watching the US May CPI inflation report due later Wednesday for further market direction.
Gold prices extended losses to around $4,235, the lowest level since March 23, during Wednesday’s early Asian session. The decline in XAU/USD comes amid renewed Middle East tensions and growing expectations that the Federal Reserve could raise interest rates later this year. Investors are now awaiting the release of the US May CPI inflation report for fresh market direction.
According to Reuters, the US launched strikes on Iran after US President Donald Trump claimed that Tehran had shot down a US Apache helicopter in the Strait of Hormuz. Earlier on Tuesday, Trump said the US and Iran were close to reaching an agreement, although little concrete progress has emerged since a fragile ceasefire began in early April.
Ongoing uncertainty surrounding a potential peace deal between Washington and Tehran continues to fuel inflation concerns and support expectations for higher interest rates. While Gold is traditionally viewed as a safe-haven asset during geopolitical instability, elevated interest rates reduce the appeal of the non-yielding metal.
Meanwhile, stronger-than-expected US May employment data have reinforced market expectations of a possible Fed rate hike this year. Traders are now focused on the upcoming US CPI report. Headline inflation is forecast to rise 4.2% year-over-year in May, up from 3.8% previously, while core CPI is expected to increase 2.9% YoY compared with 2.8% in April.
Any signs of stronger-than-expected inflation could strengthen the US Dollar and add further downside pressure on Gold prices in the near term.
“The prevailing inflation fears, data strength, Fed hike probability increasing, and break of 200-day moving average have led to a heavy skew negative,” said Ryan McKay, senior commodity strategist at TD Securities.
WTI could rebound as escalating Middle East tensions revive serious concerns over oil supply disruptions. The US carried out a third round of retaliatory strikes on Iranian coastal sites on Wednesday after Iran launched a ballistic missile attack from Isfahan. Meanwhile, Tehran warned of full-scale conflict if Israel continues its military operations against Hezbollah in Lebanon.
WTI crude oil traded volatilely near $87.40 per barrel during Wednesday’s Asian session after posting losses of more than 2.5% in the previous session. Oil prices initially rebounded as escalating Middle East tensions reignited fears of severe supply disruptions.
Although prices briefly declined on Tuesday following a temporary pause in hostilities between Israel and Iran, tensions quickly intensified again. Reports indicated that the US carried out a third round of retaliatory strikes on Iranian coastal facilities after Iran launched at least three ballistic missiles from Isfahan. The attacks followed earlier US strikes that Washington described as a proportional response to Iran’s downing of a US helicopter near the strategically important Strait of Hormuz.
At the same time, diplomatic attempts to establish a lasting ceasefire remain stalled. Tehran warned it would resume full-scale military action if Israel continues operations against Hezbollah in Lebanon, while Israel’s stance has complicated efforts by the Trump administration to secure a permanent truce.
Supply concerns were further amplified after API data showed US crude inventories fell by 9.1 million barrels last week, reaching their lowest level in four months as buyers rushed to replace disrupted Persian Gulf supplies. Despite ongoing conflict and fragile peace negotiations, the US Energy Secretary stated that shipping activity and oil exports through the Strait of Hormuz are currently increasing.
Silver extends its decline for a second consecutive session, having fallen in three of the last four trading days. The break below the 200-day EMA during the previous session provided a fresh bearish signal for XAG/USD. With technical indicators continuing to favor sellers, the metal could remain under pressure and move toward a retest of its March swing low.
Silver (XAG/USD) remains under pressure for a second consecutive session, slipping to its weakest level since March 23 during Wednesday’s Asian trading hours. The precious metal is trading near $64.35–$64.30, down more than 1.5% on the day, with bearish sentiment continuing to weigh on prices.
A series of unsuccessful attempts to break above the $89.00 area has resulted in the formation of a bearish double-top pattern. Further strengthening the negative outlook, silver closed below its 200-day Exponential Moving Average (EMA) overnight for the first time since April 2025, providing a fresh bearish signal for market participants.
Technical indicators continue to favor the downside. The Relative Strength Index (RSI) stands at 31.31, hovering just above oversold conditions, suggesting that sellers remain in control even though a brief corrective rebound cannot be ruled out. Meanwhile, the Moving Average Convergence Divergence (MACD) remains in negative territory at -1.28, highlighting sustained downward momentum.
Given this setup, a break below the $64.00 level could pave the way for a decline toward the next support zone around $63.35–$63.30. If bearish momentum persists, silver may extend its losses further and potentially revisit the March swing low near $61.00 in the coming weeks.
On the upside, the 200-day EMA at $67.84 represents the first significant resistance level. A daily close above this barrier would be required to reduce bearish pressure. Until such a move occurs, technical conditions continue to indicate that the path of least resistance for XAG/USD remains lower.
Political friction and weakening economic data are putting downward pressure on the British Pound. Ahead of Friday’s critical April GDP release, markets are weighing the threat of a recession against the likelihood of more Bank of England rate hikes aimed at curbing energy-driven inflation. This cautious sentiment is deepened by a high-stakes leadership challenge within the ruling Labour Party, prompting major financial institutions to downgrade their short-term outlook for Sterling.
Weak Growth and Fiscal Vulnerabilities Threaten to Drag Down the Pound
Macro strategists at Brown Brothers Harriman (BBH) warn that the British Pound is highly vulnerable to a sharp drop against the US Dollar. This risk is driven by a combination of a shrinking UK economy and persistent stagflationary pressures. While the Bank of England (BOE) is expected to step in to control inflation, potential political instability could undermine the nation’s fiscal credibility, accelerating the currency’s decline.
Key Takeaways:
GBP/USD Forecast: The exchange rate is projected to slide to 1.3100, reflecting a stronger US economic outlook compared to the UK’s.
The BOE’s Dilemma: Raising interest rates during a period of low growth and high inflation won’t spark a bullish run for the Pound, though it should help cushion its fall.
Political Risk: Any upcoming leadership shake-ups could damage fiscal trust, worsening the currency’s downward trajectory.
Uncertainty Surrounds the Bank of England’s Next Steps
Economists at Societe Generale suggest that the political buzz surrounding Manchester Mayor Andy Burnham’s bid for the Labour leadership is unlikely to trigger drastic policy shifts in the near term. Meanwhile, the Bank of England’s (BoE) monetary policy outlook remains mixed. While aggressive, hawkish members of the Monetary Policy Committee (MPC) are strongly advocating for an immediate interest rate hike, the broader consensus points toward a more cautious, “wait-and-see” approach.
Key Takeaways:
Rate Decision Outlook: The BoE is expected to keep interest rates unchanged for the June meeting.
MPC Division: Members pushing for a rate hike are anticipated to remain in the minority.
Political Impact: Political noise from the Labour leadership contest is expected to have a limited impact on the broader economic landscape.
Major Banks Forecast a Downward Bias for the British Pound
Major financial institutions expect the British Pound to face a weak outlook. While both institutions anticipate a lack of upward momentum, their specific forecasts differ based on economic drivers:
Brown Brothers Harriman (BBH): Maintains an explicitly bearish stance, predicting the GBP/USD pair will drop to 1.3100. This is driven by the UK’s weak growth narrative underperforming compared to a stronger US economy.
Societe Generale: Foresees a more range-bound, stagnant path. They believe the Pound lacks immediate upward momentum because the Bank of England is expected to hold interest rates steady rather than pursuing aggressive hikes.
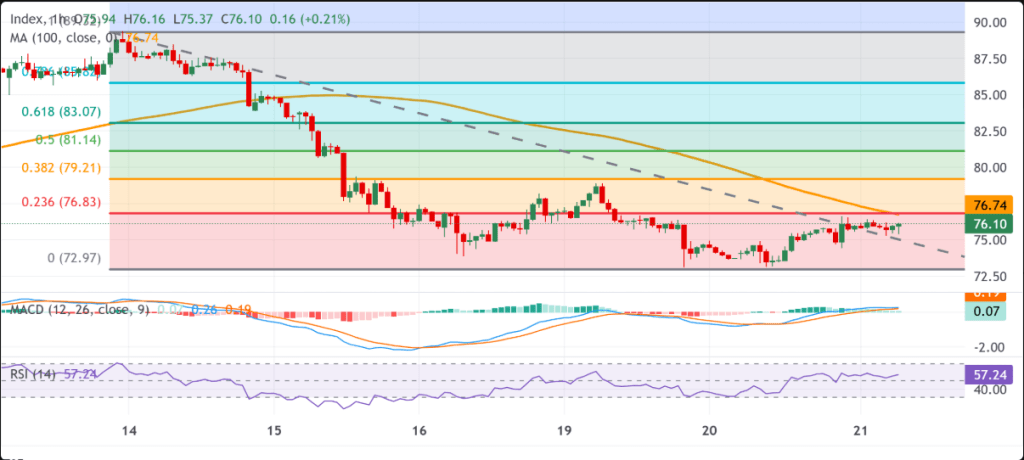
US Dollar Index Outlook: Bullish Momentum Supported by Climbing 20-Day EMA
DXY Slips: The US Dollar Index pulled back to near 99.90.
Geopolitical Driver: Optimism grew after President Trump stated that US-Iran negotiations are in their final stages, with a deal possible in two to three days.
Next Catalyst: Market focus is shifting to the upcoming release of May’s US CPI data.
The US Dollar (USD) experienced mild downward pressure during Tuesday’s European trading session, sparked by renewed optimism surrounding a potential agreement between the United States and Iran. At the time of reporting, the US Dollar Index (DXY), which measures the Greenback’s performance against a basket of six major currencies, dipped 0.1% to hover around 99.90.
According to The Guardian, prospects for a US-Iran agreement have improved following remarks from President Donald Trump, who stated that negotiations are in their “final throes” and hinted that the critical Strait of Hormuz could reopen within days if a deal is finalized. This development is bearish for the US Dollar, which had previously rallied on the back of soaring energy prices caused by the strait’s closure. High energy costs had been driving US inflation and fueling hawkish expectations for the Federal Reserve.
Back home, the market is bracing for Wednesday’s release of the May Consumer Price Index (CPI) data. Headline inflation is projected to climb to 4.2% year-on-year, up from April’s 3.8%. Any signs of accelerating inflation will likely bolster expectations for Fed rate hikes, especially after last week’s robust Nonfarm Payrolls (NFP) report already intensified hawkish sentiment over the last two trading sessions.
DXY Technical Analysis
The US Dollar Index (DXY) spot is ticking slightly lower near 99.90. However, the short-term outlook remains bullish as the price holds above its 20-day exponential moving average (EMA) at approximately 99.30. This level sits well above the ascending trend-line support originating from the 95.55 region, which is currently tracking near 98.34.
Furthermore, the 14-day Relative Strength Index (RSI) is hovering in the low 60s, indicating healthy upward momentum without entering overbought territory. This supports a constructive outlook while the index consolidates just beneath the crucial 100 psychological level.
On the downside, immediate support rests at the 20-day EMA (99.30), followed by stronger support at the rising trend line near 98.34. A daily close beneath this lower threshold would damage the bullish setup and invite a deeper correction. Conversely, an upside break above the June 8 high of 100.20 could clear the way for the index to revisit its one-year peak at 100.64.
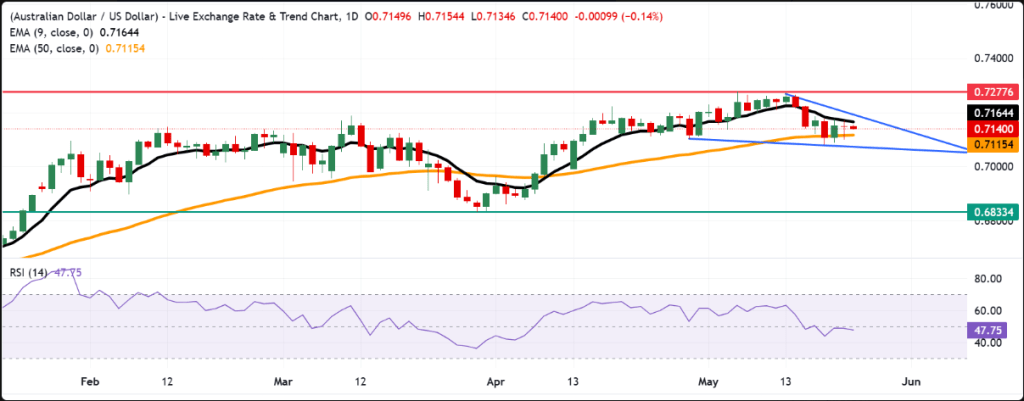
The Australian Dollar is projected to experience a measured decline, heading toward the 0.7000 mark against the US Dollar.
Daily Forecast (Next 24 Hours)
UOB analysts Quek Ser Leang and Lee Sue Ann expect the Australian Dollar to stabilize and trade within a 0.7015 to 0.7065 range today. While the currency briefly dipped to 0.7016 shortly after yesterday’s market open—approaching the projected 0.7020 support level—a subsequent recovery to 0.7078 has successfully mitigated immediate downward momentum.
Short-Term Outlook (1–3 Weeks)
The broader near-term bias remains tilted to the downside. Following a sharp sell-off last Friday that triggered building downward momentum, the analysts maintain that AUD/USD is on track to weaken toward 0.7000. This bearish outlook stays intact provided the currency does not break above the strong resistance level at 0.7105.
Long-Term Outlook (Multi-Month)
Looking further ahead, the structural risks for the pair point toward a gradual decline, with a major floor and significant technical support expected around 0.7040.
Market Activity: Dow futures slipped following a mixed overnight performance on Wall Street, with tech stock gains balancing out losses in blue chips.
Geopolitical Outlook: Investor sentiment stays cautious amid persistent uncertainties in the Middle East.
Economic Drivers: Resurgent inflation fears—sparked by strong jobs data and geopolitical friction—have shifted expectations regarding upcoming Fed decisions.
During Tuesday’s European trading session, US stock futures showed a mixed performance ahead of the New York open. Dow Jones futures dipped marginally by 0.02% to hold above 50,850, while S&P 500 and Nasdaq 100 futures climbed 0.21% and 0.51%, respectively.
This uneven momentum follows a split session on Wall Street, where a tech rebound—led by surges in semiconductor stocks like Intel (+11.2%), Marvell Technology (+9.6%), and Nvidia (+1.7%)—lifted the Nasdaq and S&P 500 despite a 0.16% drop in the Dow.
However, overall market sentiment remains guarded due to persistent Middle East tensions. While Iran indicated a halt to its strikes on Israel, Israeli Prime Minister Benjamin Netanyahu warned that the conflict is not over, drawing a counter-warning from Iran of severe retaliation if operations persist in southern Lebanon. These geopolitical risks, alongside recent strong US employment figures, have revived inflation anxieties. Consequently, traders are adjusting their Federal Reserve expectations, with the CME FedWatch Tool now showing a 43% chance of a December rate hike (up from 14% last month). Investors are now tightly focused on the upcoming CPI and PPI releases to anticipate the Fed’s trajectory.
Traders are currently holding the biggest short position on the U.S. dollar in six months. However, when positioning becomes overly one-sided, markets often move in the opposite direction.
The “debasement trade” was built on expectations of Fed rate cuts and easing inflation. But instead, inflation has reaccelerated, with April CPI at 3.8% and PPI at 6%, leaving the Fed on hold potentially through 2027.
While the inflation surge is largely driven by energy prices, underlying service-sector inflation remains persistent, limiting the Fed’s ability to ease policy even if oil prices decline.
A stronger U.S. dollar acts as a channel for global monetary tightening, weighing on assets like gold, silver, and oil, while also creating an asymmetric setup for long-duration Treasury bonds.
The preferred strategy is a barbell approach: holding short-term Treasury bills for stable yield with minimal duration risk, while gradually adding long-duration exposure as 30-year yields move toward the 5% level.
The most crowded short in U.S. markets isn’t in equities or big tech—it’s the U.S. dollar. Earlier this year, speculators extended dollar selling for eight consecutive weeks, while asset managers turned net short on the DXY for the first time in months.
Across macro funds, the positioning is strikingly uniform: expectations for a weaker dollar, stronger gold and commodities, and a broader narrative of currency debasement. In that context, the “strong dollar” trade—effectively betting against this consensus—has become the potential pain trade heading into 2026. When positioning becomes one-sided, the market often moves in the opposite direction.
In macro terms, positioning is one of the clearest signals of vulnerability, revealing where consensus is most exposed. At present, that exposure is heavily skewed to one side.
According to Saxo’s COT analysis for early January, non-commercial positioning in IMM FX futures showed roughly $11.9 billion in net dollar shorts, the largest bearish exposure in about six months. Asset managers had also shifted to a net short DXY stance for the first time since mid-October, aligning with leveraged funds in a broadly bearish dollar view. As Bob Farrell’s Rule #9 notes, when consensus becomes near-unanimous, the market is often closest to a reversal.
The flaw in the dollar-bearish narrative is that it was built on expectations that never materialized. The market assumed the Federal Reserve would begin cutting rates, inflation would continue easing, and foreign currencies such as the euro, yen, and many emerging-market currencies would benefit from an improving global growth outlook.
Instead, inflation has remained stubbornly elevated. April CPI rose 3.8% year-over-year, its highest reading since May 2023, while PPI accelerated to 6%, marking the strongest pace since 2022. Core PPI, which strips out food and energy prices, climbed to 5.2%, underscoring persistent underlying price pressures.
As a result, markets have dramatically reassessed the policy outlook. Expectations for Fed rate cuts throughout 2026 have largely been priced out, while the probability of a rate hike before year-end has rebounded to roughly 35%–39%.
With inflation proving more persistent and monetary easing no longer imminent, the foundation of the widespread short-dollar trade has weakened considerably. The assumptions that justified betting against the dollar are no longer supported by the data.
A fair counterargument to the strong-dollar view is that much of the recent inflation surge can be traced back to energy. The U.S.–Iran conflict that erupted in late February pushed crude oil to its highest levels in four years, making energy the primary driver of both the CPI and PPI increases. Remove food and energy from the equation, and core CPI comes in at 2.8% rather than the headline 3.8%.
From the debasement perspective, the case is straightforward: inflation is being distorted by a temporary oil shock. If crude prices retreat, headline inflation should ease, giving the Federal Reserve room to resume rate cuts and reviving the bearish-dollar thesis.
The challenge with that argument is what lies beneath the surface of the inflation data. April’s PPI report showed that services accounted for roughly 60% of the monthly increase, marking the strongest services inflation since 2022. Meanwhile, core producer prices excluding food, energy, and trade services rose 4.4% year-over-year.
That matters because services inflation is not simply a reflection of higher fuel costs. It points to broader price pressures spreading through the economy, supported by resilient demand and continued economic strength. Unlike an oil-driven spike, these pressures tend to be more persistent and do not disappear as soon as energy prices decline. Even if crude retreats, the underlying inflation trend may prove sticky enough to keep the Fed cautious and delay the policy easing that dollar bears have been counting on.
The bearish-dollar thesis depended on two key developments: easing inflation and Federal Reserve rate cuts. At this point, neither appears to be materializing.
The Hawkish Shift Supporting the Dollar
The confirmation of Kevin Warsh as Fed Chair on May 13 reinforces the possibility of a more hawkish policy environment. The irony is notable. While Warsh was widely expected to support lower rates and has previously acknowledged room for monetary easing, he has spent years criticizing quantitative easing and advocating for a smaller Fed balance sheet. Now he finds himself facing a backdrop of accelerating inflation that limits his flexibility.
Even if Warsh would prefer to deliver the rate cuts many investors anticipated, current economic conditions may not allow it. Following the April CPI release, analysts such as Krishna Guha argued that the inflation data strengthened the case of policymakers who believe the Fed’s next move could be a hike rather than a cut.
The market’s expectations have shifted accordingly. Goldman Sachs has pushed its forecast for the next rate cuts to December 2026 and March 2027, envisioning only two quarter-point reductions over that period. With producer inflation accelerating, oil prices elevated, and labor-market conditions remaining firm, the environment looks far less supportive of a weaker dollar than many investors had expected.
Why the Dollar Trade May Still Be Early
Although the Dollar Index has rebounded from below 97 in late April to around 98.8 by mid-May, the broader move remains modest. The dollar is still lower on the year by roughly 1.5%, meaning the bullish-dollar trade has yet to become crowded.
That is precisely what makes the setup interesting. Investor positioning remains heavily skewed toward dollar weakness, while the fundamental catalysts increasingly point in the opposite direction. If expectations continue to shift toward higher-for-longer rates, the dollar could have significant room to appreciate simply because so few investors are positioned for that outcome.
The 1970s Comparison May Be Misleading
A common argument among dollar bears is that the current environment resembles the inflationary 1970s, implying sustained currency debasement and negative real returns. However, the real-yield backdrop today looks fundamentally different.
Using April’s 3.8% CPI reading, realized real yields remain positive:
2-year Treasury: approximately +0.1%
10-year Treasury: approximately +0.7%
Fed funds rate: approximately +0.7%
Meanwhile, the 10-year Treasury Inflation-Protected Securities (TIPS) market implies a real yield near 1.95%, reflecting investors’ expectations for future inflation rather than current price growth.
Those figures are not especially restrictive, but they are far removed from the 1970s experience, when real yields frequently plunged to around -5%. That distinction matters. Sustained dollar weakness typically requires deeply negative real returns and an aggressively accommodative central bank. Today’s environment features neither condition, suggesting the historical comparison may be overstated and that the case for a stronger dollar remains more compelling than current market positioning implies.
The key takeaway from the 1970s comparison is that while the U.S. fiscal backdrop may share some similarities—rising debt levels and significant foreign ownership of Treasuries—the economic transmission mechanism that drove the dollar’s collapse during that era is largely absent today. The 1970s featured deeply negative real interest rates, a self-reinforcing wage-price spiral, and an economy heavily dependent on oil-intensive industrial production. Without those ingredients, the historical parallel begins to break down.
What a Stronger Dollar Could Mean for Commodities
The implications are significant because many commodity markets remain positioned for the opposite outcome. Gold, silver, and crude oil have all benefited from expectations of a weaker dollar, easier monetary policy, and continued currency debasement. If the dollar strengthens instead, the underlying assumptions supporting those trades become less compelling.
Gold and silver are particularly sensitive to dollar movements. Because they are priced in U.S. dollars, a stronger greenback raises their cost in foreign currencies and can reduce international demand. Silver may face additional pressure because, unlike gold, it relies more heavily on industrial consumption, which tends to soften when financial conditions tighten and economic growth slows.
Oil presents a more complex case. On one hand, crude prices remain supported by supply concerns stemming from the U.S.–Iran conflict. On the other, a stronger dollar and slower global growth would typically weigh on demand and exert downward pressure on prices. As a result, oil is caught between geopolitical risk and macroeconomic headwinds.
According to market commentary from the delta-one desk at Goldman Sachs, a meaningful decline in crude prices could help broaden equity market participation beyond the dominant mega-cap technology names. A stronger dollar could contribute to that outcome, particularly if tensions around the Strait of Hormuz begin to ease.
Why Lower Oil May Not Mean Lower Rates
The most important aspect of the thesis is that falling oil prices do not automatically lead to Federal Reserve easing. Lower crude prices would likely reduce headline inflation, but they would do little to address the persistent services inflation embedded throughout the economy.
If services inflation remains elevated, the Fed may have little incentive to cut rates even as energy prices retreat. In that scenario, the dollar would retain support from relatively high interest rates while commodities lose support from falling inflation expectations.
That dynamic creates a challenging backdrop for the broader commodity-supercycle narrative. Much of the bullish case for gold, silver, and other dollar-denominated assets rests on the assumption of a weakening dollar and easier monetary policy. If those assumptions prove incorrect, the foundation supporting the trade becomes considerably less stable, raising the risk of a significant reversal across commodity markets.
This is where the debate diverges most sharply from the prevailing gold-and-debasement narrative. The common view is that fiat currencies and government bonds are structurally impaired, leaving hard assets as the only viable refuge. But if the dollar strengthens, the chain of effects may point in the opposite direction.
A stronger dollar acts as a powerful transmission mechanism for global financial tightening. It:
Drains liquidity from emerging markets.
Increases the burden of dollar-denominated debt for foreign borrowers.
Tightens global financial conditions.
Slows economic activity outside the United States.
Over time, that slowdown can feed back into the U.S. economy, reducing inflation pressures and lowering inflation expectations. When that happens, long-term Treasury yields tend to fall rather than rise.
This is why the bond market may be more attractive than many investors currently assume. The 30-year Treasury yield closed near 4.98% on May 11, hovering just below the 5% threshold that Michael Hartnett has identified as a level where broader market stress could emerge. If tighter financial conditions begin to weigh on growth, the long end of the Treasury curve could rally as investors seek safety and markets price in slower economic activity.
In that environment, Treasury bonds—after enduring one of their worst multi-year periods in decades—could become one of the biggest beneficiaries of a stronger-dollar regime. The irony is that the same dollar appreciation many investors dismiss as unlikely may be the catalyst that restores bonds’ traditional role as portfolio stabilizers.
Viewed through this lens, the sequence is not:
Dollar weakness → higher inflation → higher bond yields → hard assets win.
Instead, it may be:
Dollar strength → tighter global liquidity → slower growth → lower inflation expectations → lower long-term yields → bonds outperform.
That possibility is largely absent from current consensus positioning. Many investors remain heavily allocated to the debasement trade—long gold, long commodities, short duration, and short dollar. If the dollar continues to strengthen, the assets expected to benefit from inflation could face headwinds, while the most neglected trade may be a recovery in long-duration Treasury bonds.
The broader implication is that the debate may not be about whether inflation exists today, but about which force ultimately dominates: persistent inflation or the growth slowdown that tighter financial conditions can create. If the dollar becomes the vehicle for that tightening, bonds could emerge as the unexpected winner.
How to Position for the Trade
To be fair to the opposing view, the debasement thesis is not without merit. U.S. fiscal deficits remain large, government debt continues to grow, and central banks around the world are accumulating gold at the fastest pace in decades. Meanwhile, bond markets are showing signs of stress elsewhere: Japan’s long-term yields have surged to record highs, and the UK continues to grapple with periodic gilt-market volatility.
The key issue, however, is that these challenges are not unique to the United States. The euro area faces its own fiscal constraints, Japan is dealing with mounting pressure in its government bond market, and the UK remains vulnerable to political and fiscal uncertainty. Currency markets are relative, not absolute. In that comparison, the U.S. dollar still benefits from higher yields, deeper capital markets, and a Federal Reserve that remains reluctant to ease policy while inflation pressures persist.
In other words, the dollar may not be attractive because conditions in the U.S. are ideal—it may be attractive because conditions elsewhere are no better and, in some cases, worse.
A Barbell Strategy for a Stronger-Dollar Scenario
If the stronger-dollar thesis proves correct, a barbell approach offers a logical way to express the view.
One side of the portfolio:
Hold cash and short-duration Treasury bills.
Capture yields above 4%.
Avoid duration risk.
Benefit directly from a higher-for-longer interest-rate environment.
The other side of the portfolio:
Gradually accumulate longer-duration Treasuries as yields approach historically attractive levels.
Long-duration instruments could benefit disproportionately if tighter financial conditions eventually slow growth and drive long-term yields lower.
Vehicles such as long-duration Treasury ETFs become increasingly attractive if the economy weakens while the Fed remains restrictive.
This structure allows investors to earn attractive short-term yields today while maintaining exposure to a potential bond rally if growth deteriorates.
Commodities: More Caution Than Conviction
Under a stronger-dollar scenario, the risk-reward profile for commodities becomes less favorable.
Gold: After a substantial rally over the past year, much of the easy upside may already be reflected in prices.
Silver: Faces both monetary and industrial headwinds if tighter financial conditions weigh on growth.
Oil: Still supported by geopolitical risks, but vulnerable to a combination of stronger-dollar effects and weaker global demand.
Rather than aggressively adding commodity exposure, investors may find it more prudent to reduce overweight positions or maintain only modest allocations as hedges against geopolitical shocks.
The Investment Implication
The central argument is not that a stronger dollar is guaranteed. It is that the market remains heavily positioned for the opposite outcome.
Consensus trades often become vulnerable when the underlying assumptions begin to weaken. If inflation remains sticky, rate cuts continue to be pushed further into the future, and global growth slows under tighter financial conditions, the strongest opportunities may emerge in assets that few investors currently favor:
Long U.S. dollars.
Short-duration Treasuries.
Selective long-duration bond exposure.
Reduced reliance on the commodity-debasement narrative.
The essence of the trade is simple: position for the outcome that the market is least prepared for. If the dollar strengthens while investors remain committed to the weak-dollar consensus, the resulting adjustment could become one of the most consequential macro shifts over the next several quarters.
The crypto market came under heavy pressure this week, with Bitcoin falling more than 12% over seven days, sliding from above $70,000 to an intraweek low near $61,500. Total cryptocurrency market capitalization dropped to approximately $2.18 trillion on June 4, approaching its February lows and standing nearly 48% below the record peak above $4.2 trillion reached last year.
The weakness stood in sharp contrast to traditional financial markets. U.S. equities continued to climb to new all-time highs, driven largely by enthusiasm surrounding artificial intelligence and large-cap technology stocks. Meanwhile, cryptocurrencies and crypto-related equities moved decisively in the opposite direction.
The divergence highlights a growing liquidity challenge within digital assets. Persistent ETF outflows, the first disclosed Bitcoin sale by Strategy since 2022, and a lack of fresh stablecoin inflows have weighed on investor sentiment and reduced buying power across the market. At the same time, Bitcoin exchange netflow data suggests more coins are being transferred onto exchanges, increasing the potential for additional selling pressure.
Leverage has also become a concern. Although approximately $1.76 billion in crypto positions were liquidated on June 2—with nearly 90% of those liquidations coming from long positions—speculative activity remains elevated. Bitcoin-denominated open interest climbed to a record high of roughly 784,000 BTC the following day, indicating that leverage has been reduced but not fully flushed from the system.
With U.S. stocks attracting capital and the highly anticipated SpaceX IPO potentially drawing even more investor attention and liquidity, crypto markets currently lack a clear catalyst for a sustained recovery. Until fresh capital returns and selling pressure eases, Bitcoin may remain vulnerable to further downside despite improving risk sentiment elsewhere in financial markets.
Why Crypto Is Decoupling from Equities
While U.S. equities continue to advance on the back of strong AI-driven earnings growth and investor optimism, crypto markets are facing a unique combination of external macroeconomic headwinds and internal structural weaknesses. As a result, digital assets have decoupled to the downside even as traditional risk assets remain resilient.
Crypto-Specific Pressures
ETF outflows have emerged as one of the most significant drags on sentiment. U.S. spot Bitcoin ETFs recorded 13 consecutive trading sessions of net withdrawals between May 15 and June 3, with total outflows reaching $4.33 billion. The streak marked the longest period of sustained redemptions since the ETFs launched in 2024 and represented a sharp reversal from the $1.97 billion of net inflows seen in April. The shift has weakened one of the key demand drivers behind Bitcoin’s rally earlier this year.
Adding to the pressure, Strategy’s first disclosed Bitcoin sale since 2022—although limited to just 32 BTC—challenged the long-standing perception that major institutional holders would never reduce their positions. The transaction was economically insignificant but symbolically important, undermining a narrative that had supported investor confidence for years.
Meanwhile, Mt. Gox transferred 10,422 BTC, valued at roughly $739 million, ahead of its October creditor repayment deadline. The move revived concerns that a wave of previously locked-up Bitcoin could eventually enter the market, creating additional supply pressure.
Macro Headwinds Affecting All Risk Assets
Crypto is also contending with the same macroeconomic challenges facing broader financial markets.
Inflation remains stubbornly elevated, with April CPI rising 3.8% year-over-year, the highest reading since May 2023. Higher energy prices have added to concerns that inflation could remain above central bank targets for longer than expected.
At the same time, interest-rate expectations have shifted significantly. Prediction markets now imply roughly a 69% probability that the Federal Reserve will leave rates unchanged throughout 2026, a notable departure from the aggressive easing expectations that prevailed at the beginning of the year.
Adding to the challenge, the U.S. dollar has remained firm while Treasury yields have moved higher. The 10-year Treasury yield approached 4.5% on June 3 as stronger labor-market data and elevated oil prices reinforced expectations that monetary policy could remain restrictive. Higher yields increase the opportunity cost of holding non-yielding assets such as Bitcoin and tend to tighten financial conditions across risk markets.
Why Equities Are Holding Up Better
The key difference is that equities still possess a powerful internal growth narrative. Capital continues to flow into AI-related companies, supporting earnings expectations and offsetting some of the macroeconomic pressure. Crypto, by contrast, is experiencing a simultaneous erosion of its own demand base through ETF outflows, weak stablecoin liquidity growth, and renewed concerns about future supply.
In short, equities are managing to absorb macro headwinds because investors remain focused on growth opportunities. Crypto, however, is being squeezed from both directions—facing the same macro pressures as stocks while simultaneously navigating a deterioration in its own liquidity and demand dynamics.
Will Bitcoin Keep Grinding Lower?
For Bitcoin, the near-term outlook revolves around two critical price levels.
The Downside: $60,000
The $60,000 area represents the next major psychological support zone and broadly aligns with estimates of miners’ average production costs. A decisive break below this level would suggest that sellers remain firmly in control, increasing the likelihood that Bitcoin continues searching for a lower cycle bottom.
From a historical perspective, such a move would not be inconsistent with previous four-year market cycles, where prolonged periods of weakness and consolidation often occurred before a sustainable recovery emerged.
The Upside: $70,000
On the other hand, a recovery above $70,000 would be the first meaningful signal that the worst of the correction may already be priced in. Until either level is decisively breached, Bitcoin is likely to remain trapped in a volatile trading range, with price action heavily influenced by macroeconomic developments and shifts in investor sentiment.
With tensions around the Strait of Hormuz still unresolved and geopolitical risks continuing to support inflation concerns, the market currently lacks a clear bullish catalyst. Investors will therefore be closely watching the June 10 CPI release for clues about the future path of monetary policy.
Why the SpaceX IPO Matters
The planned SpaceX listing on June 12 could become an additional headwind for crypto markets. Expected to raise approximately $75 billion at a valuation of around $1.77 trillion, the offering would be the largest IPO on record, with roughly 30% of shares allocated to retail investors.
While the IPO is not directly related to digital assets, it could influence capital flows across risk markets.
Several factors make this possibility noteworthy:
Powerful return narrative: SpaceX’s valuation grew from roughly $500 million in its early years to around $800 billion by late 2025, creating a compelling growth story that may attract significant investor demand.
Fragile crypto sentiment: With Bitcoin under pressure and no obvious catalyst for a near-term rebound, some investors may choose to reallocate capital from crypto into one of the most anticipated equity listings in history.
Limited appeal of fixed income: Elevated yields and bond-market volatility may encourage investors seeking higher returns to favor equities over traditional safe-haven assets.
Portfolio rotation within equities: Capital could rotate from weaker sectors and underperforming stocks into the new listing, further concentrating market attention on a handful of high-profile growth opportunities.
The Bigger Picture
The broader consequence may be an increase in market concentration.
For crypto, any further diversion of capital could intensify liquidity pressures at a time when ETF flows, stablecoin growth, and market sentiment are already deteriorating. Under those conditions, digital assets may remain vulnerable to additional downside.
For equities, the situation is different but not without risk. Market performance has become increasingly dependent on a small number of AI-driven companies, and the addition of another mega-cap growth story could further concentrate investor flows. Historically, highly concentrated markets tend to be less resilient when sentiment eventually shifts.
Unless Bitcoin can reclaim key resistance levels or attract a fresh source of demand, the path of least resistance in the near term remains sideways to lower, with macroeconomic data, liquidity conditions, and cross-market capital flows likely to dictate the next major move.
Liquidity Is Missing, Selling Pressure Is Not
The current Bitcoin market faces a simple but significant problem: demand is weakening while supply continues to rise.
ETF Demand Remains Negative
The most important institutional demand source of the current cycle continues to deteriorate. U.S. spot Bitcoin ETFs recorded 13 consecutive trading sessions of net outflows between May 15 and June 3, with cumulative withdrawals reaching approximately $4.33 billion.
This persistent selling indicates that the primary channel responsible for absorbing large amounts of Bitcoin supply throughout much of the rally is no longer providing meaningful support. As long as ETF flows remain negative, the market loses one of its strongest structural demand drivers.
Stablecoin Liquidity Is Not Replacing Lost Demand
Normally, weakening ETF demand could be offset by rising stablecoin balances on exchanges, which often signal fresh capital waiting to enter the market.
That is not happening.
Data tracking aggregate stablecoin reserves across exchanges shows little evidence of meaningful accumulation since early June. In fact, reserves have generally trended lower since mid-May.
In practical terms, declining stablecoin reserves suggest that fresh buying power is not entering the market. Instead, capital appears to be moving away from exchanges, reducing the amount of liquidity available to absorb selling pressure when prices decline.
Bitcoin Supply Is Moving Onto Exchanges
At the same time, Bitcoin exchange netflow data points to increasing spot-market selling pressure.
Since roughly May 24, netflows have remained predominantly positive, meaning more Bitcoin has been transferred onto exchanges than withdrawn. Historically, this pattern is associated with rising sell-side activity, as investors typically move assets to exchanges when preparing to sell rather than hold them in long-term custody.
An expanding exchange supply base, combined with weakening demand, creates an unfavorable balance for price stability.
A Market Searching for Equilibrium
Taken together, the message from liquidity indicators is clear.
ETF demand has turned negative. Stablecoin reserves are not growing. Bitcoin continues to flow onto exchanges. In other words, the market is losing buyers while gaining potential sellers.
Until fresh liquidity returns or selling pressure eases, Bitcoin is likely to remain in a price-discovery phase as it searches for a level where demand is once again strong enough to absorb available supply. Without that rebalancing, downside risks remain elevated despite periodic relief rallies and short-term technical rebounds.
Leverage Was Hit, But Not Cleared
This week’s market correction triggered a sharp liquidation wave, but it did not fully reset speculative positioning.
Longs Were Heavily Liquidated
As Bitcoin declined, forced deleveraging was concentrated almost entirely on the long side. On June 2, total crypto liquidations reached approximately $1.76 billion, with nearly 90% of that amount coming from long positions.
This indicates that the downturn primarily punished leveraged bullish positioning rather than reflecting a broad-based reduction in risk exposure across both sides of the market.
Open Interest Remains Elevated
Despite the size of the liquidation event, derivatives positioning did not meaningfully reset.
Bitcoin open interest, measured in BTC terms, actually increased after the sell-off, climbing to a record level of roughly 784,000 BTC on June 3. This suggests that while some leverage was flushed out during the decline, speculative exposure quickly rebuilt, keeping overall market leverage structurally high.
In practical terms, the market experienced a liquidation shock without a full deleveraging cycle. That leaves conditions in place for continued volatility if price moves trigger another wave of forced liquidations.
Week Ahead: Key Macro and Market Events
Several high-impact events over the coming days may shape liquidity conditions across both crypto and broader risk assets:
June 10: U.S. CPI (May inflation data)
June 11: U.S. PPI (producer inflation data)
June 11: SpaceX IPO pricing
June 12: SpaceX Nasdaq debut
The SpaceX listing is expected to raise approximately $75 billion at a valuation near $1.77 trillion, making it the largest IPO on record. Two factors are particularly relevant for crypto markets.
1. Price Discovery and Risk Appetite
Private secondary market indications ahead of the IPO have been trading roughly in the $129–$137 range, suggesting limited discount to expected pricing. This means the first trading sessions will likely serve as the true test of demand, revealing how aggressively investors are willing to allocate capital into a highly concentrated growth story.
2. Potential Liquidity Siphon
More importantly for digital assets, the IPO could act as a significant liquidity magnet. Large-scale capital rotation into a single high-profile equity listing may temporarily reduce flows into alternative risk assets, including crypto.
If that occurs during a period of already weak ETF inflows, soft stablecoin liquidity, and elevated derivatives positioning, it could amplify downside pressure on Bitcoin.
At the same time, such concentration of capital into one name can reduce broader market resilience, as fewer assets share investor attention and liquidity. In that environment, smaller shocks can have outsized effects across remaining risk markets.
Overall, the combination of elevated leverage, fragile liquidity, and upcoming macro catalysts sets up a sensitive trading window where Bitcoin’s direction will likely depend less on narrative and more on actual capital flows and forced positioning dynamics.
Oil reacted to the disruption. Bonds responded to the cost. Gold is now reflecting something deeper: a fading sense of confidence.
There is an old hotel tactic used during times of disruption. When one room becomes unusable, guests are relocated to another. If that room develops problems, they are moved again. No one actually leaves the building. They simply shift from floor to floor, with each move marketed as a solution while the underlying issue remains unchanged.
That pattern mirrors market behavior since the Iran conflict escalated in February.
Investors have not discovered genuine safety. Instead, capital has rotated from one source of unease to another. It first rushed into oil, then retreated from bonds, moved away from gold, and eventually returned to gold once the initial shock faded. What was expected to be a safe-haven trade turned into a continuous cycle of repositioning.
The headline story is energy. The more important story is confidence. Gold’s resilience suggests investors are increasingly questioning not just economic fundamentals, but the reliability of the systems meant to provide stability.
The First Domino to Fall
Oil was always destined to react before any other major asset class. The conflict initially impacted the physical foundations of global commerce long before it affected investor sentiment. As concerns grew over the flow of crude through the Strait of Hormuz, markets were forced to account for potential disruptions to one of the world’s most critical energy corridors.
The response was largely driven by fundamentals, not panic. Traders were not pricing fear; they were pricing reduced supply.
Energy underpins nearly every sector of the economy. From transportation and manufacturing to agriculture, aviation, and logistics, economic activity depends on reliable and affordable fuel. When oil prices surge, the effects rarely remain isolated within energy markets. Higher costs gradually work their way through supply chains, ultimately showing up in consumer prices across a wide range of goods and services.
That is why crude oil moved first. It was responding to an immediate threat to supply, making it the first market to reflect the consequences of disruption.
Gold’s Shakeout
Gold’s decline in March caught many investors off guard because it seemed to contradict the usual geopolitical playbook.
The conventional expectation was straightforward: rising geopolitical tensions drive investors toward safe-haven assets, providing support for gold.
Yet gold moved lower.
The reason was far less dramatic than the headlines suggested. In its early stages, the Iran conflict was viewed primarily as an inflationary shock rather than a broad risk-off event. As oil prices surged, bond yields climbed as investors reassessed inflation prospects and the likelihood of tighter monetary policy. Higher real yields and a stronger US dollar created headwinds for precious metals, while investors seeking cash raised liquidity wherever they could.
Gold, being one of the world’s most liquid assets, became a source of funds.
That distinction matters. The sell-off was not a rejection of gold’s role as a store of value. Instead, it reflected a temporary rush for liquidity as markets adjusted to a rapidly changing environment.
Price action supports that interpretation. Gold retraced sharply toward the $4,100 area, bringing its 200-day moving average into focus. However, the longer-term trend remained intact, with the 200-day average continuing to slope higher throughout the correction. Rather than signaling a structural breakdown, the decline resembled a healthy reset within an ongoing bull market.
Bonds Started Asking Questions
While much of the market’s attention was directed toward oil and gold, the bond market was sending a more significant message.
Traditionally, government bonds have served as the ultimate safe haven during periods of geopolitical and economic uncertainty. Yet this time, bond yields rose sharply. Rather than benefiting from a flight to safety, sovereign debt markets began demanding a higher premium from investors.
That development carries important implications.
Conflict raises government spending. Energy shocks fuel inflation. At the same time, many governments are already burdened with debt levels that would have been considered extraordinary only a few decades ago. Investors recognize that financing these obligations requires increasing amounts of borrowing, often at a time when confidence in long-term fiscal stability is becoming less certain.
The response has been telling. While private foreign investors continued allocating capital to US assets, foreign central banks and official institutions quietly moved in the opposite direction, becoming net sellers. Short-term capital remained engaged, but long-term reserve holders appeared increasingly cautious.
The distinction is important. Fast-moving capital often follows opportunity. Reserve capital prioritizes stability and preservation. When the latter begins reducing exposure, it can signal deeper concerns about risk, valuation, and future policy credibility.
For investors, that is a message worth paying attention to.
Why Money Is Returning to Gold
The seemingly erratic rotation of capital begins to make more sense when viewed through a broader framework.
Oil attracted investors because the supply disruption was immediate and tangible.
Bonds lost favour because the fiscal and financing consequences quickly became apparent.
Gold weakened because markets briefly prioritized liquidity above all else.
Yet capital eventually found its way back to gold because gold stands apart from both sets of risks.
Unlike oil, gold is not dependent on vulnerable supply chains or critical shipping routes. Unlike government bonds, it does not rely on policymakers maintaining market confidence or managing growing debt burdens. Gold carries no promise to repay, no maturity date, and no counterparty exposure.
That distinction helps explain why central banks continue adding to their gold reserves even as prices rise. Their purchases are not necessarily a bet on economic perfection or imminent crisis. Rather, they reflect a desire to diversify reserves away from a financial system that increasingly depends on expanding debt and ongoing policy intervention.
The Inflation Markets Have Yet to Fully Price
So far, investors have focused primarily on the most visible consequences of the conflict:
Higher oil prices.
More expensive fuel.
Rising inflation expectations.
The deeper effects are likely to emerge more gradually.
Elevated diesel costs increase transportation expenses. Higher fertiliser prices raise agricultural production costs. More expensive natural gas pressures industrial output. Delayed planting decisions can reduce future crop yields. Food inflation often arrives long after the original energy shock has faded from the headlines.
This is why the broader economic impact may still be underestimated. Oil prices can quickly reflect a supply disruption, but they do not immediately capture the ripple effects that spread throughout the economy over time.
If the conflict persists, the global economy could increasingly face conditions associated with stagflation — slower growth, stubborn inflation, and mounting fiscal strain. Such an environment tends to challenge bond markets and create uncertainty for energy markets.
Historically, however, it has often strengthened the case for gold, particularly when investors become more concerned about preserving purchasing power and reducing exposure to financial and policy-related risks.
The Morning After
A ceasefire or peace agreement would almost certainly spark a relief rally across financial markets. Oil prices would likely retreat as supply concerns fade, bond yields could ease as risk premiums decline, and gold might face short-term profit-taking as investors unwind defensive positions.
However, the end of hostilities would not instantly reverse the economic consequences already set in motion.
Energy inventories would need to be replenished. Damaged infrastructure would require repair. Supply chains disrupted by months of uncertainty would take time to recover. Governments would still be left managing the additional debt and financing costs accumulated during the conflict.
Peace may eliminate the immediate catalyst, but it cannot erase the inflationary pressures that have already filtered through the economy, nor can it remove the growing questions surrounding fiscal sustainability and sovereign balance sheets.
The Room Investors Keep Returning To
The hotel analogy remains relevant.
Capital first crowded into oil as markets focused on supply disruption. Confidence in bonds weakened as investors began confronting the fiscal implications. Gold was temporarily abandoned when liquidity became the market’s highest priority.
Yet each time investors have left, they have eventually found their way back.
Not because gold is the most exciting asset.
Not because it offers income or yield.
But because it remains one of the few assets that exists independently of another party’s obligation.
Stocks depend on earnings. Bonds depend on repayment. Currencies depend on policy credibility. Gold depends on none of these.
That distinction becomes increasingly important when markets shift from pricing a crisis to evaluating its long-term consequences.
Many investors still view the current environment primarily through the lens of war. Gold appears to be responding to something broader: the aftermath.
Oil has priced the disruption. Bonds are pricing the financial burden. Gold is increasingly pricing the slow erosion of confidence that often follows periods of rising debt, persistent inflation, and expanding fiscal commitments.
If that interpretation proves correct, the most significant market story may not be the conflict itself.
It may be what the conflict reveals about the foundations of the financial system long after the headlines fade.
Gold extends its decline from Friday’s strong US NFP-driven selloff, falling to its lowest level since March. Ongoing geopolitical tensions continue to support safe-haven demand for the US Dollar, while persistent inflation concerns reinforce expectations of further Federal Reserve tightening, adding pressure on the non-yielding precious metal.
Gold prices resumed their decline after a brief rebound during Asian trading, slipping to their lowest level since March 23. The precious metal came under pressure as renewed conflict in the Gulf lifted crude oil prices, fueling inflation concerns and strengthening expectations that major central banks may maintain a hawkish stance. As a non-yielding asset, gold has struggled amid rising interest-rate expectations and has now broken below its key 200-day SMA, leaving the $4,300 level in focus for bearish traders.
Geopolitical tensions remain elevated as the Israel-Iran conflict intensifies. Israel reported fresh strikes on military sites in western and central Iran after Iran launched ballistic missile attacks on Israel’s Ramat David air base. The unrest has also spread to neighboring regions, with reported military activity in southern Lebanon and northern Iraq, raising fears of a broader Middle East conflict. These developments have boosted safe-haven demand for the US Dollar, helping it hold near a two-month high and adding further pressure on gold.
Meanwhile, Friday’s stronger-than-expected US Nonfarm Payrolls report reinforced expectations that the Federal Reserve could keep interest rates higher for longer. The US economy added 172,000 jobs in May, significantly above forecasts of 85,000, while the unemployment rate remained steady at 4.3%. The robust labor market data prompted traders to increase bets on additional Fed tightening, with markets now assigning a greater probability of a rate hike before year-end.
The combination of a stronger US Dollar, rising Treasury yield expectations, and persistent inflation risks continues to favor downside pressure in gold. With no major US economic releases scheduled for Monday, market attention will remain focused on geopolitical developments. Later this week, traders will closely watch US CPI and PPI data, as well as policy decisions from the Bank of Canada and the European Central Bank, for fresh direction across financial markets.
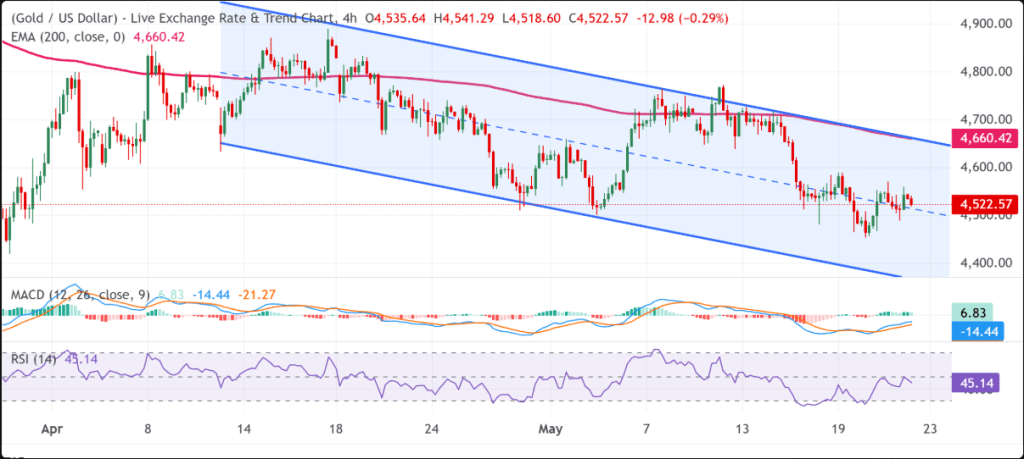
Gold Daily Chart
Gold remains under bearish pressure after breaking below its 200-day Simple Moving Average (SMA), with the broader downtrend still intact. XAU/USD continues to move within a descending parallel channel, while technical indicators reinforce the negative outlook. The Moving Average Convergence Divergence (MACD) remains firmly in bearish territory and continues to weaken, signaling sustained selling momentum. Meanwhile, the Relative Strength Index (RSI) hovers near 33, indicating strong downside pressure, although approaching oversold territory could limit the pace of further declines in the near term.
On the upside, immediate resistance is seen at the 200-day SMA around $4,436.56, with stronger resistance emerging near the upper boundary of the descending channel at $4,555.49. As long as prices remain below these levels, the broader bearish trend is likely to persist.
On the downside, initial support is located near the channel’s lower boundary at $4,242.07. A decisive break below this support zone could accelerate losses and pave the way for a deeper correction, reinforcing the prevailing bearish market structure.
The US Dollar Index remained largely unchanged near 100.10 during Monday’s Asian trading session. The greenback drew support after Israel reported carrying out strikes on Iran in response to missile attacks, while stronger-than-expected US employment data prompted traders to increase expectations of a Federal Reserve rate hike later this year.
The US Dollar Index (DXY), which tracks the Greenback against a basket of six major currencies, hovered near 100.10 during Monday’s Asian session, holding close to a one-month high. The index remained supported by growing geopolitical tensions in the Middle East and increasing expectations that the Federal Reserve could tighten monetary policy further later this year.
According to reports, Israeli forces launched strikes on military sites in western and central Iran after Iran fired multiple missiles toward northern Israel. Iranian state media also reported explosions in several cities, including Isfahan, Tabriz, and Tehran, although details remained limited.
Meanwhile, US President Donald Trump stated that he would urge Israeli Prime Minister Benjamin Netanyahu to avoid retaliatory action following Iran’s missile attacks, which were launched in response to an earlier strike near Beirut. The heightened geopolitical uncertainty has boosted demand for safe-haven assets, lending additional support to the US Dollar.
The Greenback also benefited from stronger-than-expected US labor market data. The US economy recorded a third consecutive month of solid job growth in May, with Nonfarm Payrolls increasing by 172,000, exceeding market expectations of 85,000. The previous month’s figure was revised up to 179,000. At the same time, the unemployment rate held steady at 4.3%, matching forecasts.
Following the jobs report, investors significantly increased their expectations for further Fed tightening. Market pricing now implies more than a 70% chance of a rate hike in December, up sharply from roughly 45% a week earlier.
Commenting on the data, Capital Economics Chief Markets Economist Jonas Goltermann noted that the latest payroll figures suggest the US labor market continues to strengthen despite elevated energy prices. He added that this backdrop increases the likelihood of Fed policy tightening, with Capital Economics now expecting the Federal Open Market Committee (FOMC) to deliver two 25-basis-point rate hikes before year-end.
The Nasdaq 100 finished the week with a notably bearish candlestick pattern, largely driven by Friday’s sharp sell-off following the latest employment data. Investors reacted to concerns that the strong jobs report could prompt the Federal Reserve to maintain elevated interest rates for an extended period. Higher borrowing costs tend to weigh on growth-oriented sectors, particularly technology stocks. However, the longer-term outlook remains supported by ongoing enthusiasm for the technology sector and the artificial intelligence trend. If these structural growth drivers remain intact, the Nasdaq 100 may eventually recover and resume its upward trajectory.
Some additional downside momentum could emerge in the near term given the market’s weak weekly close. However, the 28,500 level remains an important area to monitor. If the Nasdaq 100 manages to hold above this support zone, it may present an attractive opportunity for buyers to re-enter the market. Conversely, a sustained move below 28,500 could increase selling pressure and pave the way for a decline toward the 26,000 level.
USD/MXN
The US Dollar strengthened against the Mexican Peso over the course of the week, although the 17.50 area continues to act as a significant resistance level. The key question is whether this barrier can remain intact. With the pair likely to challenge this level again as trading resumes, a breakout is certainly possible. Even so, any gains beyond 17.50 may be limited, with the 18.00 level representing a likely upside target. Mexico’s substantially higher interest rates continue to provide strong support for the Peso, making it difficult for USD/MXN to sustain a more pronounced rally.
If the US Dollar begins to gain significant upward momentum against the Mexican Peso, it may be more attractive to take long Dollar positions against other currencies instead. This is because holding a long USD/MXN position can involve substantial swap or carry costs, which may reduce the overall appeal of the trade despite any potential appreciation in the Dollar.
Gold
Gold came under heavy selling pressure, a move that was not entirely unexpected after interest rates surged on Friday. The decline has pushed prices below the lower boundary of the hammer candlestick formed the previous week, signaling a notable deterioration in the technical outlook. This bearish development raises the risk of further downside. The 50-week EMA, currently located around the $4,270 level, represents a key support area. If gold falls below this threshold and selling momentum persists, the metal could experience a much deeper corrective move.
The current weakness in gold is largely tied to expectations that US interest rates will remain elevated for an extended period. Friday’s stronger-than-expected jobs report reinforced this view, leading investors to scale back hopes for near-term monetary easing. However, if bond yields begin to decline—particularly if the US 10-year Treasury yield falls below the 4.50% level—the pressure on gold could ease, potentially allowing the precious metal to stabilize and recover.
Silver
Silver has slipped below the key $70 level, an area that previously served as an important support zone. The metal is now testing its 200-day EMA on the daily chart, making this a critical point for traders to watch. A decisive break below this technical indicator could signal further weakness and increase the likelihood of a decline toward the $65 level, based on signals from the longer-term weekly chart analysis.
At this stage, silver’s outlook remains heavily dependent on a decline in US interest rates. Persistent high yields continue to weigh on the precious metal, limiting its ability to sustain upward momentum. From a technical perspective, the weekly chart shows three consecutive attempts to push higher that were ultimately rejected, a pattern that reflects weakening bullish sentiment. For silver to regain strength and reverse its recent downtrend, support from the bond market—particularly through lower Treasury yields—may be necessary.
USD/CHF
The US Dollar strengthened significantly during the week, surpassing the key 0.79 mark against the Swiss Franc. This move suggests that the pair could continue its upward momentum, potentially advancing toward the 0.81 level.
The interest rate outlook in the United States remained volatile, with yields rising following the latest employment data. This increase further widened the rate gap between the US and Switzerland, enhancing the appeal of the US Dollar. As a result, the pair is likely to maintain its upward trajectory. Any near-term declines could present buying opportunities, provided US Treasury yields remain elevated. However, if the 10-year Treasury yield falls significantly, particularly below 4.50%, the bullish outlook for the Dollar may begin to weaken.
USD/ZAR
The US Dollar advanced against the South African Rand during the week, climbing above the 16.50 level as US interest rates moved higher. While South Africa continues to maintain higher rates than the United States, the widening strength of US yields has narrowed the interest rate advantage. Despite the recent gains, market participants may be watching for signs that the rally is losing momentum, which could encourage renewed selling pressure on the pair.
If bullish momentum continues to build, the pair could extend its advance toward the 50-week EMA, which is currently located around the 16.91 level.
GBP/USD
The British Pound came under heavy pressure against the US Dollar during the week, which was not particularly surprising given the broad-based strength of the Greenback. The key question now is whether the 1.33 level can continue to act as a support zone. If it holds, buyers may attempt to stabilize the market, but a decisive break below this level could signal further downside ahead.
The 1.33 level has been a significant support area for an extended period and is likely to remain a key focus for traders. If the pair can find support and rebound from this zone, the British Pound could regain strength and stage a recovery against the US Dollar. However, maintaining this level will be crucial for preserving the broader bullish outlook.
USD/CAD
The US Dollar posted a strong advance against the Canadian Dollar, rising to test the key 1.3950 level. This price zone has served as an important area of support and resistance on multiple occasions, making it a significant point of interest for traders. With the pair closing near this level, it is reasonable to expect continued volatility and choppy price action as the market attempts to determine its next direction.
If US interest rates continue to move higher, the USD/CAD pair is likely to maintain its upward momentum, potentially targeting the 1.4150 level. Conversely, if Treasury yields begin to decline, the pair could come under pressure and retreat toward the 1.38 level. As a result, the direction of US interest rates is likely to remain a key driver of price action in the near term.
USD/JPY
The US Dollar ended the week by testing the critical ¥160 level against the Japanese Yen. This is a closely watched psychological and technical threshold, and its importance to market participants could lead to heightened volatility as traders assess whether the pair has enough momentum to break higher or if resistance will hold.
This is a level where the Bank of Japan has intervened in the past, making it an area that deserves close attention. If USD/JPY can break decisively above the ¥160.50 level, it could trigger a significant bullish breakout by surpassing a major swing high that has stood since 1990. Such a move would likely reinforce the pair’s long-term upward momentum. In the meantime, any short-term pullbacks are likely to be viewed as buying opportunities by traders looking to participate in the broader uptrend.
EUR/USD
The Euro came under significant pressure this week, largely driven by rising US interest rates and the resulting strength of the US Dollar. With that in mind, it will be important to watch whether the market moves down to test the 1.14 level. While a rebound from that area is certainly possible, patience may be warranted. Rather than buying immediately, it may be wiser to wait for a clear “V-shaped” recovery pattern to emerge on the chart, as this would provide stronger confirmation that bullish momentum is returning.
Given the current market conditions, I am content to remain on the sidelines and observe how trading develops on Monday before making any decisions. The market may provide clearer direction after the initial reaction to recent price movements and interest rate expectations.
The recent wave of selling in US spot Bitcoin ETFs has emerged as one of the clearest signs that institutional investors are becoming more cautious toward risk assets.
The BlackRock iShares Bitcoin Trust (IBIT) experienced net outflows totaling approximately $2.43 billion across nine consecutive trading sessions in May 2026. The streak culminated on May 26 with a $1.26 billion dark-pool block transaction, the largest single-day redemption recorded since the fund launched in January 2024.
Blockchain data reinforced the scale of the withdrawal activity. Roughly 6,005 BTC—worth about $403 million at the time—was transferred from custody wallets associated with IBIT to Coinbase Prime, offering direct evidence of the redemption process behind the reported fund outflows.
The sustained withdrawals effectively erased much of the nearly $3 billion that flowed into IBIT during April, a month that marked one of the strongest periods of spot Bitcoin ETF demand since October 2025.
The sharp reversal in investor flows, coupled with the sizable movement of Bitcoin to an exchange-linked custody platform, intensified risk-off sentiment across crypto markets. It also contributed additional sell-side liquidity to spot markets during a period already characterized by macroeconomic uncertainty.
Understanding the IBIT Redemption Trend
At the time of the outflow cycle, IBIT held an estimated 660,000–670,000 BTC, representing roughly $44–46 billion in assets under management. Against that backdrop, the $2.43 billion withdrawal equates to around 5–5.5% of total fund assets, suggesting a meaningful portfolio reallocation rather than routine redemption activity.
The magnitude of the May 26 event was particularly notable. The previous record for a single-session outflow stood at approximately $649 million in January, making the latest redemption nearly twice as large.
Data from CoinGlass also showed that selling pressure extended beyond IBIT. Comparable outflows were recorded across other major spot Bitcoin ETFs, including Fidelity’s FBTC, ARK Invest’s ARKB, and Grayscale’s GBTC. The synchronized withdrawals point to a broader institutional de-risking trend rather than concerns tied to any individual fund.
Longer-Term Context Remains Constructive
Despite the weakness seen in May, the broader flow picture remains positive. US spot Bitcoin ETFs still entered June with nearly $2 billion in net inflows year-to-date, while cumulative inflows since launch remained in the region of $58–59 billion.
As a result, although the recent redemption wave represents a significant short-term shift in sentiment, it has not fundamentally altered the larger institutional positioning that was built throughout 2024 and 2025. The data suggests a period of risk reduction and portfolio adjustment rather than a wholesale abandonment of long-term Bitcoin exposure.
Macro Conditions and Institutional Positioning: The Risk-Off Shift Driving Bitcoin ETF Outflows
The nine-session streak of Bitcoin ETF outflows unfolded against a backdrop of elevated US Treasury yields and a Federal Reserve policy stance that investors viewed as restrictive for risk assets. As financial conditions tightened, Bitcoin slipped below key consolidation levels, reinforcing bearish sentiment across digital asset markets.
Institutional investors responded by scaling back exposure to higher-volatility assets, including Bitcoin ETFs. The trend was not confined to the United States. Between May 25 and May 29, European crypto exchange-traded products recorded approximately $1.67 billion in net outflows, highlighting a broader global shift toward risk reduction.
The coordinated withdrawals across multiple regions suggest that the recent selling pressure reflects a wider institutional portfolio reallocation rather than concerns tied solely to BlackRock’s IBIT or other US-listed Bitcoin ETFs.
Interestingly, capital has not been exiting the crypto sector altogether. Newly launched XRP spot ETFs attracted roughly $132 million in net inflows without registering a single day of net redemptions during the same period. This divergence points to a rotation within digital assets, as investors selectively reallocate capital toward alternative crypto exposures rather than abandoning the asset class entirely.
$63,000 Emerges as Bitcoin’s Key Inflection Point
Bitcoin continues to trade just above the $63,000 level, a threshold increasingly viewed as the dividing line between a healthy consolidation phase and a more pronounced corrective move.
Should the market break decisively below this support zone, downside momentum could accelerate toward the $60,000 area, where longer-term investors have historically demonstrated stronger buying interest. Such a bearish outcome would likely be driven by continued institutional outflows, persistently high real yields, and Bitcoin’s inability to reclaim resistance around $65,000.
On the other hand, the bullish case remains intact if ETF redemptions begin to stabilize after the recent wave of selling. A softer-than-expected inflation report or a more accommodative tone from the Federal Reserve could improve risk sentiment and encourage fresh institutional allocations. Given that assets held by spot Bitcoin ETFs remain historically elevated despite recent withdrawals, a shift in macro expectations could provide the catalyst for Bitcoin’s next upward move.
For now, the $63,000 region represents the market’s most important near-term battleground, with the interplay between ETF flows and Federal Reserve policy likely determining Bitcoin’s next major directional trend.
For several weeks, reports have indicated that Washington and Tehran are edging closer to a memorandum of understanding (MOU). Such an agreement would effectively extend the current ceasefire for around 60 days, providing both sides with time to pursue a broader and more durable peace arrangement. Many investors view this as a positive development for energy markets, expecting oil flows through the Strait of Hormuz to stabilize rapidly and potentially return to normal in short order.
However, that expectation may be overly simplistic. Even if an MOU is reached, it would not automatically trigger a significant increase in oil supply. In the near term, any additional barrels entering the market would likely come from crude that has already been produced, including oil held in storage or aboard stranded and floating vessels, rather than from a meaningful recovery in production or exports. As a result, the initial impact would be more about easing existing logistical bottlenecks than expanding the overall supply base.
The market also appears to be underestimating the operational challenges involved. Over the past two months, tanker fleets have been repositioned worldwide, insurance costs have risen sharply, and shipping risks remain elevated. Restoring normal trade flows is far more complicated than simply reopening a route. Shipowners and insurers will require confidence that vessels can safely transit the region before committing substantial capacity. Concerns over mines, navigation risks, military miscalculations, or renewed hostilities are unlikely to disappear immediately, meaning confidence may take time to rebuild.
From a broader perspective, a lasting recovery in supply would likely require something much more comprehensive than a temporary MOU. A full-scale agreement between the United States and Iran remains difficult to achieve, with major differences still unresolved regarding nuclear restrictions, sanctions relief, and the long-term framework governing transit through the Strait of Hormuz. These issues are deeply interconnected and unlikely to be settled quickly, even under favorable circumstances.
Realistically, negotiations could consume much of the proposed 60-day period, pushing discussions into the peak U.S. summer driving season. Moreover, the path toward a final agreement is unlikely to be smooth. The complexity that makes a comprehensive deal difficult to secure also increases the possibility of setbacks, delays, or periodic flare-ups. While markets often focus on eventual outcomes, they are generally less effective at pricing the risks associated with the negotiation process itself. In this case, that process matters greatly, as any disruption could quickly affect both sentiment and physical oil flows.
At the same time, underlying supply conditions remain tight. Inventories continue to decline steadily, and a prolonged negotiation period could accelerate those draws. Against this backdrop, the near-term balance of risks for crude oil prices still appears tilted to the upside. For that outlook to change meaningfully, investors would likely need to see not only a short-term MOU but also tangible progress toward a broader agreement capable of restoring shipping activity on a more permanent basis. For now, market pricing seems to reflect a level of confidence that may be running ahead of actual developments.
SpaceX is unlikely to arrive on public markets as a conventional IPO.
If reports prove accurate, the company could debut at a valuation typically associated with the world’s largest publicly traded corporations. According to Reuters, SpaceX is seeking to raise approximately $75 billion at $135 per share, implying a valuation near $1.75 trillion. By comparison, Morningstar has reportedly estimated the company’s value at roughly $780 billion.
The significant gap between those estimates highlights the challenge of valuing a business as unique as SpaceX.
More than a standard listing, the IPO may become a test of how public markets assign value to vision when traditional valuation methods begin to lose their effectiveness.
Investors are being asked to assess a company whose activities span rocket launches, satellite broadband, telecommunications infrastructure, defense, data networks, artificial intelligence ambitions, and the broader reputation of Elon Musk as an executor of ambitious projects. Few listed companies offer a meaningful comparison.
Conventional valuation models work best when businesses have clear peers, predictable cash flows, stable margins, and an understandable connection between current earnings and future returns. SpaceX does not fit comfortably into any single category. It is simultaneously an aerospace company, infrastructure provider, telecom platform, defense contractor, technology business, and long-term industrial project.
As a result, the IPO could become a much larger market event than a typical public offering.
The key issue is not whether SpaceX is an exceptional company. Few would dispute that. The more important question is whether even exceptional businesses can become overvalued when investors begin paying not only for existing achievements but also for future possibilities.
Markets have encountered similar challenges before. Tesla encouraged investors to think beyond automobile sales. Nvidia pushed them to look beyond semiconductors. The AI boom prompted markets to focus on future infrastructure demand rather than current earnings. SpaceX may take this dynamic even further by asking investors how much they should pay today for opportunities that may not materialize for years.
There is nothing unusual about investing based on future growth. Equity markets are built on that concept. The challenge emerges when a narrative becomes so compelling that virtually any valuation can be justified by referencing a future that has yet to arrive.
The stronger the story becomes, the more difficult it can be to distinguish conviction from extrapolation.
Supporters of a premium valuation have legitimate arguments. SpaceX has developed capabilities and market positions that few competitors can match. Starlink has transformed satellite broadband into a global business. The company dominates commercial launch services and holds strategically important relationships with governments and defense agencies. Its technological advantages may create barriers to entry that standard valuation frameworks fail to capture.
These strengths deserve serious consideration, particularly given SpaceX’s proven execution record.
However, a valuation approaching $1.75 trillion would require investors to pay not only for current performance but also for continued success across several highly complex businesses. Such a valuation assumes sustained growth in Starlink, continued leadership in launch services, ongoing defense relevance, potential AI-related infrastructure opportunities, future space-economy expansion, and continued confidence in Musk’s ability to push the company into new frontiers.
In other words, multiple layers of future success would already be embedded in the price.
That does not necessarily mean the IPO is overpriced. Rather, it means the investment case depends heavily on how investors assess probabilities. The critical question may not be whether SpaceX can become more valuable in the future. Instead, investors must determine how much of that future is already reflected in the proposed valuation.
For public-market investors, that distinction is crucial.
A company can be outstanding and still generate disappointing returns if the purchase price already assumes near-perfect outcomes. Even businesses that transform industries can underperform expectations if execution takes longer, costs more, or requires greater capital than anticipated.
This consideration is particularly relevant for SpaceX because the company is selling more than financial performance. It is offering a vision of scale, ambition, and strategic importance. While that can be highly attractive to investors, it can also blur the line between rigorous analysis and belief.
Several questions therefore need to be separated.
Is SpaceX an exceptional company? Likely yes.
Is it strategically important? Again, likely yes.
Does it deserve a valuation premium? Probably.
But the fourth question is different: does the proposed IPO valuation provide investors with a sufficient margin of safety?
That is where the debate becomes more difficult.
The lack of direct comparables complicates the analysis. Aerospace companies fail to capture Starlink’s platform characteristics. Telecom companies do not reflect the strategic value of space infrastructure. Defense contractors overlook commercial optionality. Technology firms may underestimate capital intensity, while infrastructure companies often fail to reflect growth potential.
Each comparison explains part of the business, but none explains the whole company.
This gives bullish investors room to argue that SpaceX deserves an entirely new valuation framework. At the same time, skeptics may question whether the absence of comparables is being used to justify almost any price.
Ultimately, the IPO will test not only investor demand for SpaceX but also the market’s ability to remain disciplined when evaluating a compelling narrative.
History shows that the biggest market winners often appeared expensive in their early stages. Yet successful long-term investments require more than an attractive story. They require a balance between price, execution, risk, and time that still leaves room for meaningful returns.
SpaceX brings that challenge into unusually sharp focus.
There is also the issue of investor participation. Reuters has reported that retail investors could receive an unusually large allocation. If true, this could add another dimension to the offering. Strong retail demand may boost enthusiasm, but it can also increase sensitivity to sentiment and narrative-driven momentum, particularly during the early stages of trading.
For long-term investors, the challenge is avoiding the assumption that visibility equals certainty.
SpaceX is highly visible. Musk is highly visible. Themes such as Mars exploration, Starlink, AI infrastructure, defense technology, and orbital networks are all highly visible as well. Yet visibility does not necessarily make valuation easier. In many cases, it makes discipline harder because investors fear missing a transformative opportunity.
The greatest risk may not be failing to recognize the opportunity, but assuming that the opportunity justifies any price.
The SpaceX IPO therefore represents more than a chance to invest in space-related growth. It is a test of how public markets evaluate companies whose narratives are larger than their current financial results, whose peer groups are imperfect, and whose futures may be extraordinary but remain uncertain.
Investors do not need to choose between skepticism and enthusiasm. A better approach is to separate the quality of the company from the attractiveness of the stock.
SpaceX may be one of the defining private companies of its generation. That does not automatically mean every IPO valuation will be attractive.
Ultimately, the central question is not whether SpaceX is visionary. It is whether the proposed valuation leaves enough room for that vision to unfold without requiring everything to go exactly as planned. In that sense, SpaceX is not merely asking investors to buy shares. It is asking them to place a value on belief—and in financial markets, belief is never free.
The AUD/USD pair weakens to around 0.7120 during the early Asian trading hours on Friday. The Australian Dollar comes under pressure after Iranian officials stated that discussions in Washington had produced “no tangible progress,” dampening market sentiment. Meanwhile, support for the Aussie remains limited despite Reserve Bank of Australia (RBA) Governor Michele Bullock reiterating that policymakers are prepared to take whatever action is necessary to fulfill the central bank’s mandate.
The AUD/USD pair edges lower to around 0.7120 during the early Asian session on Friday as risk sentiment remains fragile amid ongoing tensions in the Middle East. Investors are also turning their attention to the US Nonfarm Payrolls (NFP) report for May, due later in the day.
Market caution intensified after Iran’s Foreign Minister, Abbas Araghchi, stated on Wednesday that there had been “no tangible progress” in efforts to end the conflict in the Middle East. He added that communication channels with Washington remain open but warned that any Israeli strike on Beirut as part of its campaign against Hezbollah could trigger a full-scale escalation involving the United States and Iran.
Traders are likely to keep a close eye on developments surrounding US-Iran negotiations. Persistent uncertainty or renewed geopolitical tensions could increase demand for safe-haven assets, supporting the US Dollar and weighing on the AUD/USD pair in the near term.
Meanwhile, the Australian Dollar found limited support from hawkish remarks by Reserve Bank of Australia (RBA) Governor Michele Bullock on Thursday. Bullock reiterated that the central bank remains firmly committed to bringing inflation back under control after delivering three interest-rate increases this year, which lifted the cash rate to 4.35%. She stressed that inflation remains uncomfortably high and emphasized that policymakers are prepared to take whatever measures are necessary to achieve price stability and full employment.
Silver prices declined sharply to around $72.40 as Federal Reserve officials reiterated concerns about persistent inflationary pressures.
Fed official Schmid noted that policymakers may need to either maintain interest rates at elevated levels for longer or consider further rate hikes to keep inflation under control.
Meanwhile, investors remain focused on the upcoming US Nonfarm Payrolls (NFP) report for May, which could provide fresh clues about the labor market and the future path of monetary policy.
Silver prices (XAG/USD) fell nearly 2% to around $72.40 during Friday’s Asian session, coming under heavy selling pressure after several Federal Open Market Committee (FOMC) officials highlighted persistent inflation risks and suggested that policymakers may need to either maintain current interest rates for an extended period or raise them further.
Higher interest rates from the Federal Reserve (Fed) are generally unfavorable for non-yielding assets such as Silver, as they increase the opportunity cost of holding precious metals.
Speaking at the Bank of Kansas City Economic Forum on Thursday, Kansas City Fed President Jeffrey Schmid emphasized that inflation remains the primary threat to the economy. He noted that policymakers are debating whether to keep rates unchanged for longer or tighten monetary policy further to bring inflation back toward the Fed’s target.
Market participants are now turning their attention to the US Nonfarm Payrolls (NFP) report for May, scheduled for release at 12:30 GMT. Economists expect the US economy to have added 85,000 jobs during the month, down from 115,000 in April. The unemployment rate is forecast to remain steady at 4.3%, while annual Average Hourly Earnings—a key gauge of wage inflation—are projected to slow to 3.4% from the previous 3.6%.
A stronger-than-expected employment report could reinforce expectations that the Fed will maintain a hawkish stance this year. However, weaker labor-market data may have only a limited effect on policy expectations, as Fed officials appear increasingly focused on addressing elevated inflation pressures.
Gold prices move lower during Friday’s Asian trading session.
The precious metal remains under pressure as ceasefire negotiations between the United States and Iran show no meaningful progress.
Market participants are now awaiting the release of the US Nonfarm Payrolls (NFP) report for May, scheduled later on Friday.
Gold prices (XAU/USD) come under renewed selling pressure during Friday’s Asian session, slipping toward their lowest level of the week. The precious metal remains highly sensitive to ongoing geopolitical developments, with investors closely watching both the status of US-Iran ceasefire negotiations and the release of the US May employment report later in the day.
On Wednesday, Iran’s Foreign Minister, Abbas Araghchi, stated that negotiations aimed at ending the Middle East conflict had produced “no tangible progress.” While he noted that communication channels with Washington remain open, he warned that any Israeli strike on Beirut as part of operations against Hezbollah could trigger a full-scale renewal of the US-Iran confrontation.
Despite Iran’s assessment that talks have stalled, Donald Trump maintained that ceasefire discussions are nearing their final stage. Tensions escalated further on Wednesday after Iran launched missiles and drones at Kuwait and Bahrain, resulting in one fatality and multiple injuries at Kuwait’s main airport, following a US strike on an oil tanker bound for Iran.
The continued lack of progress toward a ceasefire after the most intense violence seen in weeks has heightened concerns about inflation and reinforced expectations that interest rates could remain elevated for longer. These factors have weighed on gold, which offers no yield to investors.
According to Bart Melek of TD Securities, rising inflation expectations linked to negative supply shocks have pushed bond yields higher, supported the US Dollar, and led markets to begin pricing in a potential Federal Reserve rate hike in late 2026.
Attention now turns to the US labor market report. Economists expect the May Nonfarm Payrolls (NFP) report to show an increase of 85,000 jobs, while the unemployment rate is forecast to remain unchanged at 4.3%. Any unexpectedly weak labor market data could pressure the US Dollar and provide support for gold prices in the near term.
Gold Daily Chart
Gold remains under bearish pressure in the near term
From a technical perspective, Gold (XAU/USD) continues to exhibit a negative near-term outlook. On the daily chart, the metal is trading below both the 100-day Moving Average and the middle Bollinger Band, reinforcing the prevailing downward trend. Meanwhile, the Relative Strength Index (RSI) is hovering around 40, indicating weak momentum without yet reaching oversold territory, which suggests there is still room for additional downside before sellers become exhausted.
On the upside, immediate resistance is seen near the middle Bollinger Band at around $4,545. Further barriers emerge at the upper Bollinger Band near $4,715, followed by the 100-day Moving Average at $4,795, which could limit any stronger recovery attempt.
On the downside, initial support lies near the lower Bollinger Band at approximately $4,370. A decisive break below this level could accelerate the correction and expose deeper losses. Conversely, if prices remain above this support area, Gold may enter a period of consolidation while maintaining its broader bearish structure.
The US Dollar Index retreats as improving market sentiment follows reports that Israel and Lebanon agreed to renew their ceasefire on Wednesday.
Risk appetite remains tempered, however, after President Trump warned that the ceasefire could be scrapped if Iran-backed forces were responsible for the deaths of US troops.
The Greenback could regain momentum if robust US employment data for May strengthens expectations that the Federal Reserve will keep interest rates elevated or raise them further.
The US Dollar Index (DXY), which tracks the Greenback against a basket of six major currencies, remains under pressure after posting gains for three consecutive sessions, hovering near 99.50 during Thursday’s Asian trading hours.
The US Dollar softened as risk sentiment improved following news that Israel and Lebanon agreed on Wednesday to renew their ceasefire. The deal, reached after US-mediated talks in Washington, is contingent on a “complete cessation” of hostilities by Iran-backed Hezbollah.
Although Israel and Lebanon do not maintain formal diplomatic ties, both sides also agreed to establish several pilot security zones where the Lebanese Armed Forces will exercise exclusive control, preventing the presence of non-state armed groups.
However, the improvement in market sentiment remained limited. According to reports from the Wall Street Journal, US President Donald Trump told advisers he could reconsider the ceasefire arrangement if Tehran were responsible for the deaths of US troops. Trump maintained that the week-long suspension of airstrikes remains in effect despite continued clashes in the region. He also indicated in an interview with the New York Post that a blockade extending through Labor Day remains a possibility, potentially delaying expectations for the reopening of the Strait of Hormuz.
Meanwhile, the Greenback could find renewed support as investors increasingly anticipate that the Federal Reserve may tighten monetary policy further this year. Better-than-expected US labor market indicators, including May’s ADP private employment figures and JOLTS job openings data, reinforced confidence in the resilience of the US economy and strengthened the case for higher interest rates for a longer period.
Market expectations have shifted notably as the ongoing conflict involving Iran continues to disrupt energy markets, lifting oil prices and fueling inflationary pressures. According to the CME FedWatch Tool, traders are now pricing in roughly a 42% probability of a Federal Reserve rate hike by December.
USD/CHF moves lower as the US Dollar comes under pressure amid improving market sentiment following the renewal of the Israel-Lebanon ceasefire on Wednesday. However, the Greenback could find support from robust May employment figures, which have reinforced expectations that the Federal Reserve may keep tightening monetary policy. Meanwhile, Swiss National Bank President Martin Schlegel recently stated that the SNB remains prepared to intervene if tensions in the Middle East drive excessive appreciation of the Swiss Franc.
USD/CHF snapped its three-session advance and traded near 0.7910 during Thursday’s Asian session as the US Dollar weakened amid improving risk sentiment. Market appetite for risk increased after Israel and Lebanon agreed to renew their ceasefire on Wednesday, although the deal remains conditional on a complete halt to hostilities by the Iran-backed Hezbollah group. The agreement followed US-mediated discussions in Washington.
Despite the absence of formal diplomatic ties between the two countries, both sides also agreed to create several pilot security zones where the Lebanese armed forces would assume sole authority, excluding all non-state actors from those areas.
However, losses in USD/CHF may remain limited as the US Dollar could regain support from growing expectations that the Federal Reserve will tighten monetary policy further this year. Strong US labor market indicators, including May’s ADP private employment report and JOLTS job openings data, reinforced confidence in the resilience of the economy and encouraged speculation that interest rates may stay elevated for longer.
At the same time, the ongoing conflict involving Iran has continued to disrupt energy markets, pushing oil prices higher and intensifying inflation concerns. Reflecting this shift in sentiment, the CME FedWatch Tool now indicates roughly a 42% chance of a Fed rate hike in December.
Meanwhile, Martin Schlegel, Chairman of the Swiss National Bank, stated that the Swiss Franc’s real overvaluation is considerably less pronounced than its nominal overvaluation. He also emphasized that the SNB stands ready to increase its foreign-exchange market interventions if heightened Middle East tensions trigger excessive safe-haven demand for the Swiss Franc.
USD/JPY pulls back from a more than one-month peak reached on Thursday, although selling pressure remains limited. The US Dollar faces headwinds following the Israel–Lebanon ceasefire, while concerns over potential Japanese intervention also weigh on the pair. Nevertheless, the broader technical picture remains constructive, suggesting traders should be cautious about anticipating a deeper corrective decline.
The USD/JPY pair edged lower during Thursday’s Asian trading session as speculation grew that Japanese authorities could once again intervene to support the Japanese Yen (JPY). At the same time, the ceasefire between Israel and Lebanon encouraged traders to lock in profits on US Dollar (USD) positions, adding downward pressure to the pair.
Despite the pullback, selling momentum remains limited, with the pair continuing to trade near the key 160.00 level and close to a one-month peak reached earlier in the day. Concerns about the broader economic impact of tensions in the Middle East have discouraged aggressive Yen buying. Meanwhile, lingering uncertainty surrounding US-Iran negotiations and expectations that the US Federal Reserve (Fed) will maintain a hawkish stance continue to underpin the USD, helping to cushion losses in USD/JPY.
From a technical standpoint, the pair maintains a positive near-term outlook within a rising channel pattern. The channel’s lower boundary aligns closely with the 200-period Simple Moving Average (SMA), which provided support on Wednesday. The Relative Strength Index (RSI) remains above its midpoint, signaling mild bullish momentum, while the Moving Average Convergence Divergence (MACD) has flattened slightly below zero.
These indicators suggest the uptrend may be slowing rather than reversing. Consequently, any short-term decline could attract renewed buying interest around the important support zone near 159.45. However, a decisive break below this area could trigger additional technical selling and open the door for a deeper correction. As long as the pair holds above the 159.44 support region, the broader bullish bias remains intact, with a move toward the upper boundary of the channel near 160.14 continuing to be the favored scenario.
USD/CAD edges higher as risk-off sentiment leaves the Canadian Dollar unable to benefit from stronger crude oil prices. WTI crude extends gains after Iran launched unsuccessful ballistic missile attacks on Kuwait and Bahrain, heightening concerns over Middle East supply disruptions. Meanwhile, the US Dollar strengthens as fears surrounding a potential Strait of Hormuz closure fuel inflation worries and reinforce expectations that the Fed could keep interest rates higher for longer.
USD/CAD trades modestly higher around 1.3850 during Wednesday’s Asian session after posting slight losses in the previous session. The commodity-linked Canadian Dollar (CAD) remains subdued despite a continued rise in crude oil prices, as heightened market risk aversion keeps traders cautious and limits demand for risk-sensitive currencies.
West Texas Intermediate (WTI) crude extends its rally for a third straight session, hovering near $92.60 per barrel at the time of writing. Oil prices surged following renewed tensions in the Middle East after Iran launched ballistic missiles toward Kuwait and Bahrain. According to reports, the US Central Command (CENTCOM) intercepted the missile and drone attacks while carrying out self-defense strikes on Iran’s Qeshm Island.
Concerns over a prolonged closure of the Strait of Hormuz have intensified fears of wider energy supply disruptions, potentially fueling global inflation pressures. This environment continues to strengthen expectations that the Federal Reserve (Fed) will keep interest rates elevated for longer, providing additional support to the US Dollar (USD). The higher-for-longer rate outlook is also backed by resilient US economic data, with the May 2026 ISM Manufacturing PMI rising to 54.0 from 52.7 and exceeding market forecasts to mark the strongest expansion in factory activity since May 2022.
Further signs of economic resilience emerged from the labor market, as April JOLTS job openings climbed to a near two-year high of 7.61 million while layoffs declined. With both manufacturing and employment indicators remaining firm, investors are now turning their focus to Friday’s Nonfarm Payrolls report for further insight into the future direction of Fed monetary policy.
Gold comes under renewed selling pressure on Wednesday as concerns grow that interest rates will remain elevated for longer. Rising oil prices continue to stoke inflation fears, strengthening expectations of a more hawkish stance from central banks. Meanwhile, bets on additional Fed rate hikes in 2026 lend support to the US Dollar and add further pressure on the precious metal.
Gold (XAU/USD) extends the previous session’s late retreat from the $4,550 area and remains under pressure during Wednesday’s Asian trading session. Crude Oil prices climb for a third consecutive day amid renewed Middle East tensions, reigniting inflation concerns and reinforcing expectations that interest rates could stay higher for longer. This backdrop continues to weigh on the non-yielding precious metal. At the same time, persistent geopolitical uncertainty helps the US Dollar (USD) maintain its weekly gains, adding further downside pressure on Gold and keeping prices below the $4,500 level near the lower end of the weekly range.
Recent developments in the Middle East have intensified market caution after the US military’s Central Command (CENTCOM) confirmed “self-defence” strikes on Iran’s Qeshm Island. In retaliation, Iran launched missiles and drones targeting US military facilities in Kuwait and Bahrain, though most were intercepted by US and Gulf defence systems. Meanwhile, clashes between Israel and Hezbollah have also escalated. In addition, stalled US-Iran negotiations over Tehran’s nuclear program and the Strait of Hormuz continue to raise fears of a broader regional conflict, keeping geopolitical risks elevated.
US Secretary of State Marco Rubio stated that Washington will not lift sanctions on Iran in exchange for reopening the Strait of Hormuz, emphasizing that sanctions relief would require Iran to abandon enriched uranium activities. Meanwhile, US President Donald Trump announced an open-ended extension of the ceasefire and the continuation of the US blockade until negotiations are resolved “one way or the other.” These developments have helped Crude Oil prices rebound further from last Friday’s one-month low, amplifying inflation worries and strengthening expectations for a more hawkish approach from major central banks, including the US Federal Reserve (Fed).
Further supporting this view, Cleveland Fed President Beth Hammack said on Tuesday that the Fed remains committed to bringing inflation back to its 2% target and may need to act soon if price pressures fail to ease. Additionally, the CME Group’s FedWatch Tool indicates that markets are now pricing in more than a 50% chance of a 25-basis-point Fed rate hike at the December meeting. The outlook for elevated US Treasury yields continues to support the USD and contributes to the softer tone surrounding Gold prices.
Gold H4 Chart With Analysis
From a technical standpoint, XAU/USD continues to exhibit a bearish tone, trading within a descending parallel channel and below the 200-period Exponential Moving Average (EMA) on the 4-hour chart. The Relative Strength Index (RSI) remains around 46, signaling mildly negative momentum without entering oversold territory. In addition, the Moving Average Convergence Divergence (MACD) has slipped back below the zero line, indicating that recent stabilization attempts are fading within the broader downtrend.
The current setup suggests that any rebound could encounter immediate resistance around the 200-EMA near $4,598.83. Beyond that, the upper boundary of the descending channel near $4,634.83 represents another key hurdle that bulls would need to reclaim to weaken the prevailing bearish outlook. On the downside, the lower edge of the channel around $4,322.55 serves as the next important support level. A decisive break below this zone would confirm continued bearish momentum and potentially pave the way for deeper losses.
US Dollar Index remains steady as uncertainty over a potential US-Iran deal intensifies.
The US Dollar Index stays flat near 99.25 as uncertainty surrounding a potential US-Iran deal continues to rise. Renewed attacks between Washington and Tehran have revived concerns over a possible escalation in the Middle East conflict. Meanwhile, investors are turning their focus to upcoming US economic releases, including the ADP Employment Change, ISM Services PMI, and May’s Nonfarm Payrolls report.
The US Dollar (USD) traded in a subdued manner during Wednesday’s Asian session, despite rising uncertainty over a potential United States-Iran agreement after both sides exchanged attacks.
At the time of writing, the US Dollar Index (DXY), which measures the Greenback against a basket of six major currencies, was little changed around 99.25.
On Tuesday night, the US Central Command (CENTCOM) announced it had intercepted multiple Iranian missile and drone strikes aimed at regional allies such as Kuwait and Bahrain, while also launching defensive operations against targets on Iran’s Qeshm Island.
The developments have reignited concerns over a renewed Middle East conflict, a situation that could drive oil prices higher and provide further support for the US Dollar.
Historically, the Greenback tends to strengthen during periods of geopolitical tension, as rising energy prices fuel inflation pressures and reduce expectations for aggressive Federal Reserve (Fed) rate cuts.
On the economic front, traders are awaiting the release of the US ADP Employment Change report and the ISM Services Purchasing Managers’ Index (PMI) for May during the North American session.
Meanwhile, Tuesday’s US JOLTS Job Openings report for April exceeded forecasts, showing 7.618 million available positions versus market expectations of 6.88 million.
Attention now turns to Friday’s US Nonfarm Payrolls (NFP) report for May, which is expected to be the key catalyst for the US Dollar this week.
New Zealand Dollar strengthens after upbeat China PMI data, ending a two-day decline against the US Dollar.
NZD/USD gains traction on Wednesday, supported by a mix of positive catalysts. Stronger-than-expected China Services PMI data and the Reserve Bank of New Zealand’s hawkish stance underpin the Kiwi, while a softer US Dollar adds further support. However, ongoing geopolitical tensions may help limit broader USD weakness and restrain additional upside for the pair.
The NZD/USD pair moved higher during Wednesday’s Asian session, climbing toward the 0.5935 area after stronger-than-expected China Services PMI data boosted market sentiment. The pair appears to have ended a two-day losing streak, although ongoing geopolitical tensions could limit further upside.
Data released by RatingDog showed China’s Services PMI rising to 54.4 in May from 52.6 previously, beating market expectations of 52.3 and marking the fastest expansion in three months. The upbeat figures supported antipodean currencies, including the New Zealand Dollar.
Additional support for the Kiwi came from the Reserve Bank of New Zealand’s (RBNZ) unexpectedly hawkish stance and softer demand for the US Dollar. The RBNZ signaled a strong likelihood of a 25-basis-point rate hike at its July 8 meeting and projected the Official Cash Rate (OCR) could climb to around 2.85% by year-end, suggesting as many as three further hikes.
By contrast, markets currently see only a little more than a 50% chance of one additional rate increase from the US Federal Reserve (Fed) this year. Combined with uncertainty surrounding US-Iran negotiations, this has weighed on the Greenback and supported NZD/USD.
Meanwhile, geopolitical risks remain elevated. Reports indicated that US forces intercepted Iranian missile and drone attacks targeting regional allies while carrying out defensive strikes on Iran’s Qeshm Island. US Secretary of State Marco Rubio also stated that sanctions relief for Iran would depend on Tehran abandoning enriched uranium activities.
In addition, US President Donald Trump announced an open-ended extension of the ceasefire alongside the continuation of a US blockade until negotiations are resolved. The persistent geopolitical uncertainty could continue supporting the US Dollar and cap gains for NZD/USD.
Investors now await the US ADP private employment report and the ISM Services PMI data later in the North American session for fresh market direction.
Markets have spent much of the year betting on a diplomatic resolution to tensions between the United States and Iran. That assumption has now come under increasing strain.
Iran’s decision to suspend negotiations with Washington marks a significant shift in the outlook and raises doubts about whether a political solution remains within reach. The oil market responded swiftly, reflecting growing concerns over the potential for a prolonged period of instability in one of the world’s most strategically important energy-producing regions.
Reports suggesting Tehran has halted indirect talks with the U.S. and is considering measures affecting the Strait of Hormuz represent more than just another setback in a long-running dispute. They force investors to confront a broader question: what if the current breakdown in diplomacy is not temporary, but instead signals an extended period of geopolitical uncertainty?
Under such circumstances, Brent crude appears increasingly likely to rise above $100 per barrel and potentially remain elevated for an extended period.
For months, investors have largely focused on the possibility of a negotiated settlement. Military escalations were often viewed as temporary disruptions, balanced by expectations that diplomatic efforts would eventually resume. Any signs of progress fueled hopes that tensions would ultimately be contained.
That narrative is now facing a serious challenge.
The Strait of Hormuz remains a critical artery for global energy markets, carrying roughly 20% of worldwide oil consumption as well as a substantial share of LNG exports. Any threat to shipping through the strait immediately raises concerns about supply security, inflation risks, and global economic growth.
Despite recent gains, oil prices still appear to reflect only a partial risk premium. If traders were fully convinced that a lengthy disruption to Hormuz was imminent, crude prices would likely be significantly higher than current levels.
In other words, the market is increasing the probability of supply disruptions but has not yet fully priced in a worst-case scenario.
That distinction is important.
Current pricing suggests investors still believe diplomatic channels could eventually reopen and prevent a severe supply shock. However, repeated failures in negotiations have a way of gradually changing market expectations. While markets can tolerate disappointment for a time, there comes a point when disappointment itself becomes the dominant narrative.
This latest setback follows a period of optimism that had pushed oil prices lower on expectations of easing tensions and improved shipping security. Those hopes have once again been called into question.
As a result, investors should pay close attention not only to where oil prices are heading, but also to the message the energy market is sending.
Crude markets are increasingly challenging the assumption that this conflict will be resolved in the near term.
Many investors still appear to be expecting a resolution measured in weeks rather than months. If that assumption proves incorrect, the implications could extend well beyond the energy sector.
Sustained oil prices above $100 per barrel would add fresh inflationary pressure at a time when major central banks have been moving toward a more accommodative policy stance. Higher energy costs would feed through to transportation, manufacturing, and household expenses, while placing additional pressure on corporate margins.
Over the past year, markets have largely positioned for a gradual decline in inflation and lower interest rates. A prolonged energy shock would complicate that outlook, raising uncertainty around monetary policy, corporate earnings, consumer spending, and economic growth.
For that reason, the latest developments are about far more than oil alone.
Investors are evaluating what higher energy prices could mean for virtually every major asset class.
The prevailing view has been that the conflict would eventually be brought under control. However, if suspended negotiations, threats to the Strait of Hormuz, and rising regional tensions persist into the coming months, that consensus is likely to face growing pressure.
Markets have spent months anticipating a diplomatic breakthrough. Iran’s withdrawal from negotiations serves as a reminder that political solutions do not always arrive on schedule.
Should confidence in a negotiated settlement continue to fade, oil prices may still have considerable room to move higher.
Oil prices remain heavily influenced by developments surrounding Iran, as uncertainty persists over the status of negotiations between the United States and Iran.
Crude prices moved higher yesterday after reports suggested that US-Iran talks had once again stalled. Similar headlines have repeatedly driven market volatility in recent months, while conflicting signals continue to emerge. Although President Trump has indicated that discussions are still ongoing, oil markets remain highly sensitive to rapidly changing news flow.
At the same time, Iran issued warnings directed at ships passing through the Bab el-Mandeb Strait, a critical Red Sea shipping route responsible for a significant share of global energy transportation. This raises concerns for the oil market, particularly because Saudi Arabia has rerouted substantial export volumes from the Persian Gulf to Red Sea terminals. Any disruption in Red Sea traffic could force tankers to seek longer alternative routes via the Suez Canal and around the Cape of Good Hope.
Russia has also introduced a ban on jet fuel exports through the end of November following an increase in Ukrainian drone strikes targeting energy infrastructure. While Russia exports only about 30,000 barrels per day of jet fuel and the broader market impact is expected to be limited, the restriction adds further strain to an already tight refined products market affected by Middle East supply risks.
A more significant threat would emerge if Russia imposes restrictions on diesel exports. Recent reports indicate that authorities are evaluating potential measures to curb diesel shipments abroad.
European natural gas storage levels have finally surpassed 40% capacity, although they remain well below the five-year average of 54%. With peace negotiations showing little progress, concerns are growing that LNG supplies from the Middle East could face prolonged disruptions. If supply issues persist, Asian buyers may increasingly turn to the spot market to replace contracted volumes. Reflecting these concerns, the Dutch government has approved nearly €1 billion in funding for EBN Capital, the state-owned energy company, to support storage refilling. Current backwardation in European gas markets offers limited commercial incentive to build inventories ahead of winter. EBN has been authorized to store up to 80 TWh of natural gas.
Meanwhile, the European Union plans to transfer more than 190 million carbon allowances into its Market Stability Reserve during the 12-month period beginning September 1. The move reflects the carbon market surplus accumulated through 2025 and will result in reduced auction volumes.
Metals – Copper Supported by Tariff Uncertainty
Copper prices in both New York and London advanced yesterday as markets awaited the US administration’s decision regarding potential import tariffs.
The Commerce Department had previously postponed immediate tariff implementation and proposed a phased approach starting at 15% in early 2027. The proposal is currently under review, with updated recommendations expected by the end of June. Expectations surrounding the decision have widened the premium for US copper prices and encouraged increased shipments into American ports. Ongoing uncertainty over tariffs is expected to continue providing support for copper market sentiment.
Agriculture – Uganda Coffee Exports Decline
According to the latest figures from Uganda’s Coffee Development Authority, the country’s coffee exports fell 14% year-on-year to 591,700 bags in April.
The decline was mainly attributed to traders delaying sales amid weaker global coffee prices and improving supply prospects. Despite the monthly slowdown, cumulative exports during the 2025/26 season (October–April) reached 4.3 million bags of 60 kilograms each.
Separately, the Pakistan Sugar Mills Association has urged the government to authorize exports of 760,000 tonnes of surplus sugar after maintaining a one-month strategic reserve. The association estimates national sugar inventories at 7.9 million tonnes, compared with expected domestic consumption of approximately 6.6 million tonnes.
Gold remains under pressure as higher oil prices and escalating tensions with Iran reignite inflation concerns. Elevated inflation risks are reinforcing expectations that the Federal Reserve will keep interest rates higher for longer, limiting the upside potential for the precious metal. Market participants are now looking to upcoming U.S. economic releases, particularly the Nonfarm Payrolls report, for clues that could determine gold’s next significant move.
Gold prices moved lower during Monday’s European trading session as investors responded to a renewed surge in oil prices following another weekend of escalating tensions between the United States and Iran. Hopes that both sides were making progress toward a durable agreement have faded, with fresh military confrontations underscoring the ongoing instability in the region.
The decline comes after gold managed a modest rebound late last week, which helped improve short-term sentiment. However, the broader outlook remains less constructive than it was earlier in the year. After a strong first quarter performance, bullion has struggled to build sustained upward momentum, with back-to-back monthly losses indicating a more cautious approach from investors.
Looking ahead, gold’s near-term direction remains uncertain as markets navigate a mix of geopolitical risks and a busy calendar of key U.S. economic data releases that could shape expectations for monetary policy and broader market sentiment.
1. Ceasefire Hopes Fade as Tensions Re-Emerge
Market sentiment improved toward the end of last week after reports indicated that Washington and Tehran were considering an extension of the existing ceasefire arrangement. The proposal reportedly included a longer truce period and initiatives aimed at reducing disruptions to shipping through the Strait of Hormuz.
Although no official agreement was reached, the possibility of easing geopolitical tensions was enough to boost risk appetite across global markets. Equities remained well supported, particularly U.S. technology stocks, while investors reduced some of their safe-haven allocations.
Gold also benefited from the improved sentiment. After slipping to a two-month low, the precious metal rebounded sharply as buyers stepped in near a key technical support area around $4,400.
However, developments over the weekend have challenged that more optimistic outlook. Renewed hostilities between the U.S. and Iran have pushed oil prices higher and undermined some of the confidence that had supported financial markets in recent sessions.
2. Inflation Concerns Remain a Key Headwind
Beyond geopolitical developments, inflation expectations are once again becoming a major factor influencing gold prices.
Recent U.S. inflation reports suggest that price pressures remain persistent, with rising energy costs playing a significant role in the latest uptick. The increase in oil prices linked to Middle East tensions has heightened concerns that inflation could remain above central bank targets for longer than previously anticipated.
This creates a complex environment for gold investors.
On one side, geopolitical uncertainty and elevated inflation risks tend to strengthen demand for traditional safe-haven assets such as gold. On the other, stubborn inflation reduces the likelihood of Federal Reserve rate cuts in the near term.
The prospect of higher interest rates for longer raises the opportunity cost of holding non-yielding assets like gold, limiting the metal’s upside potential. As a result, the ongoing battle between safe-haven demand and restrictive monetary policy continues to shape the broader gold market outlook.
3. U.S. Economic Data Could Determine Gold’s Next Direction
Investor focus now shifts to a busy week of key U.S. economic releases that could provide fresh clues on growth, inflation, and monetary policy.
The ISM Manufacturing and Services PMIs will offer insight into business activity and pricing pressures across the economy. Any evidence of slowing economic momentum could reinforce expectations that policymakers may eventually adopt a more accommodative stance.
The week’s most closely watched event, however, will be Friday’s Nonfarm Payrolls report.
A stronger-than-expected jobs reading could lift Treasury yields and support the U.S. dollar, creating additional pressure on gold prices. Conversely, signs of a cooling labor market may revive expectations for future Fed easing, providing a supportive backdrop for bullion.
With geopolitical tensions, inflation risks, and critical economic data all converging this week, gold is likely to remain highly sensitive to incoming headlines and could be poised for a significant move in either direction.
Gold Technical Analysis
From a technical standpoint, the $4,400 level remains a key support area for gold. It aligns closely with the upward-sloping 200-day moving average, a level that has consistently provided support during past pullbacks.
A decisive break below $4,400 would indicate that the current correction may have further room to extend, with the next support levels coming in near $4,200 and potentially $4,000.
On the upside, immediate resistance is seen around $4,580. A move above this barrier could pave the way for a test of $4,650, while stronger bullish momentum may bring the $4,700 region back into focus.
At present, gold is being influenced by opposing market forces. Ongoing geopolitical tensions continue to support safe-haven demand, but persistent inflation concerns and expectations of higher interest rates for longer are restricting upside potential. Until one of these drivers becomes dominant, gold is likely to remain range-bound and volatile, with the near-term bias still favoring the downside following the decline seen over the past three months.
Silver regains modest upward momentum but continues to trade within a multi-day consolidation range. The technical outlook still calls for caution among bulls ahead of any new long positions. A breakout above the $78.25–$78.45 resistance zone is required to invalidate the current bearish bias.
Silver (XAG/USD) attracts buyers in the Asian session on Tuesday, trading near the $75.70–$75.75 area and posting gains of over 1% on the day. However, the metal remains stuck in a multi-day consolidation range, keeping bullish conviction in check.
From a broader technical perspective, XAG/USD continues to trade below the 23.6% Fibonacci retracement of its recent decline from the May peak. It also remains under the 100-period SMA, which aligns with the 38.2% Fibonacci level—reinforcing a near-term bearish bias unless price can reclaim this key confluence zone.
Momentum indicators remain mixed: the RSI sits around 52, pointing to neutral, range-bound momentum, while the MACD is slightly positive, suggesting a fragile attempt at stabilization rather than a firm trend reversal.
As a result, the $78.25–$78.45 area—where the 100-period SMA and 38.2% Fibo converge—continues to act as a major resistance zone. A sustained breakout above this region would be needed to shift the outlook and expose upside targets at $80.50, $82.56, and $85.48, with the broader cycle high near $89.20.
On the downside, stronger structural support is seen around $71.81, where buyers may re-emerge if the current consolidation resolves to the downside.
WTI could regain some ground as Tehran has suspended indirect talks with the United States.
Iran and its allies are reportedly planning to block the Strait of Hormuz and the Bab el-Mandeb Strait in a move aimed at pressuring Israel and its supporters.
Meanwhile, Goldman Sachs has cautioned that weaker-than-expected demand in China and Europe could pose significant downside risks to its fourth-quarter oil price outlook.
WTI crude slipped slightly after a sharp 4.71% rally in the previous session, trading near $90.60 per barrel during Asian hours on Tuesday. The pullback came despite heightened geopolitical tensions following reports from Iran’s Tasnim news agency that Tehran has suspended indirect negotiations with the United States.
The report also indicated that Iran and its “Resistance Front” allies across Yemen, Lebanon, and Iraq have coordinated plans to disrupt key maritime routes, including a potential blockade of the Strait of Hormuz and increased activity around the Bab el-Mandeb Strait, aimed at pressuring Israel and its allies.
Adding to the concerns, an Axios report on X suggested Iran deployed additional naval mines in the Strait of Hormuz last week, intensifying fears over the security of one of the world’s most critical energy chokepoints. These developments have raised doubts over any near-term de-escalation in the region.
However, US President Donald Trump struck a more optimistic tone, saying negotiations are still ongoing and hinting that a memorandum of understanding to reopen the Strait of Hormuz could be reached within a week. At the same time, regional diplomatic efforts continue, with Lebanon pushing to broaden ceasefire arrangements involving Hezbollah and Israel.
On the demand side, broader macroeconomic concerns are weighing on sentiment. Weak manufacturing data from China has added to worries about slowing growth in the world’s second-largest economy. Reflecting this, Goldman Sachs warned that softer oil demand in both China and Europe could pose significant downside risks to its fourth-quarter price forecasts, though it noted that persistent supply disruptions in the Middle East could still provide upside support.
EUR/USD edges higher around 1.1635 in early Tuesday Asian trading. However, fresh geopolitical tensions in the Middle East may pressure the euro as a risk-sensitive currency. Meanwhile, ECB’s Schnabel cautioned that such shocks can no longer be overlooked.
EUR/USD posts modest gains near 1.1635 in early Tuesday Asian trading, though upside momentum may remain capped amid rising geopolitical risks. Iran’s announcement to halt indirect talks with the US and fully close the Strait of Hormuz has heightened risk-off sentiment, potentially supporting safe-haven flows into the US dollar.
Meanwhile, preliminary Eurozone HICP data is due later on Tuesday and may provide fresh direction for the pair.
According to CNBC, Iranian negotiators will stop communicating with the US via intermediaries and move to close the Strait of Hormuz in response to alleged ceasefire violations. US President Donald Trump said he urged Israeli Prime Minister Benjamin Netanyahu to avoid a major strike on Beirut, claiming Israeli forces were pulled back. However, Netanyahu disputed this, stating that operations against Hezbollah in southern Lebanon will continue.
Escalating tensions in the Middle East could strengthen the US dollar as a safe-haven asset, weighing on EUR/USD.
On the European side, the euro may find some support from the ECB’s relatively hawkish tone. ECB Executive Board member Isabel Schnabel noted that inflationary pressures linked to the Iran conflict can no longer be ignored, as price increases are broadening beyond energy and inflation expectations risk becoming unanchored.
Gold’s behavior during the recent U.S.-Iran conflict has defied both historical precedent and conventional market logic. Instead of rising when geopolitical tensions escalated and falling when tensions eased, gold has often done the opposite. However, several factors suggest this unusual pattern is likely temporary. If Iran continues to keep the strategically vital Strait of Hormuz closed, the near-term outlook for gold could become increasingly bullish.
Since the conflict began in late February, many of gold’s largest daily price swings have been driven by war-related headlines. Surprisingly, gold frequently sold off following military escalations and rallied on reports hinting at diplomatic progress. For example, gold fell sharply after Israeli strikes targeted Iran’s South Pars gas field, yet surged when reports emerged that the U.S. might accept an end to the conflict without reopening the Strait of Hormuz.
This “war-is-bearish, peace-is-bullish” relationship has become so pronounced that traders can often infer major geopolitical developments simply by observing gold’s overnight price action. A strong rally has typically signaled optimism about a peace agreement, while a steep decline has often coincided with military escalation.
Historically, gold has behaved very differently. Rising geopolitical risks have traditionally fueled safe-haven demand, attracting capital seeking protection from uncertainty. Following Russia’s invasion of Ukraine in 2022, for instance, gold climbed roughly 7.5% within two weeks. Yet despite the potentially larger economic consequences of the Iran conflict, gold has experienced a significant decline since the war began.
One explanation is that gold entered the conflict after an extraordinary multi-year bull market. By early 2026, gold had already posted one of the strongest cyclical advances in modern history, leaving the market extremely overbought and vulnerable to a major correction. Some of the initial weakness may therefore have reflected a natural rebalancing process rather than a response to geopolitical developments.
However, that explanation alone does not fully account for gold’s continued inverse reaction to war news. Analysts have increasingly pointed to another factor: gold has become a source of emergency liquidity for countries facing severe economic stress from soaring energy prices.
The closure of the Strait of Hormuz has disrupted a critical artery of global trade. Roughly one-fifth of the world’s oil and liquefied natural gas supplies pass through the Strait, along with significant volumes of fertilizers, sulfur, helium, aluminum, and other industrial materials. As energy prices surged, import-dependent nations faced mounting pressure on their currencies, trade balances, and inflation rates.
Turkey provides one of the clearest examples. Faced with a collapsing currency and soaring import costs, its central bank reportedly sold substantial amounts of gold reserves to stabilize financial conditions. This large-scale liquidation injected considerable supply into the market, contributing to gold’s sharp decline even as geopolitical risks intensified.
The situation gave rise to the “emerging-market piggy bank” thesis: countries struggling with higher energy costs may be forced to sell reserve assets—including gold—to fund imports, support their currencies, or subsidize domestic energy prices. Gold’s decline, therefore, may reflect forced selling rather than a lack of safe-haven demand.
India has faced similar pressures. As one of the world’s largest gold consumers and a major energy importer, it has experienced currency weakness and rising costs linked to the Strait closure. In response, Indian authorities significantly increased import duties on gold and silver, aiming to curb demand and reduce pressure on the country’s balance of payments. Concerns over weaker Indian gold demand further weighed on prices.
Taken together, Turkey’s reserve liquidations and India’s restrictions on gold imports appear to explain much of gold’s counterintuitive reaction to the conflict. These unusual circumstances have temporarily overwhelmed the metal’s traditional safe-haven role. As a result, gold’s recent tendency to fall on bad geopolitical news may be less a new market paradigm and more a short-lived anomaly driven by extraordinary economic stress in energy-importing nations.
Why Gold’s Unusual War Trade May Not Last
It is easy to understand why sentiment toward gold has turned increasingly negative in recent months. However, that does not necessarily mean gold will continue reacting negatively to escalating conflict. Like many popular market narratives, the current view appears overstated, and key data already challenges one of its central assumptions: central banks are not abandoning gold.
Following reports that Turkey sold large amounts of gold reserves to support its currency, many analysts expected global central-bank demand to collapse. Yet data from the World Gold Council showed otherwise. First-quarter 2026 central-bank purchases totaled 243.7 tonnes, virtually unchanged from the average pace of recent years. Turkey’s sales appear to have been a temporary liquidity measure rather than a structural shift away from gold.
Concerns about India’s higher gold import tariffs have also fueled bearish sentiment. While the new taxes could reduce Indian gold demand by roughly 25% this year, the potential shortfall represents only a small fraction of total global investment demand. Demand from other regions could easily offset much of that decline, particularly if inflation pressures intensify worldwide.
The larger issue is the ongoing disruption caused by the closure of the Strait of Hormuz. Prior to the conflict, roughly one-fifth of global oil consumption flowed through this critical shipping route. Although governments and companies have relied on strategic reserves and stored inventories to soften the blow, those buffers are steadily shrinking. As stockpiles decline, energy markets could face renewed supply pressures and significantly higher prices.
Iran appears to recognize that keeping the Strait effectively disrupted may be its strongest strategic leverage. By maintaining uncertainty around commercial shipping, it can continue exerting economic pressure without direct military escalation. The longer these disruptions persist, the greater the inflationary impact on the global economy.
Higher oil prices would raise transportation costs across virtually every industry, while fertilizer shortages and rising agricultural expenses could push food prices higher. Combined with weather-related challenges affecting crop production, inflationary pressures may become increasingly difficult to ignore.
Such an environment would likely strain economic growth, weaken corporate profits, and challenge elevated stock-market valuations. Rising inflation could also push bond yields higher, creating a more favorable backdrop for gold as a portfolio diversifier and inflation hedge.
Despite gold’s strong long-term performance, American investors remain significantly underexposed. The combined value of gold held through major U.S. gold ETFs represents only a tiny fraction of the value of the U.S. stock market. Even modest shifts in portfolio allocations toward gold could generate substantial new demand.
Meanwhile, gold futures positioning suggests speculative investors have plenty of room to increase exposure. After several months of consolidation, much of the excess enthusiasm that characterized gold’s record rally has been worked off, leaving the market in a healthier technical position.
As a result, the conditions for another upward leg in gold may be falling into place. While seasonal weakness could persist through early summer, rising inflation, tighter energy markets, and growing pressure on traditional financial assets could eventually reignite investor demand.
Bottom Line
Gold’s recent tendency to fall on worsening war news is likely an anomaly rather than a lasting trend. Much of the weakness can be traced to exceptional events such as Turkey’s reserve sales and concerns over India’s import restrictions. Yet global central-bank demand remains resilient, and the economic consequences of prolonged energy disruptions could ultimately strengthen the investment case for gold.
If inflation accelerates as energy and food prices rise, investors may once again turn to gold for protection and diversification. Given how little gold many stock investors currently own, even a modest reallocation of capital could provide meaningful support for prices in the months ahead.
International investors and governments increased their holdings of U.S. Treasury securities to an all-time high of $9.49 trillion in February 2026, with holdings rising $587 billion year-over-year and nearly $200 billion in a single month.
Central banks continued accumulating gold, adding 244 tonnes during the first quarter of 2026 and extending a buying streak that has lasted 17 months. However, because gold is traded globally in U.S. dollars, this trend still reinforces the dollar’s central role in the financial system.
The United Arab Emirates’ decision to withdraw from OPEC/OPEC+ came shortly after U.S. officials endorsed a potential emergency dollar liquidity arrangement for Abu Dhabi, highlighting the strategic influence of dollar-based financial support.
U.S. sanctions efforts against Iran have successfully frozen $344 million worth of cryptocurrency assets, illustrating how digital financial infrastructure linked to the dollar can strengthen U.S. economic enforcement power.
Overall, evidence from Treasury market demand, rising foreign capital inflows, and expanding digital-dollar adoption suggests that predictions of the dollar’s decline are not supported by current data.
For years, predictions of the US dollar’s decline have dominated headlines, and those claims have only grown louder. Critics argue that BRICS nations are creating a viable alternative to the dollar, China is reducing its holdings of US Treasuries, gold is poised to replace the dollar as the world’s primary reserve asset, and the US government is struggling to attract buyers for its mounting debt—so much so that it is allegedly using dollar swap lines with Gulf nations as an indirect liquidity support mechanism.
While these arguments make for a compelling narrative, the underlying data tells a different story. Despite the persistent warnings from dollar skeptics, there is little evidence to suggest that the dollar’s dominant role in the global financial system is meaningfully eroding.
The dollar’s dominance is far from disappearing. If anything, the developments seen in late April 2026 provided one of the strongest pieces of evidence in years that its position in the global financial system remains firmly intact.
Theory vs. Reality
For years, I’ve argued that the “dollar collapse” narrative mistakenly equates inflation with currency debasement. Those are not the same thing. A currency cannot realistically be considered debased when global demand for it continues to intensify. We’ve explored this rebasement perspective before in our discussions of the dollar’s global funding system and in The Dollar’s Death Is Greatly Exaggerated. The latest figures only strengthen the case that the U.S. dollar remains firmly dominant.
The most recent Treasury International Capital (TIC) report from the U.S. Treasury, released on April 15 and covering February 2026 activity, showed foreign investors purchased $101 billion of long-term U.S. securities in a single month. Total net TIC inflows reached $184.5 billion, while foreign investors also increased their Treasury bill holdings by another $91.6 billion. As a result, foreign ownership of U.S. Treasuries climbed to a record $9.49 trillion in February, rising by $198 billion during the month and by $587 billion over the previous year.
Even that record figure understates the true scale of foreign demand. It excludes Treasury exposure held through U.S.-based hedge funds and the Cayman Islands basis trade. According to Federal Reserve estimates, these channels account for roughly an additional $1.5 trillion of effective foreign demand. When those positions are included, total foreign-linked exposure to U.S. Treasuries approaches $11 trillion, underscoring the continued global appetite for dollar-denominated assets.
Looking beyond the total amount of debt outstanding, the flow data paints the same picture. Indirect bidders—widely viewed as a gauge of foreign demand—have consistently accounted for more than 70% of successful bids in recent Treasury auctions. Meanwhile, bid-to-cover ratios for both 10-year and 30-year Treasury sales have remained above 2.5 through multiple market cycles, signaling robust investor appetite.
If the world were genuinely abandoning the dollar, the evidence would look very different: weaker auction participation, higher yields caused by poorly received offerings, and a rising term premium as investors demanded greater compensation to absorb excess supply. Yet the data points in the opposite direction. Despite the U.S. running approximately $2.5 trillion in deficits over the past year, global investors have continued to absorb the resulting Treasury issuance with little difficulty.
Far from resembling a rush for the exits, these trends suggest exceptionally strong demand. In fact, they point to one of the most powerful and persistent periods of global demand for U.S. government debt ever recorded.
How Central Bank Gold Purchases Strengthen the Dollar’s Position
This is where many dollar-collapse narratives begin to break down. Gold advocates often make a fundamental mistake by treating central bank gold accumulation as proof that the world is abandoning the U.S. dollar. The reality is more nuanced.
There is no dispute that central banks have been aggressively increasing their gold reserves. According to the World Gold Council’s Q1 2026 Gold Demand Trends report, released on April 29, official-sector institutions purchased a net 244 tonnes of gold during the first quarter alone, a 3% increase from the same period a year earlier. That marked the seventeenth consecutive month of net central bank buying, despite gold prices surpassing $5,400 per ounce in January. Physical gold demand reached 474 tonnes during the quarter, making it the second-strongest first quarter on record. Looking ahead, the World Gold Council expects central banks to purchase approximately 850 tonnes of gold throughout 2026, broadly matching 2025 levels and extending a multi-year trend of substantial accumulation.
The trend is both genuine and important. However, interpreting it as evidence of a mass exodus from the dollar is a leap that the data does not support. Central banks are adding gold primarily as a reserve diversifier and geopolitical hedge, not as a replacement for the dollar-based financial system. Gold can store value, but it cannot replicate the liquidity, collateral function, settlement infrastructure, or global financing role provided by U.S. Treasury securities and dollar-denominated markets.
In other words, rising gold reserves and continued dollar dominance are not mutually exclusive. Central banks can accumulate gold while still relying heavily on dollars for trade settlement, reserve management, cross-border financing, and international liquidity. The growth of official gold holdings reflects diversification at the margin—not a practical abandonment of the world’s primary reserve currency.
A key point often overlooked in de-dollarization debates is that gold itself remains deeply embedded within the dollar-based financial architecture. Gold may be a reserve asset, but it is still primarily valued through a dollar lens. The London Bullion Market Association (LBMA) benchmark—the global standard used to value central bank gold holdings—is quoted in U.S. dollars per ounce. Whether it is the People’s Bank of China, the National Bank of Poland, or the Reserve Bank of India increasing its gold reserves, those holdings are ultimately measured, reported, and assessed in dollar terms.
The same principle applies when central banks use gold as a source of liquidity. Whether through swaps, repurchase agreements, or outright sales, transactions are typically priced against dollar benchmarks. Gold and dollars are therefore not competing monetary systems operating independently of one another. Rather, gold functions as a reserve asset within a broader framework that is still largely organized around the U.S. dollar.
This distinction fundamentally changes how central bank gold purchases should be interpreted. If a central bank reallocates 5% of its reserves from U.S. Treasuries into gold, that does not constitute an exit from the dollar system. It is simply a portfolio adjustment within a reserve structure where assets continue to be valued and compared using dollar-based metrics. The same logic applies to gold swaps conducted through the Bank for International Settlements, yuan-denominated contracts traded on the Shanghai Gold Exchange, and even the large gold accumulation programs undertaken by Central Bank of the Russian Federation before sanctions. Regardless of the transaction venue or currency of quotation, reserve managers still evaluate those positions against their dollar-equivalent value.
Viewed through that lens, growing gold reserves do not necessarily undermine dollar dominance. In many respects, they reinforce it by relying on the dollar as the world’s primary unit of account for reserve wealth.
The same surveys frequently cited as evidence of de-dollarization illustrate this nuance. While many central banks expect the dollar’s share of reserves to gradually decline over the coming years, actual reserve data tells a more measured story. According to the IMF’s COFER statistics for the fourth quarter of 2025, the U.S. dollar accounted for roughly 56.8% of allocated global foreign-exchange reserves. Although lower than the levels seen decades ago, that share remained broadly stable, with much of the quarter-to-quarter movement attributable to exchange-rate fluctuations rather than aggressive reserve liquidation.
At the end of 2025, total global foreign-exchange reserves stood above $13 trillion. Within that pool, the dollar remained by far the dominant reserve currency, holding a share that exceeded the combined weight of every major competitor except the euro. The euro represented roughly one-fifth of allocated reserves, while the Japanese yen and British pound each accounted for about 5%. Despite persistent discussion of its rise, the Chinese yuan continued to represent only a small fraction of global reserve holdings.
The broader takeaway is that reserve diversification and de-dollarization are not synonymous. Central banks may seek greater exposure to gold or other currencies, but the available data still points to a global reserve system in which the dollar remains the primary benchmark, funding currency, and store of international liquidity.
Bessent’s Dollar Swap Strategy Expands Dollar Dominance
Recent discussions surrounding potential new dollar swap lines have provided another example of how U.S. policymakers are working to reinforce, rather than merely defend, the dollar’s global position.
Treasury Secretary Scott Bessent has recently floated the idea of extending dollar swap arrangements to key partners in the Persian Gulf and Asia, with the United Arab Emirates frequently mentioned as a leading candidate. Critics have interpreted the proposal as an emergency measure designed to prevent foreign holders from selling U.S. Treasuries amid geopolitical tensions in the Middle East. However, that interpretation overlooks the broader strategic objective.
Bessent’s own comments suggest a different motivation. He has emphasized that swap lines help maintain stability in dollar funding markets and reduce the risk of disorderly asset sales during periods of stress. More importantly, he has argued that expanding swap-line networks can strengthen international dollar usage and create additional dollar funding hubs across strategically important regions.
At its core, this approach is about infrastructure. Dollar swap lines are one of the most powerful tools available for extending the reach of the global dollar system. During the 2008 financial crisis, swap lines were deployed primarily as a defensive measure, providing dollar liquidity to foreign central banks and preventing disruptions in global funding markets. The emerging strategy seeks to use the same mechanism more proactively by deepening the dollar’s presence in regions where competing financial architectures have been gaining attention.
The logic is straightforward. When a central bank receives permanent or highly reliable access to dollar liquidity through a swap arrangement, its domestic financial institutions gain confidence that dollars will remain available during periods of market stress. That assurance strengthens incentives to continue conducting trade, financing, and reserve management activities in dollars rather than investing heavily in alternative systems.
From a network perspective, every new swap line effectively creates another node within the global dollar ecosystem. Countries connected to these facilities become more deeply integrated into dollar funding markets, increasing the currency’s utility and reinforcing its network effects. This dynamic helps explain why existing swap-line arrangements among the United States, the European Central Bank, Japan, United Kingdom, Canada, and Switzerland have remained central pillars of the international monetary system since the global financial crisis.
Viewed through this lens, proposed Gulf and Asian swap lines are less about preventing a collapse in Treasury demand and more about extending the geographical footprint of the dollar system. Rather than signaling weakness, they represent an effort to strengthen the institutional infrastructure that underpins the dollar’s reserve-currency status and global liquidity role.
The broader implication is that dollar dominance is sustained not only by the size of the U.S. economy or the Treasury market, but also by the network of financial relationships that make dollars readily available around the world. Swap lines are one of the clearest examples of how that network continues to expand.
More importantly, this strategy is no longer merely theoretical. Advocates argue that Treasury Secretary Scott Bessent has already demonstrated the model in practice through a swap facility extended to Argentina in 2025. The objective was straightforward: provide dollar liquidity to a strategic partner during a period of political uncertainty, stabilize financial conditions, and reinforce that country’s integration into the global dollar system. The reported repayment of the facility within a relatively short period strengthened the case that such arrangements can function as effective tools of financial diplomacy rather than permanent rescue programs.
Under this framework, swap lines serve as an incentive mechanism. They offer trusted partners access to the world’s deepest pool of liquidity and strengthen their ties to dollar-based funding markets. Proposed arrangements with Gulf states and Asian economies can therefore be viewed as efforts to expand the geographic reach of the dollar network rather than emergency measures aimed at defending Treasury demand.
At the same time, the United States retains a second source of influence: its ability to enforce financial restrictions through sanctions, regulatory oversight, and control of key financial infrastructure. In this interpretation, dollar dominance is supported by both incentives and enforcement. Countries gain significant benefits from participating in the dollar system, but they are also aware of the costs associated with operating outside it.
Recent actions targeting Iranian financial networks illustrate this point. Through sanctions programs administered by the Office of Foreign Assets Control and other agencies, the U.S. government continues to demonstrate its capacity to restrict access to international financial channels and freeze assets connected to sanctioned entities. These measures highlight the extent to which global finance remains intertwined with institutions, payment systems, and compliance frameworks linked to the dollar.
The implications extend beyond traditional banking. Cryptocurrencies and stablecoins are often portrayed as alternatives to the existing monetary order, but many of the largest digital-asset ecosystems remain dependent on regulated exchanges, custodians, issuers, and financial intermediaries. As a result, authorities can frequently exercise influence through compliance requirements and enforcement actions, limiting the extent to which these networks operate entirely outside government oversight.
From this perspective, dollar dominance is reinforced through two complementary forces. The first is attraction: deep capital markets, abundant liquidity, reserve-currency status, swap-line access, and the global demand for U.S. Treasury securities. The second is enforcement: sanctions authority, asset freezes, financial blacklists, and regulatory reach. Together, these mechanisms create powerful incentives for governments, banks, and reserve managers to remain connected to the dollar ecosystem.
This does not mean that countries are abandoning efforts to diversify reserves or reduce specific vulnerabilities. Many continue to increase gold holdings, explore alternative payment arrangements, and spread custodial risk across jurisdictions. However, diversification is not the same as disengagement. For many reserve managers, the calculation remains that participation in the dollar-centered financial system offers benefits and stability that are difficult to replicate elsewhere, even as they seek greater flexibility around the margins.
The UAE’s Exit and the De-Dollarization Debate
Supporters of the dollar-dominance thesis point to recent developments in the Gulf as evidence that financial influence often matters as much as formal reserve statistics. In their view, the reported decision by the United Arab Emirates to distance itself from the traditional OPEC framework came at a strategically significant moment, coinciding with discussions about closer financial cooperation with Washington.
The argument focuses on sequence and incentives. During a period of heightened regional uncertainty and financial stress, U.S. policymakers discussed expanding dollar liquidity support to key partners. At the same time, senior UAE officials engaged with representatives from the U.S. Treasury, the International Monetary Fund, and the Federal Reserve System. Proponents of this interpretation argue that access to dollar liquidity, security cooperation, and deeper integration into U.S.-led financial networks created powerful incentives for closer alignment with the dollar-based system.
From that perspective, swap lines are not simply emergency funding mechanisms. They are strategic tools that deepen economic ties and strengthen the network effects that support the dollar’s global role. The broader claim is that countries offered reliable access to dollar liquidity have fewer incentives to build alternative financial architectures around competing currencies.
As a result, advocates argue that this episode weakens the long-running “petroyuan” narrative. Rather than seeing a major Gulf economy move toward a yuan-centered energy pricing system, they see another example of a strategically important state reinforcing its links to the dollar ecosystem.
Counterargument: Does De-Dollarization Still Matter?
The strongest de-dollarization case remains a serious one. Following the freezing of roughly $300 billion of Russian reserves in 2022, many governments concluded that reserve assets held within Western financial systems carried political and geopolitical risks. This prompted efforts to diversify reserve management practices, expand local-currency trade arrangements, accumulate gold, and explore alternatives to traditional dollar settlement networks.
Examples frequently cited include growing cooperation among BRICS members, increased bilateral trade settlement between China and Russia, and shifts in custodial arrangements for foreign-exchange reserves. These developments are real and reflect an ongoing desire among some countries to reduce exposure to potential sanctions risk.
However, supporters of the dollar-dominance view argue that these changes have largely occurred within the existing financial architecture rather than outside it. Moving Treasury holdings from direct custody in the United States to institutions such as Euroclear changes where assets are held, but not necessarily what assets are held. Likewise, increasing bilateral trade settlement in yuan or other currencies does not automatically create a viable alternative to the broader dollar-based system.
The core challenge for de-dollarization remains scale. A reserve currency must provide deep and liquid capital markets, a large supply of high-quality collateral, broad convertibility, legal protections, and global acceptance. While alternatives have made incremental gains, none have yet matched the combination of liquidity, market depth, and network effects that support the dollar.
As a result, the debate today is less about whether diversification is occurring—it clearly is—and more about whether diversification at the margins is sufficient to fundamentally reshape the global monetary system. Thus far, the evidence suggests gradual evolution rather than a rapid displacement of the dollar’s central role.
The key mistake in many de-dollarization arguments is treating diversification as if it were abandonment. Those are not the same thing. Foreign reserve managers are increasingly diversifying where they hold assets and expanding allocations to gold, but neither trend necessarily implies a departure from the dollar-centered financial system.
In practice, many central banks are pursuing two parallel objectives. First, they are reducing custodial concentration by spreading reserve assets across multiple jurisdictions and institutions. Second, they are increasing gold holdings as a hedge against geopolitical and financial uncertainty. Yet these adjustments leave the dollar largely intact as the world’s primary unit of account, dominant settlement currency, and leading reserve asset. Reserve composition may be evolving at the margins, but the underlying structure of the system remains remarkably stable.
The dollar’s influence is also expanding through channels that traditional reserve statistics often fail to capture. One of the most important developments is the rapid growth of dollar-denominated digital assets across emerging markets. In regions such as Latin America, Africa, and Southeast Asia, stablecoins have become increasingly popular as tools for savings, payments, and access to dollar exposure where local currencies face inflation or volatility.
A notable example is Tether, the issuer of the USDT stablecoin. According to the company’s first-quarter 2026 attestation, it held approximately $141 billion in direct and indirect exposure to U.S. Treasury securities as of March 31, supported by total assets of roughly $191.8 billion against liabilities of $183.5 billion. The company also reported a reserve surplus exceeding $8 billion and more than $1 billion in quarterly profit.
These figures are significant because they illustrate how digital-dollar adoption can generate additional demand for U.S. government debt. Stablecoin issuers typically back their tokens with highly liquid dollar assets, including Treasury bills and other short-term government securities. As stablecoin usage grows internationally, so does the indirect demand for dollar-denominated reserves.
Viewed through this lens, digital finance may be reinforcing rather than weakening the dollar’s global position. Instead of replacing the dollar, many of the most widely used digital assets effectively extend the reach of dollar liquidity into markets that previously had limited access to traditional banking infrastructure.
The broader implication is that the future of dollar dominance may not depend solely on central-bank reserve allocations. Increasingly, it may also be shaped by private-sector demand for digital dollars, cross-border payment networks, and new forms of dollar-based financial infrastructure that continue to expand the currency’s global footprint.
The dollar’s reach is increasingly extending beyond traditional banking and central-bank reserves into the digital economy. Supporters of the dollar-dominance thesis argue that this trend is particularly visible in emerging markets, where dollar-linked stablecoins are becoming a preferred vehicle for savings, payments, and wealth preservation.
Recent growth in USDT circulation illustrates the scale of that demand. As the supply of dollar-pegged stablecoins continues to expand, issuers accumulate larger holdings of U.S. Treasury securities and other dollar-denominated assets to back those tokens. In effect, every new digital dollar created generates additional demand for the underlying dollar-based financial infrastructure.
The trend is especially pronounced across parts of Latin America, Africa, and Southeast Asia, where concerns about local currency volatility have encouraged users to hold digital dollars instead of local cash balances. Some industry reports have described this phenomenon as “digital dollarization”—a process in which individuals gain access to dollar exposure through blockchain networks rather than through traditional bank accounts.
From a monetary perspective, this is an important distinction. Many observers originally viewed cryptocurrencies as potential competitors to the dollar. Yet the fastest-growing segment of the digital asset market has often been dollar-backed stablecoins rather than non-sovereign alternatives. As a result, blockchain adoption in many regions has expanded demand for dollar-linked assets rather than displaced them.
Regulatory developments further reinforce this dynamic. The implementation of stablecoin legislation and enhanced compliance requirements has increasingly tied major issuers to the existing financial system. Requirements that reserves be backed by high-quality liquid assets—primarily short-term U.S. government securities—strengthen the connection between stablecoin growth and Treasury demand.
At the same time, regulatory oversight gives authorities greater visibility and enforcement capability within digital-dollar networks. Compliance obligations imposed on issuers, exchanges, and custodians allow regulators to block, freeze, or restrict assets associated with sanctioned entities when required by law. This means that large portions of the stablecoin ecosystem operate not outside the traditional financial system, but as an extension of it.
Viewed through this lens, digital dollars may represent one of the newest channels through which dollar dominance is being reinforced. Rather than creating a parallel monetary order, stablecoins are increasingly embedding dollar liquidity, Treasury demand, and regulatory reach into global digital payments networks.
The broader takeaway is that the future of dollar dominance may depend not only on central banks and sovereign reserves, but also on millions of individuals and businesses choosing to hold digital representations of dollars. If that trend continues, the dollar’s influence could become even more deeply integrated into everyday economic activity around the world.
What This Means for Investors
If the dollar-dominance thesis is correct, the investment implications extend across bonds, equities, gold, and digital-finance infrastructure.
First, persistent foreign demand for U.S. Treasuries suggests ongoing support for the long end of the yield curve, even amid large federal deficits. Strong international demand can help absorb increased issuance and potentially moderate upward pressure on long-term interest rates. From that perspective, duration exposure may offer more value than many deficit-focused forecasts imply.
Second, central-bank gold accumulation appears to be creating a stronger structural foundation for gold prices than existed in previous cycles. That does not necessarily make gold a substitute for fiat currencies. Rather, it reinforces gold’s role as a portfolio diversifier, inflation hedge, and geopolitical-risk buffer. Investors may benefit from maintaining strategic gold exposure, but the argument is increasingly about diversification rather than preparing for the collapse of the monetary system.
Third, the expansion of digital-dollar infrastructure is creating new investment opportunities across payments, custody, and financial technology. Companies such as CRCL, COIN, V, MA, JPM, and BK operate at the intersection of traditional finance and emerging digital-dollar networks, positioning them to benefit if stablecoin adoption continues to grow globally.
The contrarian takeaway is that many investors who positioned heavily for an imminent dollar collapse may have missed some of the strongest-performing asset classes of the past several years. U.S. equities continued to attract capital, Treasury securities remained central to global reserve portfolios, and the broader dollar-based financial system proved more resilient than many critics anticipated.
This does not mean investors should ignore risks. Fiscal deficits, rising debt-service costs, geopolitical tensions, sanctions-related fragmentation, and potential competition from future central bank digital currencies all deserve close attention. These factors could influence the dollar’s long-term trajectory and should remain part of any serious macroeconomic analysis.
However, the evidence presented by proponents of the dollar-dominance view points to a different conclusion than the popular collapse narrative. Foreign demand for Treasuries remains robust. Central banks continue to buy gold while largely operating within a dollar-priced reserve framework. Swap lines are being used to deepen dollar liquidity networks. Stablecoins and digital-dollar platforms are expanding dollar access across emerging markets.
Taken together, these trends suggest that the dollar is not disappearing from the global financial system. Rather, it is adapting to new technologies, new payment channels, and new geopolitical realities while retaining many of the advantages that have supported its dominance for decades.
For investors, the practical lesson is not necessarily to bet exclusively on the dollar, but to recognize that many of the world’s most important financial markets, reserve assets, payment networks, and digital-finance platforms remain deeply connected to the dollar ecosystem. Understanding that infrastructure may prove more valuable than betting on its imminent collapse.
Imagine it’s May 1997 and you decide to put $2,000 into a little-known online bookstore called Amazon. Or perhaps your parents bought the stock for you shortly after you were born.
Today, that original $2,000 investment would be worth approximately $4.28 million.
As unbelievable as it sounds, it’s entirely possible. Since its IPO, Amazon has generated a return of roughly 214,000%, earning a place among a very small group of stocks that have produced extraordinary wealth for long-term investors.
Owning a winner of that magnitude is every investor’s dream. Yet it can also create a surprisingly difficult problem: portfolio concentration risk.
As Kenny Rogers famously sang in The Gambler, “You’ve got to know when to hold ’em, know when to fold ’em.”
In investing, that means recognizing when a single position has become too large. If that $4.28 million Amazon stake represents 75% of your net worth, your financial future is heavily dependent on the fortunes of one company. A significant decline in the stock could have a major impact on your lifestyle and long-term goals.
Amazon may appear unstoppable today, but history offers plenty of cautionary tales. Companies such as Sears and General Electric were once viewed as dominant, nearly untouchable businesses. Over time, however, circumstances changed. Even great companies can stumble, which is why concentration risk remains one of the biggest threats to preserving wealth.
Experienced investors don’t ignore this risk—they actively manage it.
If the shares are held in a tax-advantaged account such as an IRA, the solution is relatively straightforward. You can sell the position, reinvest the proceeds into a diversified portfolio, and avoid immediate tax consequences.
The situation becomes more complicated when the stock is held in a taxable brokerage account.
In the Amazon example, selling the entire position would trigger millions of dollars in long-term capital gains. While many investors pay a 15% federal long-term capital gains tax rate, higher-income households can face a 20% rate plus the 3.8% Net Investment Income Tax (NIIT). Liquidating the entire position at once could therefore result in a substantial tax bill.
Fortunately, investors don’t have to choose between excessive concentration risk and excessive taxes. There are several strategies professionals use to gradually reduce exposure, diversify their holdings, and manage the tax impact more effectively.
Reduce Exposure Through Tax-Loss Harvesting
One of the most straightforward ways to manage concentration risk is by using market volatility to your advantage. Tax-loss harvesting involves identifying underperforming investments in your portfolio and selling them to realize losses that can offset gains from your highly appreciated holdings.
While this strategy may not completely solve the issue if a single stock dominates your portfolio, it can be highly effective when a position has gradually grown to represent 5%–10% of your net worth—a level often considered the threshold between a normal holding and a concentrated position. By consistently harvesting losses and trimming the position over time, investors can gradually diversify without triggering significant tax liabilities.
Transfer Shares to Family Members
For many investors, passing wealth to future generations is a key objective. Gifting appreciated stock to children or other family members can help reduce concentration risk while transferring wealth during your lifetime.
A crucial distinction exists between gifting shares during life and passing them on through an estate. Assets inherited after death typically receive a stepped-up cost basis, eliminating accumulated capital gains. In contrast, gifted shares retain the donor’s original purchase price.
However, if the recipient is in a lower tax bracket, they may be able to sell the shares and incur little or no capital gains tax. This allows the family to preserve more wealth while reducing the donor’s exposure to a single stock.
Donate Appreciated Shares Instead of Cash
If charitable giving is already part of your financial or estate plan, donating appreciated stock can be far more tax-efficient than writing a check.
By contributing highly appreciated shares directly to a qualified charity or a Donor-Advised Fund (DAF), investors may receive a tax deduction based on the stock’s full market value while completely avoiding capital gains taxes on the appreciation. In most cases, deductions for these non-cash contributions can be claimed up to 30% of Adjusted Gross Income (AGI).
Use a Charitable Remainder Trust (CRT)
For investors seeking a more sophisticated approach, a Charitable Remainder Trust can provide both diversification and ongoing income.
Appreciated shares are transferred into the trust without triggering immediate taxes. Since the trust is tax-exempt, it can sell the concentrated position and reinvest the proceeds into a diversified portfolio. The trust then distributes income to the investor for life or for a predetermined period.
Although taxes are eventually paid on the income distributions, the liability is spread over many years rather than being incurred all at once, creating a more manageable and tax-efficient outcome.
Consider an Exchange Fund
Among the most powerful diversification tools available to affluent investors is the exchange fund, though it remains relatively unknown outside wealth-management circles.
In an exchange fund, investors contribute concentrated stock positions into a pooled vehicle alongside others holding different stocks. For example, one investor may contribute Amazon shares, another Microsoft, and another Exxon. In return, each participant receives an ownership stake in the diversified pool.
Because this transaction is structured as an exchange rather than a sale, capital gains taxes are deferred. The result is an immediate reduction in single-stock risk and exposure to a broader portfolio of companies, helping protect investors from the impact of a sharp decline in any one stock.
Know When It’s Time to Diversify
As the famous line from The Gambler suggests, success often comes from knowing when to hold on and when to walk away. If a large, concentrated stock position is creating anxiety or exposing you to excessive risk, it may be time to take action. A thoughtful diversification strategy can help preserve the wealth you’ve worked hard to build while reducing the risk of a single investment undermining your financial future.
The US Dollar Index (DXY) weakened toward the 98.90 area on Friday as improving risk sentiment reduced demand for traditional safe-haven assets. Although the latest US Core Personal Consumption Expenditures (PCE) Price Index remained unchanged at 3.3% year-over-year in April, reinforcing expectations that the Federal Reserve could maintain higher interest rates for longer, investors focused primarily on geopolitical developments. Reports indicating that the United States and Iran had reached a memorandum of understanding to extend their ceasefire by 60 days, reopen the Strait of Hormuz, and begin nuclear negotiations boosted confidence across financial markets.
The EUR/USD pair advanced toward 1.1670, supported by broad-based US Dollar weakness and improving investor appetite for risk.
Meanwhile, GBP/USD climbed toward the 1.3470 level as reduced demand for the Greenback provided support for the British pound. Sterling remained relatively resilient despite ongoing concerns about the United Kingdom’s fiscal position and slowing economic growth.
In Japan, USD/JPY traded near 159.30. While elevated US Treasury yields continued to offer support to the pair, a softer Dollar limited further gains. The Japanese yen remained under pressure after Tokyo Core CPI slowed to 1.4% year-over-year in May. Additionally, Kazuo Ueda cautioned that energy-related shocks could become more persistent if they begin influencing wages and inflation expectations.
The AUD/USD pair rose toward 0.7190, benefiting from stronger risk sentiment as progress in US-Iran negotiations encouraged demand for growth- and commodity-linked currencies.
In the commodities market, West Texas Intermediate (WTI) crude oil traded near $88 per barrel. Expectations of an extended ceasefire and the potential reopening of the Strait of Hormuz helped ease concerns over supply disruptions, limiting upward pressure on oil prices.
Despite the improved risk backdrop, gold rallied toward the $4,550 area as investors continued to balance optimism over geopolitical developments against lingering uncertainty and persistent global inflation risks. The precious metal remained supported by its role as a hedge against both inflation and geopolitical instability.
Looking Ahead: Key Economic Insights on the Horizon
Market participants will closely monitor a series of speeches and events involving major central bank officials in the coming days, seeking fresh clues on the outlook for interest rates, inflation, and economic growth.
Friday, May 29
Catherine Mann (Bank of England)
Sunday, May 31
Megan Greene (Bank of England)
Christopher Waller (Federal Reserve)
Jerome Powell (Federal Reserve)
Tuesday, June 2
Boris Vujčić (European Central Bank policymaker)
Andrew Bailey
Olaf Sleijpen (European Central Bank policymaker)
Megan Greene
Wednesday, June 3
Kazuo Ueda
Frank Elderson
Michael Barr
Piero Cipollone
Bank of England Monetary Policy Report Hearings
Federal Reserve Beige Book release
Thursday, June 4
Christine Lagarde
Andrew Bailey
Friday, June 5
Swati Dhingra
Andrew Bailey
The week’s schedule places particular emphasis on comments from the Federal Reserve, European Central Bank, Bank of England, and Bank of Japan, with investors looking for signals on the future path of monetary policy. Remarks from Powell, Lagarde, Bailey, and Ueda, alongside the Fed’s Beige Book and the BoE’s policy hearings, could have a significant impact on currency, bond, and equity markets.
Central Bank Meetings and Key Economic Data Set to Drive Markets
Investors will face a busy week of economic data and policy-related events, with releases from China, the Eurozone, the United States, Canada, Australia, Japan, New Zealand, and Switzerland likely to influence expectations for growth, inflation, and interest rates.
Friday, May 29
China Manufacturing PMI
China Non-Manufacturing PMI
Sunday, May 31
Australia TD-MI Inflation Gauge
China Caixin Manufacturing PMI
Monday, June 1
Eurozone Retail Sales
Switzerland Retail Sales
Switzerland GDP
Germany Manufacturing PMI
France Manufacturing PMI
Eurozone Manufacturing PMI
Eurozone Unemployment Rate
Canada Manufacturing PMI
US Manufacturing PMI
Australia Building Permits
Tuesday, June 2
Eurozone CPI Inflation
US JOLTS Job Openings
New Zealand Building Permits
Australia AiG Industry Index
Australia PMI
Australia Q1 GDP
China Caixin Services PMI
Wednesday, June 3
Spain Services PMI
Germany Services PMI
Eurozone Services PMI
Eurozone Producer Price Index (PPI)
US ADP Employment Change (4-week average)
US Services PMI
US Factory Orders
Australia Trade Balance
Thursday, June 4
Switzerland CPI Inflation
Eurozone Retail Sales
US Challenger Job Cuts
US Initial Jobless Claims
US Nonfarm Productivity
US Unit Labor Costs
Japan Labor Cash Earnings
Friday, June 5
Eurozone GDP
Eurozone Employment Change
Canada Employment Report
Canada Average Hourly Wages
Canada Unemployment Rate
US Nonfarm Payrolls (NFP)
US Unemployment Rate
US Average Hourly Earnings
US Labor Force Participation Rate
Canada Ivey PMI
Among the week’s highlights, investors will pay particular attention to Eurozone CPI, Australia’s first-quarter GDP, US JOLTS job openings, ADP employment data, and especially Friday’s US Nonfarm Payrolls report, which could provide critical insight into labor market conditions and influence expectations for future monetary policy decisions. The combination of inflation, growth, and employment data is likely to play a key role in determining the direction of major currencies, equities, bonds, and commodities throughout the week.
Investors have continued to exit positions amid market weakness, realizing approximately $667 million in losses over the last three days.
Risk reduction by institutional investors in the United States remains evident, with US spot Ethereum ETFs recording net outflows for 14 straight trading days.
Although ETH has reclaimed the $2,000 mark, buying momentum remains subdued, suggesting that the recovery lacks strong conviction.
Following Ethereum’s (ETH) drop toward the key psychological support level of $2,000 in recent days, investors have increasingly realized losses.
Market participants have locked in approximately $667 million in losses over the past three days, marking the highest level of loss realization since early May.
This trend suggests that investors are continuing to sell amid market weakness, a sign of deteriorating sentiment that could increase the risk of further downside pressure on ETH prices.
Notably, selling pressure intensified after buyers were unable to drive Ethereum above the realized price, or average on-chain cost basis, of retail investors. This level has acted as a major resistance zone over the past three months, highlighting a recurring pattern in which retail holders tend to sell when prices approach their break-even point. As a result, the failure to break above this threshold has reinforced bearish sentiment and contributed to the recent wave of selling.
At the same time, network activity has continued to decline, with the number of active addresses nearing levels last recorded in early May. More significantly, this metric has fallen by nearly 50% since February, indicating a sharp slowdown in on-chain participation and weakening user engagement across the leading Layer 1 blockchain.
From a regional perspective, selling pressure has been largely driven by US investors, who continue to play a key role in influencing overall market sentiment. This trend is reflected in the Coinbase Premium Index—a gauge of US investor demand and sentiment—which has been on a steady decline since late April, signaling weakening buying interest and growing caution among American market participants.
Adding to the bearish outlook, US spot Ethereum ETFs recorded their 14th consecutive day of net outflows, underscoring a persistent risk-off stance among institutional investors in the United States.
One notable exception has been BitMine, which has continued to accumulate Ethereum, increasing its holdings to 5.39 million ETH.
In the derivatives market, open interest has kept rising and reached a new record high of more than 16 million contracts during the week, while funding rates have remained in positive territory. Despite these seemingly bullish signals, ETH prices have continued to decline, suggesting that a significant portion of the growing open interest may be coming from newly opened short positions. At the same time, some bullish traders appear to be either buying the dip or maintaining losing long positions, creating a divergence between derivatives activity and spot market performance. This combination points to growing speculative pressure and increases the likelihood of further volatility in the near term.
Ethereum Price Forecast: ETH Reclaims $2,000, but Upside Momentum Remains Limited
On the daily timeframe, Ethereum continues to exhibit a bearish short-term outlook, with the price trading below its 20-day, 50-day, and 100-day Exponential Moving Averages (EMAs). These indicators are clustered between $2,122 and $2,281, creating a strong resistance zone that is likely to limit any recovery attempts.
Momentum indicators suggest selling pressure is easing but remain far from signaling a bullish reversal. The 14-day Relative Strength Index (RSI) is hovering around 34, slightly above oversold levels, while the Stochastic Oscillator is gradually rebounding after reaching deeply oversold conditions.
On the downside, Ethereum’s first key support lies near $2,018. A decisive move below this level could open the door for a decline toward the next demand area around $1,909. If bearish pressure intensifies, additional support levels can be found near $1,741, followed by $1,524 and $1,404.
On the upside, Ethereum faces immediate resistance around $2,107, followed by the 20-day EMA at $2,122 and the 50-day EMA near $2,186. A decisive and sustained break above these levels would help reduce the current bearish bias and signal improving market sentiment.
Should buyers regain control, the next upside targets are located near $2,211, followed by the 100-day EMA at $2,280. Beyond that, ETH could challenge stronger resistance zones at $2,388, $2,746, and eventually $3,411, provided bullish momentum continues to build.
The British Pound experienced choppy trading throughout the week, with price action characterized by frequent swings in both directions. Despite the volatility, the 1.3550 level continues to act as a significant resistance zone. However, momentum suggests that it may only be a matter of time before the pair makes another attempt to challenge that area.
A decisive break above the 1.3550 resistance level could pave the way for further gains, potentially driving the pair toward the 1.3700 mark. For now, the broader uptrend remains intact, making short-term pullbacks attractive buying opportunities. Ongoing uncertainty surrounding US interest rate expectations is likely to keep volatility elevated, but the recent weakness in the US Dollar toward the end of the week has provided additional support for the British Pound, helping it maintain its bullish momentum against the greenback.
EUR/USD
The Euro has rebounded and is beginning to regain momentum. Overall, the pair appears likely to make another attempt toward the 1.18 level. However, market participants remain focused on the U.S. interest rate outlook, as they assess whether the recent volatility surrounding rate expectations will start to ease.
Silver
Silver remains highly volatile, with price action continuing to fluctuate within a choppy trading environment. While the broader outlook remains uncertain, the market is likely to stay sensitive to shifts in interest rate expectations. In addition, investor sentiment toward risk assets and the overall direction of the US Dollar will continue to play a key role in driving silver prices. As a result, traders should expect ongoing swings and periods of erratic movement in the near term.
Given the current market conditions, buying on short-term pullbacks appears to be a reasonable strategy. However, the outlook does not suggest an imminent breakout or a significant directional move. A decline below the $70 level could trigger a deeper sell-off and put additional pressure on prices, although such a scenario does not seem particularly likely in the near term. For now, the market appears more inclined toward range-bound trading, with continued back-and-forth price action expected.
Gold
Gold prices moved lower at the start of Monday’s trading session but quickly recovered, with bullish momentum driving the market higher throughout the remainder of the week. Strong buying interest continues to emerge around the $4,600 level, a key area that has attracted considerable attention from traders. Given its importance as a support zone, this level is likely to remain a focal point for market participants and could play a significant role in determining gold’s next directional move.
If interest rates continue to decline, gold could gain additional upward momentum and potentially advance toward the $4,800 level. The lower-rate environment would likely enhance the appeal of non-yielding assets such as gold. From a longer-term perspective, the overall outlook remains positive, with the broader trend continuing to favor further gains in the precious metal.
USD/JPY
The US Dollar posted modest gains against the Japanese Yen during the week, although the 160.00 level continues to act as a major resistance barrier. Recent interventions and increased market activity from the Bank of Japan suggest that policymakers remain committed to supporting the yen and preventing excessive currency weakness.
Despite these efforts, the yen continues to face challenges due to Japan’s relatively low interest rate environment, which limits its ability to attract capital flows and strengthen significantly. As a result, the broader outlook still favors the US Dollar, and it may only be a matter of time before USD/JPY makes another attempt to break above the 160.00 level.
A break below the 158.00 yen level would represent a significantly bearish development for USD/JPY. Such a move could signal a shift in market sentiment, potentially triggering additional selling pressure and raising the likelihood of a deeper correction. As a result, the 158.00 area remains a key support level that traders will be watching closely.
USD/CAD
The US Dollar initially strengthened during last week’s trading, but much of those gains were later surrendered against the Canadian Dollar. This price action suggests that traders should remain cautious, as bullish momentum has yet to establish itself convincingly.
At the same time, the 50-week Exponential Moving Average (EMA) continues to act as a notable resistance barrier, limiting upside progress. Until the pair can break decisively above this level, the market may remain vulnerable to further consolidation or renewed selling pressure.
A move below the 1.3750 level could be a significant bearish signal for USD/CAD, potentially opening the door to a much deeper decline. Such a breakdown would likely encourage additional selling pressure and shift the market’s near-term outlook to the downside.
From a broader perspective, however, the pair appears likely to remain trapped in a range-bound environment. As a result, traders should continue to expect considerable volatility and back-and-forth price action, with neither buyers nor sellers maintaining a clear long-term advantage for the time being.
Bitcoin
Bitcoin moved lower during the week but later recovered some of its losses, signaling a degree of market indecision. Price action suggests that traders remain cautious, with neither buyers nor sellers able to establish clear control.
While the market will likely need to make a more decisive directional move in the near future, Bitcoin does not currently appear to have the momentum required for a strong breakout to the upside. Until a clearer catalyst emerges, the cryptocurrency may continue to trade within a period of consolidation and uncertainty.
While the longer-term outlook remains constructive, any meaningful move higher is likely to develop gradually rather than through an immediate breakout. In the near term, a modest rebound appears possible this week as buyers attempt to regain control following recent weakness.
Looking ahead, the market could eventually make another push toward the $77,000 level, although achieving that target may require time and sustained buying interest. For traders and investors alike, patience is likely to be essential, as the path higher may involve periods of consolidation and uneven price action before a stronger trend emerges.
DAX
Germany’s DAX index experienced some selling pressure after rallying earlier in the week, giving back a portion of its gains. Despite the pullback, the 25,000 level appears to be providing an important area of support, helping to stabilize price action.
Overall, market sentiment remains relatively constructive, with many traders viewing declines as potential buying opportunities. As a result, pullbacks are likely to attract interest from investors looking to enter the market at more favorable levels, which could help support the index in the near term.
A break above last week’s high near the 25,425 level could serve as a strong bullish signal for the DAX. Such a move would likely reinforce positive market sentiment and attract additional buying interest from traders and investors who have been waiting for confirmation of further upside momentum.
If that resistance level is successfully cleared, participation in the market could increase significantly, potentially paving the way for a stronger advance and extending the broader upward trend.
It feels as though markets are trapped on a never-ending carousel. Over the past two months, investors have repeatedly been hit with headlines suggesting that the US and Iran are nearing another agreement to end hostilities. What makes the situation unusual is that the proposed deal is reportedly aimed at extending a two-week ceasefire that began on April 8 and has already lasted nearly 50 days by an additional 60 days. Why a fresh agreement is required for that remains somewhat unclear.
Nevertheless, renewed optimism surrounding a potential deal once again pushed the S&P 500 higher, with the index gaining 58 basis points, while the VIX slipped below 16. Frankly, the constant cycle of ceasefire headlines is even starting to disrupt my Treasury settlement calendar analysis. By the close, the index had risen roughly 10 basis points more than its average positive-day gain of 48 basis points.
Bitcoin traded largely in line with expectations, although it briefly dropped around 2% near midday and remains down roughly 1% on the session. While I remain skeptical about Bitcoin’s intrinsic value, it continues to serve as a useful barometer of overall liquidity conditions in the market. For that reason alone, it deserves close attention.
The liquidity-sensitive private equity ETF PSP also ended the session in negative territory, reinforcing the view that some of the market’s most liquidity-dependent segments continue to face pressure even as the broader equity market advances.
That is all for today. The relentless news cycle has become exhausting, and frankly, I still have plenty of work to wrap up before the end of the month.
Silver futures remain trapped in a highly volatile consolidation range after surging to a recent peak of $79.25 before retreating to a low of $72.00. According to the Variable Changing Price Momentum Indicator (VC PMI), the current Weekly Mean Price stands at $76.31, serving as the critical equilibrium point that separates bullish from bearish momentum.
Silver is currently trading near the Daily VC PMI Mean of $74.73 and is attempting to reclaim momentum above the Weekly Mean at $76.31. A sustained close above this key level would signal the start of a bullish expansion phase, initially targeting Daily Sell 1 at $77.47 and then Daily Sell 2 at $79.04. A break beyond these resistance levels would open the door toward the Weekly Sell 1 target at $79.28, which is viewed as a major profit-taking zone with high statistical significance.
On the downside, key support levels are clustered around Daily Buy 1 at $73.17 and Daily Buy 2 at $70.44. These align closely with Weekly Buy 1 at $73.23 and Weekly Buy 2 at $70.27, creating a strong demand zone between $70 and $73. The recent decline toward the $72 region completed a classic mean-reversion pattern and triggered a solid buying response, reinforcing the reliability of the VC PMI statistical model.
VC PMI Key Levels:
Weekly Sell 1: $79.28
Daily Sell 2: $79.04
Daily Sell 1: $77.47
Weekly Mean: $76.31
Daily Mean: $74.73
Daily Buy 1: $73.17
Weekly Buy 1: $73.23
Daily Buy 2: $70.44
Weekly Buy 2: $70.27
From a cyclical perspective, silver remains within an important timing window extending into early June. Historical cycle analysis suggests that significant directional moves often develop after periods of volatility compression like the one currently unfolding. The alignment of price action, timing, and momentum indicates that silver is nearing a critical inflection point, where either a breakout above resistance or a breakdown below support is likely to define the next intermediate-term trend.
According to Gann Square of 9 analysis, the recent low at $72 generates projected resistance levels near $77, $79, and $81, closely matching the VC PMI Sell 1 and Sell 2 targets. The alignment between Gann price geometry and the VC PMI mean-reversion framework strengthens the likelihood that these zones will serve as key decision areas for institutional trading activity.
Meanwhile, the MACD indicator is stabilizing around the zero line, signaling that bearish momentum may be fading. A bullish momentum crossover, combined with a sustained close above the Weekly Mean, would reinforce the case for a renewed upside move toward the higher VC PMI resistance targets.
This QuickTakes update on gold highlights that prices are holding above the 200-day moving average after reports that Iran and the US agreed on a memorandum of understanding to extend their ceasefire for another 60 days, although Reuters noted that President Donald Trump has not yet approved the deal.
Gold reached a record high of $5,318 per ounce on January 29 before plunging during the Middle East conflict in March, touching $4,375 near month-end. Prices later recovered through mid-April as the ceasefire held. Currently, gold appears to be testing key technical support around the March 26 low, the 200-day moving average, and the intermediate uptrend line. In our view, this cluster of support levels should remain intact.
The decline in gold prices since late January has pushed the metal back into the upward-sloping trading channel that has been in place since late 2023 (chart). Traders may be viewing the proposed 60-day ceasefire extension as a sign that neither Iran nor the US is willing to reignite the military conflict.
Gold’s upward trend is expected to regain momentum once the conflict comes to an end. We currently forecast gold prices reaching $5,500 by year-end and climbing toward $10,000 by the end of the decade. During the war, the US Dollar strengthened in foreign-exchange markets, creating headwinds for gold. At the same time, rising interest rates added further pressure, which is typically negative for the precious metal.
Some central banks were also compelled to sell portions of their gold reserves to stabilize their currencies as surging oil prices weakened exchange rates. Meanwhile, the Federal Reserve is expected to maintain a more hawkish stance through the summer, potentially limiting any major upside move in gold in the near term. Once the war concludes, however, many of these bearish pressures are likely to fade.
Our long-term bullish outlook for gold is based on the expectation that the S&P 500 could climb to 10,000 by the end of the decade. As equities continue to rise, we believe investors are likely to diversify part of their portfolios into alternative assets, including gold. Historically, the S&P 500 and gold prices have often moved inversely over shorter cyclical periods, while tending to advance together over longer-term trends (chart). Therefore, if the S&P 500 eventually reaches the 10,000 mark, we believe gold prices could also rise toward $10,000.
The USD/CAD pair hovered sideways around 1.3785 during early Asian trading on Friday. Market participants are keeping a close eye on developments regarding a potential US-Iran ceasefire agreement, while Canada’s upcoming Q1 2026 GDP report is projected to reveal an annualized growth rate of 1.5%.
The US Dollar and Canadian Dollar are essentially stuck in place near 1.3785 this Friday morning as currency traders weigh two massive market drivers: Middle East geopolitics and Canadian economic data.
On the geopolitical front, there is hope for an extended peace deal between the US and Iran. The Guardian reported a potential 60-day extension to keep vital shipping lanes open while bigger issues, like Iran’s nuclear ambitions, are negotiated. US Vice President JD Vance confirmed they are still ironing out a few specific phrases but are moving in the right direction. If this peace deal goes through, oil prices will likely drop. Since Canada exports a ton of oil, any major shift in crude prices heavily impacts the value of the Canadian Dollar.
Meanwhile, Canada’s latest GDP numbers drop later today. After shrinking by 0.6% at the end of 2025, the economy is expected to bounce back with 1.5% growth for the first quarter of 2026. If the data beats expectations, expect the “Loonie” to gain some muscle against the US Dollar.
AUD/USD bulls stay cautious during Friday’s Asian session as mixed fundamental signals keep traders on the sidelines.
Reports of a potential US-Iran peace agreement weigh on the safe-haven US Dollar, providing modest support to the pair.
However, expectations that the Federal Reserve will maintain a hawkish stance help limit USD downside, while fading hopes for additional rate hikes from the Reserve Bank of Australia restrain gains for the Aussie.
The AUD/USD pair struggles to build on Thursday’s solid rebound from below the 0.7100 mark, a one-week low, and trades sideways during Friday’s Asian session. Even so, the pair remains above 0.7150 and is on track to post its first weekly gain in three weeks.
News that the US and Iran have drafted an agreement to prolong the current ceasefire by 60 days has weakened demand for the safe-haven US Dollar (USD), providing some support to the AUD/USD pair. However, investors remain cautious about the prospects of a lasting peace deal due to ongoing disputes surrounding Iran’s nuclear ambitions and the Strait of Hormuz.
At the same time, stronger US inflation data for April — the sharpest rise in three years — reinforced expectations that the US Federal Reserve (Fed) could raise interest rates again before year-end, lending support to the USD. In addition, fading expectations of a June rate hike from the Reserve Bank of Australia (RBA) continue to limit upside momentum for the Aussie.
From a technical standpoint, the pair is still trading within the same range that has held for roughly the past two weeks. The upper boundary of this range aligns with the 100-period Simple Moving Average (SMA) on the 4-hour chart, as well as the 23.6% Fibonacci retracement of the March-to-May rally, suggesting that bullish momentum remains somewhat restrained.
Meanwhile, the Relative Strength Index (RSI) sits around 56, while the Moving Average Convergence Divergence (MACD) remains slightly positive, indicating that bearish pressure is not yet dominant. Still, a decisive move above the key resistance zone around 0.7180–0.7185 would be required to confirm that the recent pullback from the multi-year peak has ended and that further gains are likely.
A sustained breakout above this barrier could pave the way toward the 0.7279 swing high. On the downside, immediate support is seen near the 38.2% Fibonacci retracement level at 0.7109, followed by the 50% retracement around 0.7056. Further declines could expose 0.7003 and 0.6928, ahead of the broader support base near 0.6833.
The US Dollar Index (DXY) strengthens to around 99.00 during Friday’s Asian session as investors monitor ongoing US-Iran negotiations. Vice President JD Vance stated that Washington and Tehran are “very close” to reaching a deal, though key issues remain unresolved.
Meanwhile, the US core PCE inflation rate rose 3.3% year-over-year in April, matching market expectations and reinforcing the Federal Reserve’s cautious policy stance.
The US Dollar Index (DXY), which tracks the US Dollar (USD) against a basket of six major currencies, trades near the 99.00 level during Friday’s Asian session. The Greenback edges higher following reports that the United States and Iran have reached a preliminary agreement to extend their ceasefire, although US President Donald Trump has yet to formally approve the deal.
According to Bloomberg, Washington and Tehran have tentatively agreed to prolong the ceasefire by 60 days while continuing negotiations over Iran’s nuclear program. Optimism surrounding a potential resolution to the three-month conflict could, however, limit demand for the safe-haven US Dollar.
US Vice President JD Vance stated on Friday that several key issues still need to be resolved before a final agreement can be achieved. Speaking to the BBC, Vance said it remains uncertain “when or if” both sides will ultimately reach a formal deal.
On the economic front, data released by the US Bureau of Economic Analysis (BEA) on Thursday showed that the Personal Consumption Expenditures (PCE) Price Index rose 3.8% year-over-year in April, up from the previous 3.5% reading and in line with market forecasts.
Meanwhile, the core PCE Price Index, which excludes food and energy prices, increased 3.3% annually in April versus 3.2% previously, also matching expectations. On a monthly basis, headline PCE and core PCE advanced by 0.4% and 0.2%, respectively. The inflation data reinforced expectations that the Federal Reserve (Fed) may keep interest rates elevated for an extended period.
According to the CME FedWatch Tool, markets are currently pricing in a roughly 36.6% chance that the Fed will deliver a 25-basis-point rate hike before the end of the year.
The US Dollar Index (DXY) rises toward 99.50 as Iran’s strikes on US military bases reignite tensions between Washington and Tehran. The Islamic Revolutionary Guard Corps (IRGC) warned of stronger retaliation if the US launches further attacks. Meanwhile, markets are increasingly pricing in a hawkish Federal Reserve stance, with the probability of at least one Fed rate hike this year climbing above 50%.
The US Dollar (USD) attracts strong buying interest during Thursday’s Asian session after Iran retaliated against recent US strikes near Bandar Abbas airport, according to Tasnim news agency.
At the time of writing, the US Dollar Index (DXY), which measures the Greenback against a basket of six major currencies, is up around 0.25% on the day and trading near the 99.50 level. The renewed escalation in US-Iran tensions has boosted demand for safe-haven assets, supporting the USD.
Iran’s Islamic Revolutionary Guard Corps (IRGC) stated that it had launched attacks on US military bases and warned that any further US aggression would trigger an even “more decisive” military response.
The IRGC had previously pledged retaliation following Wednesday’s so-called “defensive strikes” by the US Central Command, which targeted Iranian boats allegedly involved in deploying naval mines.
The renewed military confrontation between Washington and Tehran has sharply weakened hopes for a lasting peace agreement. Iran’s counterattacks have also fueled a strong rebound in oil prices, raising concerns about higher inflation and prompting traders to increase expectations of a more hawkish Federal Reserve (Fed) stance.
According to the CME FedWatch Tool, markets currently see a 43.1% probability that the Fed will keep interest rates unchanged through the year, while the remaining expectations point toward at least one rate hike. This marks a major shift from earlier market expectations that anticipated two rate cuts before the conflict escalated.
Looking ahead, investors are closely watching the release of the US April Personal Consumption Expenditures (PCE) Price Index data at 12:30 GMT. The Fed’s preferred inflation measure is forecast to rise 3.8% year-over-year, compared with the previous reading of 3.5%.
WTI attracts strong buying interest during the Asian session after fresh US strikes on Iran.
In retaliation, Iran’s IRGC launched attacks on a US airbase and warned of a stronger response ahead.
However, a sharp rise in US Dollar demand could limit further gains in crude oil prices ahead of key US economic data releases.
West Texas Intermediate (WTI), the US benchmark for crude oil, edges higher during Thursday’s Asian session and recovers a large portion of the previous day’s decline, which had dragged prices to their lowest level since April 21. The commodity climbed to a fresh intraday high in the past hour and is attempting to push back above the $91.00 level amid fears of a broader escalation in the Middle East conflict.
According to Reuters, the US launched fresh overnight strikes on an Iranian military facility believed to pose a threat to American forces and commercial shipping in the Strait of Hormuz. Meanwhile, Iran’s Islamic Revolutionary Guard Corps (IRGC), cited by Tasnim news agency, said it had targeted a US airbase in retaliation for an attack near Bandar Abbas airport and warned that any further US aggression would provoke a “more decisive” response. The rising geopolitical tensions continue to support crude oil prices by keeping the market’s risk premium elevated.
At the same time, US President Donald Trump stated that he was dissatisfied with the current terms of negotiations with Iran and stressed that he would not rush into an agreement, reducing optimism for a diplomatic resolution to the three-month-long conflict. In addition, shipping activity through the Strait of Hormuz remains constrained due to Iranian movement restrictions and a US naval blockade on Iranian ports. Further underpinning oil prices, data from the American Petroleum Institute showed that US crude inventories declined for a sixth consecutive week.
Overall, the fundamental backdrop continues to favor bullish sentiment in the oil market and reinforces the near-term positive outlook for crude prices. However, a sharp rebound in the US Dollar could limit additional upside, as a stronger greenback typically weighs on demand for dollar-denominated commodities. Traders are now turning their attention to upcoming US economic releases, including the Personal Consumption Expenditures (PCE) Price Index and the preliminary first-quarter GDP report, for fresh market direction later in the North American session.
Gold extends losses for a third consecutive session as renewed escalation in the Iran conflict strengthens the USD.
Rising inflation concerns have reinforced expectations of further Fed rate hikes, providing additional support to the greenback and putting pressure on the precious metal.
Market participants are now awaiting the US preliminary Q1 GDP data and the closely watched US PCE Price Index for fresh trading direction.
Gold (XAU/USD) remains under heavy selling pressure heading into the European session, hovering near a two-month low touched earlier on Thursday. The precious metal also appears vulnerable to extending its decline below the $4,400 level and the technically important 200-day Simple Moving Average (SMA), as renewed escalation in Middle East tensions boosts demand for the safe-haven US Dollar (USD). At the same time, expectations that major central banks could maintain a more hawkish policy stance to combat rising inflation continue to weigh on the non-yielding bullion.
According to Reuters, a US official stated that American forces launched fresh strikes in Iran on Wednesday, targeting a military facility viewed as a threat to US troops and commercial shipping in the Strait of Hormuz. The official added that US forces also intercepted and destroyed several Iranian drones posing similar risks. Meanwhile, US President Donald Trump said he was dissatisfied with the terms negotiated with Iran and would not rush into a deal, reducing optimism for a diplomatic resolution to the three-month-long conflict. Ongoing disagreements between Washington and Tehran over Iran’s nuclear program and security in the Strait of Hormuz continue to support geopolitical risk sentiment, benefiting the Greenback and pressuring Gold prices.
In addition, recent developments have helped Crude Oil prices recover modestly from a more than three-week low reached on Thursday, fueling concerns over energy-driven inflation and reinforcing expectations for further rate hikes. According to the CME Group FedWatch Tool, markets are now pricing in nearly a 50% probability that the US Federal Reserve (Fed) could raise interest rates by 25 basis points before the end of the year, while the likelihood of another hike in January 2027 stands at around 60%. Hawkish remarks from several influential FOMC officials have further pushed US Treasury yields higher, offering additional support to the USD and adding downside pressure on non-yielding Gold.
Looking ahead, investors will closely monitor key US economic releases, including the preliminary Q1 GDP report and the Personal Consumption Expenditures (PCE) Price Index. The PCE report, regarded as the Fed’s preferred measure of inflation, is expected to play a crucial role in shaping expectations for the future path of US interest rates. This, in turn, could drive fresh USD demand during the North American session. At the same time, ongoing geopolitical headlines are likely to keep volatility elevated across global markets and continue influencing Gold price movements.
Gold Daily Chart
Gold sellers remain in control after price slipped below the key 200-day SMA support. From a technical standpoint, XAU/USD continues to trade with a bearish bias within a descending channel and beneath the 500-day SMA. In addition, the Relative Strength Index (RSI) remains close to 35, signaling weak buying interest, while the Moving Average Convergence Divergence (MACD) stays in negative territory, reinforcing the prevailing downside momentum.
The metal is now approaching support at the lower edge of the descending channel around $4,311.11, following the confirmed break beneath the crucial 200-day SMA. If prices fall decisively below this channel support, it could trigger a deeper correction within the broader bearish structure. On the upside, any rebound is likely to face immediate resistance near the $4,480 horizontal barrier. A move above that level could shift focus toward the descending channel ceiling and the confluence resistance formed by the 50-day SMA around $4,625–$4,630, which may act as a stronger selling area.
According to Swissblock, Bitcoin (BTC) has entered a high-risk zone as institutional demand continues to weaken and spot Bitcoin ETFs record rising outflows. The growing selling pressure comes amid broader market uncertainty, pushing BTC into a more vulnerable position.
Against this backdrop, Bitcoin price has fallen toward the $76,000 level following the latest U.S. military strike on Iran. Several key market indicators are now flashing warning signals as BTC struggles to regain momentum above the $78,000 resistance area.
Swissblock’s Risk Index Signals Rising Market Stress
Swissblock has warned that Bitcoin is slipping further into a high-risk zone, with its proprietary risk index highlighting increasing pressure across the broader crypto market. According to the firm, bullish momentum is fading rapidly, while institutional demand — including purchases from major players such as Strategy — has largely stalled.
At the same time, Bitcoin’s volatility remains elevated, adding to concerns over market stability. Swissblock noted that BTC is now entering a fragile phase that could be vulnerable to sharp and sudden price declines. The firm also emphasized that weakening institutional participation and deteriorating investor confidence are contributing to the growing downside risk.
Analysts also noted that current market conditions differ sharply from the strong rally seen earlier this year. At that time, steady spot Bitcoin ETF inflows helped fuel bullish momentum and supported higher prices. Now, however, the market is witnessing the opposite trend, with persistent outflows weighing on sentiment and weakening demand. As a result, caution has grown among both short-term traders and long-term Bitcoin holders.
Glassnode Reports Continued ETF Outflows
On-chain analytics firm Glassnode has reported persistent outflows from Bitcoin investment products, signaling weakening institutional appetite. According to the firm, spot Bitcoin ETFs have experienced several consecutive days of sizable withdrawals, adding further pressure to the broader crypto market.
Glassnode noted that institutional demand for Bitcoin has weakened significantly compared with previous months, with spot Bitcoin ETFs recording near-daily outflows over the past two weeks. Investors appear to be reducing their exposure as global financial markets become increasingly uncertain and volatile.
These persistent ETF outflows are particularly important because institutional inflows were a major driver behind Bitcoin’s powerful rally earlier this year. Strong demand from spot Bitcoin ETFs helped BTC climb to fresh highs, reinforcing bullish market sentiment. However, if ETF demand continues to deteriorate, analysts warn that Bitcoin could face additional selling pressure in the near term.
Bitcoin Slides After U.S. Strikes on Iran
The crypto market came under renewed pressure this week as escalating geopolitical tensions weighed heavily on investor sentiment. Bitcoin (BTC) declined amid expectations and subsequent reports of U.S. military strikes targeting Iranian assets in the Middle East. As global risk appetite deteriorated, investors shifted capital toward traditional safe-haven assets, triggering fresh selling across risk-sensitive markets.
Geopolitical uncertainty often sparks sharp reactions in the cryptocurrency market, and the latest developments have intensified caution among traders. With investors reducing exposure to risk assets such as Bitcoin, BTC price came under significant pressure and moved lower as market uncertainty deepened.
Bitcoin Struggles to Reclaim $78,000
Bitcoin (BTC) remains under pressure below the key $78,000 resistance zone, with multiple recovery attempts failing throughout the week. Each time BTC approached higher levels, sellers quickly regained control as market sentiment weakened amid reports of U.S. military strikes in the Middle East.
The continued risk-off mood has limited bullish momentum, keeping Bitcoin trapped in a fragile technical position. According to CoinMarketCap, BTC recently fell toward the $76,500 area as traders reacted to rising geopolitical uncertainty and persistent ETF outflows.
For Bitcoin to regain bullish momentum, analysts believe stronger institutional buying will be necessary to offset the recent wave of ETF outflows and weakening market sentiment. Without renewed demand from large investors, BTC could continue trading sideways or extend its decline in the near term.
Market watchers also note that Bitcoin’s support in the mid-$75,000 region remains critical for short-term price stability. A sustained break below that area could trigger additional downside pressure, while holding above it may help BTC stabilize as traders assess broader macroeconomic and geopolitical risks.
Technical indicators currently suggest that bearish pressure remains dominant for Bitcoin (BTC). Data from Investing.com shows that most major moving averages are still flashing “Strong Sell” signals, reflecting weak market sentiment and continued downside momentum.
The Relative Strength Index (RSI) also remains below neutral territory, indicating that bullish momentum has yet to recover. Meanwhile, MACD indicators continue to generate sell signals, reinforcing the negative short-term outlook for BTC.
Both short-term and long-term moving averages continue to point toward further downside risk, while several Bitcoin oscillators are gradually moving into oversold territory. Analysts believe stronger buying activity from Bitcoin bulls will be needed to stabilize the market and prevent BTC price from extending its decline further.
GBP/USD trades around 1.3446 during Tuesday’s European midday session, declining 0.42% on the day as the pair continues to retreat after failing to hold above the key 1.3500 psychological barrier earlier in the session. Sterling reached a three-week peak at 1.3517 on April 22, supported by broad US Dollar weakness during the short-lived easing of Iran-related tensions, but has since fallen roughly 70 pips toward the 1.3400 region. This area is reinforced by nearby technical support from the 21-day SMA at 1.3444 and the 50-day SMA at 1.3409.
Meanwhile, the 8-day, 21-day, 50-day, and 100-day EMAs are all converging close to current price levels, creating a compressed technical setup that has historically preceded directional moves of around 150–200 pips once a decisive catalyst emerges. Since March 30, GBP/USD has largely remained confined within a broader 335-pip range between the 1.3182 low and the April 22 high at 1.3517, encompassing the full period of volatility linked to the Iran conflict. With the pair now trading near the midpoint of that range, price action continues to reflect the consolidation pattern highlighted in the 30-day baseline outlooks from JPMorgan Chase and Cambridge Currencies.
Today’s Catalyst: Dollar Gains Safe-Haven Support After U.S. Strikes on Iranian Vessels
Tuesday’s decline in GBP/USD below the 1.3500 threshold was primarily driven by renewed geopolitical tensions that boosted demand for the US Dollar as a safe-haven asset. Overnight, US forces launched defensive strikes on Iranian vessels near the Strait of Hormuz, while President Donald Trump reportedly urged negotiators “not to rush into a deal,” undermining the de-escalation optimism that had previously helped Cable climb to a three-week high.
According to FXStreet, GBP/USD extended its retreat during the European session as cautious market sentiment strengthened the greenback following the latest US-Iran developments. The broader dollar rally pushed the US Dollar Index to a one-month high near 99.27, while EUR/USD slipped below 1.1650 and USD/JPY advanced toward 159.32.
The underlying market logic remains straightforward: as geopolitical risk returns, investors rotate back into the US Dollar. Sterling has struggled to counterbalance that flow because the current interest-rate differential between the Bank of England and the Federal Reserve is among the narrowest across major currency pairs, limiting the pound’s relative yield advantage.
Attention now shifts to Wednesday’s Camp David peace talks, which could become the next decisive catalyst for FX markets. A successful framework agreement would likely reduce safe-haven demand for the dollar and potentially drive GBP/USD back toward the 1.3600 area. On the other hand, if negotiations deteriorate or fail altogether, bearish momentum could accelerate, exposing the 1.3400 level and possibly opening the path toward 1.3300.
Cable’s technical setup continues to revolve around several well-defined levels closely watched by market participants. Initial support is seen at 1.3444, where the 21-day SMA currently sits, followed by the 50-day SMA at 1.3409 and the psychologically important 1.3400 handle, which also marks a recent consolidation base.
A decisive move below 1.3400 could expose the pair to deeper losses toward 1.3300, while 1.3182 — the March 30 six-week trough — stands as the next major structural support level.
On the upside, resistance remains concentrated around the 1.3500–1.3517 region, aligning with both the late-April peak and a key psychological barrier. Beyond that, traders are monitoring 1.3600, followed by 1.3700 as the broader upside target, particularly if the Bank of England adopts a more hawkish stance or the US Dollar weakens significantly.
The 21-day SMA near 1.3444 has repeatedly attracted price action throughout May, while the clustering of the 8-, 21-, 50-, and 100-day EMAs around current levels points to an unusually compressed technical structure — a condition that often precedes a stronger directional breakout.
Momentum indicators continue to reflect indecision. RSI remains neutral within the 45–55 range, while MACD hovers near the zero line, reinforcing the classic “coiled spring” technical setup.
BoE Outlook: Rates Held at 3.75% as Bailey Dismisses Immediate Tightening Expectations
The Bank of England kept its Bank Rate unchanged at 3.75% during the March MPC meeting, with policymakers voting unanimously to maintain current settings. The April 30 meeting produced another widely expected hold, in line with the consensus forecast among Reuters-polled economists.
A key takeaway for markets has been Governor Andrew Bailey pushing back against expectations of near-term rate hikes. Despite persistent inflation pressures in the eurozone and elevated US CPI readings, the BoE continues to characterize the UK’s inflation overshoot as largely temporary and energy-related rather than deeply embedded in the domestic economy.
Current market pricing implies around 39 basis points of tightening over the next 12 months — effectively suggesting one modest rate increase spread gradually across the year instead of an aggressive hiking cycle.
The central bank’s cautious stance also reflects concerns about weakening domestic demand. The MPC’s February 2026 projections showed a negative output gap of roughly 1% of GDP for 2026, a signal that economic slack may eventually argue more for easing than additional tightening.
Meanwhile, the BoE’s projected inflation range for Q2 and Q3 remains around 3.0%–3.5%, and March CPI at 3.3% arrived comfortably within that band. That outcome has given Bailey room to justify maintaining a patient, wait-and-see approach.
Markets had viewed the April rate decision as a potential catalyst for a larger move in GBP/USD. A clearly hawkish hold could have lifted Cable toward the 1.37–1.38 region, while a more dovish message risked reversing sterling’s recent gains. Instead, the BoE delivered a balanced and nuanced hold, helping keep GBP/USD anchored near the 1.3500 area rather than sparking a decisive breakout in either direction.
UK Macro Picture: Cooling Headline Inflation Meets Sticky Services Prices and Softening Labor Market
Sterling’s fundamental backdrop remains divided by what increasingly resembles a mild stagflationary environment in the UK economy.
Headline inflation eased notably in April, with CPI slowing to 2.8% year-over-year from 3.3% in March and 3.0% in February. The decline was partly supported by the regulator-controlled energy price cap, which helped limit the pass-through from Iran-related energy market volatility into household costs.
However, underlying inflation pressures remain elevated. Services inflation accelerated to 4.5% in March from 4.3% previously, while wage settlements for 2026 are tracking near 3.6% — both still well above levels the Bank of England would typically view as fully consistent with price stability.
At the same time, cracks are appearing in the labor market. UK unemployment unexpectedly climbed to 5.0% in the three months through March, up from 4.9%, while job vacancies fell 3.9% to around 705,000 — the weakest reading in five years, according to the Office for National Statistics.
This combination of softer headline inflation, persistent services-sector price pressure, weakening employment conditions, and a projected negative output gap has left the BoE stuck in a difficult policy position. Inflation in services remains too elevated to comfortably justify rate cuts, yet slowing growth and labor-market deterioration make aggressive tightening increasingly difficult to defend.
The uncertainty surrounding the broader geopolitical situation — particularly the potential economic consequences of the Iran conflict — has added another layer of caution to the central bank’s outlook.
That policy dilemma helps explain why the BoE has maintained its 3.75% Bank Rate despite conflicting economic signals. As noted by T. Rowe Price, the UK policy rate already sits near the upper end of the Federal Reserve’s range, giving sterling a degree of yield support against the dollar even before any additional BoE tightening is considered.
Fed Outlook: Warsh Transition, Split FOMC, and Rising Odds of Another Rate Hike
The US side of the GBP/USD rate differential is entering a period of added uncertainty as leadership changes at the Federal Reserve reshape market expectations.
Jerome Powell officially concluded his term as Fed Chair on May 15, while Kevin Warsh is expected to preside over the June 16–17 FOMC meeting after his nomination advanced through the Senate Banking Committee.
The April 28–29 FOMC meeting kept rates unchanged at 3.50%–3.75%, but the decision came with an unusually divided 8–4 vote — the highest number of dissents since 1992. The split highlighted growing disagreement within the committee over whether policymakers should respond more aggressively to Iran-related energy inflation risks.
Markets are now pricing roughly a 25% probability of a quarter-point hike by December, according to CME FedWatch estimates, up from around 21.5% earlier in the month. Investors also increasingly expect Warsh to adopt a more hawkish tone, particularly regarding balance-sheet policy and the broader inflation outlook.
US Treasury yields remain elevated, reinforcing underlying dollar support. The 10-year yield is trading around 4.47%–4.59%, the 30-year near 5.02%–5.12%, and the 2-year around 4.08%. Those yield levels continue to favor the dollar versus sterling unless the Bank of England unexpectedly shifts toward a more aggressive tightening stance.
For GBP/USD, the policy asymmetry remains critical. A hawkish surprise from Warsh — especially a June rate increase or stronger tightening guidance — could drag Cable back toward the 1.3300 region. Conversely, if the Fed signals a willingness to prioritize growth risks and eventually cut rates despite elevated inflation, sterling could regain momentum toward the 1.3700 area and beyond.
Rate Parity and the BoE–Fed Dynamic: The Core Driver Behind Cable’s Q3 Outlook
The defining structural feature of GBP/USD right now is the unusually tight rate alignment between the Bank of England and the Federal Reserve.
With the BoE’s Bank Rate at 3.75% and the Fed funds range sitting at 3.50%–3.75%, sterling assets currently offer yields that are marginally above comparable dollar-denominated assets. That 0–25 basis-point differential is historically narrow and reflects how closely the two policy paths have converged since the post-2024 normalization cycle began.
The market implication is straightforward but highly important for Cable:
Any hawkish shift from the BoE — whether through dissenting MPC votes, firmer guidance language, or upgraded inflation forecasts — would likely widen the yield advantage in sterling’s favor and push GBP/USD toward the 1.3600–1.3700 region.
Conversely, a dovish turn from the BoE, especially if rising unemployment and a negative output gap eventually force rate cuts, could push the differential back in favor of the dollar and drag Cable toward 1.3300–1.3200.
The same logic applies on the US side. A more hawkish Kevin Warsh-led Fed would strengthen the dollar by widening rate spreads against sterling, while a dovish pivot would erase much of the dollar’s remaining yield advantage and weaken USD broadly.
That interaction makes GBP/USD arguably the most policy-sensitive G10 currency pair heading into Q3 2026. The June 16–17 FOMC meeting and the next BoE decision later in June are increasingly viewed as the two major binary catalysts likely to define the pair’s medium-term direction.
Meanwhile, the broader dollar backdrop remains constructive but far from decisively bullish.
The U.S. Dollar Index is trading near 99.27, its highest level in roughly five weeks, supported by renewed safe-haven demand linked to Iran tensions and firmer US Treasury yields. Even so, the index remains well below the wartime spike above 100 recorded earlier in April when the conflict initially pushed oil prices toward $116 per barrel.
The broader 2026 dollar story has been one of stabilization after extreme volatility:
DXY fell roughly 11% during the first half of 2025 — its steepest H1 decline since 1973 — amid tariff-related capital outflows.
The index bottomed near 96.5 in September 2025.
Since then, it has largely consolidated within a 96–100 range through most of Q2 2026.
According to Cambridge Currencies, DXY could drift toward 94–98 in Q3 and potentially 90–96 by Q4, a scenario broadly consistent with their year-end GBP/USD projection around 1.37–1.42 if second-half dollar weakness develops.
Yield spreads also continue to shape relative currency flows. The US–Germany 10-year spread remains elevated near 159 basis points, while the equivalent US–UK spread is notably narrower at roughly 60–80 basis points depending on daily moves — another reason sterling has held up comparatively well against the dollar.
Positioning data further complicates the outlook. CFTC figures show speculative USD net longs near the 18th percentile on a 52-week basis, meaning market positioning remains relatively light in dollar exposure. That creates the potential for an asymmetric short squeeze in the dollar if geopolitical tensions ease abruptly or if the Fed unexpectedly turns more hawkish.
The institutional forecast range for GBP/USD remains unusually wide by G10 standards, reflecting the high degree of uncertainty surrounding both central-bank policy and geopolitical developments.
The bearish end of the spectrum is led by Goldman Sachs, which projects Cable near 1.36 by the end of 2026. Goldman’s view is that sterling remains heavily tied to broader EUR/USD dynamics and lacks a strong independent catalyst, especially as slower UK growth and fiscal tightening limit upside potential even in an environment of moderate dollar weakness.
JPMorgan Chase holds a more cautious medium-term stance, expecting GBP/USD around 1.39 in early 2026 before easing back toward 1.36 later in the year. Their framework centers on cyclical US economic slowing and expanding fiscal concerns weighing on the dollar, though they remain wary of UK-specific risks such as potential BoE easing toward 3.25% or lower. As a result, JPMorgan favors tactical sterling longs rather than aggressive structural bullish positions.
Meanwhile, MUFG sees Cable moving toward 1.40 by mid-2026, broadly in line with a gradual unwinding of US dollar strength.
A somewhat more constructive outlook comes from Cambridge Currencies, which forecasts GBP/USD in the 1.37–1.42 range by year-end. That scenario depends heavily on continued de-escalation in the Iran conflict and at least one rate cut from a Federal Reserve led by Kevin Warsh.
The most bullish major-bank projection currently comes from Morgan Stanley, targeting 1.47 by the end of 2026. Their thesis assumes three Fed rate cuts in the first half of the year, driving policy rates toward 3.00% and significantly reducing the dollar’s yield advantage. However, Morgan Stanley has recently softened some of its bullish conviction as the dollar continues to show resilience amid geopolitical uncertainty and elevated Treasury yields.
Outside the major-bank consensus, Long Forecast projects GBP/USD around 1.4750 by the end of 2026, with a longer-term bullish scenario extending toward 1.5500 by late 2028.
On the downside, the principal bearish risk scenario remains a combination of dovish BoE policy and renewed escalation in the Iran conflict. Under that setup, Cable could fall toward 1.32, with stronger long-term structural support expected near 1.30.
Overall, Reuters analyst surveys continue to show the broad consensus clustered between 1.36 and 1.40 for year-end 2026, reinforcing the idea that markets expect gradual sterling appreciation — but not a disorderly collapse in the dollar.
Cross-Asset Snapshot: Tight Yield Spreads, Choppy Oil, and a Resilient Dollar
Tuesday’s cross-asset backdrop around GBP/USD reflected a broader “risk-off-light” market tone, with price action driven primarily by shifting geopolitical headlines and bond-yield volatility.
The U.S. 10-Year Treasury Yield initially fell roughly 7 basis points to around 4.47% following temporary optimism surrounding Iran peace discussions, before rebounding back toward 4.50% after comments from Donald Trump reignited demand for safe-haven positioning. That sharp intraday reversal has made it difficult for FX traders to establish durable positions around the US-UK yield differential.
Meanwhile, UK 10-year gilt yields remain anchored near the 4.5% area, holding close to the highest levels seen since 2008 as markets continue to price persistent inflation risks tied to the Iran conflict and elevated energy prices.
Oil markets also stayed highly volatile. Brent Crude rebounded toward $100.40 after falling as low as $96.20 earlier in the session, while West Texas Intermediate climbed back near $94.19. The sharp swings in crude prices continue to dominate broader macro sentiment across G10 FX markets.
Elsewhere, Gold fell around 1.1% to roughly $4,521.80 per ounce, reinforcing the broader picture of renewed dollar firmness and higher real-yield support. Bitcoin also weakened, slipping toward $76,700 as risk appetite softened.
Taken together, the combination of elevated US yields, a steadier dollar, and unstable energy markets creates a challenging environment for sterling. Compared with the euro, the pound tends to exhibit higher sensitivity to rising US yields, while the UK economy remains more exposed to oil- and gas-driven inflation shocks due to its heavier reliance on imported natural gas.
Positioning Dynamics: Limited Sterling Exposure, Crowded Dollar Shorts
Speculative positioning data continues to reinforce the broader asymmetry embedded in the current GBP/USD setup.
According to recent Commodity Futures Trading Commission data, net long positioning in the US Dollar remains historically light, sitting near the 18th percentile on a 52-week basis. Aggregate USD positioning is still close to heavily shorted territory, with speculative net shorts around 28,450 contracts and long exposure declining by roughly 2,750 contracts week-over-week.
Sterling positioning, by contrast, appears far more balanced. CFTC data shows GBP net shorts at only moderate levels, indicating that traders are neither aggressively bullish nor heavily bearish on the pound at current levels.
That distinction matters because the dollar’s recent strength does not appear to be driven primarily by speculative momentum buying. Instead, the bid has been supported by genuine safe-haven demand and higher US yield differentials — flows that tend to be more durable in the short term, but also highly vulnerable to a sudden geopolitical de-escalation.
For GBP/USD, the implication is asymmetric:
A credible Iran de-escalation agreement or broader geopolitical breakthrough could trigger a rapid unwinding of defensive dollar positioning, allowing Cable to accelerate quickly toward the 1.3600–1.3700 zone.
However, that upside scenario likely requires a clean diplomatic outcome with sustained confidence that regional tensions are easing materially.
On the other hand, if the conflict drags on without resolution, the positioning backdrop suggests a slower, steadier grind lower for sterling rather than a disorderly collapse, as investors continue favoring the dollar’s safe-haven and yield advantages.
Key Risks to the Bullish GBP/USD Outlook
The bullish case for Cable remains highly conditional and vulnerable to several major macro and geopolitical risks.
The first and most immediate threat would be a dovish surprise from the Bank of England. If UK unemployment continues rising above 5.0% and economic activity weakens further, the BoE could eventually be forced to cut rates back toward 3.50%. Such a move would likely erase sterling’s narrow yield advantage over the dollar and push GBP/USD below the critical 1.3400 support area, potentially opening a move toward 1.3300. In that context, Governor Andrew Bailey’s repeated pushback against rate-hike expectations may partly reflect an effort to preserve policy flexibility should growth conditions deteriorate more sharply.
The second major risk centers on renewed escalation in the Iran conflict. A fresh surge in oil prices — particularly if Brent Crude climbs back above $110 per barrel — would likely drive US Treasury yields higher, strengthen the U.S. Dollar Index above the 100 level, and increase safe-haven demand for the dollar. Under that scenario, GBP/USD could slide toward the 1.3200 region.
A third vulnerability comes from UK fiscal policy. Rachel Reeves continues to face a difficult balancing act between fiscal discipline and economic support. Fiscal credibility concerns have periodically triggered sharp sterling selloffs, including the notable volatility episode in July 2025 that markets informally labeled “Pound Plummets on Chancellor’s Tears.” Any disappointing Spring Statement or Budget announcement could easily trigger another 200–300 pip downside adjustment in sterling.
The fourth risk factor is political instability. Upcoming by-elections, combined with uncertainty surrounding a potential autumn Budget, could reintroduce a meaningful political-risk premium into UK assets and weigh further on the pound.
The bearish interpretation has been summarized well by Rabobank, which argues that sterling may struggle to sustain recent gains amid persistent political uncertainty and a weak domestic macro backdrop.
By contrast, the bullish case for GBP/USD requires several conditions to align simultaneously:
sustained Iran de-escalation,
a relatively hawkish BoE hold,
a more dovish Federal Reserve pivot toward cuts,
and stable UK fiscal policy.
In practical terms, sterling likely needs at least three of those four factors to fall into place before a sustained move toward the 1.37–1.40 region becomes realistic.
Final Outlook: GBP/USD’s 1.3400–1.3700 Range Hinges on Camp David and the Warsh-Led Fed
GBP/USD’s move around 1.3446 leaves Cable firmly trapped within the 1.3400–1.3517 range that has dominated price action throughout most of May. The next decisive breakout now depends on three major catalysts expected over the coming month: the Camp David Iran peace talks, the late-June Bank of England meeting, and the June 16–17 Federal Reserve meeting expected to be led by Kevin Warsh.
The bullish scenario begins with a credible diplomatic breakthrough at Camp David. A meaningful Iran framework agreement that stabilizes the Strait of Hormuz and reduces safe-haven demand for the dollar could quickly lift GBP/USD toward 1.3600, with 1.3700 becoming the next major structural upside target.
If the BoE then delivers a hawkish hold — particularly through dissenting votes or firmer inflation guidance — the upside case strengthens further and aligns with Cambridge Currencies’ projected 1.37–1.42 range.
The most aggressive sterling-bullish path would emerge if Warsh subsequently signals a willingness to move toward Fed easing despite elevated inflation pressures. Under that setup, the broader dollar yield advantage would erode materially, making Morgan Stanley’s 1.47 year-end target increasingly plausible.
The bearish scenario requires the opposite chain of events:
failure or breakdown in the Camp David negotiations,
renewed Iran escalation pushing Brent Crude back above $110,
a dovish BoE shift that eliminates sterling’s narrow rate advantage,
or a hawkish Warsh-led Fed that drives the U.S. Dollar Index decisively above 100.
In that environment, GBP/USD would likely retest 1.3400 and potentially extend losses toward 1.3300, bringing the more conservative year-end forecasts from Goldman Sachs and JPMorgan Chase back into focus as the dominant structural baseline.
Technically, the unusually tight clustering of the 8-, 21-, 50-, and 100-day EMAs around current spot levels signals that a larger directional move is approaching. The catalyst calendar creates an asymmetric setup:
Iran de-escalation favors upside acceleration,
while disappointing UK macro data or dovish BoE signals favor downside pressure.
Ultimately, the defining question for GBP/USD through Q3 may simply be which side of 1.3500 the pair is trading on by July. For now, Tuesday’s rejection from 1.3517 back toward 1.3450 suggests that marginal capital flows still lean modestly in favor of the dollar.
Several years ago, I projected that gold’s assault on the world’s fiat currencies would likely pause around April 2026. That slowdown actually began in February. While the global currency queen still has many more victories ahead against fiat money, the market’s current phase is one of consolidation — and that’s a healthy development.
The long-term chart comparing failed fiat currencies to gold tells the real story. It’s essential for gold investors to keep their attention on the broader picture and recognize that gold is not some speculative “hot stock.”
Gold is the world’s ultimate currency, and investors should focus on steadily and patiently accumulating more of it over time.
A look at the daily gold chart shows a few encouraging “green shoots,” including a potential double bottom forming in the Stochastics (14,7,7) indicator.
However, leveraged futures traders remain concerned that the ongoing turmoil around the Strait of Hormuz could persist, potentially pushing oil prices — and in turn interest rates — higher.
Since these traders heavily influence short-term market movements, their concerns continue to weigh on gold’s near-term price action.
The US government had hoped for a swift resolution to the war in Ukraine, but that outcome has yet to materialize. In response to the prolonged conflict, the Russian central bank has increasingly turned to gold sales to help finance the ongoing strain and instability.
Notice the weak, “wet noodle” behavior of the key 14,5,5 Stochastics oscillator.
That kind of sluggish momentum appears consistent with the idea of continued central bank gold selling from Russia — and possibly Turkey and others as well.
The war in Ukraine created significant disruption across global markets, and the conflict involving Iran could generate even greater turbulence.
Oil shortages are already emerging in parts of Asia and are expected to reach Europe within weeks. To cushion the impact, the US government has been drawing down and effectively “exporting” oil from the Strategic Petroleum Reserve (SPR). However, if the Strait of Hormuz crisis continues, that supply may soon be needed domestically.
In short, gold futures traders increasingly believe the Iran conflict could lead to prolonged inflationary pressure and higher interest rates — though likely not to the extreme levels seen during the 1970s.
That also means many traders continue to view higher interest rates as a negative factor for gold.
As for gold investor morale, the BPGDM sentiment index — while technical in nature — has historically done a solid job of reflecting overall sentiment within the gold market.
Periods of weak confidence typically occur when the BPGDM falls below the 50 level, which is exactly where it sits now. Interestingly, those same periods have often presented some of the best buying opportunities for long-term investors.
In short, the market may still need a bit more consolidation before gold, silver, and mining stocks begin their next major move higher against fiat currencies. However, investors accumulating positions during the current weakness are likely to be rewarded over the longer term.
The US stock market may appear overvalued, yet the broader trend remains remarkably bullish. Historically, precious metals often rally alongside strong equity markets — although there is usually a delay before gold and silver begin to catch up.
In many cases, the stock market moves first, while metals and mining shares follow later as liquidity and investor enthusiasm gradually spill over into the sector.
Gold’s current pause is unfolding alongside a similar consolidation on this impressive CDNX weekly chart.
At the same time, the market appears to be adding the “final touches” of symmetry to a powerful inverse head-and-shoulders launchpad pattern — a formation that many investors view as a strong long-term bullish setup.
The daily chart for GDX shows that key momentum indicators — including the RSI, Stochastics, and MACD — are no longer confirming the latest low in price.
That positive divergence comes at the same time as the stock market’s powerful upside breakout, suggesting the current lull in precious metals could simply be the calm before a major rally.
The bigger questions gold investors should ask themselves are straightforward: If government narratives stop focusing on debt, does the debt suddenly disappear? Of course not. If gold stocks and silver have historically lagged behind the stock market before eventually staging explosive rallies, is it reasonable to expect that pattern to repeat? Absolutely. And is gold still one of the world’s most trusted and enduring forms of money? Many investors would say yes.
In short, for gold bulls, the strategy right now may simply be to stay patient — and stay optimistic.
Bitcoin retreats toward $76,000 as escalating Middle East tensions intensify following US “self-defense” strikes near the Strait of Hormuz.
Ethereum falls below $2,100, mirroring a broader risk-off mood even as Iranian negotiators gather in Qatar to finalize the US-Iran memorandum of understanding.
XRP deepens its decline below $1.35 while continuing to hold above the SuperTrend indicator’s dynamic support around $1.32.
Cryptocurrency markets remain under pressure on Tuesday, with Bitcoin (BTC) pulling back toward the crucial $76,000 support area as risk-off sentiment persists. Ethereum (ETH) trades below the $2,100 mark, while Ripple (XRP) continues to consolidate beneath $1.35 after encountering resistance near $1.37.
Military tensions cloud US-Iran peace prospects
The weakness across global financial markets follows US military strikes launched Monday against targets in southern Iran near the Strait of Hormuz. According to a statement from US Central Command (CENTCOM) spokesperson Captain Tim Hawkins, the operations were carried out in “self-defense” and aimed at “protecting US troops from threats posed by Iranian forces.”
The consequences of the latest strikes for a potential US-Iran peace agreement remain uncertain. Iran’s Islamic Revolutionary Guard Corps (IRGC) stated on Tuesday that the country reserves the “legitimate and definite” right to respond to any violations of a ceasefire by the United States, according to BBC reports.
Despite rising tensions, US Secretary of State Marco Rubio stressed that a diplomatic resolution is still achievable, referencing Tuesday’s planned talks in Doha involving Iranian Foreign Minister Abbas Araghchi and Qatar’s Prime Minister. The discussions are expected to focus on finalizing the memorandum of understanding (MoU) between Washington and Tehran.
“We’ll see if we can make progress. There’s still a lot of back-and-forth over the wording in the initial document, so it may take a few more days,” Rubio told reporters during a visit to India.
Meanwhile, sentiment in the crypto market remains fragile. The Crypto Fear & Greed Index edged up to 34 on Tuesday from 30 a day earlier, but it still sits firmly in Fear territory. Investors continue to assess the broader economic risks stemming from the conflict, particularly as inflationary pressures in the United States remain elevated.
Price analysis: Bitcoin remains under pressure as downside risks persist
Bitcoin is trading around $76,668, maintaining a bearish short-term outlook as the price continues to stay below the 50-day, 100-day, and 200-day Exponential Moving Averages (EMAs), which are positioned between approximately $76,784 and $81,285.
The alignment of these short- and long-term EMAs above the current market price indicates that upward moves are facing strong resistance pressure. Meanwhile, the Relative Strength Index (RSI) remains below the neutral 50 level on the daily chart, signaling weakening bullish momentum rather than deeply oversold conditions.
On the upside, Bitcoin faces immediate resistance at the 50-day EMA near $76,784, followed closely by the 100-day EMA around $76,880. A stronger resistance zone is located at the 200-day EMA near $81,285. To the downside, the key structural support remains the ascending trend line around $70,500. A daily close below this level could intensify bearish momentum and trigger a deeper correction.
Altcoins technical outlook: Ethereum and XRP remain under selling pressure
Ethereum is trading near $2,095 and continues to show a bearish short-term structure as the price stays below major moving averages. The 50-day EMA at $2,217, the 100-day EMA at $2,294, and the 200-day EMA at $2,516 are acting as layered dynamic resistance levels, indicating that recovery attempts may remain limited while ETH trades beneath this zone.
Momentum indicators also reflect ongoing weakness. The Relative Strength Index (RSI) remains in the upper-30 range on the daily chart, pointing to subdued buying strength, while the Moving Average Convergence Divergence (MACD) histogram stays in negative territory, suggesting bearish pressure continues to dominate despite intermittent rebounds.
On the downside, Ethereum’s immediate support is located around the ascending trendline near $2,074, where buyers could attempt to defend the price during pullbacks. A decisive break below this level would likely expose ETH to deeper losses and further strengthen the prevailing bearish structure.
To the upside, a move back above the 50-day EMA at $2,217 would provide the first signal that bearish pressure is easing. Additional resistance levels are seen at the 100-day EMA near $2,294 and the 200-day EMA around $2,516. Ethereum bulls would need to reclaim these key zones to confirm a more sustainable bullish reversal.
Meanwhile, XRP is trading near $1.34 and continues to maintain a bearish near-term outlook as the token remains below the 50-day EMA near $1.40, the 100-day EMA at $1.47, and the 200-day EMA at $1.68. Weak momentum indicators further support the downside bias, with the Relative Strength Index (RSI) hovering around 40 on the daily chart and the MACD histogram remaining in negative territory. This suggests that recovery attempts are likely to encounter selling pressure while the major moving averages continue to cap upward momentum.
On the upside, XRP faces initial resistance at the 50-day EMA around $1.40, followed by a stronger hurdle at the 100-day EMA near $1.47. The 200-day EMA at $1.68 represents a major long-term resistance zone and continues to act as the broader bearish ceiling unless successfully reclaimed.
On the downside, immediate support is seen at the SuperTrend indicator near $1.33. A decisive move below this level could trigger a deeper correction and intensify bearish momentum. However, as long as XRP remains above the SuperTrend support, the token is likely to continue consolidating beneath the cluster of major moving averages.
Silver weakens as renewed US-Iran tensions fuel inflation concerns and reinforce expectations of higher-for-longer interest rates. Iran claimed it struck a US F-35 fighter jet and multiple drones after Washington confirmed “self-defense” strikes in southern Iran. Meanwhile, investors continue to evaluate the Federal Reserve’s policy outlook after May consumer confidence fell amid rising inflation fears linked to the Middle East conflict.
Silver prices (XAG/USD) stayed under pressure for a second straight session, hovering near $76.90 per troy ounce during Wednesday’s Asian trading hours. The precious metal remained subdued amid renewed geopolitical tensions and uncertainty surrounding the strategically important Strait of Hormuz, although investors continued to watch for possible progress in US-Iran peace negotiations.
Market sentiment was shaken by fresh military confrontations in the Middle East, heightening concerns over a potential energy-driven inflation surge. These fears reinforced expectations that major central banks may maintain restrictive monetary policies for a longer period.
The US military confirmed carrying out self-defense strikes in southern Iran, while Iran’s Revolutionary Guard stated it had targeted an American F-35 fighter jet along with several drones allegedly entering Iranian airspace.
Adding to tensions, Iran’s foreign ministry condemned the recent US airstrikes in Hormozgan province, calling them a “gross violation” of the fragile seven-week ceasefire. Iranian media also reported explosions across the region early Tuesday.
Investors are also evaluating the Federal Reserve’s policy outlook, a key driver for non-yielding assets such as silver. The US Consumer Confidence Index slipped to 93.1 in May from a revised 93.8 in April, as concerns over inflation tied to the Iran conflict weighed on sentiment. Although consumers remained pessimistic about current labor market conditions, many still expected improvement later in the year.
Attention is now turning to upcoming comments from Federal Reserve officials, including Vice Chair Philip Jefferson and Governor Lisa Cook, for further insight into the inflation and interest-rate outlook. Traders are also awaiting Thursday’s US Personal Consumption Expenditures (PCE) report, which could provide additional clues on the future path of Fed policy.
The Canadian Dollar lacked clear direction against major currencies as investors monitored fresh updates on US-Iran negotiations. Meanwhile, Canada’s Q1 GDP is forecast to expand at an annualized rate of 1.5%.
The Canadian Dollar (CAD) traded mostly steady against its major counterparts on Wednesday’s Asian session, with the exception of the New Zealand Dollar (NZD), while hovering near 1.3810 against the US Dollar (USD).
The Loonie struggled to find clear direction as investors closely monitored fresh developments surrounding negotiations between the United States (US) and Iran aimed at permanently ending tensions in the Middle East and reopening the Strait of Hormuz.
Talks between Washington and Tehran remained ongoing despite Iran accusing the US of carrying out attacks that US Central Command described as “defensive” actions intended to protect American troops from threats posed by Iranian forces, according to the BBC.
Adding to optimism, an Iranian official stated on Tuesday that the final major obstacle in negotiations involves the release of frozen Iranian assets, with discussions reportedly being mediated by Qatar, according to Iran’s Fars news agency. Although there has been no official confirmation, the comments raised expectations that both sides may be nearing an agreement.
Meanwhile, attention in Canada has shifted toward upcoming monthly and first-quarter Gross Domestic Product (GDP) figures due on Friday. Canada’s monthly GDP is forecast to rise modestly by 0.1%, compared with the previous 0.2% increase. On an annualized basis, the economy is expected to grow 1.5% in Q1 after shrinking 0.6% previously.
WTI advances amid renewed supply concerns after US self-defense strikes in southern Iran on Monday. President Donald Trump said talks on a deal with Iran are “proceeding nicely,” though he warned that failed negotiations could lead to fresh military action. Meanwhile, three LNG tankers and a previously stranded Iraqi crude supertanker have recently transited the Strait of Hormuz en route to Asia.
West Texas Intermediate (WTI) crude oil prices rebounded during Tuesday’s Asian session, recovering from four consecutive daily losses to trade near $90.60 per barrel. The recovery was driven by renewed concerns over supply disruptions after US forces carried out self-defense strikes in southern Iran on Monday.
According to Fox News, a spokesperson for US Central Command said the strikes targeted missile launch sites and Iranian vessels allegedly attempting to deploy naval mines. While Washington reaffirmed its commitment to protecting US personnel, officials also stressed that the military would continue exercising restraint under the current ceasefire arrangement. Iranian media outlets reported explosions in and around the coastal city of Bandar Abbas near the Strait of Hormuz.
Despite Tuesday’s rebound, WTI had plunged more than 6% on Monday after Bloomberg reported that US President Donald Trump said negotiations with Iran aimed at ending the conflict and reopening the Strait of Hormuz were “proceeding nicely.” Trump nevertheless warned that a breakdown in talks could prompt renewed military action, although reports suggested that a Pakistani mediator had informed China that an agreement was close.
The US and Iran are currently negotiating a framework that would extend the ceasefire for roughly two months. Under the proposed arrangement, Washington would ease its maritime blockade while Tehran would reopen the Strait of Hormuz.
Both sides have reportedly made progress toward a memorandum of understanding intended to pause hostilities and grant negotiators a 60-day window to finalize a broader peace agreement. Supporting signs of tentative de-escalation, ship-tracking data showed that three LNG tankers recently transited the strait en route to Pakistan, China, and India. In addition, a supertanker carrying Iraqi crude oil resumed its voyage to China after being stranded for nearly three months.
Gold comes under renewed selling pressure on Tuesday as recovering US Dollar demand weighs on the precious metal. Mixed signals surrounding a potential US-Iran peace deal continue to support geopolitical uncertainty, while expectations for further Fed rate hikes provide additional support to the USD and pressure Gold prices.
Gold (XAU/USD) faces renewed selling pressure during Tuesday’s Asian session, surrendering much of Monday’s rebound near the $4,580 resistance level as renewed US Dollar strength weighs on the precious metal. Although uncertainty surrounding a potential US-Iran peace agreement continues to limit broader market optimism, safe-haven demand for the USD remains supported. At the same time, persistent geopolitical tensions have sparked a modest recovery in Crude Oil prices, reviving inflation concerns and reinforcing expectations that the US Federal Reserve may maintain a hawkish policy stance. This, in turn, provides additional support for the Greenback and pressures the non-yielding yellow metal.
Reports citing comments from Central Command revealed that US forces carried out self-defense strikes in southern Iran on Monday, targeting missile launch sites and Iranian boats allegedly attempting to deploy mines. The latest escalation adds to ongoing disputes over Iran’s nuclear program and tensions surrounding the Strait of Hormuz, reducing hopes for a resolution to the nearly three-month-long conflict. Furthermore, US President Donald Trump has repeatedly warned of further military action if Iran refuses to accept a broader peace agreement. These developments keep geopolitical risks elevated and help the safe-haven USD recover after falling to a more than one-week low on Monday, adding downside pressure on Gold prices.
Meanwhile, Iran has effectively disrupted nearly all shipping activity through the Gulf since the conflict began, affecting around 20% of global oil supplies. Combined with the US blockade of Iranian ports and the latest military developments, this has helped Crude Oil prices rebound from a two-week low. The renewed rise in energy prices has reignited fears of persistent inflation, increasing speculation that major central banks — including the Fed — may adopt a more aggressive monetary policy stance. According to the CME Group FedWatch Tool, markets are now pricing in the possibility of at least one Fed rate hike in 2026. This further strengthens the USD and continues to divert flows away from non-yielding Gold.
Investors are now turning their attention to Thursday’s release of the US Personal Consumption Expenditures (PCE) Price Index and the preliminary US GDP report, both of which could significantly influence USD demand and provide fresh direction for XAU/USD. In the meantime, traders will also monitor Tuesday’s Conference Board US Consumer Sentiment Index for short-term opportunities, while keeping a close watch on developments in the Middle East that may continue to drive volatility across global financial markets. Overall, the broader fundamental backdrop suggests that the path of least resistance for Gold prices remains tilted to the downside.
Technical Analysis (H4)
From a technical standpoint, Gold remains vulnerable while trading below the key $4,580 resistance level and the 100-period EMA on the 4-hour chart. The precious metal was rejected near the $4,580 horizontal barrier on Monday, reinforcing a mildly bearish near-term outlook. Although the Moving Average Convergence Divergence (MACD) histogram remains in positive territory, price action continues to struggle beneath short-term resistance. Meanwhile, the Relative Strength Index (RSI) stays near the neutral 47 mark, indicating limited bullish momentum that is still insufficient to challenge higher resistance levels.
The $4,580 zone now acts as the first major resistance, followed by the 100-period EMA on the 4-hour chart near $4,593.73. A sustained move above this region would be required to weaken the prevailing bearish bias and pave the way for a stronger recovery. Until then, XAU/USD remains exposed to further downside pressure, with intraday traders likely focusing on previous swing lows around the $4,490–$4,485 area and the $4,450 level as the next important support zones.
USD/CHF edges higher to near 0.7830 during Tuesday’s early European trading hours.
Fresh US strikes have reduced optimism over a potential peace agreement, lending support to the US Dollar.
Despite the rebound, the pair maintains a bearish bias below the 100-day EMA, while the RSI continues to signal negative momentum.
Immediate resistance is seen at 0.7840, with the first support level located at 0.7808.
USD/CHF rebounds toward 0.7830 during Tuesday’s early European session, ending a four-day losing streak. Ongoing uncertainty over US-Iran peace talks is offering modest support to the US Dollar against the Swiss Franc.
According to reports, the US military’s Central Command stated on Monday that American forces conducted strikes in southern Iran in “self-defence.” The military added that it would continue protecting US personnel while exercising restraint amid the current ceasefire.
Investors are now focused on the US April Personal Consumption Expenditures (PCE) Price Index data, scheduled for release later on Thursday. Stronger-than-expected inflation readings could reduce expectations for Federal Reserve rate cuts and provide additional support for the Greenback in the short term.
Technical Analysis
On the daily chart, USD/CHF continues to display a bearish short-term bias, with the pair trading below the 100-day moving average (MA). The price also remains slightly beneath the 20-day Bollinger Band midpoint, highlighting ongoing upside pressure despite a mild rebound from recent lows. Meanwhile, the 14-day Relative Strength Index (RSI) stands at 48, just below the neutral 50 threshold, suggesting bearish momentum has weakened but has yet to turn bullish.
To the upside, the first resistance level is located at the 100-day MA around 0.7840. A sustained daily close above this zone would help ease near-term bearish pressure and could pave the way for a move toward the upper Bollinger Band near 0.7905.
On the downside, immediate support is seen at the May 26 low of 0.7808. Further weakness could expose the lower Bollinger Band around 0.7760. A break below this area would reinforce the broader bearish trend and increase the risk of fresh daily lows.
Kevin Warsh was officially sworn in today as the 17th Chairman of the FOMC, but persuading policymakers to support interest-rate cuts may prove challenging. The US labor market continues to show resilience — and may even be gaining momentum — while inflation remains above the Federal Reserve’s 2% objective.
Against that backdrop, the US Dollar Index could benefit from expectations of higher US interest rates. If the index breaks above near-term resistance around 99.50, it may quickly rally toward the psychologically important 100.00 level.
In relatively subdued trading ahead of the holiday weekend, Warsh formally succeeded Jerome Powell as the Fed’s new leader. As the preferred candidate of Donald Trump, Warsh is likely to face political pressure to lower borrowing costs. However, current economic conditions make a convincing argument for rate cuts difficult. The unemployment rate remains low, and the latest National Federation of Independent Business Small Business Optimism survey indicates the labor market could be strengthening further rather than slowing.
At the same time, inflation — the other pillar of the Federal Reserve’s dual mandate — is clearly moving in the wrong direction. No matter which inflation gauge is used, price growth remains above the Fed’s 2% target. Moreover, the ongoing conflict involving Iran is likely to add further upward pressure on prices in the months ahead, even if the Strait of Hormuz were to reopen immediately.
Against this backdrop, traders have begun pricing in the possibility of at least one interest-rate hike over the next year. According to the CME Group FedWatch tool, markets are currently assigning a 20% probability that the Federal Reserve could deliver two or more 25-basis-point rate increases by the end of next April.
Although Kevin Warsh is expected to be more cautious about raising interest rates than the average FOMC policymaker — largely due to the political circumstances surrounding his appointment — the broader policy outlook has become increasingly hawkish in recent months.
For now, the Federal Reserve is still expected to keep rates within the current 3.50%–3.75% range throughout the summer unless economic conditions shift unexpectedly. However, if inflation and labor-market data continue to remain strong, even the most dovish members of the committee may eventually have little choice but to support tighter monetary policy.
US Dollar Technical Outlook: DXY 4-Hour Chart
Turning our attention to the charts, higher US interest rates would be expected to support the world’s reserve currency, all else equal. The US Dollar Index (DXY) has been lagging the rally in 2-year Treasury yields (a proxy for near-term FOMC interest rate expectations) since the start of the month, hinting at the potential for a “catch-up” trade to the topside as we head toward June.
From a technical perspective, the US Dollar Index has carved out a sideways range between about 99.00 and 99.50 over the past week and a half, with a symmetrical triangle pattern forming within that zone over the course of this week. The rangebound trade has allowed the world’s reserve currency to correct its overbought condition through time, rather than an outright price correction, a bullish development that hints at another leg higher if 99.50 is eclipsed.
In that scenario, a quick rally toward the psychologically-significant 100.00 level would be the higher-probability development to watch, whereas a bearish breakdown below 99.00 would invalidate the bullish setup and point to a deeper retracement toward 98.50 next.
A potential agreement between President Donald Trump and Iran is beginning to reshape market expectations, with investors increasingly anticipating a rally in stocks, weaker oil prices, and stronger bond performance if tensions in the Middle East continue to ease.
For months, global markets have been heavily influenced by geopolitical risk. Traders feared disruptions in the Strait of Hormuz, while investors worried that surging crude oil prices would reignite inflation pressures and force central banks to maintain higher interest rates for longer.
That narrative may now be changing.
Trump recently stated that negotiations with Iran are largely complete, with discussions focused on restoring stability in the Gulf region and reopening key shipping routes. Markets quickly responded to the possibility of reduced geopolitical tension.
Brent crude prices have already started to decline as optimism surrounding the negotiations grows. Investors recognize that easing tensions could reduce the geopolitical premium embedded in oil markets. If supply concerns diminish and shipping routes normalize, energy prices would likely continue falling. Lower oil prices would, in turn, help cool inflation expectations, reduce pressure on bond yields, and improve conditions for equities.
Markets understand the broader chain reaction.
At the peak of the Iran crisis, investors were preparing for a far more severe scenario in which oil prices could surge above $120 per barrel. Such a move would have intensified global inflation, pressured consumers, hurt corporate profit margins, and complicated the outlook for central banks already navigating slowing economic growth.
A credible diplomatic breakthrough would dramatically improve that outlook.
Bond markets could become one of the biggest beneficiaries. Treasury yields have already begun drifting lower alongside softer oil prices as optimism over negotiations increases.
Lower yields would also provide support for growth-oriented sectors, particularly technology and AI-related stocks, which have struggled amid elevated financing costs and geopolitical uncertainty.
Several sectors stand to gain from falling energy prices and easing interest rates, including airlines, transportation companies, industrial firms, consumer discretionary businesses, and rate-sensitive technology stocks.
Emerging markets could also recover strongly. Many developing economies faced pressure from higher energy import costs and a stronger U.S. dollar during the recent period of instability. Reduced geopolitical stress could help reverse some of those pressures.
At the same time, the U.S. dollar may weaken somewhat as safe-haven demand declines and investor confidence improves.
Still, volatility is unlikely to disappear completely.
Negotiations with Iran have failed before, and political resistance within Washington remains significant. Regional tensions also remain elevated, while critical issues such as sanctions relief, nuclear commitments, and enforcement mechanisms still need to be resolved.
Markets are well aware that geopolitical agreements can unravel quickly.
However, investors trade on probabilities rather than certainty. Right now, markets are increasingly pricing in a scenario where one of the largest geopolitical risks facing the global economy begins to ease instead of escalate.
If Trump ultimately secures a workable agreement with Iran, the impact across global asset classes could be substantial: higher equities, lower oil prices, and stronger bond markets.
After months dominated by fears of energy shocks and renewed inflation pressure, investors may finally be seeing a path toward relief.
US financial markets will remain closed on Monday in observance of Memorial Day, leaving investors with a shortened trading week and a relatively light economic calendar. Attention will center on Thursday’s release of the second estimate for Q1 2026 GDP, alongside April’s core PCE data — the Federal Reserve’s preferred measure of inflation.
Throughout the week, eight Federal Reserve officials are scheduled to speak. With limited new economic data available to shape expectations around the FOMC’s policy direction, investors will closely analyze their remarks for any hawkish signals. Markets are currently pricing in a 62.5% probability of a rate hike by December, up from 50% just one week earlier, though some analysts believe tightening could arrive as soon as July.
Another key uncertainty remains President Donald Trump’s recently announced “likely negotiated” peace agreement. On Saturday, Trump stated that the arrangement would reopen the Strait of Hormuz. Iran’s foreign ministry noted that the proposed framework currently consists of a memorandum of understanding as an initial step, with broader negotiations expected within the next 30 to 60 days. However, substantial differences between the two sides still persist.
Meanwhile, global bond yields retreated from recent highs but continued to trade at elevated levels. The yield on the US 10-year Treasury declined to 4.56% after peaking at 4.69%, while the UK 10-year gilt yield eased to 4.90% from 5.19%.
GDP
Thursday’s second estimate of Q1 2026 GDP is expected to remain close to the preliminary 2.0% growth reading. Meanwhile, the Atlanta Fed’s GDPNow model is already projecting Q2 growth at 4.3%, supported largely by a sharp increase in business equipment investment.
Core PCED
April’s core PCED — the Federal Reserve’s preferred measure of inflation — will also be released on Thursday. The index rose 3.2% year-over-year in March, accelerating from 3.0% in February, while headline inflation reached 3.5%. With both the latest CPI and PPI figures coming in stronger than expected, markets are increasingly concerned about another upside inflation surprise, which could reinforce expectations for an additional Fed rate hike.
Consumer Confidence
The May Consumer Confidence Index, due Tuesday, is expected to edge higher from April’s reading of 92.8. Market attention will mainly center on the survey’s labor market components, which are anticipated to show modest improvement.
Unemployment
Initial jobless claims, scheduled for release on Thursday, previously came in at 209,000, while the four-week moving average stood at 202,500. Continuing claims were reported at 1.782 million, with the corresponding four-week average at 1.778 million. Overall, the data continues to point toward gradual improvement in labor market conditions.
Regional Business Surveys
This week’s regional Federal Reserve manufacturing surveys will include the Dallas Fed survey on Tuesday and the Richmond Fed survey on Wednesday. Both the national ISM Manufacturing PMI and the average readings from the five regional Fed surveys have shown improvement in recent months, signaling that the manufacturing recovery is becoming increasingly broad-based.
The regional prices-paid average has risen again to 54.9, while the Producer Price Index (PPI) for final demand is already increasing at an annual rate of 6.0%, highlighting persistent inflationary pressures across the production pipeline.
The US Dollar Index (DXY) is trading near the lower end of last week’s range at around 99.00.
Optimism surrounding a potential peace agreement with Iran is reducing demand for the safe-haven Greenback.
However, expectations of further Federal Reserve tightening are helping limit the USD’s downside pressure.
The US Dollar (USD) opened Monday’s session with a bearish gap, slipping from the 99.30 region — the bottom of last week’s trading range — toward 99.00. Although the US Dollar Index (DXY) remains supported above previous highs, improving sentiment over a possible US-Iran peace agreement and the potential reopening of the Strait of Hormuz are weakening demand for the safe-haven Greenback.
Investor confidence improved after US President Donald Trump suggested that a deal with Tehran may be near, encouraging a moderate risk-on mood in markets. However, Trump maintained a cautious stance, saying he had advised negotiators “not to rush into a deal” and warning that the US would continue blocking the Strait of Hormuz until an agreement is finalized.
Earlier in the day, US Secretary of State Marco Rubio stated that a “fairly strong proposal” to reopen Hormuz is currently under discussion, adding that diplomacy would be fully explored before alternative measures are considered.
Market activity is expected to remain subdued on Monday due to the US Memorial Day holiday closure. Investors are now turning their attention to Thursday’s release of the US Personal Consumption Expenditures (PCE) Price Index, a key inflation gauge closely watched by the Federal Reserve.
Recent US economic data has reinforced confidence in the resilience of the American economy. Combined with persistent inflation pressures, this has strengthened expectations that the Federal Reserve may need to keep interest rates elevated for longer. According to the CME FedWatch Tool, markets are now pricing in more than a 50% probability of another Fed rate hike this year, a factor that could continue limiting downside pressure on the US Dollar.
Hyperliquid remained above $60 on Monday after surging 7% a day earlier and reaching a fresh all-time high of $64.48. Institutional appetite for the DEX token continues to strengthen, with inflows climbing to $72 million last week. Ongoing buybacks and resilient retail interest are also helping sustain the rally and support further price discovery.
Hyperliquid (HYPE) reached a new all-time high on Monday, supported by strong buying interest from both institutional and retail investors in the decentralized exchange (DEX) sector. The token’s revenue-based buyback mechanism is also helping sustain momentum as HYPE enters price discovery territory. From a technical perspective, the trend remains bullish, with analysts eyeing a possible move toward $80.
Several positive catalysts continue to support HYPE’s upward momentum.
Despite broader market volatility, Hyperliquid’s growth has been fueled by its evolution into an all-in-one exchange platform that provides access to cryptocurrencies, real-world commodities, and prediction markets.
Recent data also shows that HYPE-related ETFs launched by 21Shares and Bitwise attracted $72.38 million in inflows last week, following $2.52 million the week before. Rising institutional participation often strengthens retail interest and can contribute to higher spot prices.
Data from CoinGlass points to increasing retail participation, as HYPE futures Open Interest (OI) climbed to a record $2.95 billion on Monday. This suggests traders are building larger positions, pushing the total notional value of outstanding contracts to new highs.
Meanwhile, Hyperliquid continues to support token demand through its aggressive buyback model. The platform allocates around 97% to 99% of trading fee revenue toward repurchasing HYPE tokens, which are then stored in its assistance fund. According to Hyperscreener data, approximately 210,000 HYPE tokens were bought back last week alone, effectively reducing circulating supply.
The assistance fund currently holds 44.52 million HYPE tokens, including a cumulative total of 26.81 million tokens acquired through buybacks.
Will Hyperliquid reach $80?
HYPE is currently trading at a new all-time high and remains in a strong bullish trend. The token is holding well above its key Exponential Moving Averages (EMAs), including the 50-day EMA at $45.07, the 100-day EMA at $40.98, and the 200-day EMA at $37.87. It also broke convincingly above the previous swing high of $59.45 after gaining 7% on Sunday, reinforcing bullish momentum.
Technical indicators continue to favor further upside:
The Relative Strength Index (RSI) is around 75 on the daily chart, signaling overbought conditions. While this can increase the chance of short-term pullbacks, it also reflects strong buying pressure.
The Moving Average Convergence Divergence (MACD) indicator remains positive, with the MACD and signal lines continuing higher, suggesting momentum is still firmly bullish in the near term.
Based on Fibonacci extension analysis, the next major resistance zones are:
127.2% extension near $70.04
161.8% extension near $83.51
That places the $80 level within the projected bullish range if momentum and buying activity continue. However, because RSI is already elevated, traders may still see periods of consolidation or profit-taking before another leg higher.
On the downside, the former resistance level at $59.45 has now turned into the nearest support zone and could act as the first layer of defense against selling pressure. Below that, the psychologically important $50.00 level may provide stronger support if the market experiences a deeper correction or extended pullback for Hyperliquid.
NZD/USD has been highly volatile throughout the week, and that remains the key theme. The pair appears to have support around the 0.58 level, while resistance is likely near 0.5950.
Overall, this market is likely to remain very choppy. However, with interest rates easing slightly toward the end of the week, the New Zealand dollar could gain some momentum and stage a rebound. On the other hand, if the pair falls below the 0.58 level, it may trigger an additional 100-point decline.
AUD/USD
AUD/USD has also seen a great deal of volatility, with the pair currently hovering around the 0.7150 level. This zone previously acted as resistance and should now provide support. If the pair breaks above this week’s candlestick high, it could pave the way for a move toward the 0.7275 level.
However, a break below the candlestick low could open the door for a decline toward the 0.70 level. It’s worth noting that the Australian dollar continues to outperform many other currencies against the US dollar. As a result, buying on pullbacks may still be the preferred strategy, although market conditions are likely to stay highly choppy.
Gold
The Gold market was also highly volatile this week. With U.S. interest rates remaining relatively elevated, it has become challenging for gold to maintain upward momentum. Overall, the market is likely to keep a close eye on the $4,600 level, as a breakout above that area could pave the way for a move toward $4,800.
On the downside, if price falls below the weekly candlestick low, it could trigger a decline toward the $4,300 level. Broadly speaking, gold continues to be heavily influenced by interest rate expectations — when U.S. rates rise, gold tends to weaken.
USD/CAD
The US dollar has been climbing against the Canadian dollar throughout the week, and that trend is likely to continue. A push toward the 1.39 level seems possible, although the move may remain uneven and volatile along the way.
USD/CAD is typically a range-bound market, so periods of choppy price action would not be unusual. Traders should keep an eye on US interest rates, as further increases could provide additional strength for the pair. Meanwhile, Canada’s economy continues to show signs of weakness, which currently supports a stronger US dollar in this environment.
Bitcoin
Bitcoin ended the week slightly lower, but strong support still appears to be in place beneath current levels. The broader recovery trend remains intact, and the market could eventually rebound toward the $84,000 region. Despite recent geopolitical tensions and the outbreak of war, Bitcoin has shown notable resilience, which is a positive sign for bulls.
Price action is expected to remain volatile and noisy, so patience may be necessary. Another important factor is the continued inflow of institutional money into Bitcoin ETFs, as sustained investment demand could help support prices over time.
USD/MXN
The US dollar moved erratically against the Mexican peso throughout the week, hovering near the 17.33 area. Resistance is seen around 17.50, while the 17.00 level continues to provide support.
This pair is likely to remain highly volatile, with interest rate expectations continuing to influence sentiment. Since Mexico still offers significantly higher interest rates than the United States, traders may continue favoring strategies that involve selling USD/MXN rallies, especially when bearish reversal signals appear on shorter timeframes.
EUR/USD
The euro posted modest losses during the week and tested the 50-week EMA, although overall trading conditions remain choppy. Interest rate differentials between Europe and the US continue to dominate market sentiment, while the 1.16 level appears to be acting as a key price magnet.
The pair is drifting closer to the lower boundary of its broader consolidation range, which could open the door for a move toward 1.14. Ongoing concerns surrounding Europe’s energy situation may add downside pressure. On the other hand, if momentum improves, EUR/USD could attempt another rally toward the 1.1750 region.
NASDAQ 100
The Nasdaq 100 continued attracting buyers on pullbacks, reinforcing the market’s strong bullish momentum. Investors increasingly appear focused on the possibility of the index reaching the 30,000 level, especially as enthusiasm surrounding artificial intelligence continues to drive technology stocks higher during earnings season.
For now, buying dips remains the dominant strategy. Rising interest rates could eventually create headwinds for equities, but the Nasdaq 100 has so far shown an ability to overlook many macroeconomic concerns. At the current pace, a move toward 30,000 seems increasingly realistic.
Bitcoin has retreated from $82K to $76K over the past two weeks, not in the form of a sharp capitulation event, but through a gradual and persistent decline. At the same time, both ETF inflows and derivatives leverage have begun to weaken in tandem, prompting a key question: where is capital rotating next? This report tracks the outflows, explores the underlying catalysts, and analyzes the technical outlook for BTC’s next potential move.
Current Market Position
Bitcoin recently fell toward the $76K region, marking an approximate 7.5% decline from the early-May local peak near $82K. The market has now posted five consecutive daily red candles, reinforcing the impression of a slow but steady deterioration in price action rather than panic-driven selling.
Meanwhile, the Fear & Greed Index stood at 40 on May 20, hovering at the threshold between neutral sentiment and fear. While the market has not yet entered extreme fear territory, investor confidence is clearly softening as downside momentum continues to build.
The clearest warning sign this week emerged from ETF flows:
On May 18, U.S. spot Bitcoin ETFs posted $649 million in net outflows, marking the third-largest single-day withdrawal of 2026. Over the May 11–15 trading week, cumulative outflows surpassed $1 billion, representing the largest weekly capital exodus since February.
Meanwhile, spot Ethereum ETFs continued to weaken as well, extending their streak of net outflows to six consecutive trading sessions.
Where Is the Capital Rotating?
The most likely destination is equities. On May 14, the S&P 500 climbed above 7,500 for the first time, while the Dow Jones Industrial Average surpassed the 50,000 mark, fueled largely by strong megacap technology earnings. Roughly 84% of S&P 500 companies exceeded Q1 earnings expectations, reinforcing investor appetite for traditional risk assets.
At the same time, hotter-than-expected U.S. inflation data — with CPI at 3.8% and PPI at 6% — forced markets to reassess the likelihood of near-term Federal Reserve rate cuts. The shift in expectations contributed to broader risk-off positioning across crypto markets.
In derivatives, Bitcoin open interest remains elevated at roughly $56.5 billion. The sharp decline between May 13–14 triggered a wave of long liquidations, with additional leverage flushes continuing through May 18–19. While some excess positioning has already been cleared, persistently high open interest suggests the deleveraging process may not be over yet.
Bitcoin perpetual funding rates have remained negative since early March, marking the longest sustained period of negative funding since 2023. This indicates that short positions have dominated the market for months, with bearish traders consistently paying funding fees to maintain exposure.
At the same time, repeated waves of long liquidations have continued to erode buy-side confidence. When combined with persistent ETF outflows, the picture becomes increasingly clear: both on-chain liquidity and off-chain institutional capital are weakening simultaneously.
That said, not all negative funding should be interpreted as outright bearish speculation. A significant portion likely reflects institutional hedging activity, including hedge fund redemptions, MicroStrategy arbitrage structures, and mining firms hedging exposure while pivoting toward AI infrastructure strategies. Still, the more crowded short positioning becomes, the greater the probability of a sharp and aggressive short-covering unwind once market sentiment reverses.
What Is Driving the Decline?
Bitcoin’s recent weakness is not being caused by a single catalyst, but rather by the convergence of several reinforcing forces acting simultaneously across macro, institutional, and derivatives markets.
ETF outflows remain the dominant driver behind the current decline. More than $1 billion exited spot Bitcoin ETFs during mid-May, including a massive $649 million single-day withdrawal, signaling that institutional de-risking is accelerating. A large portion of ETF holders are now sitting below their average entry prices, increasing the risk of additional redemption pressure if sentiment continues to weaken.
Geopolitical uncertainty is another major overhang. President Donald Trump’s May 18 reversal on potential Iran strike rhetoric has kept binary geopolitical risk elevated, weighing broadly on global risk assets, including cryptocurrencies.
Structural pressure from miners is also intensifying. Bitcoin mining difficulty has declined 10.7% year-to-date following six consecutive negative difficulty adjustments. Publicly listed mining companies collectively sold a record 32,000 BTC during Q1 — exceeding their total sales throughout all of 2025. At the same time, many miners are redirecting capital toward AI infrastructure initiatives, creating additional incentives to liquidate holdings. The estimated production-cost zone for next-generation S21 miners, roughly between $69K and $74K, is increasingly viewed as a critical physical support range. A sustained move below that band would likely trigger further difficulty reductions and eventually relieve some sell-side pressure.
From a cycle perspective, bears still have a strong macro argument. The historical halving-to-cycle-top structure appears intact once again: the April 2024 halving was followed by a peak near $126K in October 2025, roughly 18 months later. However, the current maximum drawdown of approximately 52% remains relatively shallow compared with previous bear-market declines of 77%–87%, leading cycle-focused analysts to argue that the true capitulation phase may not have occurred yet.
On-chain data, however, continues to provide the clearest bullish counterargument. Whale wallets holding more than 1,000 BTC accumulated approximately 270,000 BTC over a 30-day period through late April, marking the largest monthly accumulation since 2013. Meanwhile, exchange reserves have fallen to a seven-year low near 2.2 million BTC, suggesting long-term holders are aggressively absorbing the supply being sold by leveraged traders and weaker hands.
Key Levels to Watch
Rather than assigning fixed probabilities to bullish or bearish outcomes, a more practical framework is to focus on the technical levels that will determine how this correction ultimately resolves.
Looking Higher: The $82K–$85K Resistance Zone
The 200-day moving average is currently positioned around the $82K–$82.5K range. Last week, Bitcoin climbed to roughly $82.4K before facing an immediate rejection, reinforcing the 200 DMA as a key resistance level.
Further strengthening this resistance is an unfilled CME futures gap from early February, which extends between approximately $80K and $85K. Although last week’s rally toward $82K managed to partially close the gap, a full fill would require sustained bullish momentum through an area where the 200 DMA aligns with significant overhead supply.
Bitcoin needs to break back above $84K and maintain support there to validate a meaningful trend reversal. Until that happens, any upward move below that level is likely to be viewed as a sell-the-rally opportunity.
Looking Down: Two Key Support Zones Before a Deeper Breakdown
If current levels fail to hold, the first major area of support comes from the weekly Bollinger Band lower boundary, which is currently near $71K. A move into this zone would imply roughly a 7% drop from current prices and would coincide with the S21 miner shutdown range of $69K–$74K, where mining difficulty adjustments could begin easing sell-side pressure.
Beneath that lies the 200-week moving average (200 WMA), estimated around $63K–$65K, which remains a critical long-term structural support level. A revisit of this area would create a textbook H1 2026 double-bottom formation alongside February’s $59.9K low.
If Bitcoin loses the $71K support region, the next significant floor sits at the 200 WMA between $63K and $65K. Holding that zone would strengthen the double-bottom thesis and could pave the way for the next major upward move. However, a decisive break below it would signal a far more bearish downside scenario.
EUR/USD stays under pressure for a second consecutive session, hovering near 1.1610 during Asian trading hours. The pair weakens as the US Dollar holds firm amid growing expectations of a hawkish Federal Reserve stance. Meanwhile, extended energy supply disruptions caused by the ongoing conflict risk fueling US core inflation and consumer price expectations, potentially encouraging the Fed to maintain higher interest rates for longer.
Technical Analysis
On the five-minute chart, EUR/USD is trading at 1.1621, maintaining a slightly bearish intraday tone as it stays just below the daily opening level of 1.1626. This suggests that upside momentum remains limited while the market continues to absorb earlier selling activity. Meanwhile, the Stochastic RSI has rebounded from oversold conditions into the mid-30 range, indicating that bearish pressure is easing somewhat, although there is still no clear sign of a strong bullish reversal.
To the upside, the first resistance level appears near the daily open at 1.1626. A sustained move above this area would be required to improve the short-term outlook. With no significant nearby support levels visible in the provided data, traders may continue viewing minor pullbacks as vulnerable as long as the pair trades below the daily open. Current momentum indicators point more toward a limited corrective recovery rather than the start of a broader trend reversal.
On the daily chart, EUR/USD is trading around 1.1619 and retains a bearish near-term outlook, as price action remains below the 50-day Exponential Moving Average (EMA) at 1.1683 while hovering just above the 200-day EMA at 1.1618. This setup implies that rallies toward the 1.1680 region could continue to attract selling interest. At the same time, the Stochastic RSI has fallen deeply into oversold territory near 11, signaling that downside momentum may be becoming overstretched in the short term.
On the upside, the 50-day EMA around 1.1683 serves as the key resistance level, and continued trading beneath it would keep bearish pressure intact. On the downside, the 200-day EMA at 1.1618 acts as immediate support. A decisive daily close below this level could trigger another leg lower, whereas maintaining support above it may allow for a corrective rebound within the broader bearish structure.
Fundamental Analysis
A stronger outlook for the US economy is reinforcing expectations for tighter monetary policy and providing additional support for the US Dollar.
Federal Reserve officials remain cautious as they assess the future path of short-term interest rates. Although policymakers are currently keeping the federal funds rate unchanged, they are gradually stepping away from expectations of rate cuts and showing greater willingness to consider further rate hikes should inflation remain persistent.
Meanwhile, the administration of US President Donald Trump announced that Trump will officially swear in Kevin Warsh as Chair of the US Federal Reserve on Friday at the White House. Warsh replaces Jerome Powell, whose term expired Friday but who remained in the role temporarily during the transition period.
On the economic front, data from the US Department of Labor showed that Initial Jobless Claims declined by 3,000 to 209,000 in the second week of May, highlighting continued strength in the labor market. However, Continuing Jobless Claims edged higher to 1.782 million for the week ending May 9, compared with 1.776 million in the prior week.
The Euro weakened against the US Dollar after traders responded to an unexpected contraction in the Eurozone economy. Preliminary S&P Global PMI data released Thursday showed that business activity across the Euro Area contracted in May at the fastest pace since late 2023. The downturn was largely attributed to a conflict-driven rise in living costs, which weighed on services demand and pushed input price inflation to its highest level in three years.
Attention now turns to upcoming German economic releases, including the June GfK Consumer Confidence Survey, first-quarter GDP figures, and the IFO Business Climate Survey.
Private market investments have attracted significantly larger allocations from institutional portfolios and, increasingly, private wealth strategies over the past decade.
The traditional argument is straightforward: investors are compensated with an illiquidity premium for locking capital into assets that cannot be easily traded. In theory, this limitation becomes an advantage, allowing investors to earn higher returns in exchange for reduced liquidity.
However, that explanation may no longer capture the full picture. What if illiquidity and infrequent pricing are not merely drawbacks investors tolerate for additional return, but features they actively prefer? In that case, the appeal of private markets may stem not only from higher expected returns, but also from a smoother, psychologically more comfortable investment experience. Rather than receiving an illiquidity premium, investors may effectively be accepting an illiquidity discount.
Viewed this way, investors may not simply be compensated for illiquidity—they may also be paying, implicitly, for reduced visible volatility.
Private markets do not eliminate risk. The underlying businesses remain exposed to many of the same economic forces that affect comparable public companies. The appearance of smoother returns often reflects stale or infrequent pricing rather than superior management or investment skill. The key difference lies in how and when prices are discovered. Because private asset valuations rely heavily on appraisals and model-based estimates instead of continuous market trading, reported returns tend to look far less volatile than those of publicly traded equities.
This distinction is critical: smoother reported performance does not necessarily imply lower economic risk or genuinely uncorrelated returns.
Investor behaviour also changes when volatility is highly visible. Constant price movements in public markets can encourage overtrading, emotional decision-making, and poorly timed reactions, especially during periods of panic or euphoria. In contrast, infrequent valuation updates can reduce the temptation to respond to short-term noise instead of focusing on long-term fundamentals.
This dynamic may help explain why fees in private markets remain high despite increasing scale and competition. Investors may not simply be paying for access to illiquid assets, but for an investment experience that appears steadier and less volatile over time.
A useful comparison can be made between publicly traded companies such as Microsoft or Google, where prices adjust continuously in response to market sentiment, and private companies such as OpenAI or Anthropic, where valuations are updated far less frequently. The latter may appear to exhibit smoother value creation, even though the underlying risks and business dynamics remain just as complex and fast-moving.
Ultimately, private markets may represent more than simple compensation for illiquidity. They may instead embody a broader trade-off, where investors give up liquidity and price transparency in exchange for a smoother return profile and a more psychologically manageable investment journey through periods of risk and uncertainty.
WTI remains under modest selling pressure for the third consecutive day, albeit without strong bearish momentum.
Uncertainty surrounding a possible US-Iran peace agreement continues to offer support to the black liquid.
Meanwhile, the technical backdrop suggests caution before placing aggressive bullish bets or anticipating a sustained upside move.
West Texas Intermediate (WTI), the US benchmark for Crude Oil, extends its decline for a third straight session and trades around the mid-$96.00s during Friday’s Asian session. Despite the weakness, prices remain above Thursday’s nearly two-week low near the key $95.00 psychological level.
A senior Iranian official stated that no agreement has yet been finalized with the United States, although negotiations have reportedly narrowed existing gaps. Even so, market participants remain doubtful about the prospects of a US-Iran peace deal due to persistent disputes over Tehran’s nuclear ambitions and tensions surrounding the strategic Strait of Hormuz. The ongoing geopolitical uncertainty continues to lend support to Crude Oil prices and limits the scope for aggressive bearish positioning.
From a technical standpoint, the black liquid continues to trade above a significant support zone despite fading momentum, hovering near the 38.2% Fibonacci retracement of the April rally. Additional support comes from the 200-period Simple Moving Average (SMA) around $95.09 and an ascending trend-line near $95.49, both of which continue to reinforce the broader bullish structure.
Nevertheless, bearish signals are gradually strengthening. The Relative Strength Index (RSI) remains close to 36, while the Moving Average Convergence Divergence (MACD) stays in negative territory, indicating increasing downside pressure. As a result, recovery attempts could remain limited unless buyers reclaim the nearby resistance at the 23.6% Fibonacci retracement around $100.42. A sustained move above that level would be required to revive bullish momentum and target recent highs again.
On the downside, initial support is seen near the 38.2% Fibonacci retracement at $96.32, followed by the trend-line support around $95.49 and the 200-period SMA near $95.09. A decisive break below this support cluster could accelerate losses toward the next Fibonacci levels at $93.00 and $89.69, potentially shifting the medium-term outlook firmly in favor of sellers.
Gold comes under renewed selling pressure as geopolitical tensions and hawkish Fed expectations continue to support the US Dollar.
Iran’s uranium enrichment program and control over the Strait of Hormuz remain major obstacles in negotiations.
The technical outlook also favors the bears, reinforcing the likelihood of additional downside pressure.
Gold (XAU/USD) faces renewed selling pressure after Thursday’s volatile price action, although it continues to hold above the key $4,500 psychological level during Friday’s Asian session. The US Dollar (USD) stays near a six-week high reached earlier this week, supported by growing expectations that the Federal Reserve will maintain a hawkish stance. In addition, uncertainty surrounding a possible US-Iran peace agreement boosts demand for the Greenback’s safe-haven appeal, weighing on the precious metal.
Markets have now fully ruled out any Fed rate cuts for the rest of 2026 and are increasingly pricing in at least one rate hike before year-end amid concerns over rising energy costs and persistent inflation. Minutes from the April 28–29 FOMC meeting showed policymakers leaning toward keeping interest rates elevated — or even tightening further — if inflation remains above the Fed’s 2% target. According to the CME Group FedWatch Tool, traders currently see more than a 60% probability of a 25-basis-point rate increase in December. This outlook has fueled a recent rise in US Treasury yields, strengthening the USD and reducing the appeal of non-yielding assets like Gold.
Meanwhile, a senior Iranian official stated that although no agreement has been finalized with the US, differences between both sides have narrowed. However, Iran’s uranium enrichment program and control over the strategically important Strait of Hormuz remain major obstacles in negotiations.
Marco Rubio warned that Iran’s proposal to impose tolls on vessels passing through the Strait could effectively undermine prospects for a peace deal. US President Donald Trump also reiterated that Washington opposes any toll system in the Strait of Hormuz and stated that the US military would move to secure Iran’s highly enriched uranium stockpile. These geopolitical risks continue to support the USD, reinforcing the broader bearish outlook for Gold.
AUD/USD could climb toward the nine-day EMA at 0.7164.
The 14-day RSI, hovering near 48, suggests the recent decline is entering a consolidation phase with no clear dominance from either buyers or sellers.
On the downside, immediate support is seen at the 50-day EMA around 0.7115.
AUD/USD extends its decline after posting modest losses in the previous session, trading near 0.7140 during Friday’s Asian session. Technical analysis on the daily chart shows the pair continuing to trade within a developing descending wedge pattern, pointing to two possible outcomes depending on how price behaves around the formation’s boundaries.
A clear breakout above the wedge’s descending resistance line would indicate renewed bullish momentum and raise the prospect of a trend reversal to the upside. However, as the pattern is still forming, failure to overcome the upper boundary could keep the pair trapped in a period of choppy, downward consolidation until a decisive breakout emerges.
The pair remains supported above the 50-day Exponential Moving Average (EMA) while facing resistance from the nine-day EMA. Combined with the 14-day Relative Strength Index (RSI), which is hovering around the neutral 48 level, the setup reflects a consolidative bias with limited momentum from either buyers or sellers following the recent retreat.
On the upside, AUD/USD could test initial resistance at the nine-day EMA near 0.7164, followed by the upper edge of the descending wedge around 0.7200. A successful breakout above that region may open the door for a move toward 0.7277 — the highest level since June 2022, reached on May 6.
To the downside, immediate support is located at the 50-day EMA around 0.7115, with additional support near the wedge’s lower boundary at 0.7080. A sustained move below this area could intensify bearish pressure and expose the pair to a deeper decline toward the four-month low of 0.6833 recorded on March 30.
WTI pauses after the previous day’s steep decline as traders weigh conflicting signals surrounding a possible US-Iran peace agreement. Trump pointed to progress in negotiations with Iran, though he also warned that military action remains possible if talks fail. Meanwhile, declining US crude inventories driven by solid demand continue to lend support to oil prices.
West Texas Intermediate (WTI), the US crude oil benchmark, stabilized after plunging nearly 5% in the previous session as traders assessed conflicting signals surrounding a possible US-Iran peace agreement. The commodity hovered near $98.30 on Thursday, little changed on the day, with markets closely monitoring developments in the Middle East.
US President Donald Trump said the US was in the “final stages” of negotiations with Iran, raising hopes for easing tensions. US Vice President JD Vance also expressed optimism, noting that Iran appeared willing to reach an agreement. The comments initially pressured crude prices lower overnight, though losses were capped after Trump warned that further military action remained possible if talks collapsed.
Iran responded by condemning Trump’s warning and cautioned that any renewed US or Israeli strikes could significantly intensify the conflict. Investors also remain doubtful that a peace deal can be achieved soon due to deep disagreements over Tehran’s nuclear program and ongoing tensions surrounding the Strait of Hormuz. Iran has reportedly introduced a new “Persian Gulf Strait Authority” aimed at overseeing traffic through the vital shipping route.
These geopolitical concerns continue to support oil prices and help prevent a deeper sell-off. Additional support came from the latest Energy Information Administration data, which showed declines in US crude and gasoline inventories last week amid resilient demand. As a result, traders may wait for stronger follow-through selling before concluding that crude prices have formed a near-term top.
Silver extends its rebound for a second straight session on Thursday as follow-through buying interest remains intact.
The intraday technical picture continues to support bullish momentum and points to the potential for further upside.
However, a decisive break above the key $76.75 confluence resistance is required to confirm the bullish outlook.
Silver (XAG/USD) is extending Wednesday’s rebound from the nearly two-week low around the $73.00 area, advancing for a second consecutive session on Thursday. During Asian trading hours, the precious metal moved back above the mid-$76.00 region, although it still trades below Tuesday’s weekly peak.
From a technical standpoint, XAG/USD is testing a key resistance zone near $76.75, where the 100-hour Simple Moving Average (SMA) aligns with the 23.6% Fibonacci retracement of the recent decline from the monthly high. A sustained break above this confluence area could provide a fresh bullish catalyst and support additional near-term upside momentum.
Short-term indicators suggest bearish pressure is fading rather than strengthening. The Relative Strength Index (RSI) is hovering near 57, while the Moving Average Convergence Divergence (MACD) remains slightly in positive territory. As a result, a decisive move above the $76.75 barrier may open the door toward the 38.2% Fibonacci retracement at $79.21, followed by the 50% retracement level near $81.14.
On the downside, strong support is located around $72.97, which marks both the recent cycle low and a major Fibonacci anchor. Buyers are likely to re-emerge more aggressively in that region if the corrective decline resumes.
The US Dollar Index remained largely steady as investors balanced optimism over US-Iran peace negotiations with rising tensions around the Strait of Hormuz. President Trump stated that talks between Washington and Tehran are entering their final phase, while the latest FOMC Minutes revealed that most Fed officials signaled the possibility of further rate hikes if inflation remains above the 2% target.
The US Dollar Index (DXY), which tracks the Greenback against a basket of six major currencies, traded little changed around 99.10 during Thursday’s Asian session after posting modest losses in the previous session.
The US Dollar remained supported as investors weighed the economic impact of ongoing US-Iran peace negotiations against escalating tensions surrounding the strategically vital Strait of Hormuz shipping route.
According to a Bloomberg report on Wednesday, President Donald Trump said negotiations with Iran are approaching their final stage, while also warning that military action could resume within days if Tehran refuses US demands. Iranian President Masoud Pezeshkian responded by rejecting any notion of surrender, stating on X that attempts to force capitulation through pressure were merely an illusion.
Meanwhile, the minutes from the Federal Open Market Committee’s April meeting revealed a hawkish stance among Federal Reserve officials. Most policymakers indicated that further interest rate hikes could be necessary if inflation remains persistently above the Fed’s 2% target, with concerns growing over inflationary risks linked to the Iran conflict.
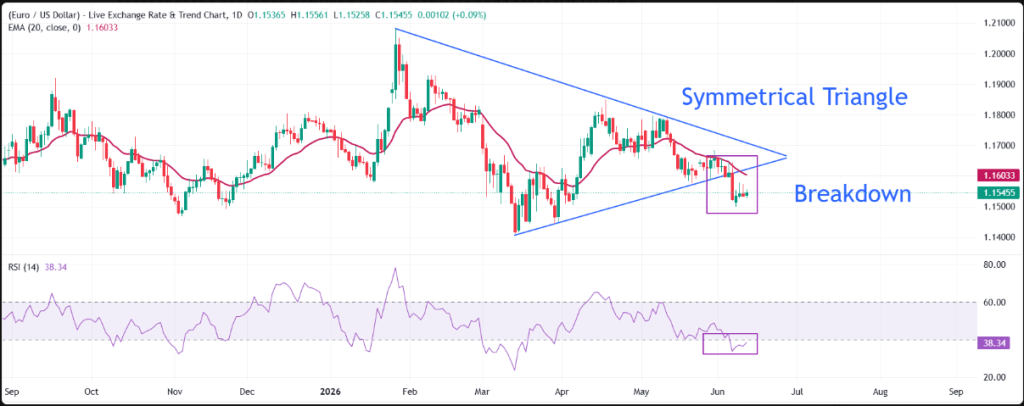

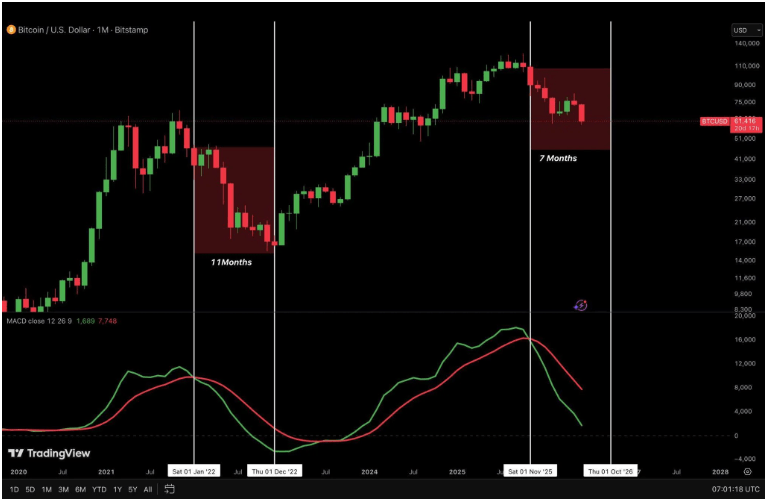


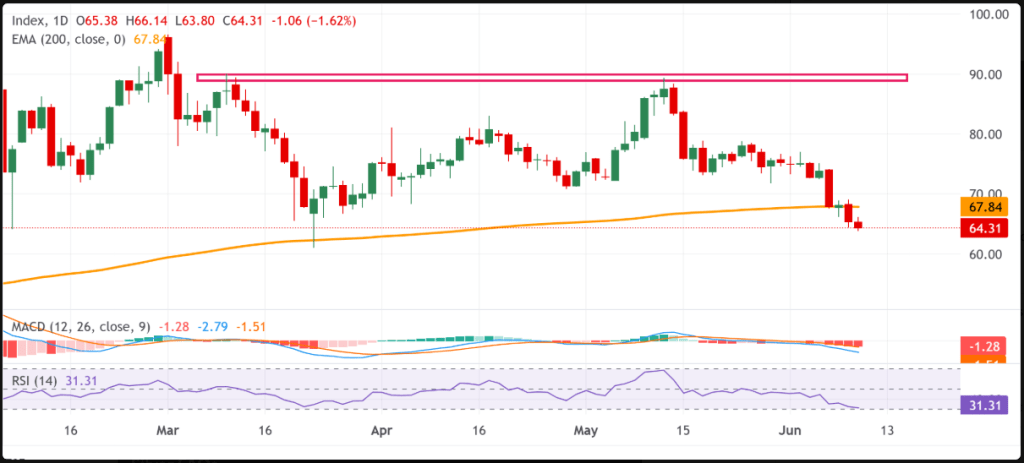
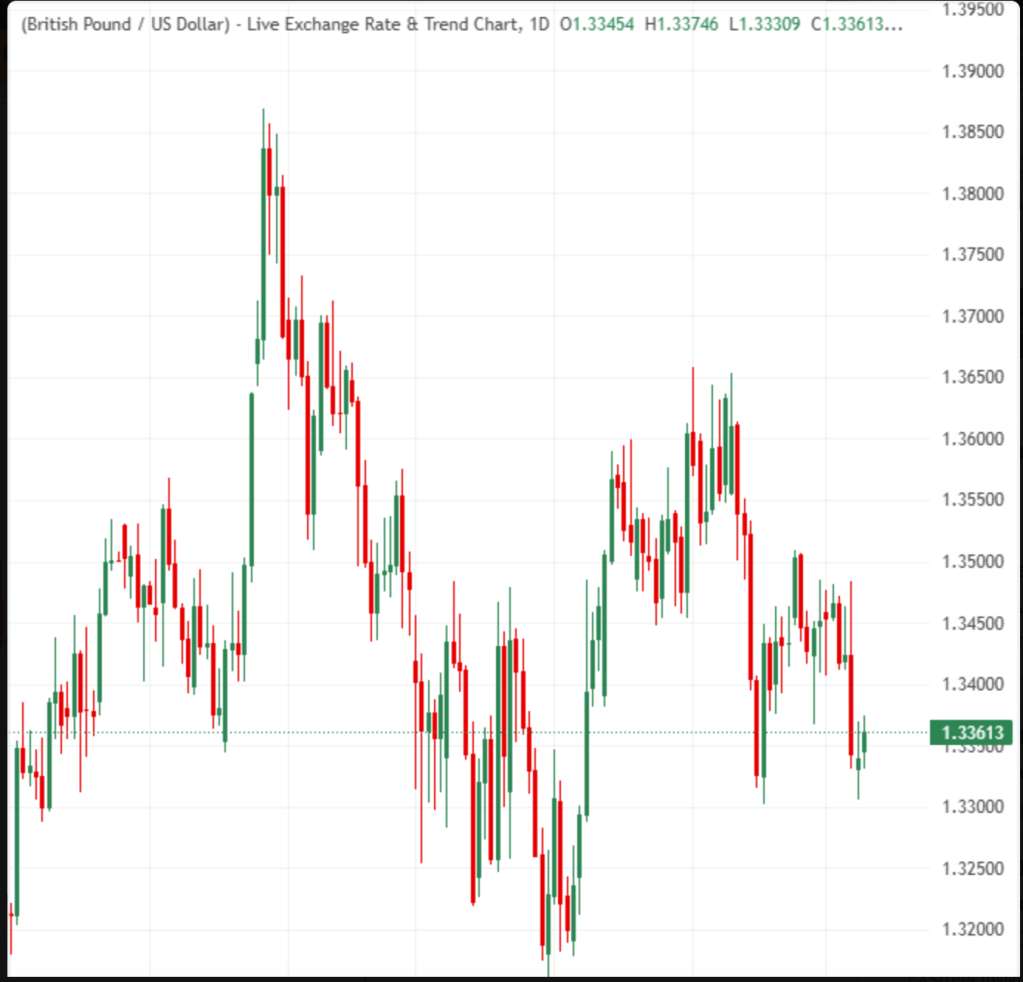
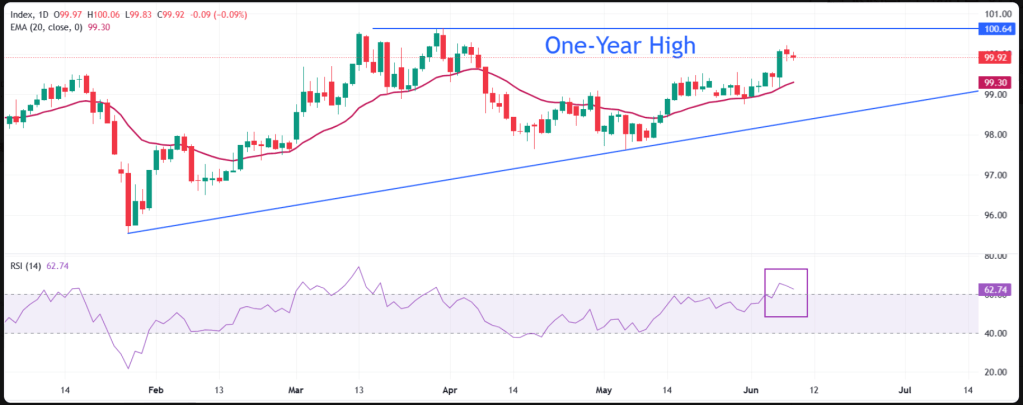


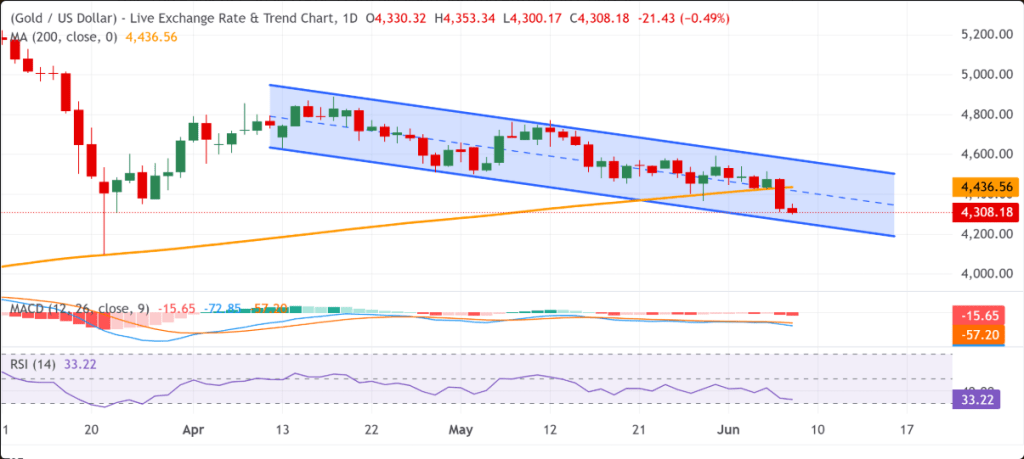


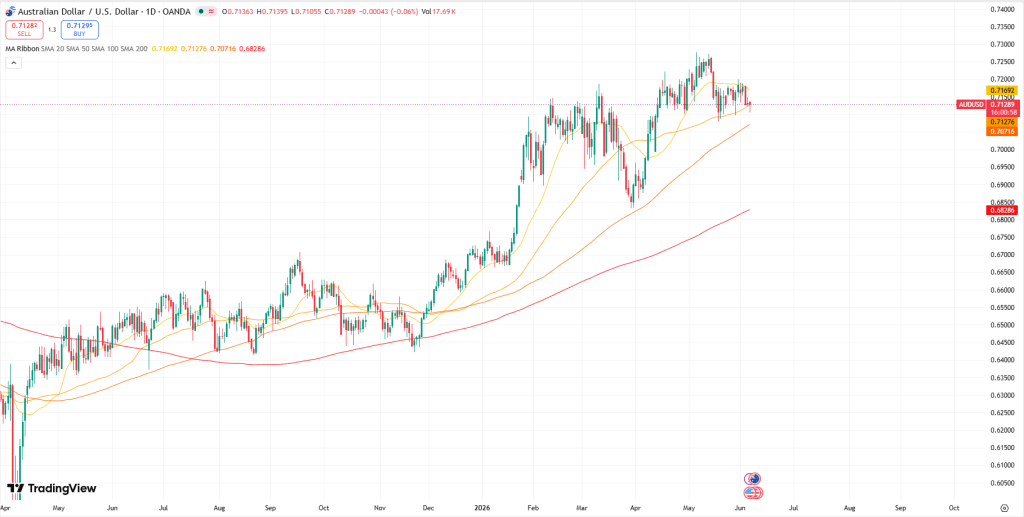
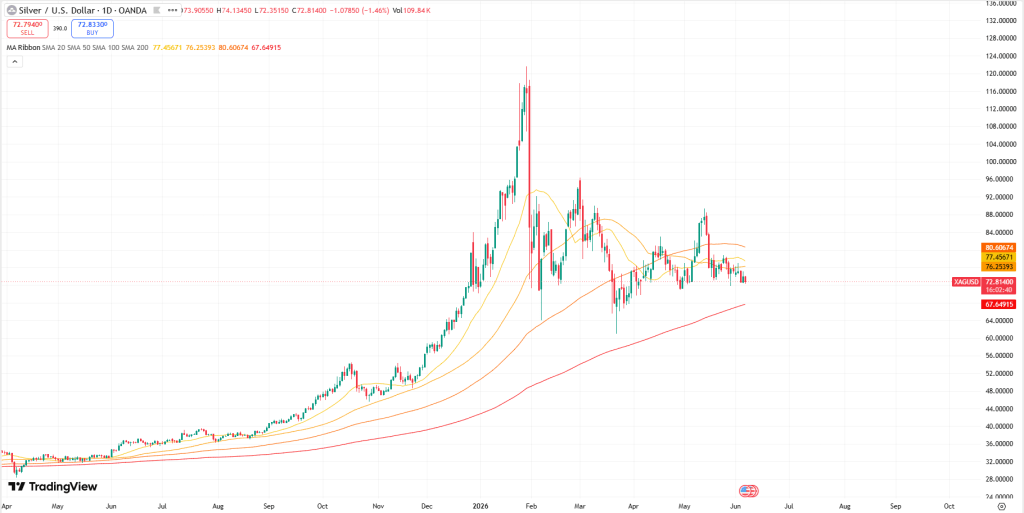
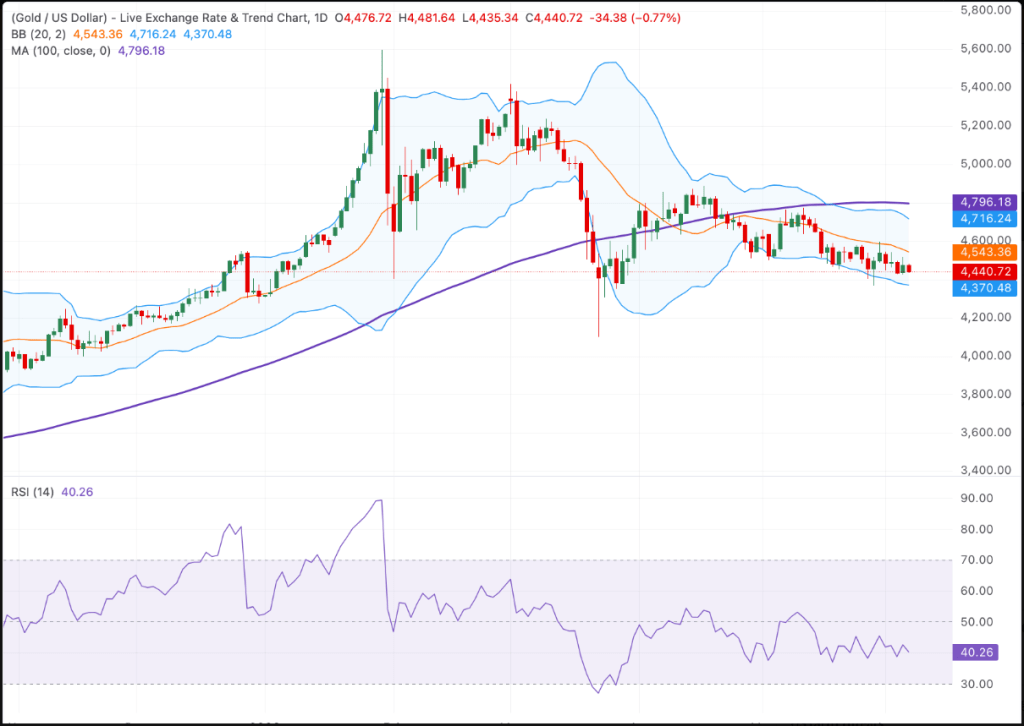

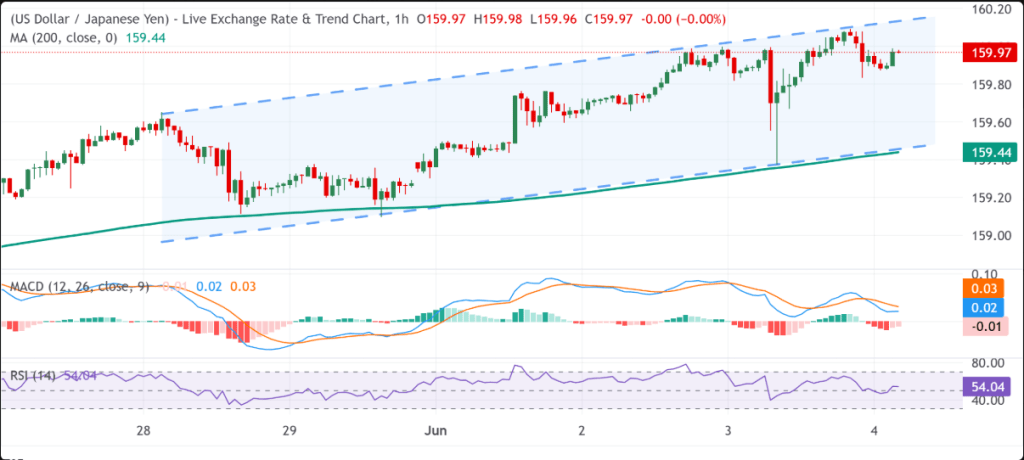

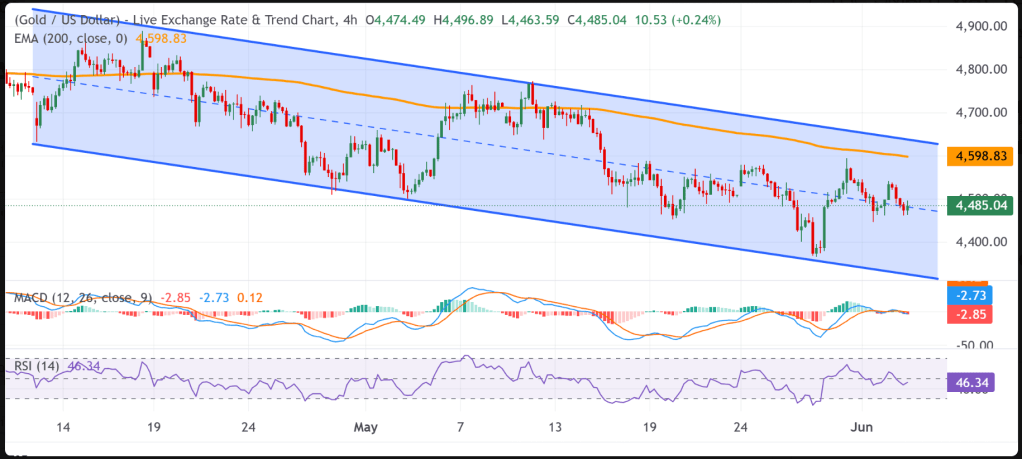
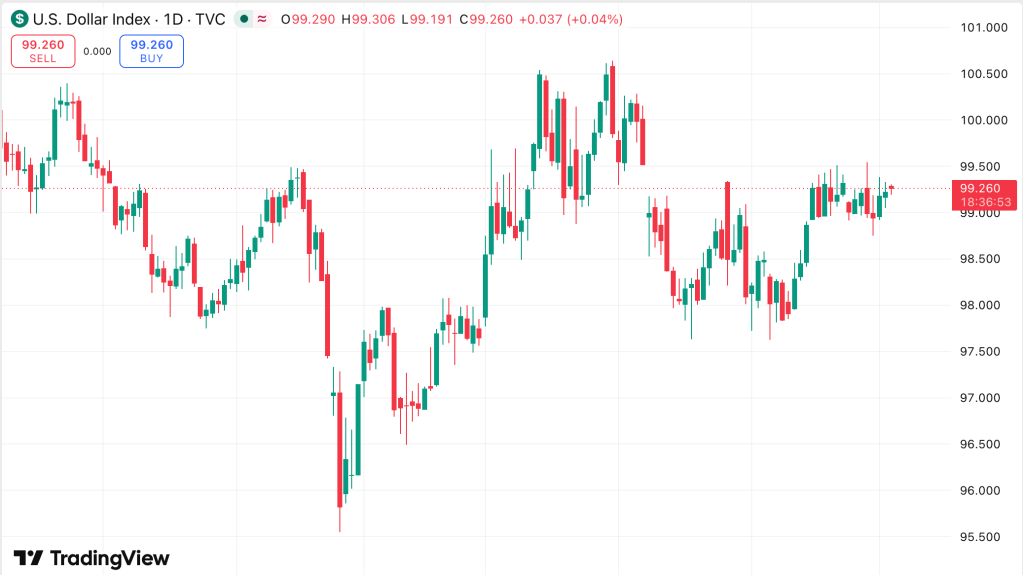
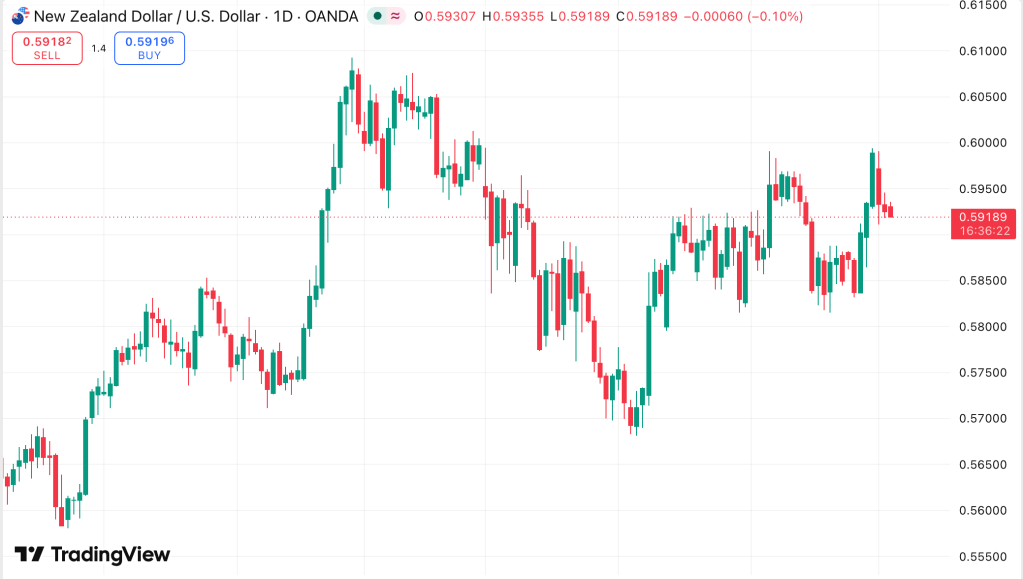


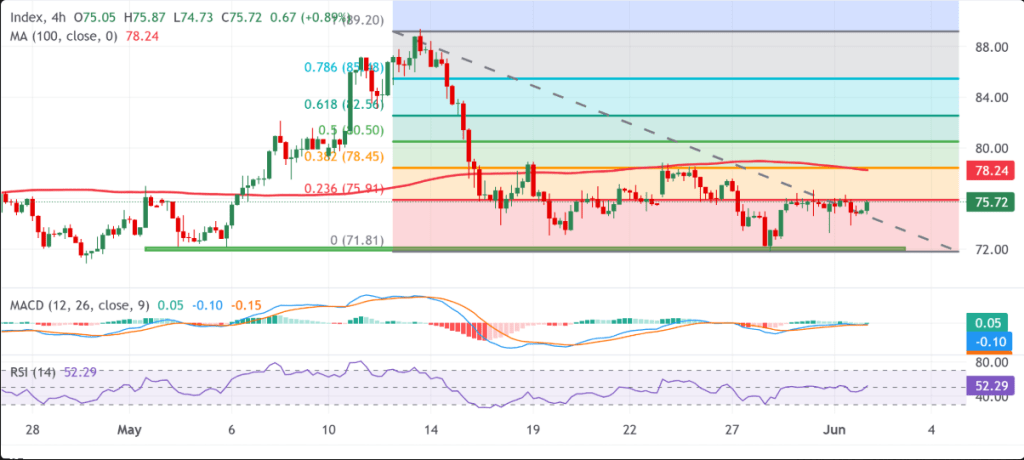

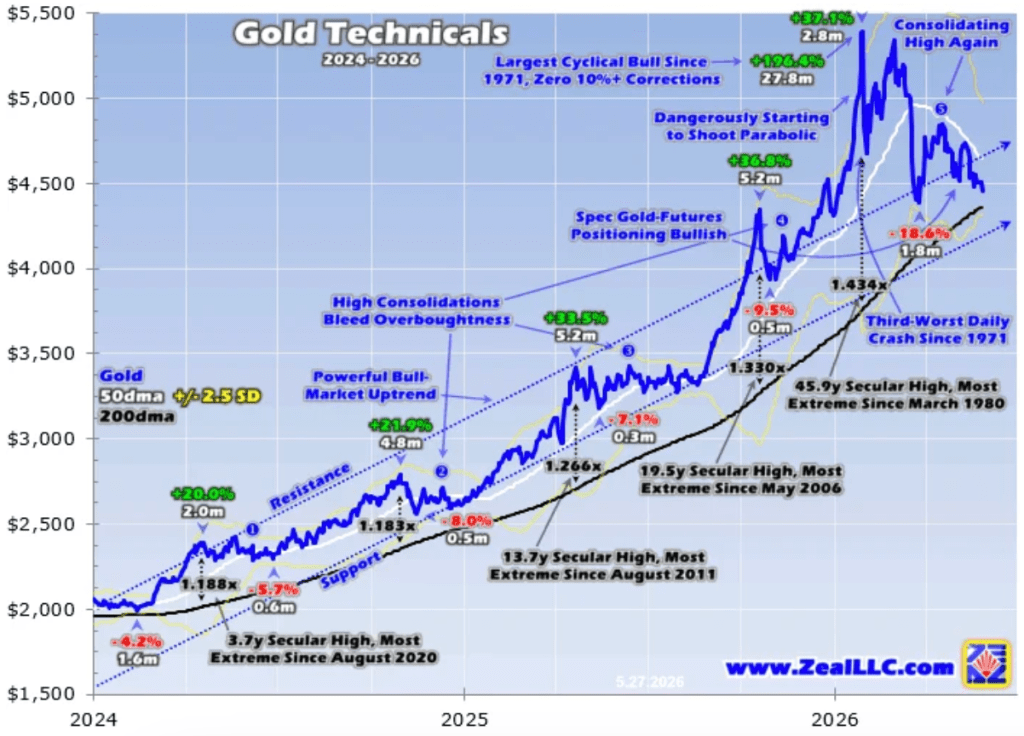
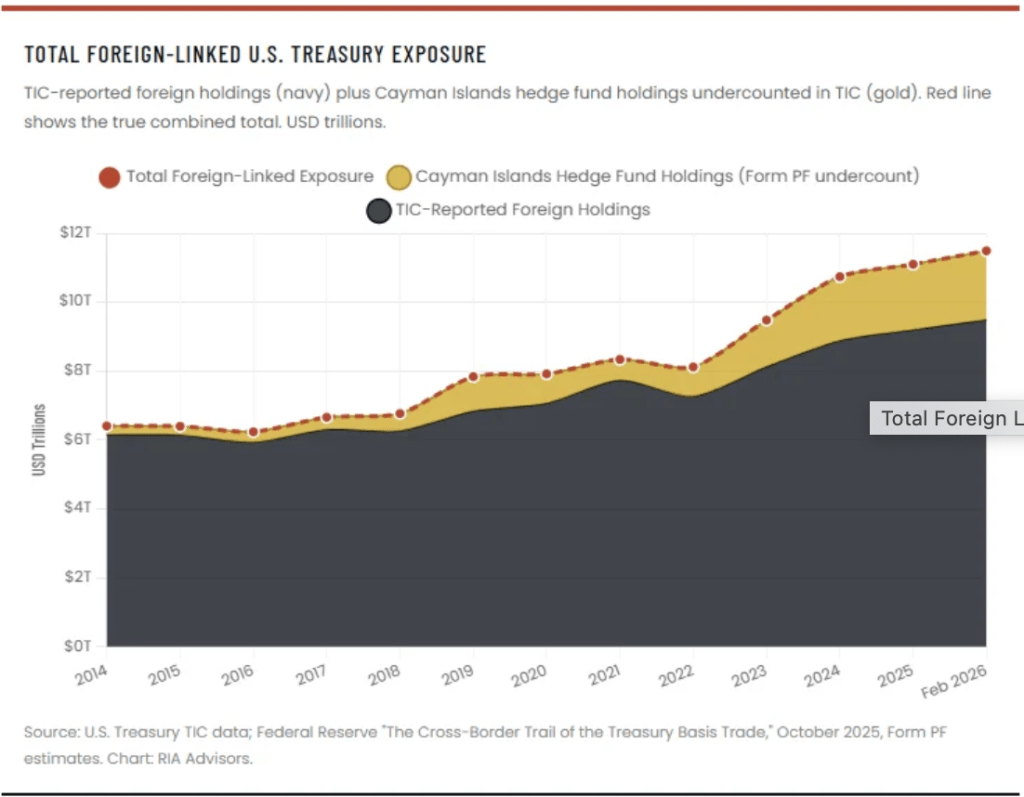
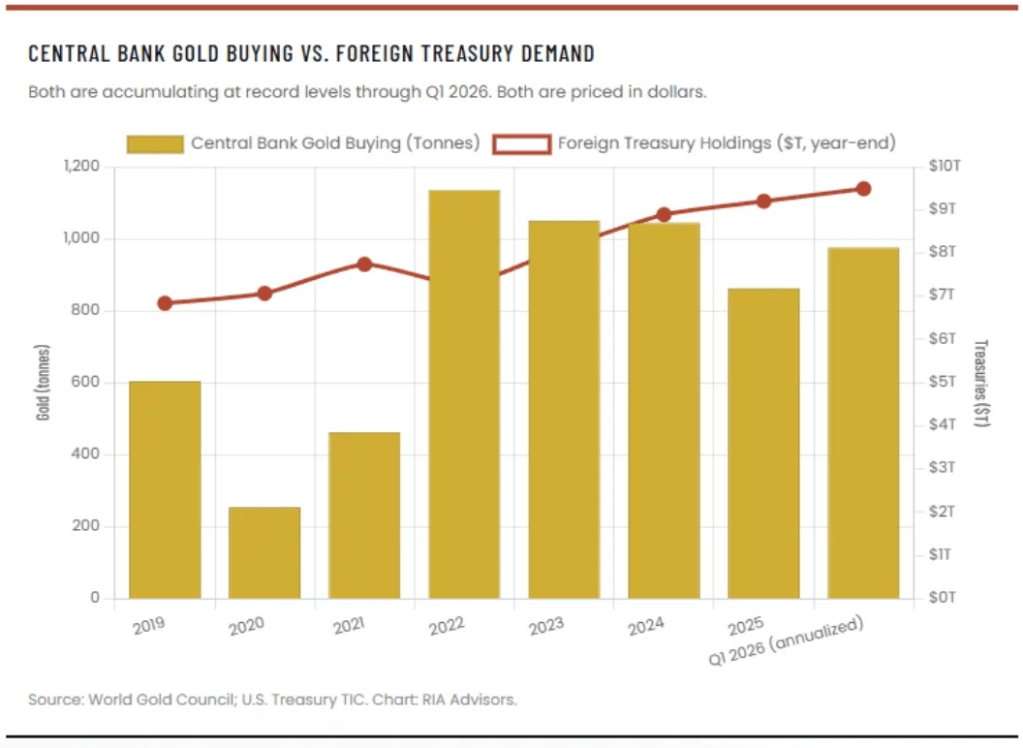
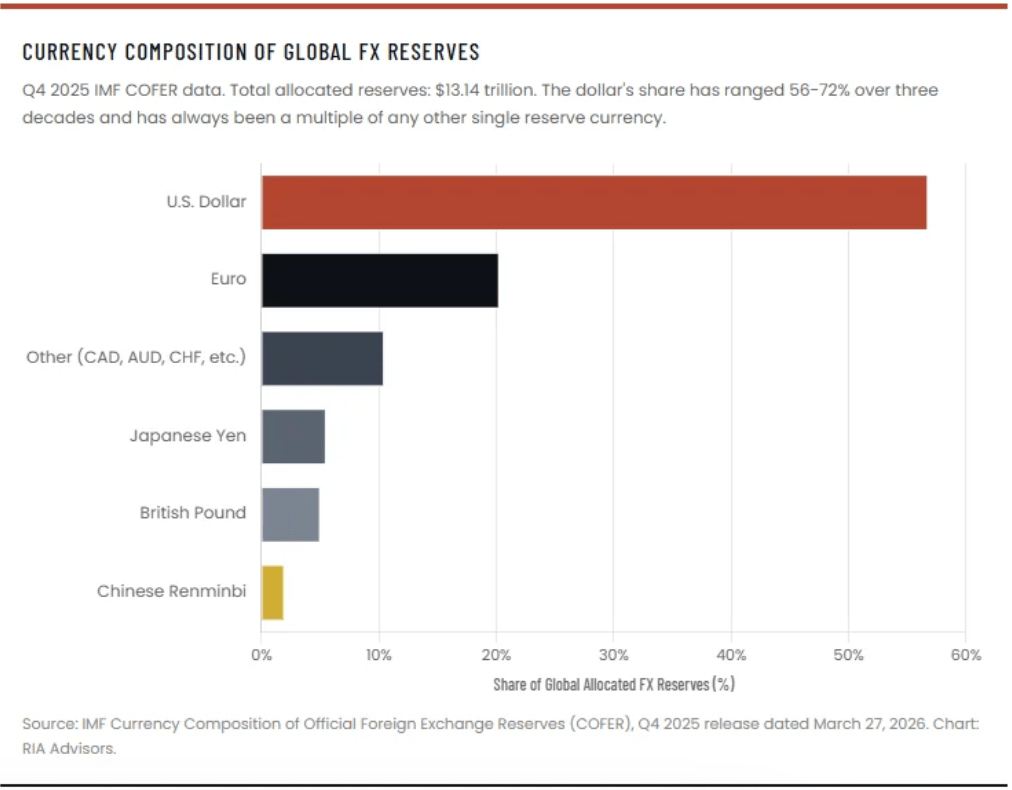
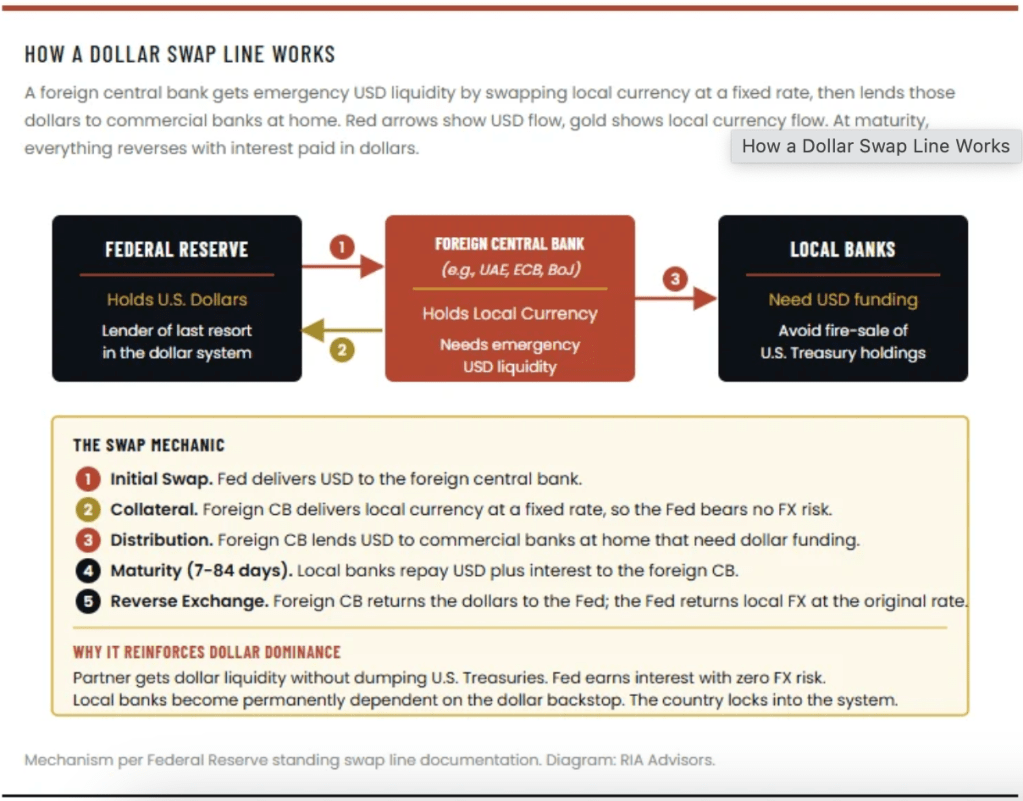
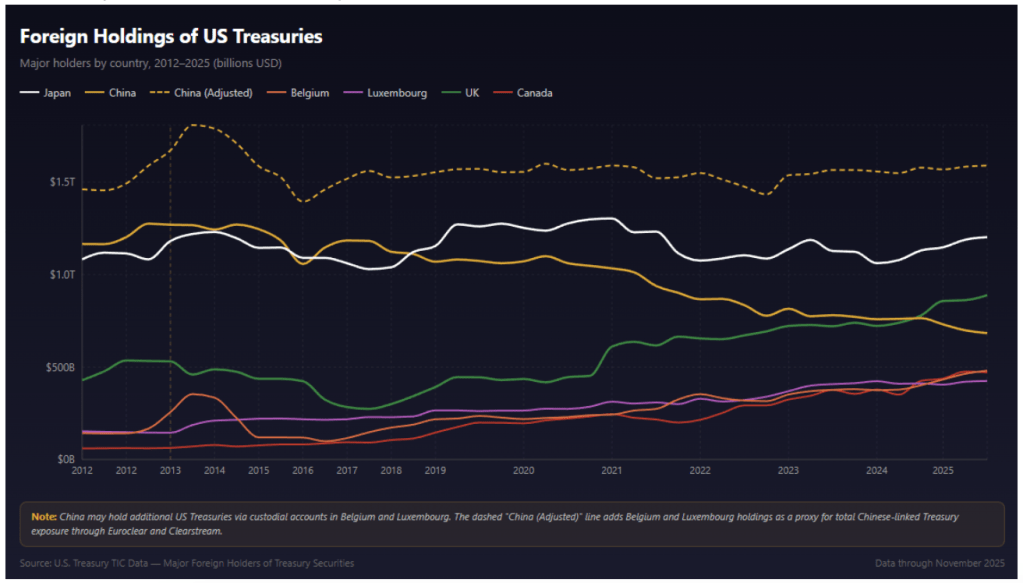
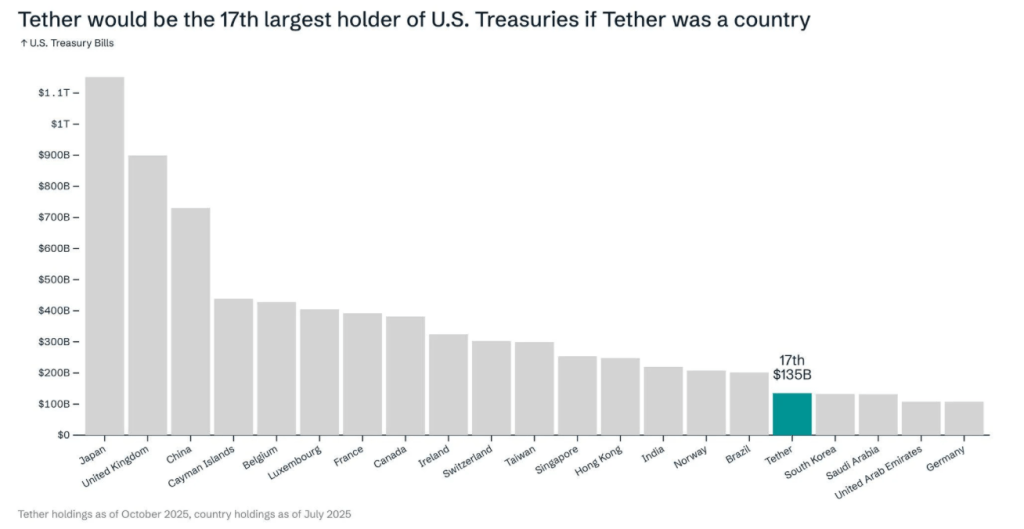
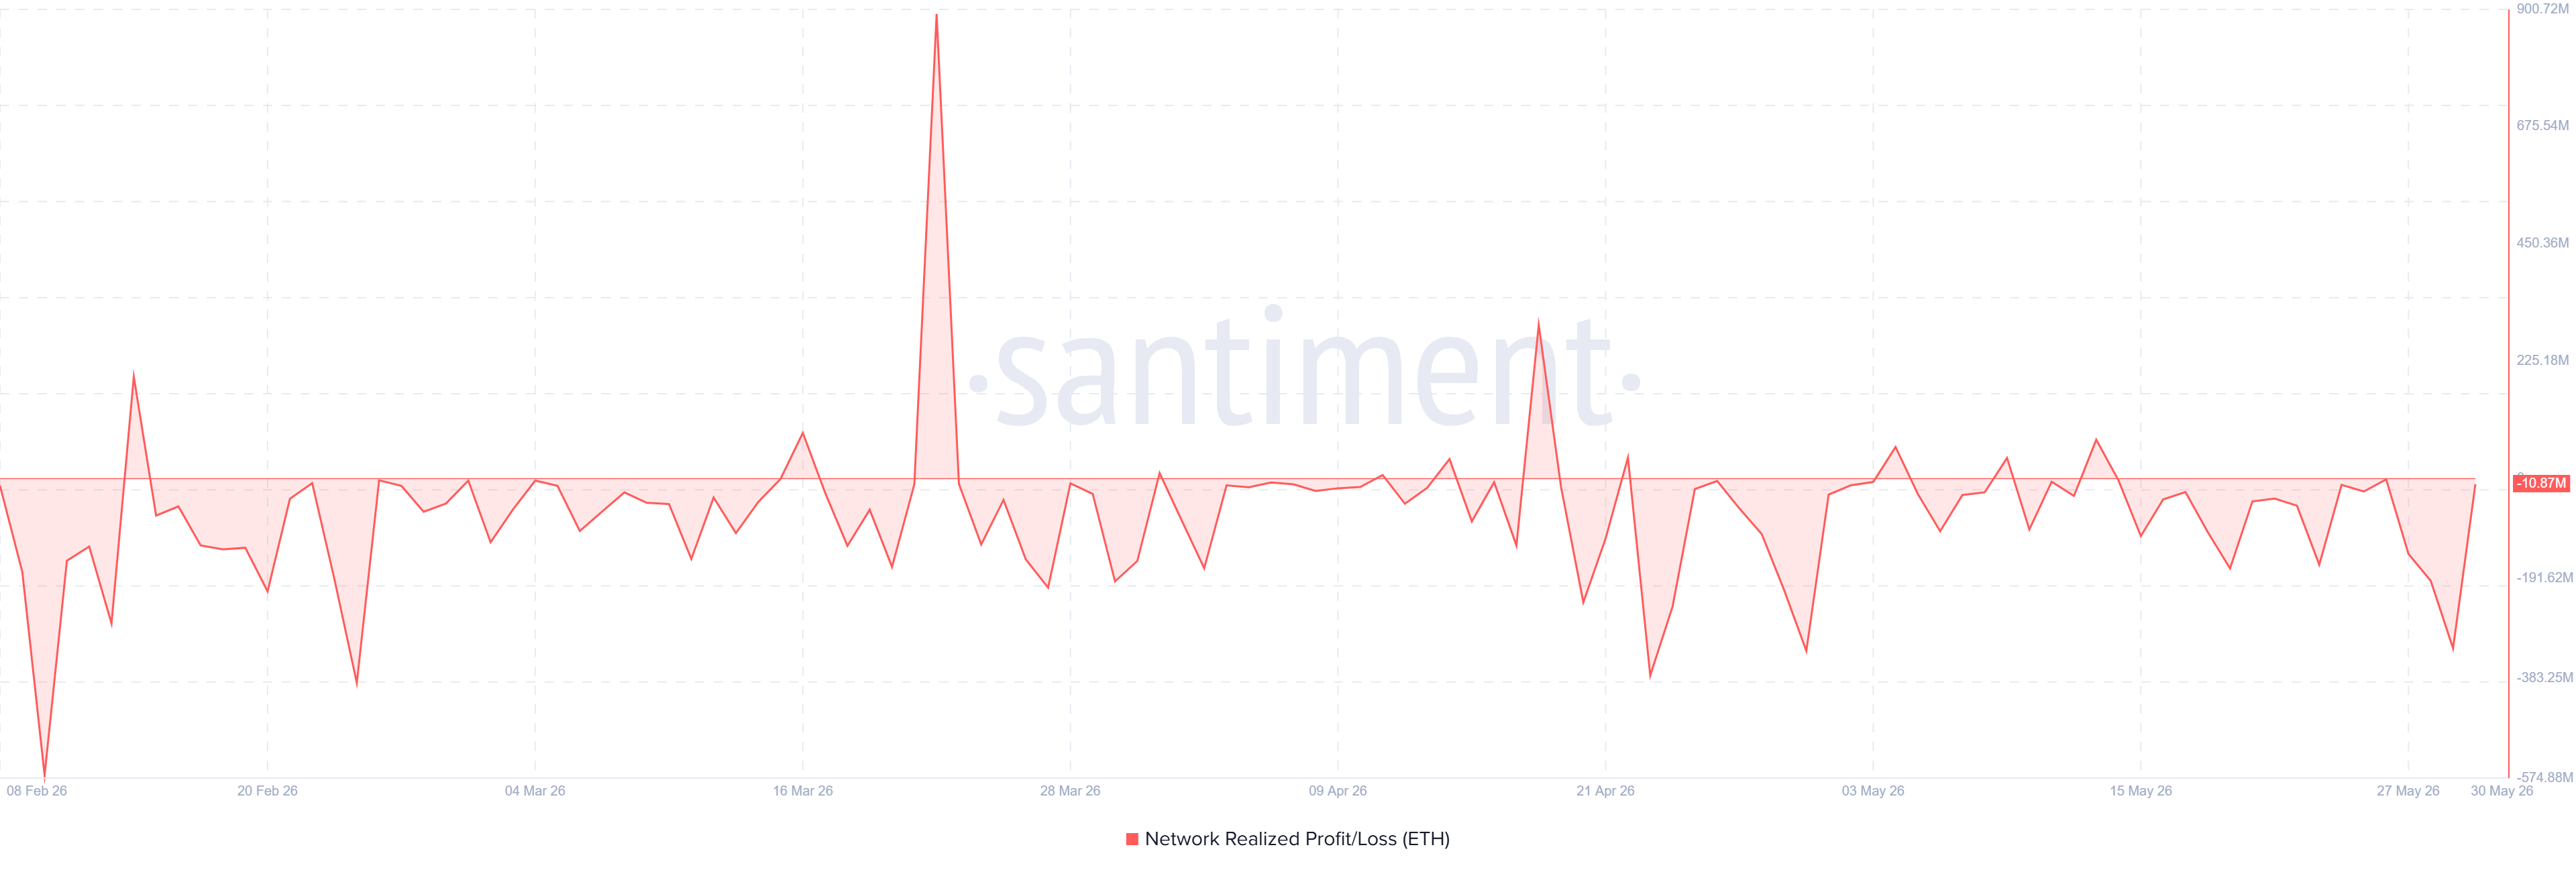
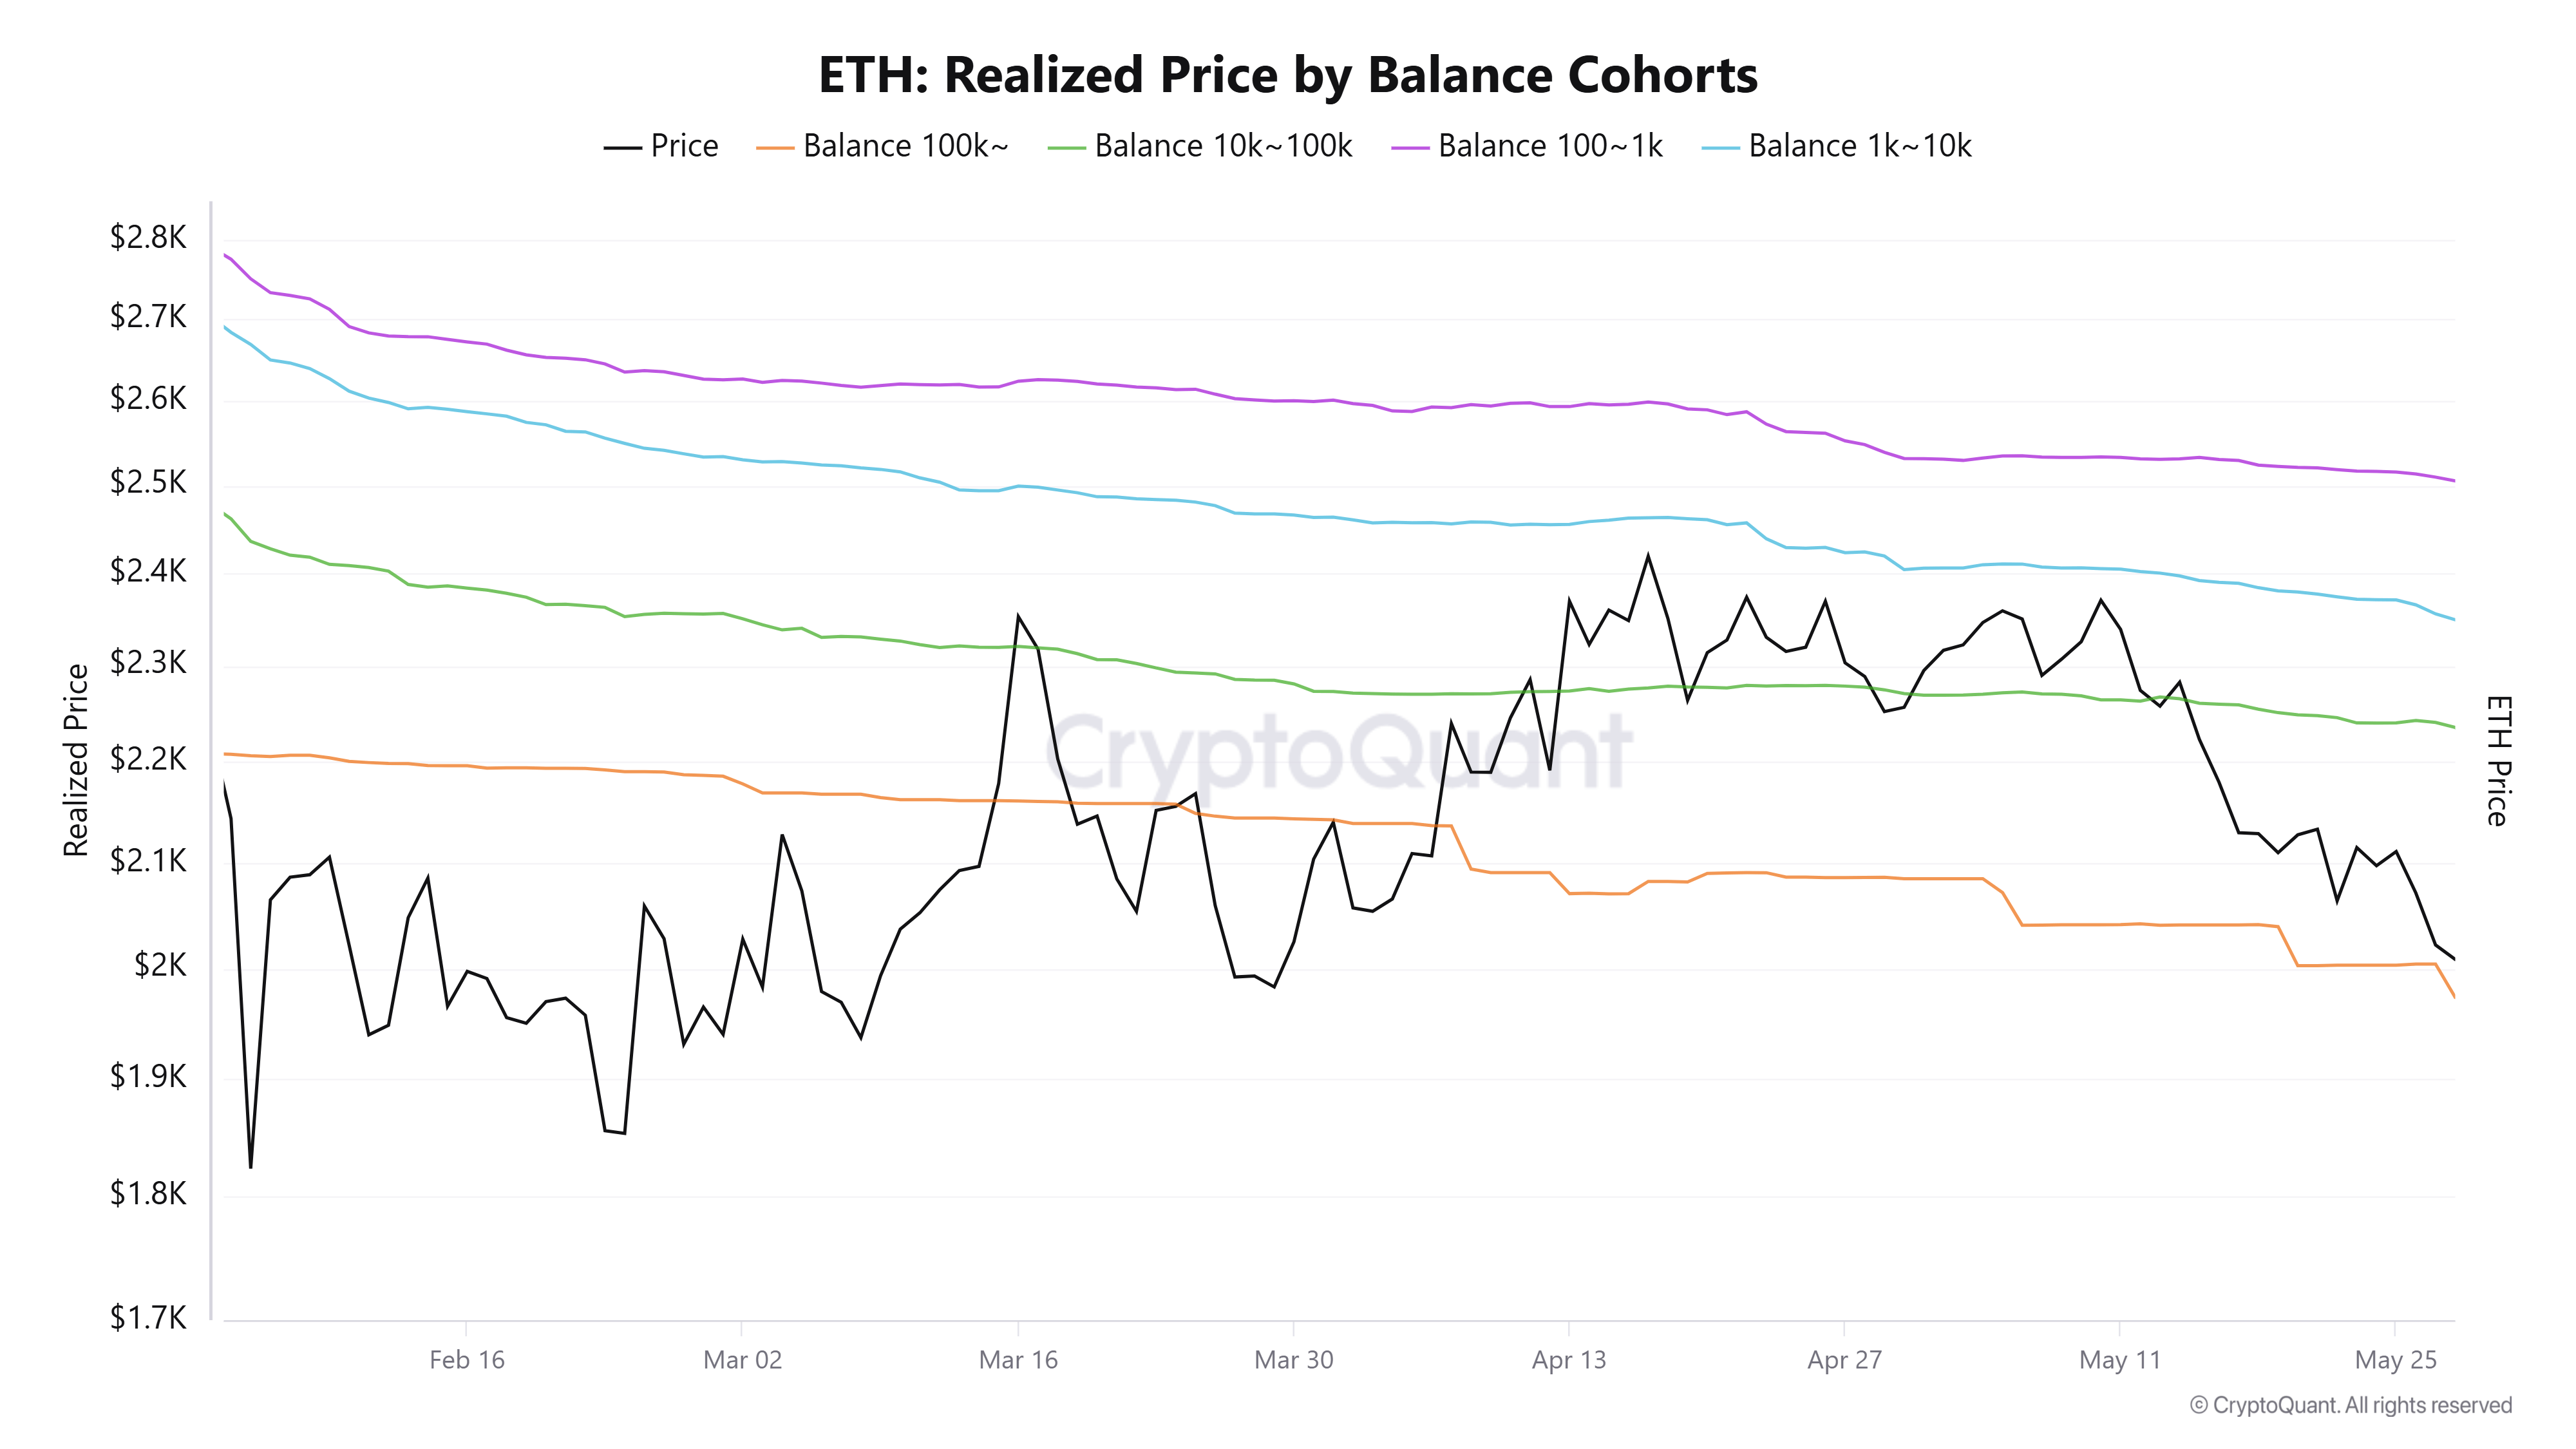
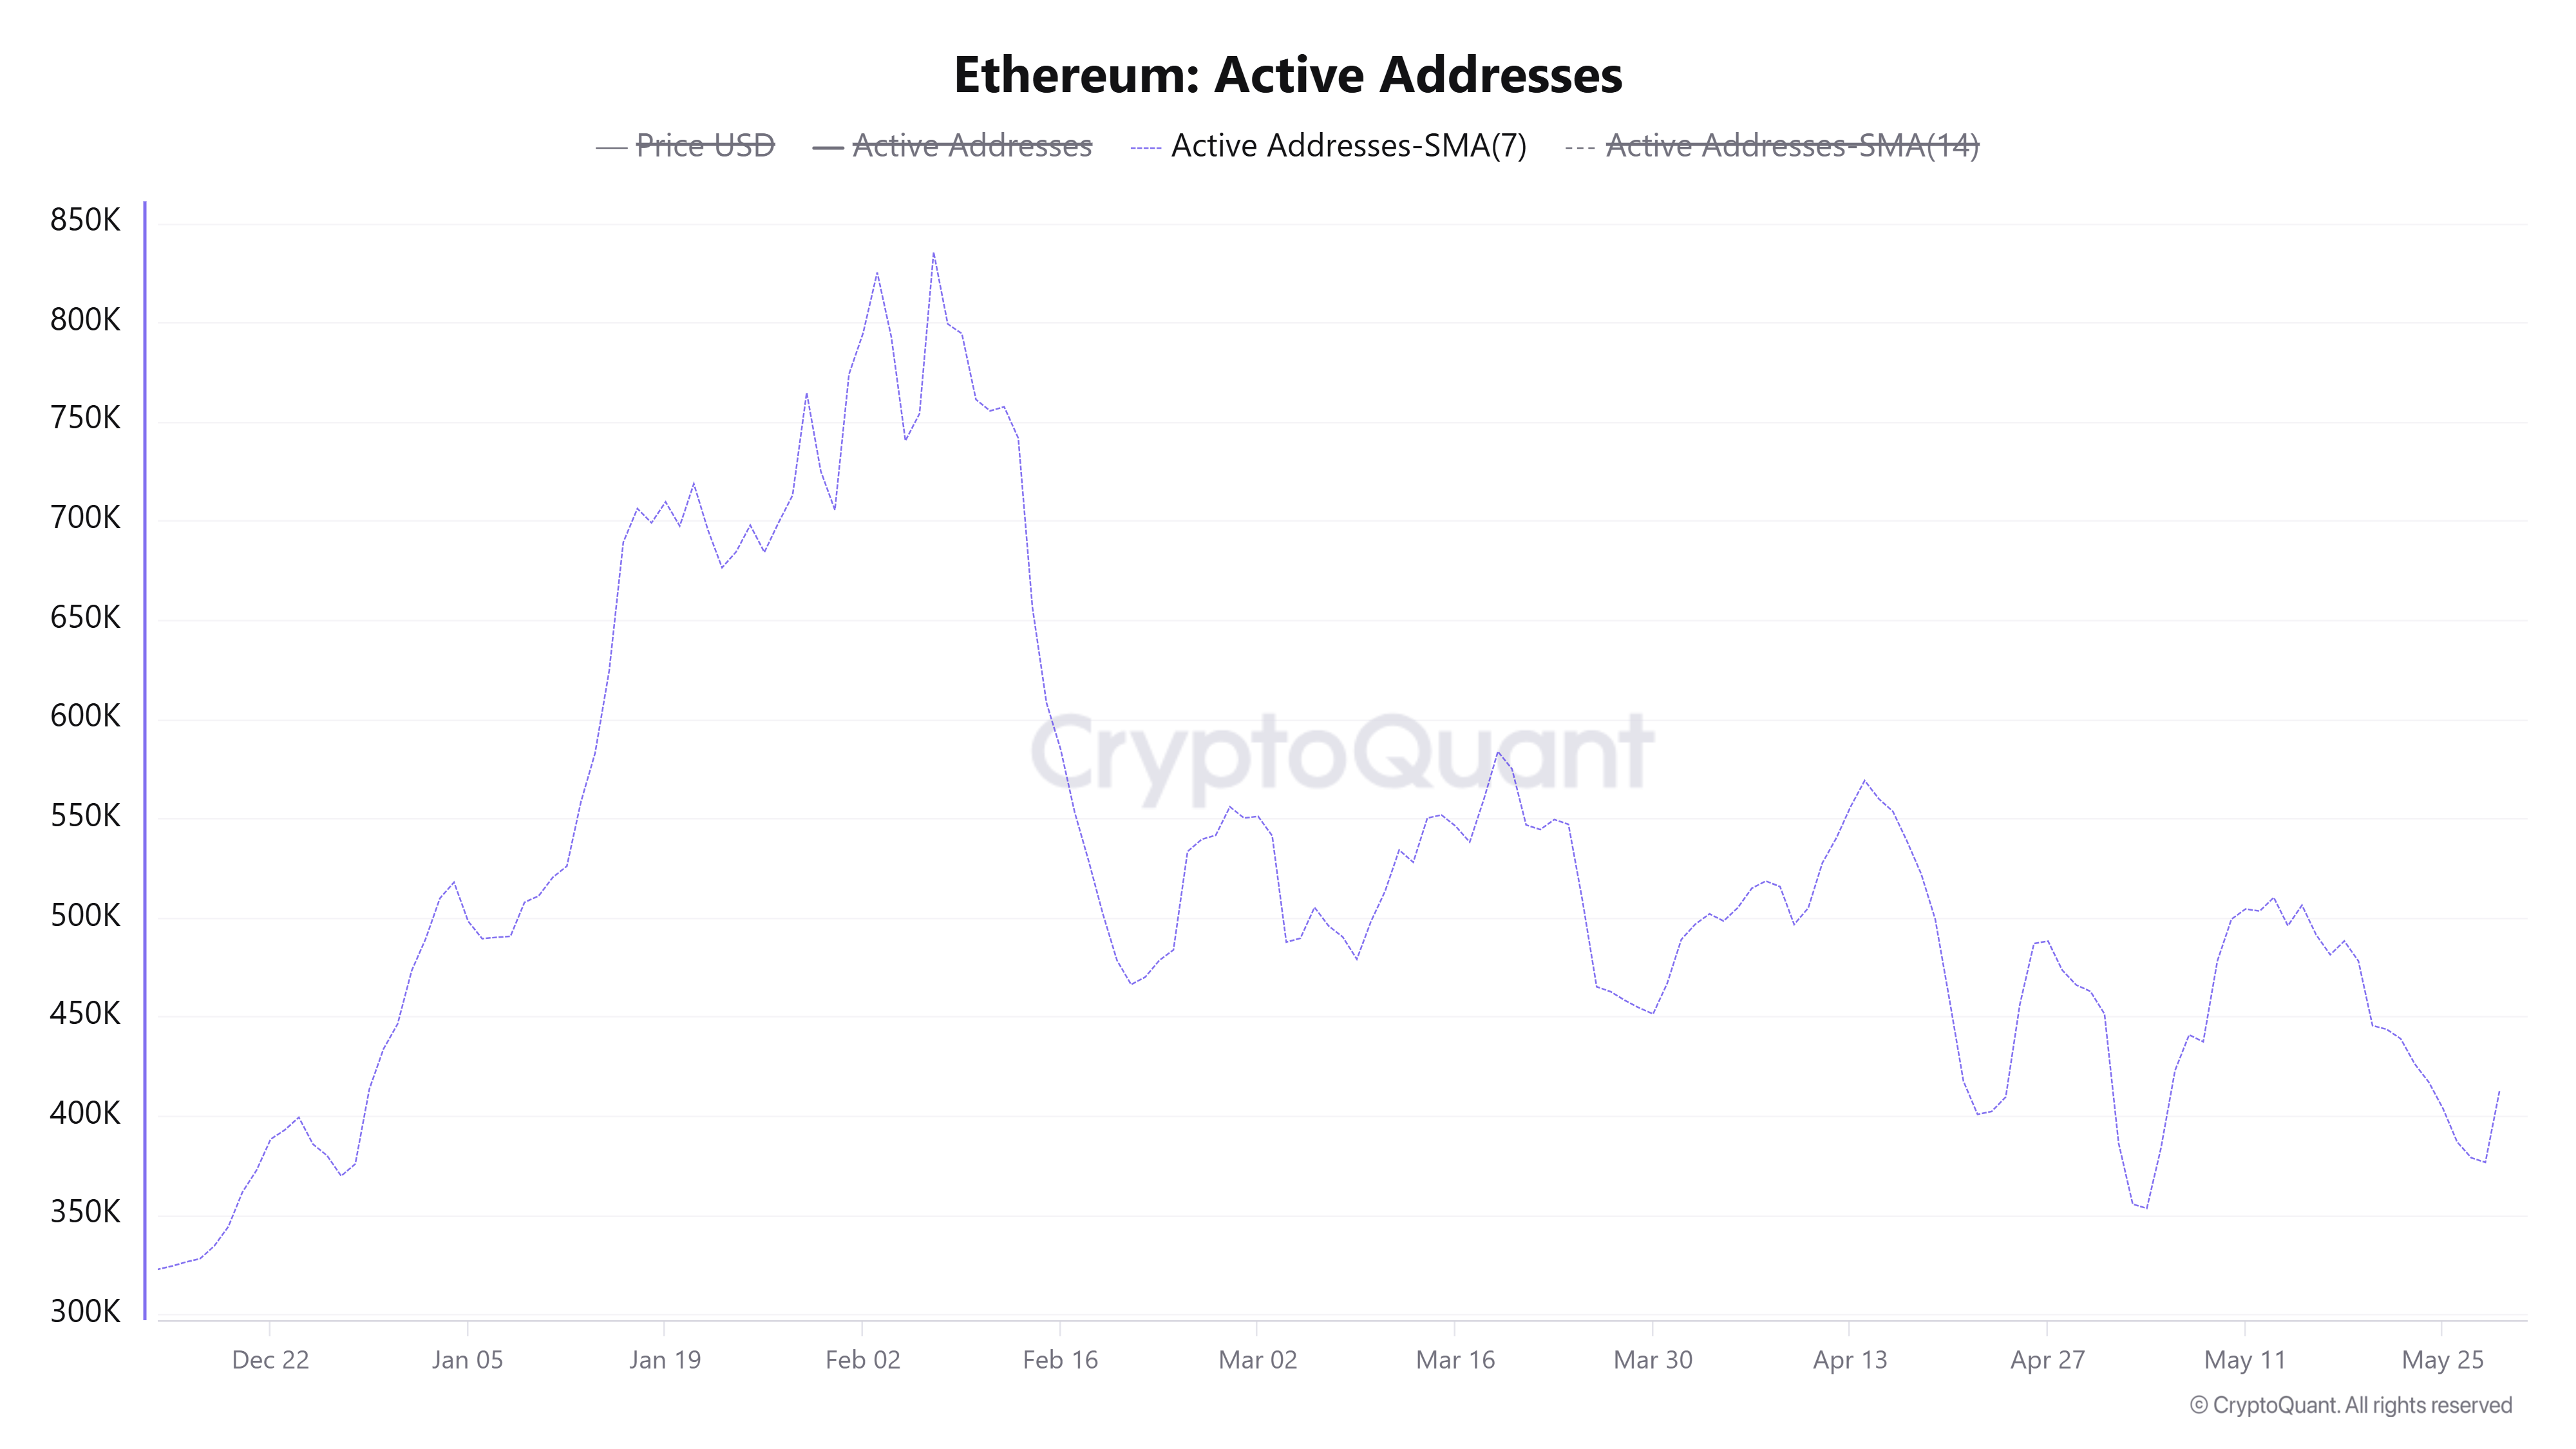
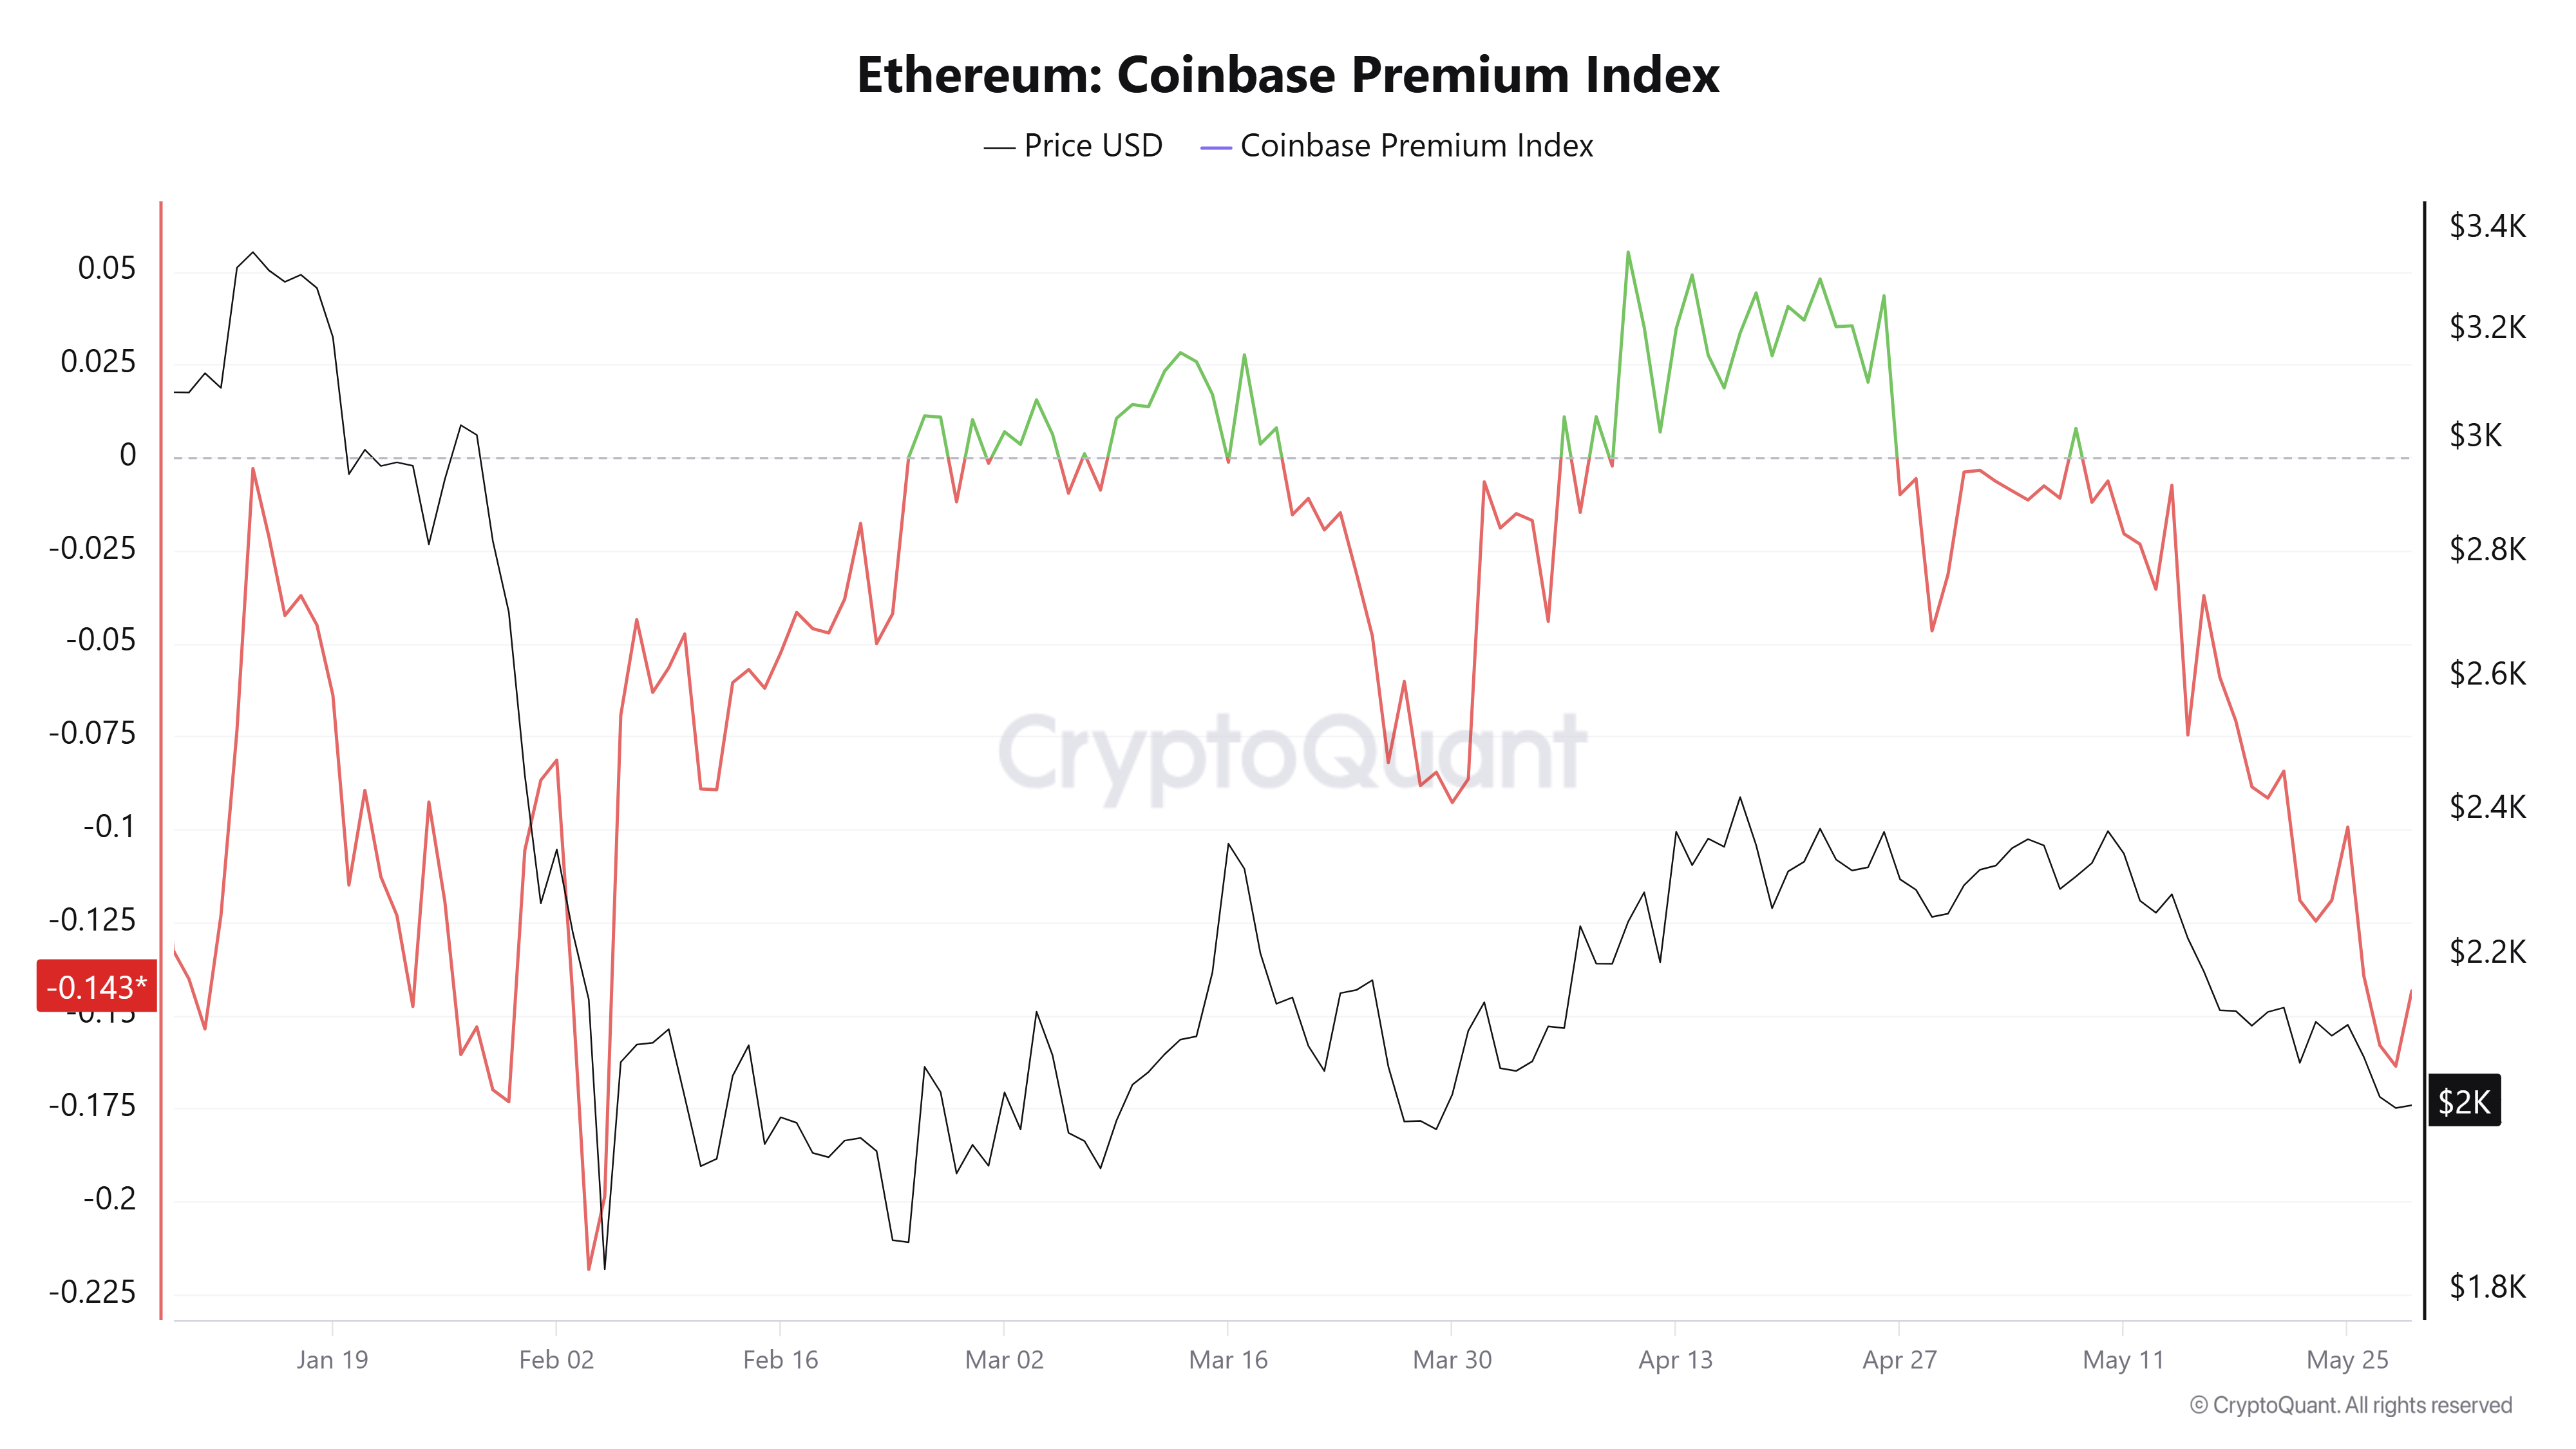
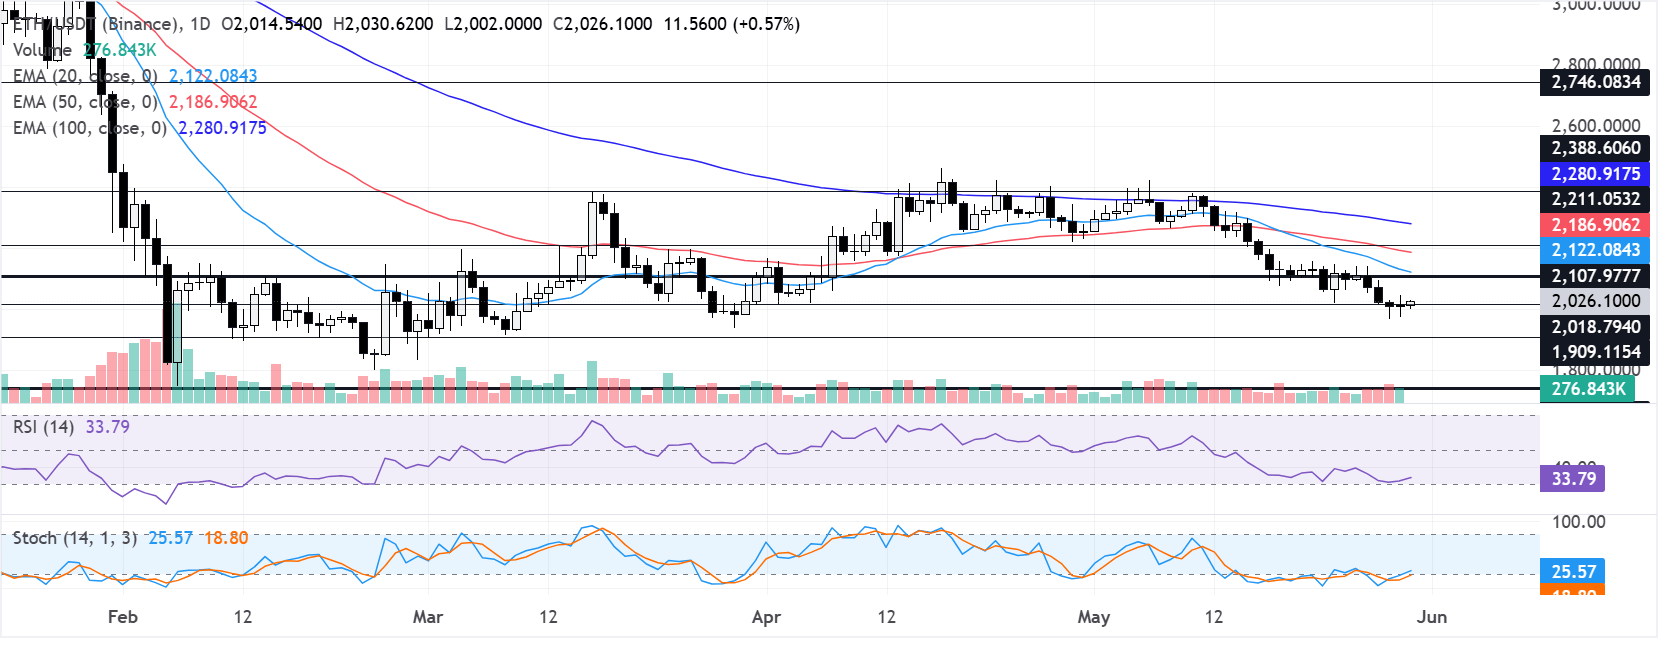


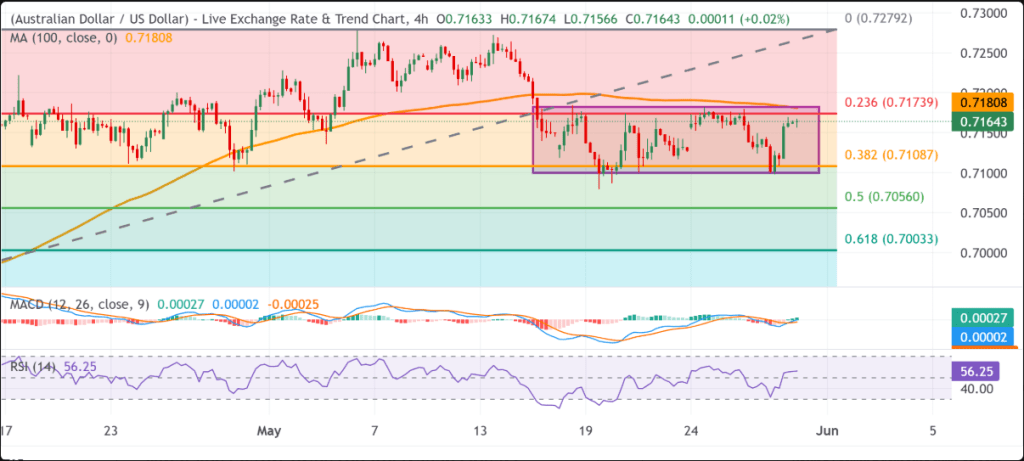
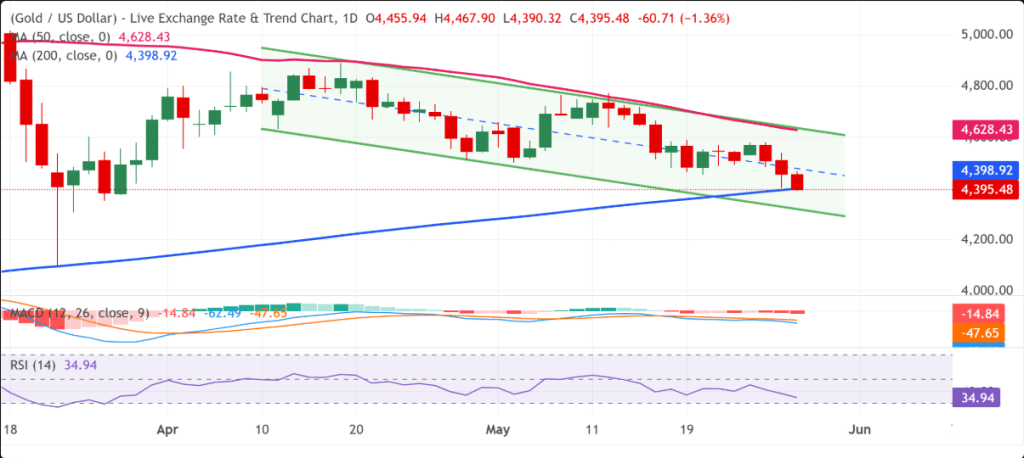


")
")

")

")
")
")
")
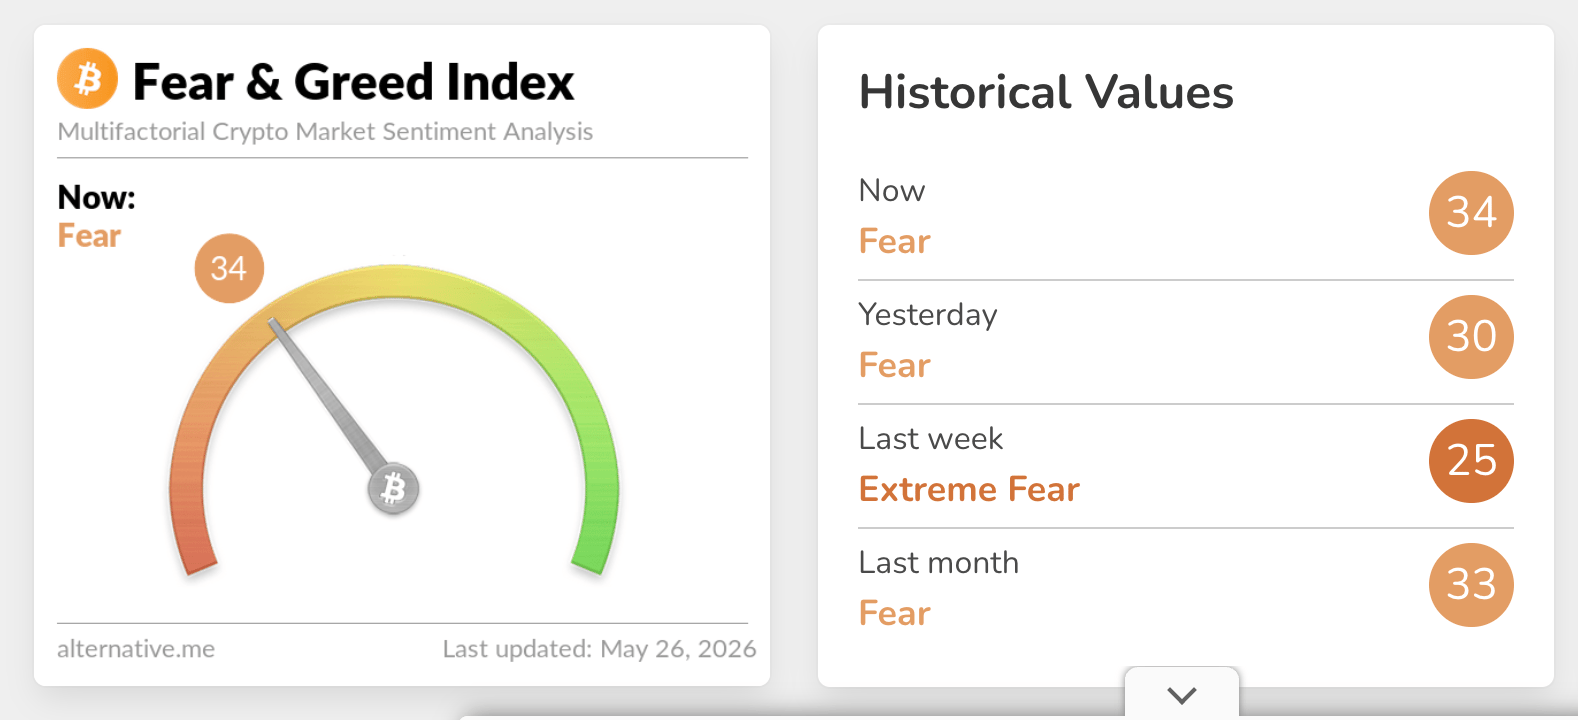
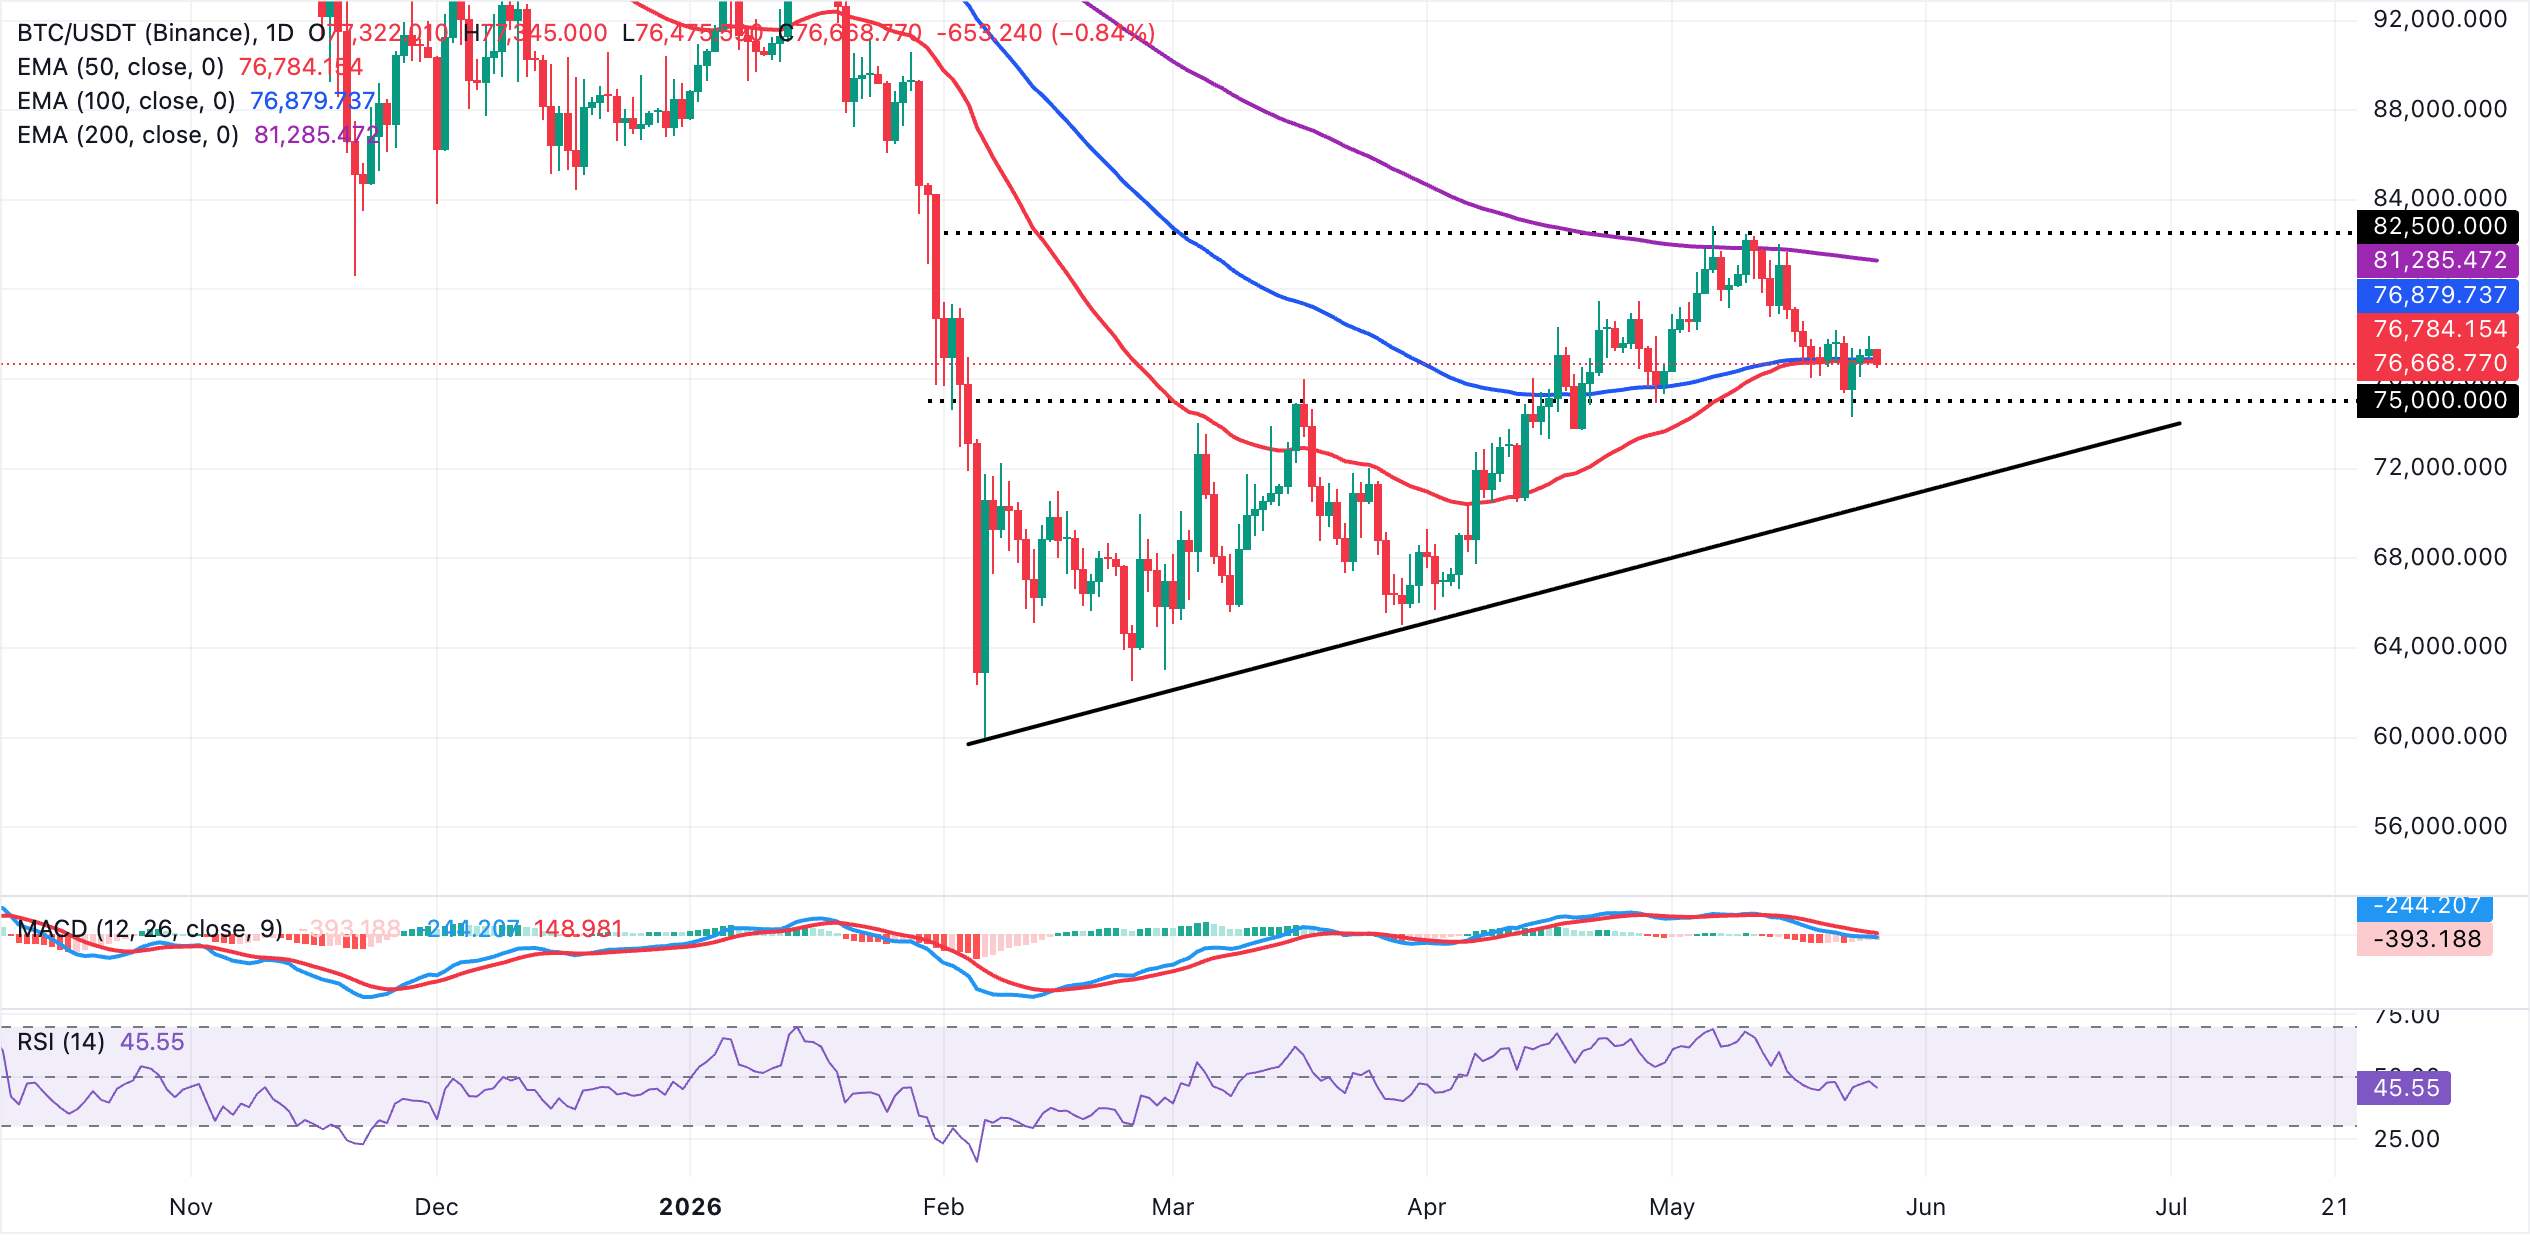
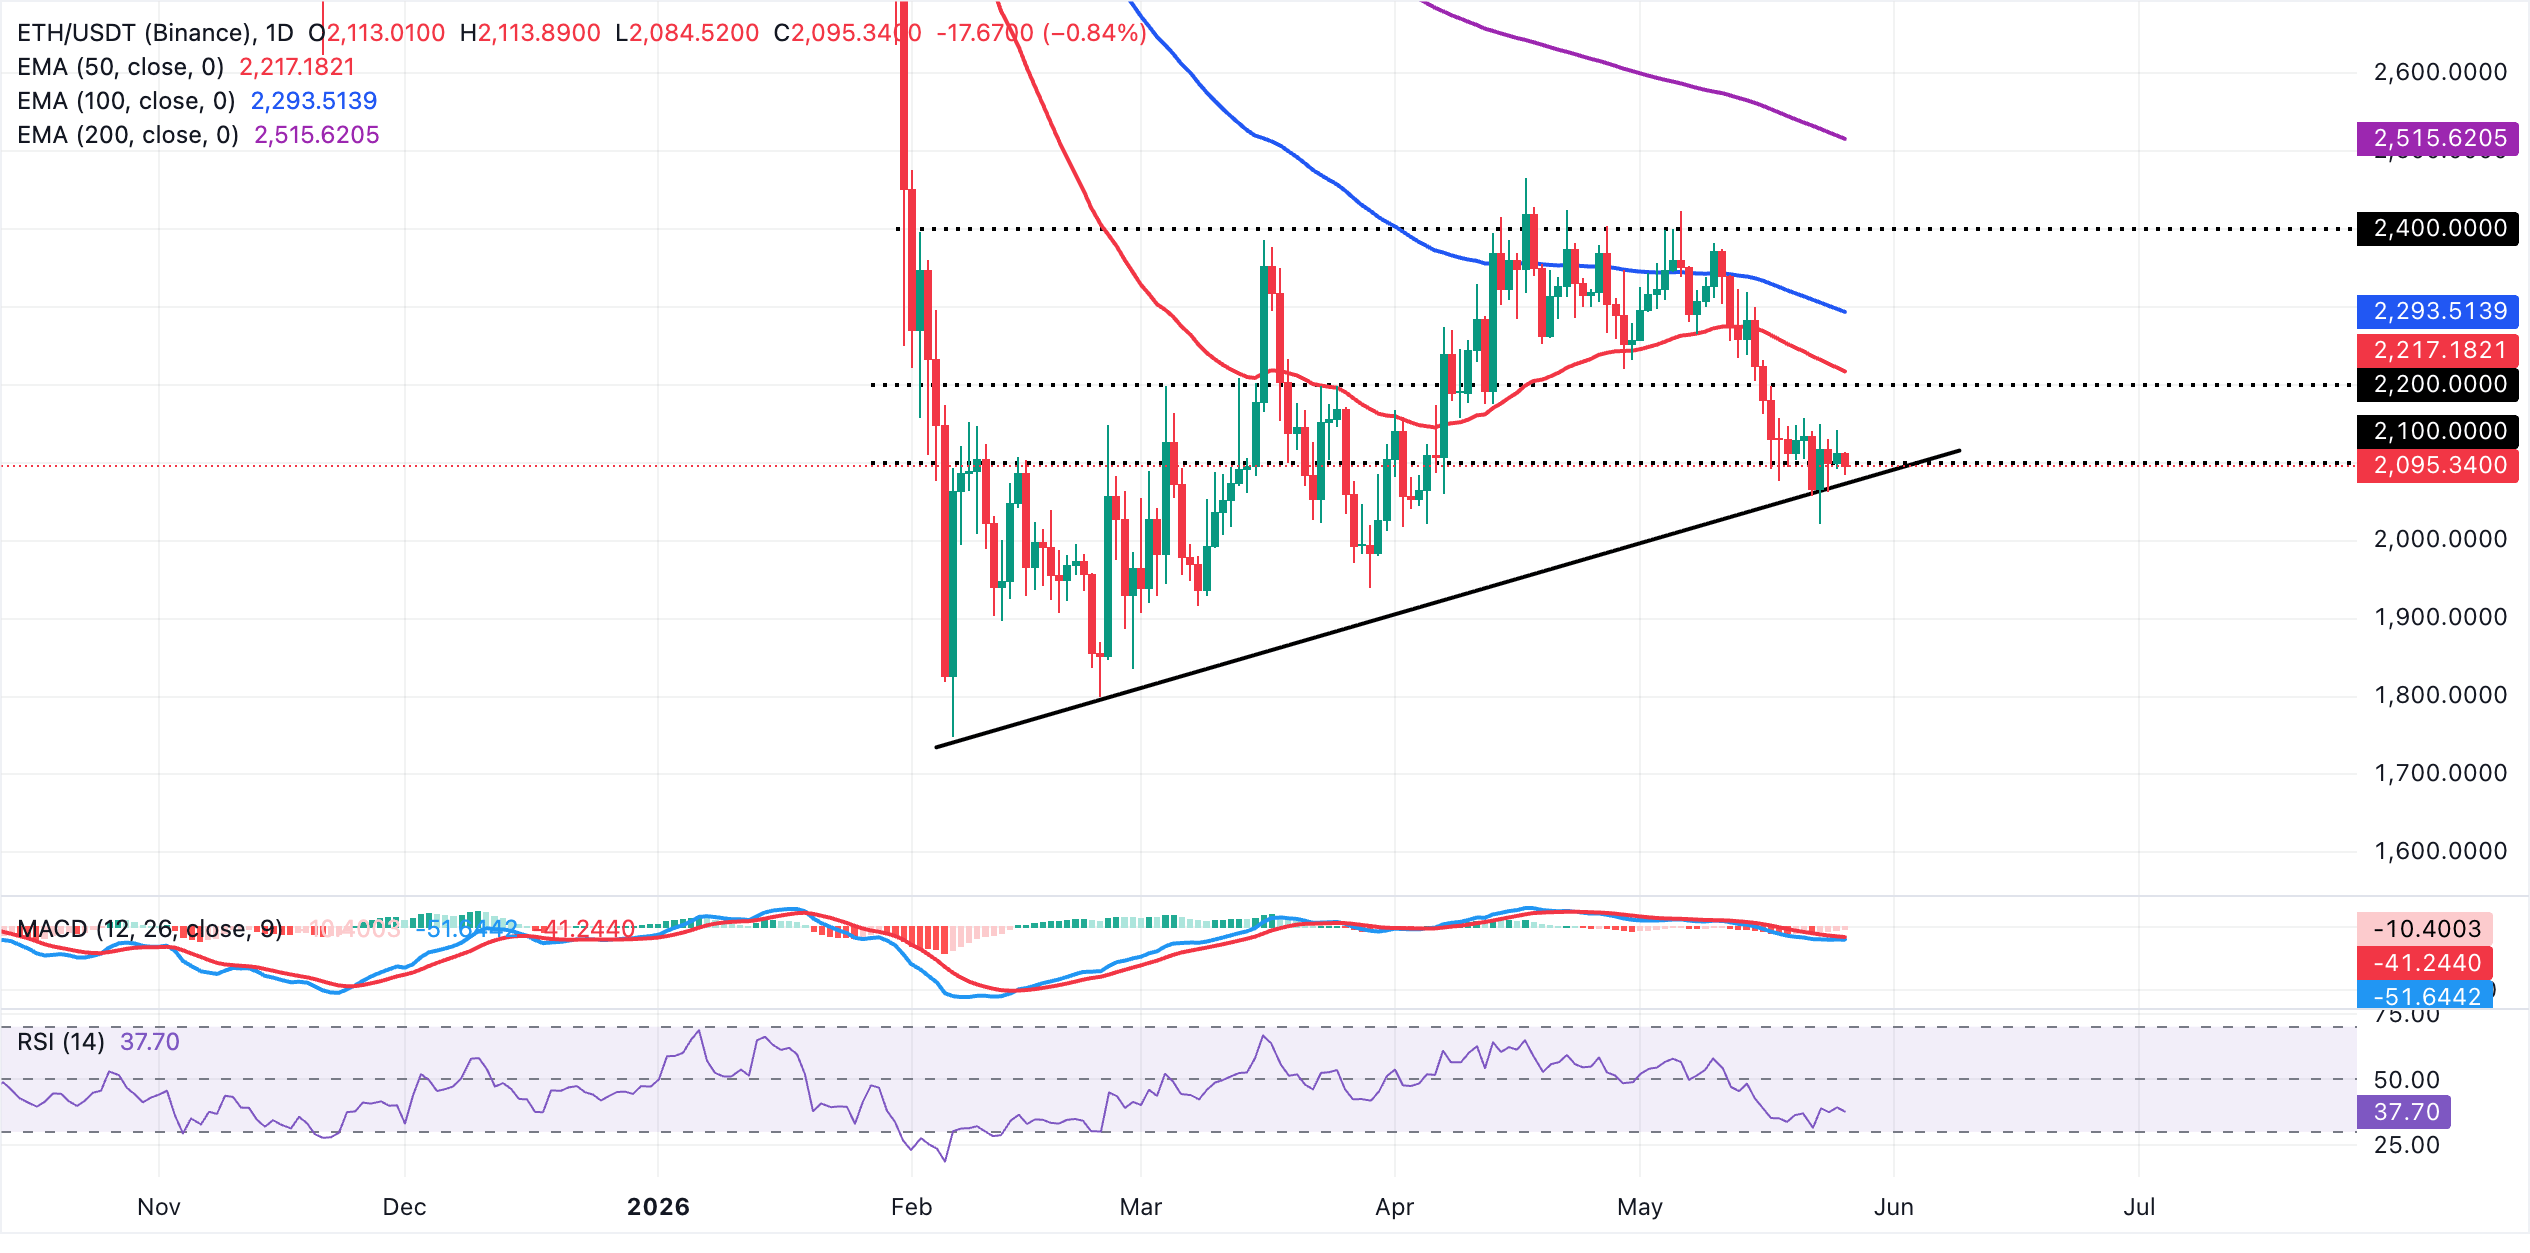
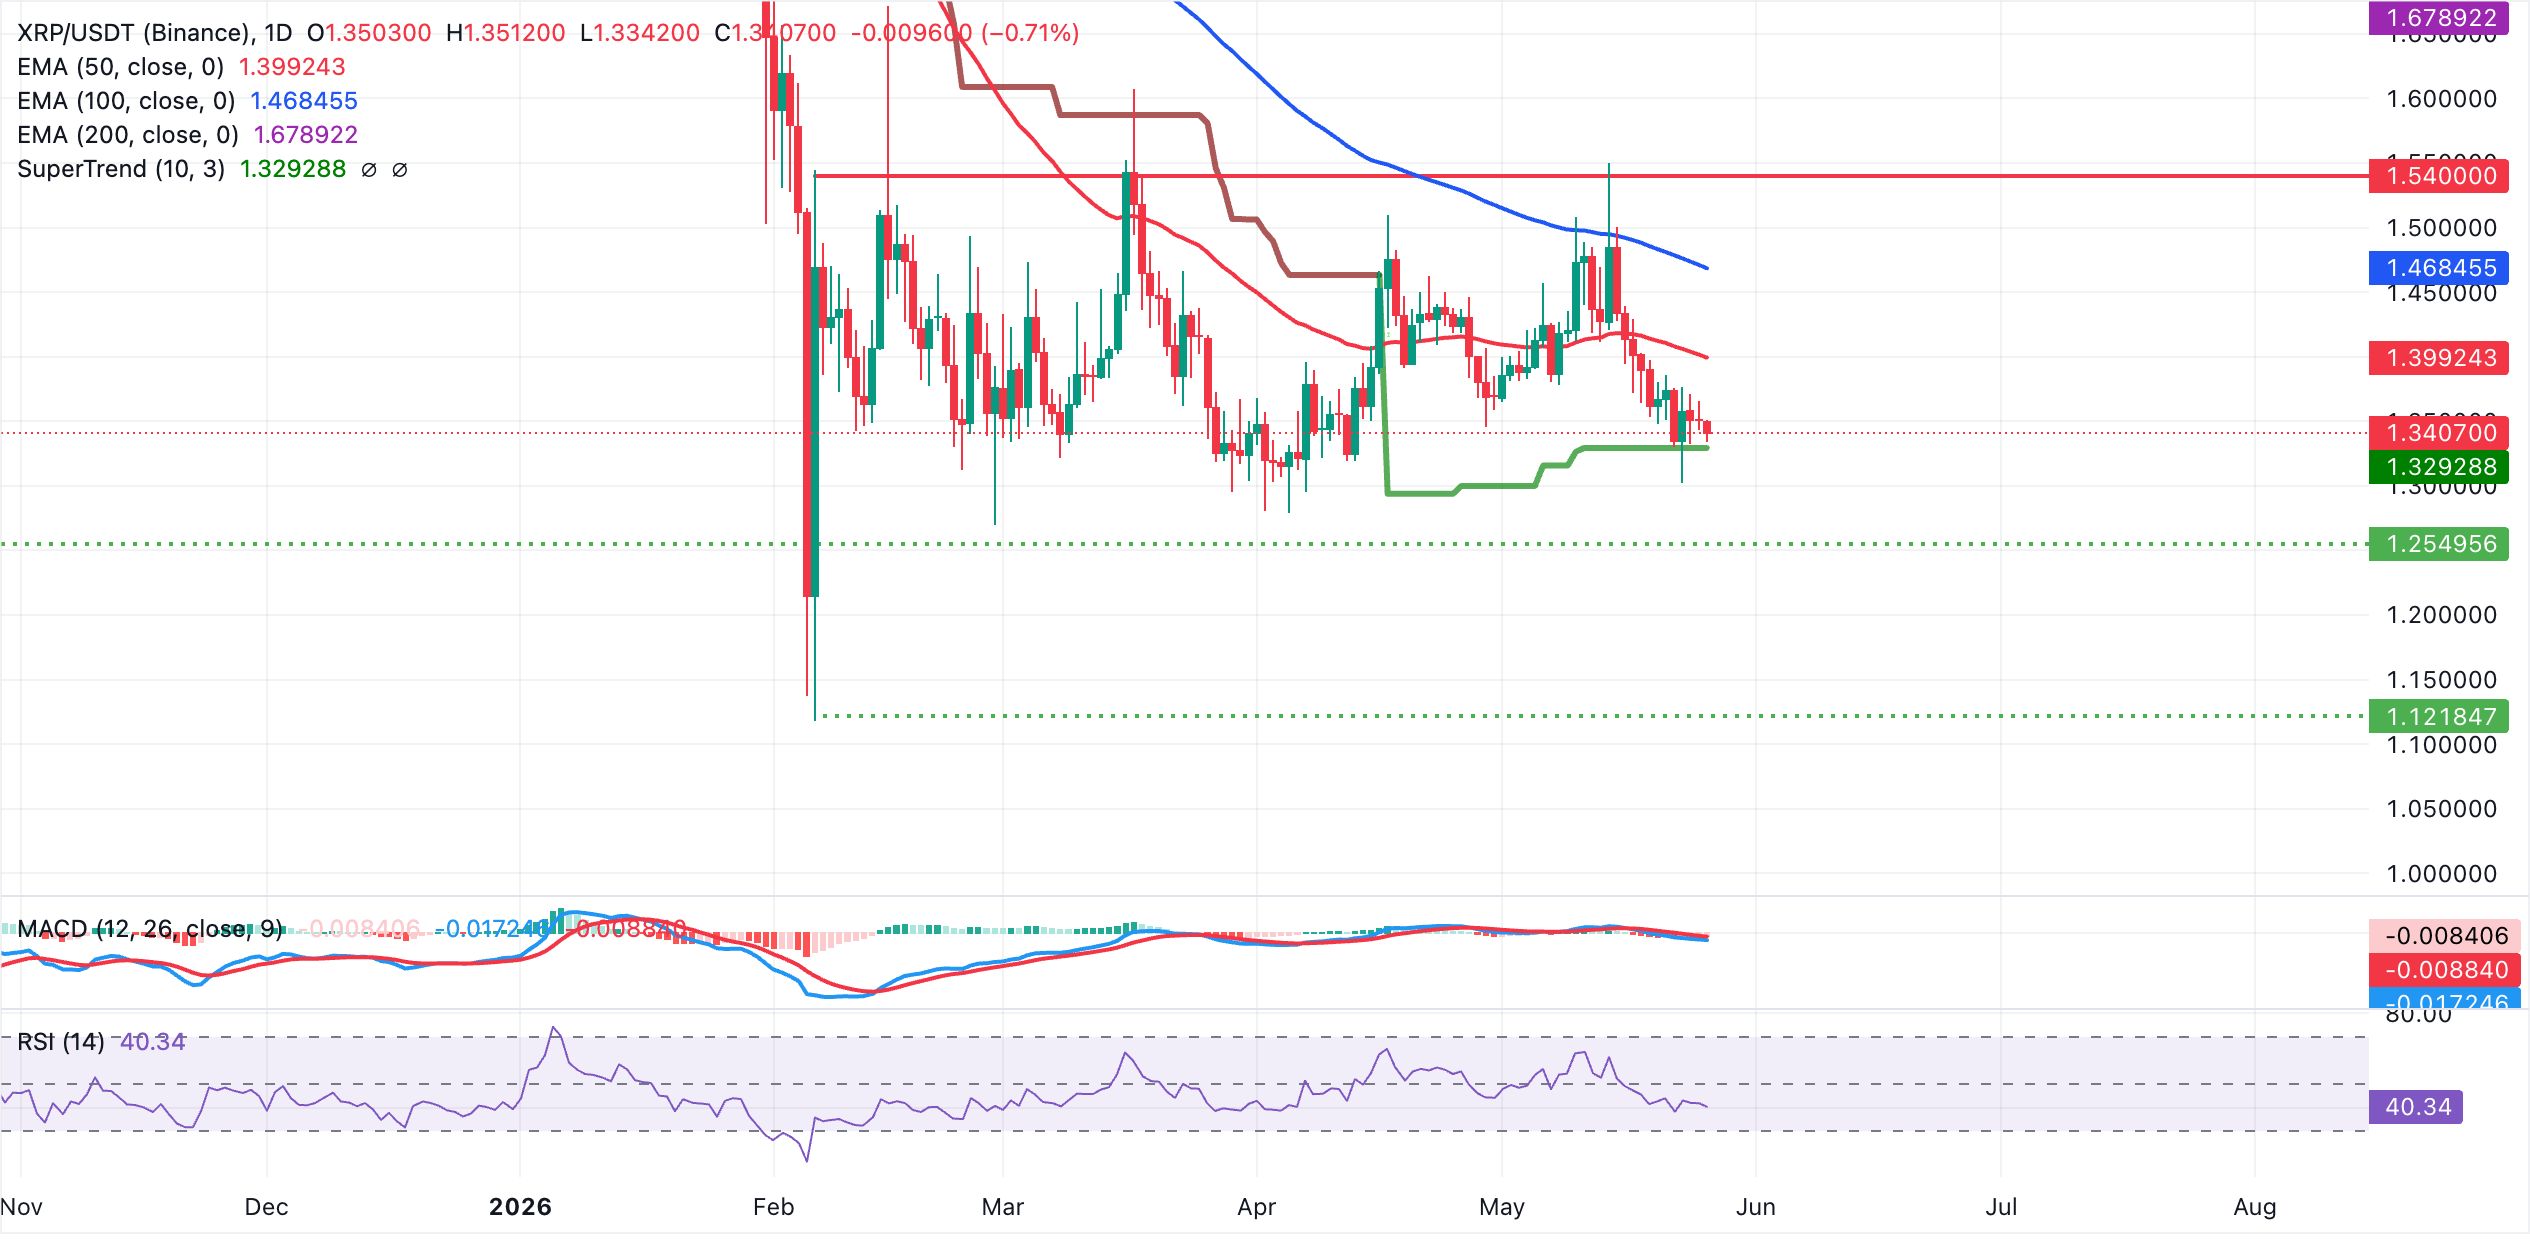

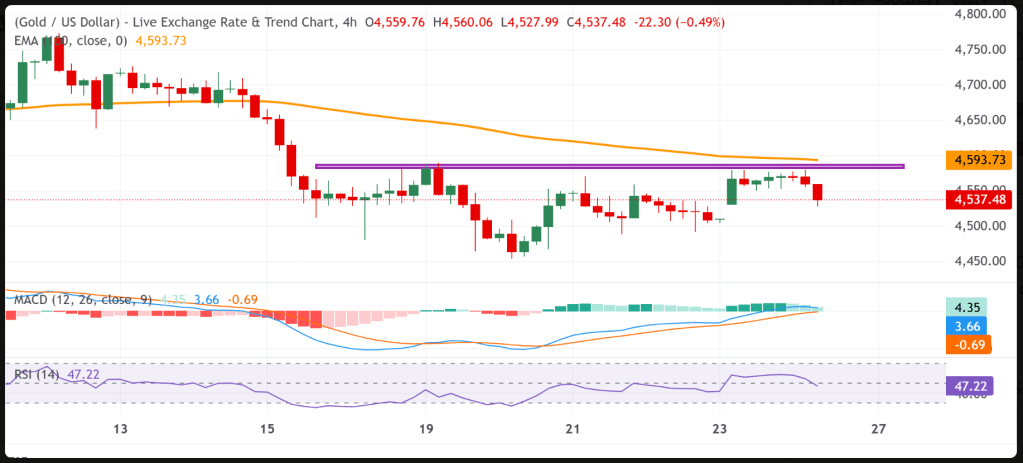
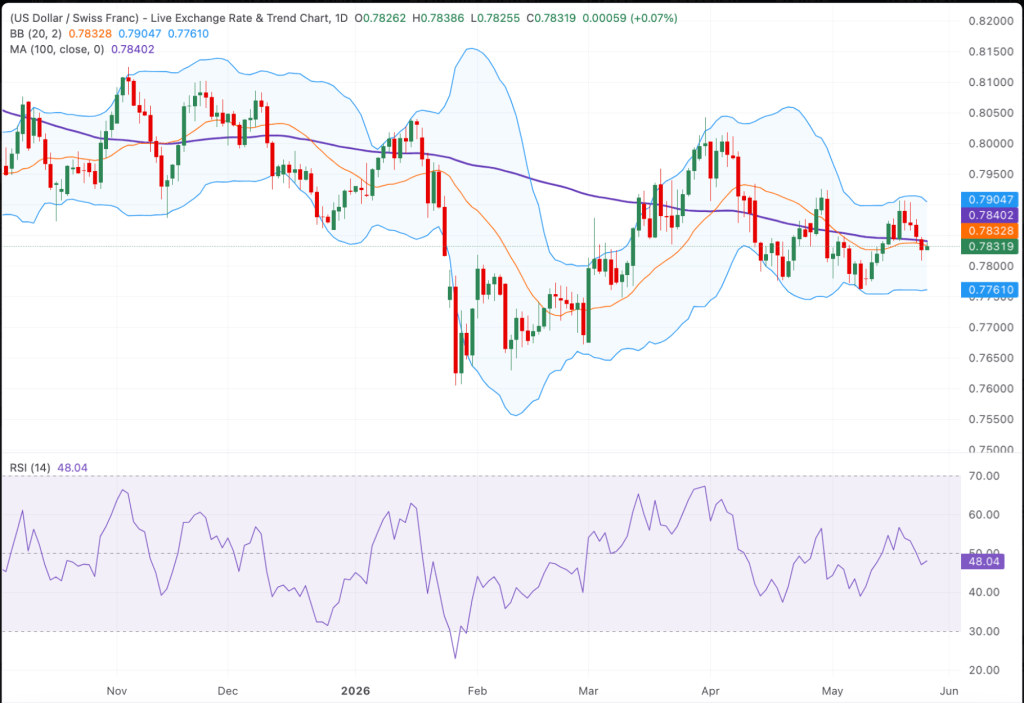


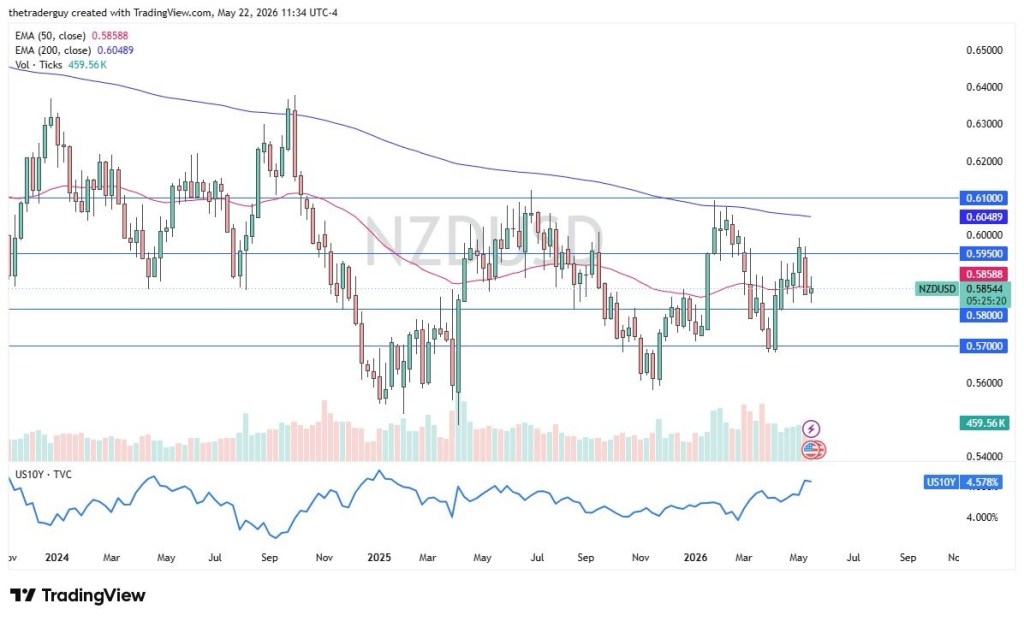
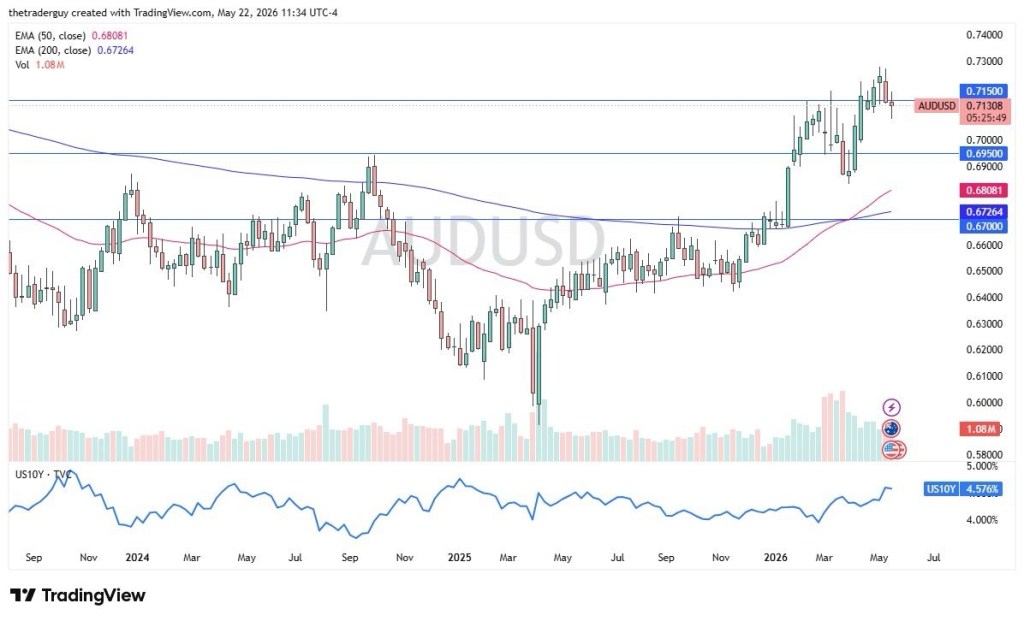
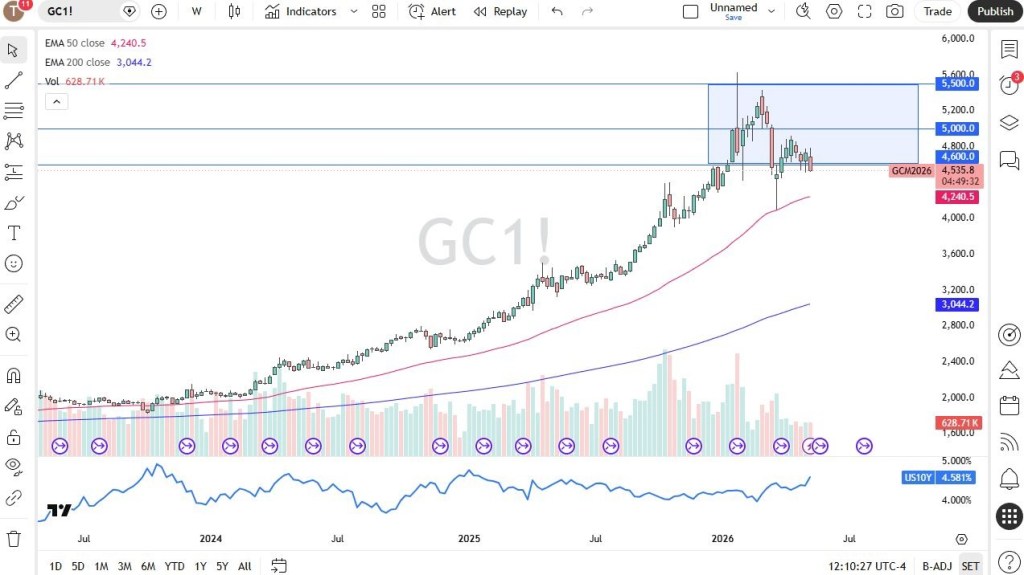
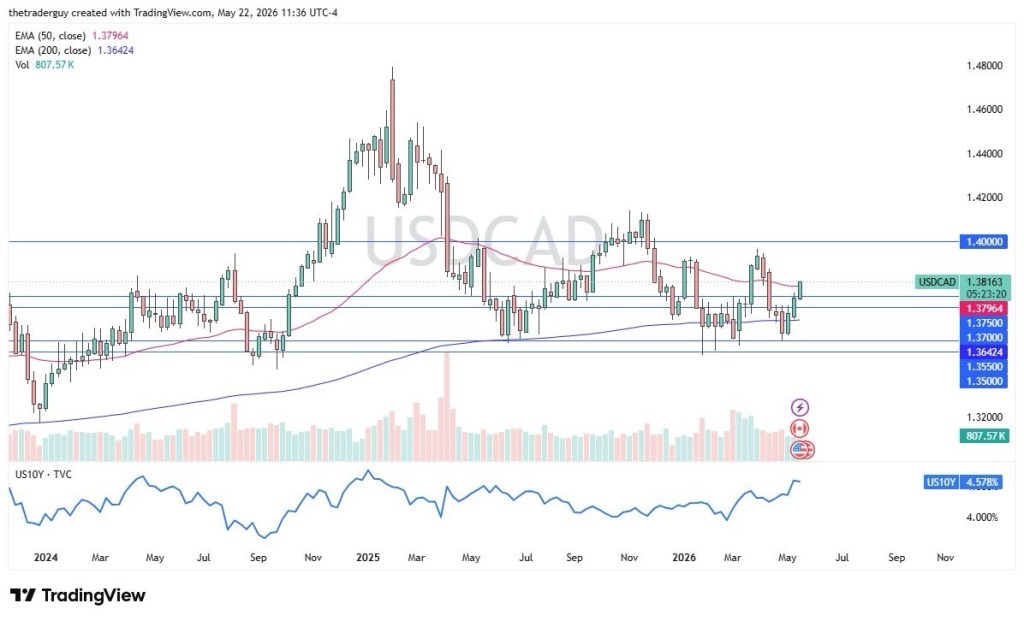
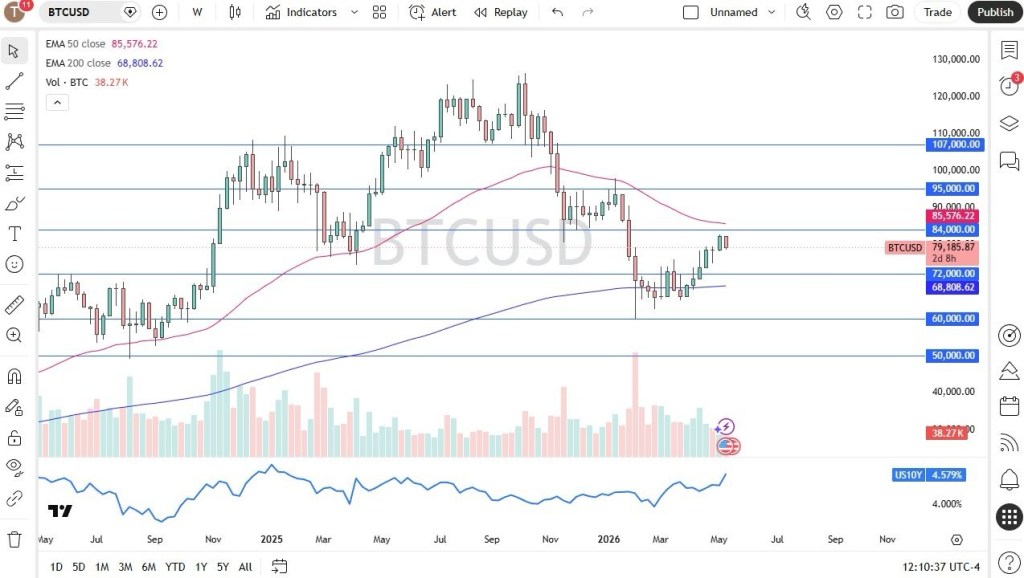
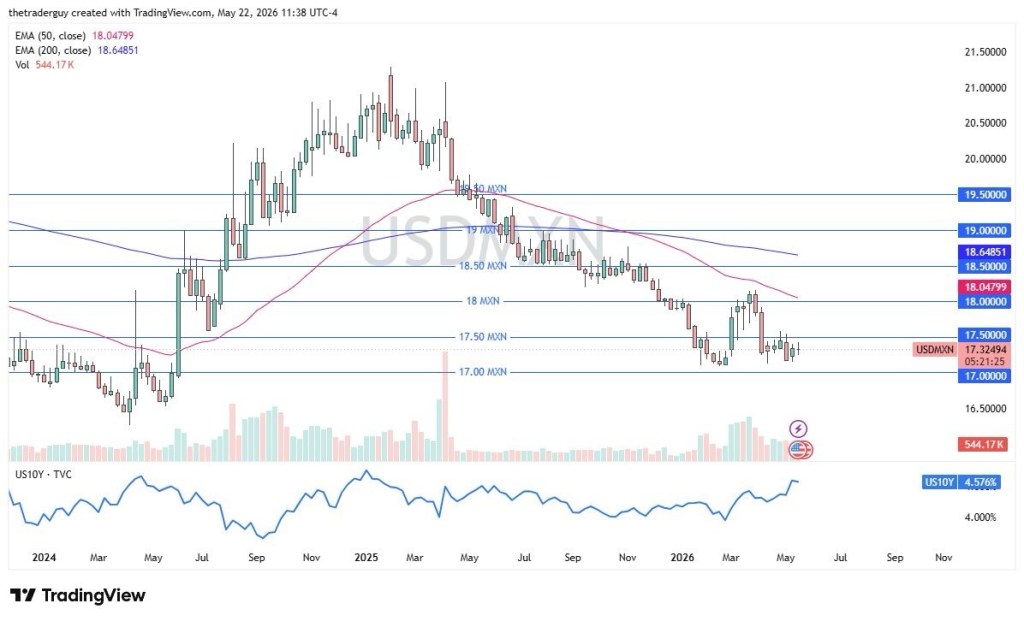
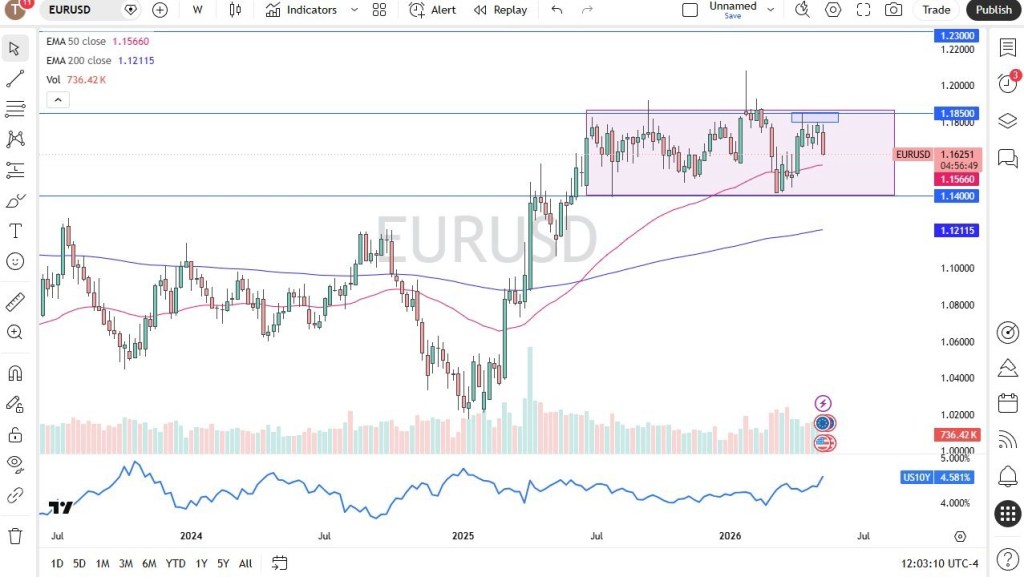
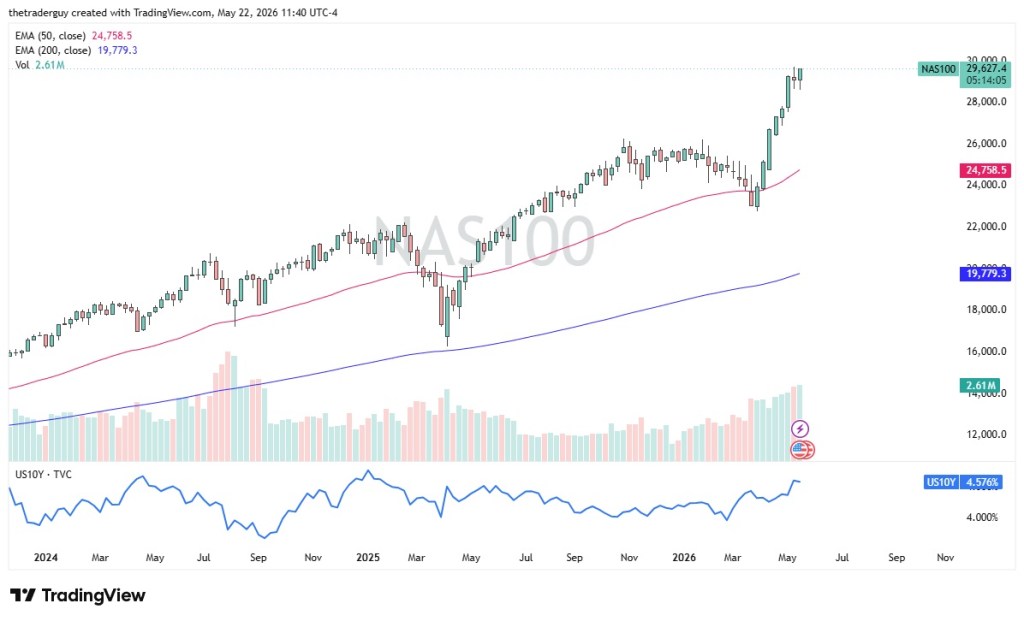


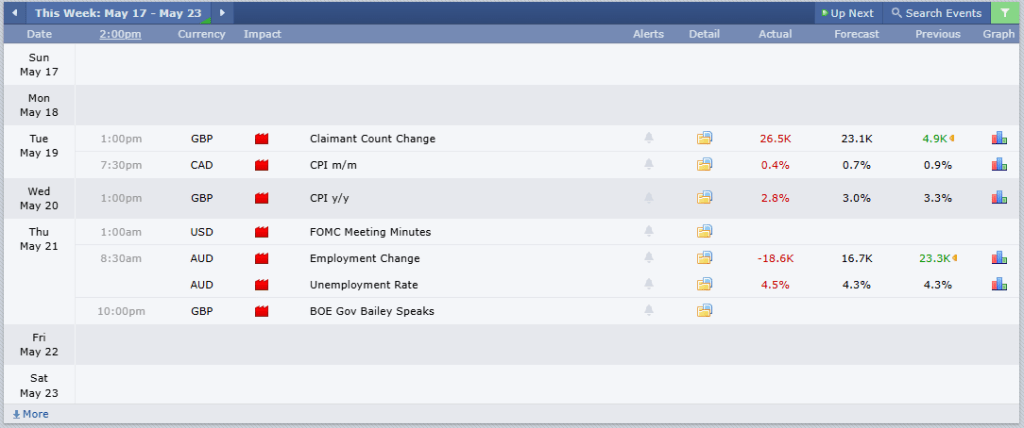
 — OpenAI (Private Valuation)")