Silver extends its decline for a second consecutive session, having fallen in three of the last four trading days. The break below the 200-day EMA during the previous session provided a fresh bearish signal for XAG/USD. With technical indicators continuing to favor sellers, the metal could remain under pressure and move toward a retest of its March swing low.
Silver (XAG/USD) remains under pressure for a second consecutive session, slipping to its weakest level since March 23 during Wednesday’s Asian trading hours. The precious metal is trading near $64.35–$64.30, down more than 1.5% on the day, with bearish sentiment continuing to weigh on prices.
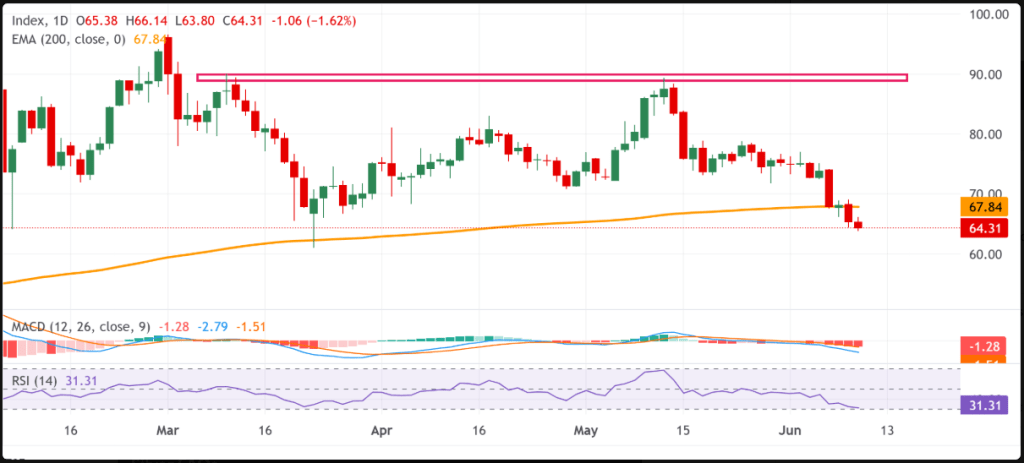
A series of unsuccessful attempts to break above the $89.00 area has resulted in the formation of a bearish double-top pattern. Further strengthening the negative outlook, silver closed below its 200-day Exponential Moving Average (EMA) overnight for the first time since April 2025, providing a fresh bearish signal for market participants.
Technical indicators continue to favor the downside. The Relative Strength Index (RSI) stands at 31.31, hovering just above oversold conditions, suggesting that sellers remain in control even though a brief corrective rebound cannot be ruled out. Meanwhile, the Moving Average Convergence Divergence (MACD) remains in negative territory at -1.28, highlighting sustained downward momentum.
Given this setup, a break below the $64.00 level could pave the way for a decline toward the next support zone around $63.35–$63.30. If bearish momentum persists, silver may extend its losses further and potentially revisit the March swing low near $61.00 in the coming weeks.
On the upside, the 200-day EMA at $67.84 represents the first significant resistance level. A daily close above this barrier would be required to reduce bearish pressure. Until such a move occurs, technical conditions continue to indicate that the path of least resistance for XAG/USD remains lower.
Silver Daily Chart

Leave a comment