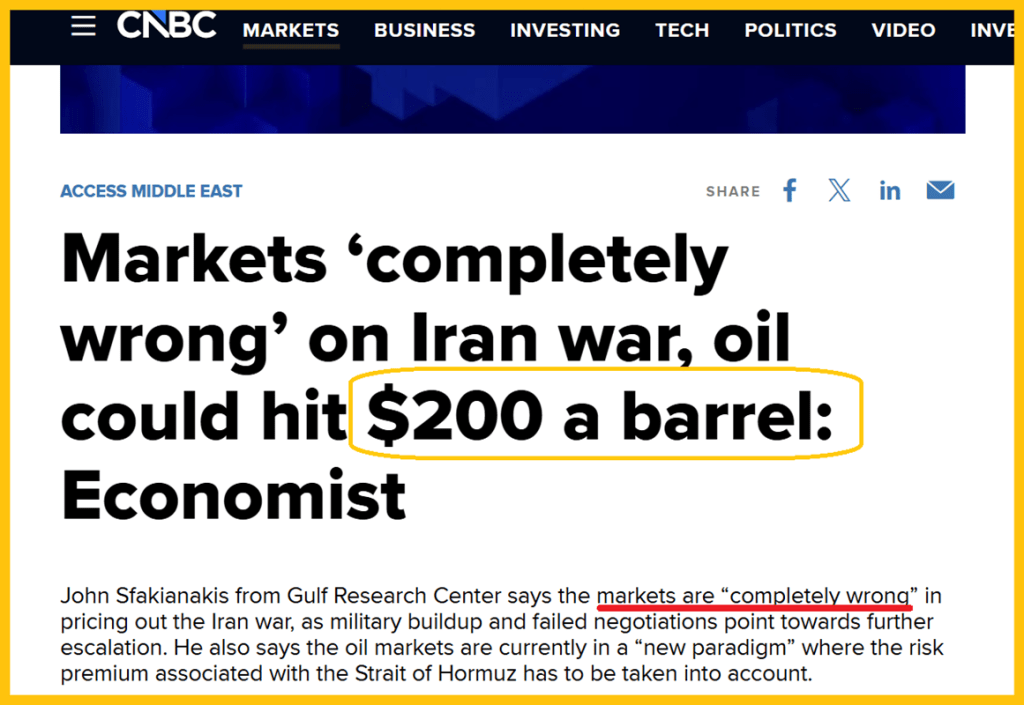
Could markets be misjudging both oil and the war, as this analyst argues?
Possibly—but what about the relationship between oil and gold? The mainstream narrative suggests that surging oil prices are a bearish signal for gold, based on claims that “gold yields no interest” and that “the Fed might raise rates by a quarter point (though it’s unlikely), while real inflation runs near 15%,” leading to the conclusion that “gold should decline sharply against fiat currencies.”
Western analysis of oil, war, and gold is deeply troubling—arguably even reprehensible. It feels like something straight out of a Nineteen Eighty-Four… except it’s happening in reality.
A closer look at currency market dynamics suggests that as interest rates rise, the heavily indebted U.S. government faces increasing borrowing needs to sustain its finances. This pressure can lead to policies that shift the burden beyond its borders, affecting global economic stability.
History offers parallels—such as Ancient Rome—where excessive debt strained state behavior and credibility. Some argue that similar pressures are emerging in modern fiscal systems.
In simple terms, critics of fiat systems view government-issued currency as vulnerable to mismanagement, while seeing gold as a more reliable store of value for individuals worldwide.
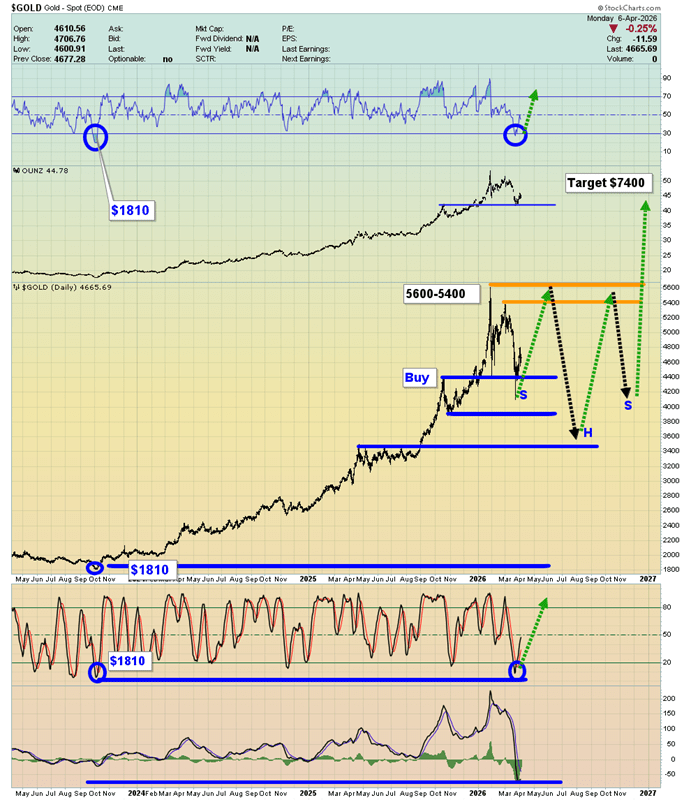
What are the most attractive price levels for investors to accumulate more gold? Looking at the daily chart, the $4,400 range previously acted as a strong buying zone, while $4,100 represented a secondary level of support.
That said, investors may benefit more from focusing on time rather than precise price points. If gold trades within a range for the rest of the year, a disciplined accumulation strategy—such as monthly purchases (or weekly for more aggressive investors)—could be more effective.
Time-based buying helps reduce the emotional stress of trying to predict short-term price movements, which often leads to cycles of fear and greed.
Ultimately, steadily increasing gold holdings may matter more than timing the exact entry. Still, from a price perspective, the $5,600, $3,900, and $3,500 levels could all serve as attractive accumulation zones if the market pulls back.
If gold were to climb into the $6,500–$7,500 range, then $5,600 could become a particularly significant support level—potentially one of the most important in the market’s history. From there, some bullish scenarios suggest the possibility of a powerful rally toward $15,000–$20,000.
Such dramatic price action would likely require major catalysts—such as sustained inflation, escalating debt pressures, geopolitical instability, or a significant loss of confidence in fiat currencies.
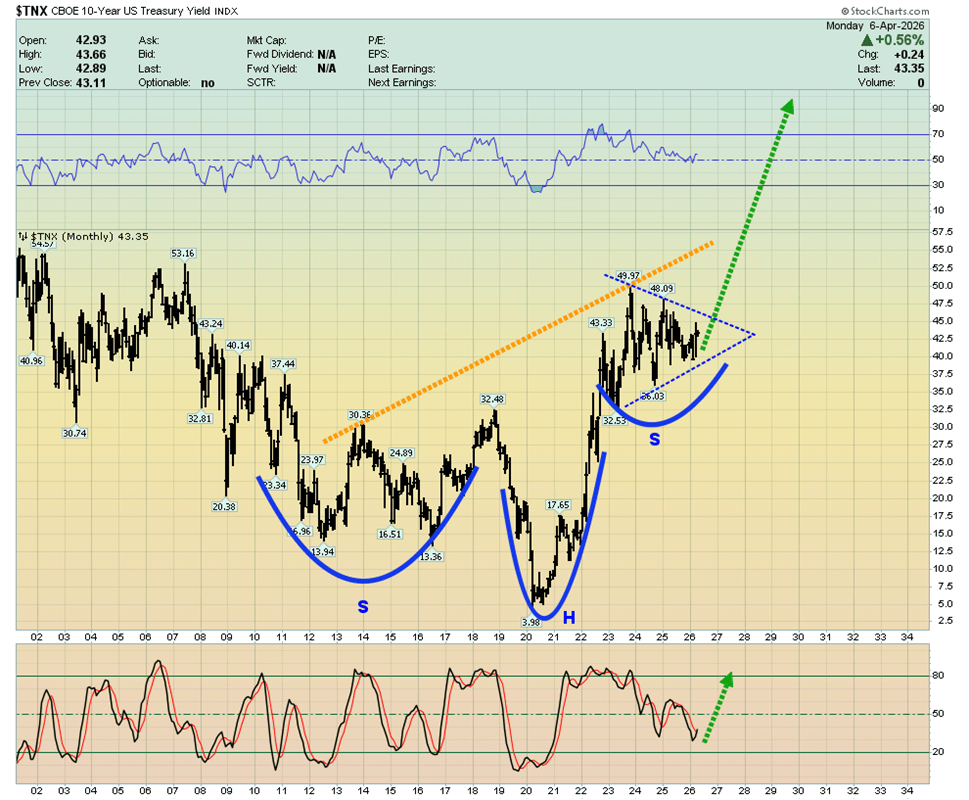
The U.S. interest rate chart is drawing attention, with what appears to be a large inverse head-and-shoulders pattern suggesting a potential move toward the 7%–8% range.
At the same time, many argue that the real inflation experienced by average Americans may be closer to 8%–15%, higher than official figures. If that view gains traction, the prevailing institutional narrative—where rising rates are seen as negative for gold—could shift.
Instead, rising rates might come to be interpreted as a signal that inflation is persistent and that government financing pressures are intensifying. In that scenario, investors could increasingly turn to gold, viewing it as a hedge and continuing to accumulate it over time.
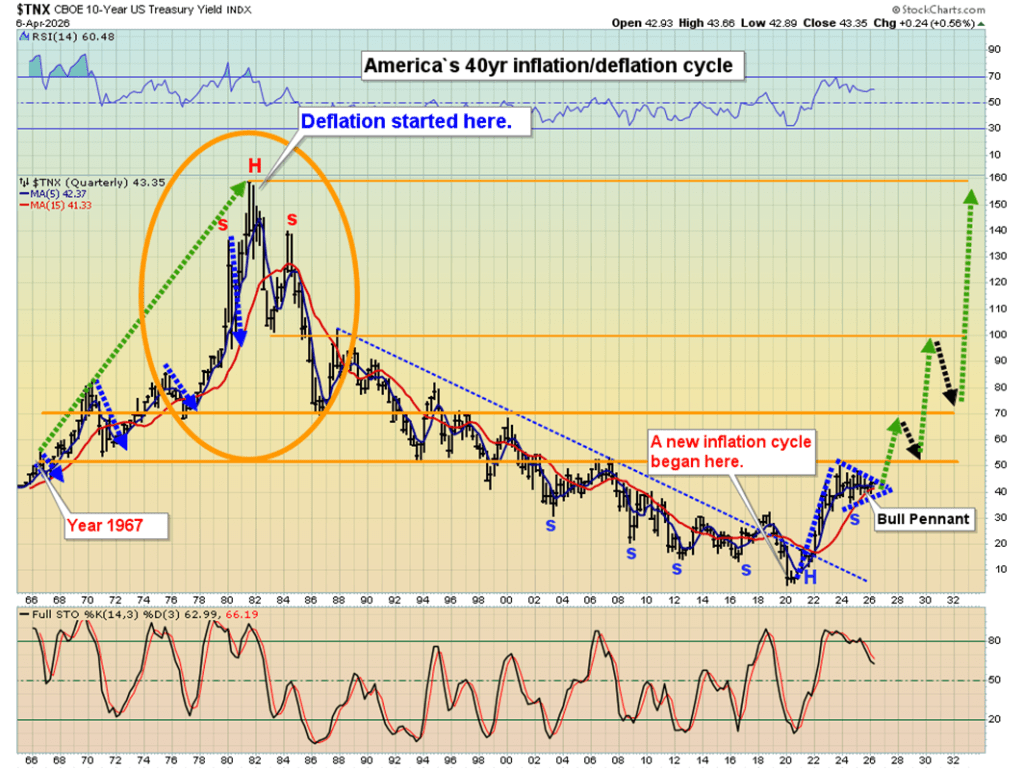
A long-term view of the 40-year U.S. inflation–deflation cycle suggests that policy shifts could have major consequences. If a future Fed leader—such as Kevin Warsh—were to scale back quantitative easing, government borrowing pressures would likely remain.
Even without aggressive rate hikes from the Federal Reserve, market forces themselves could push interest rates higher.
For investors, maintaining a focus on the broader macro picture is essential. Key factors shaping the landscape include inflation trends, tariffs, geopolitical tensions, elevated equity valuations, debt ceiling challenges, and potential shifts in global economic leadership.
Critics argue that instead of implementing significant spending cuts, policymakers have relied on measures like tariffs, which may contribute to inflationary pressure. At the same time, rising fiscal deficits and geopolitical risks could undermine confidence in government bonds, prompting central banks and institutional investors to reduce their holdings.
This dynamic may create a feedback loop: higher debt levels, rising borrowing costs, and declining bond demand reinforcing one another.
In that context, some bullish perspectives suggest that gold could see substantial long-term gains, while interest rates could continue trending higher—though projections as extreme as $20,000 gold or 20% rates remain highly speculative and dependent on extraordinary economic conditions.
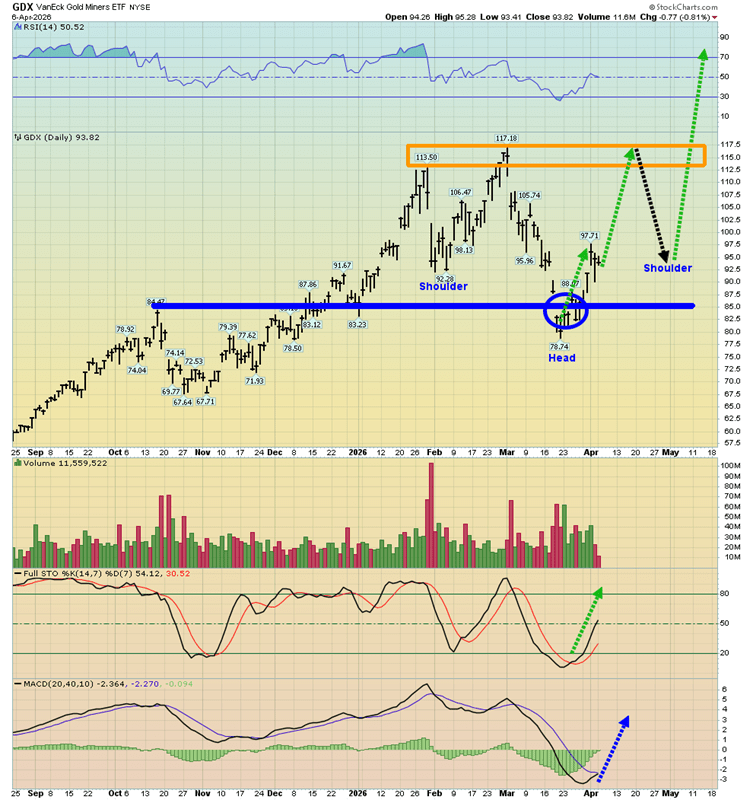
And what about the miners? The GDX chart looks particularly impressive, with a clear inverse head-and-shoulders pattern forming. The head developed around the critical $85 support level, where the 14,7,7 Stochastics oscillator also signaled a bottom.
After a brief two-day pullback, price is now hovering near $92—potentially setting up as a springboard for the next upward move. At the same time, a broader buy signal from the 20,40,10 MACD indicator appears to be on the verge of triggering—possibly as soon as today.
Sources: Stewart Thomson

Leave a comment