Mainstream media reports that the dollar is strengthening, attributing the move to rising oil prices. But is that explanation accurate?
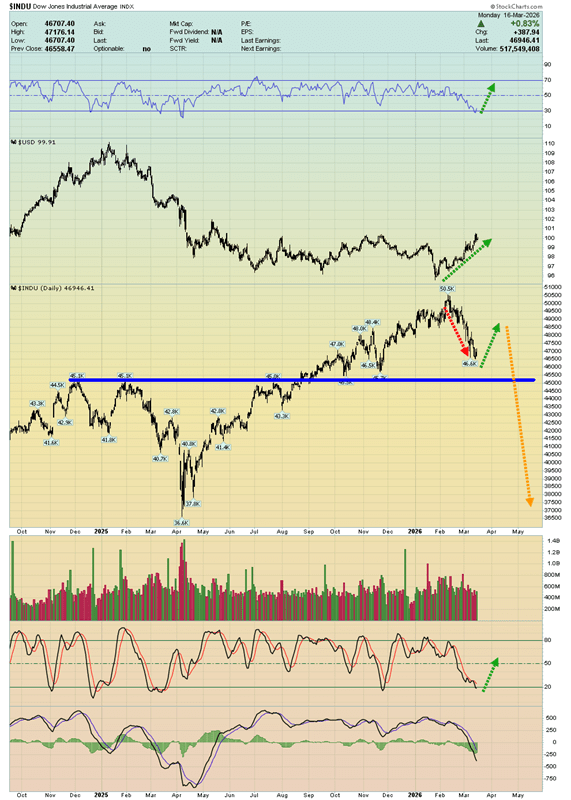
The dollar’s strength is more likely tied to the sharp downturn in an overvalued U.S. stock market.
As equities slide, investors appear to be retreating into cash, driving demand for the dollar. Meanwhile, both major political parties continue to present the stock market as a key symbol of economic health, while commentators push for aggressive rate cuts—even as inflation risks remain elevated.
Such cuts could erode returns for retirees and savers, but may help prop up equities and prevent a collapse reminiscent of 1929, while also enabling the government to take on significantly more debt.
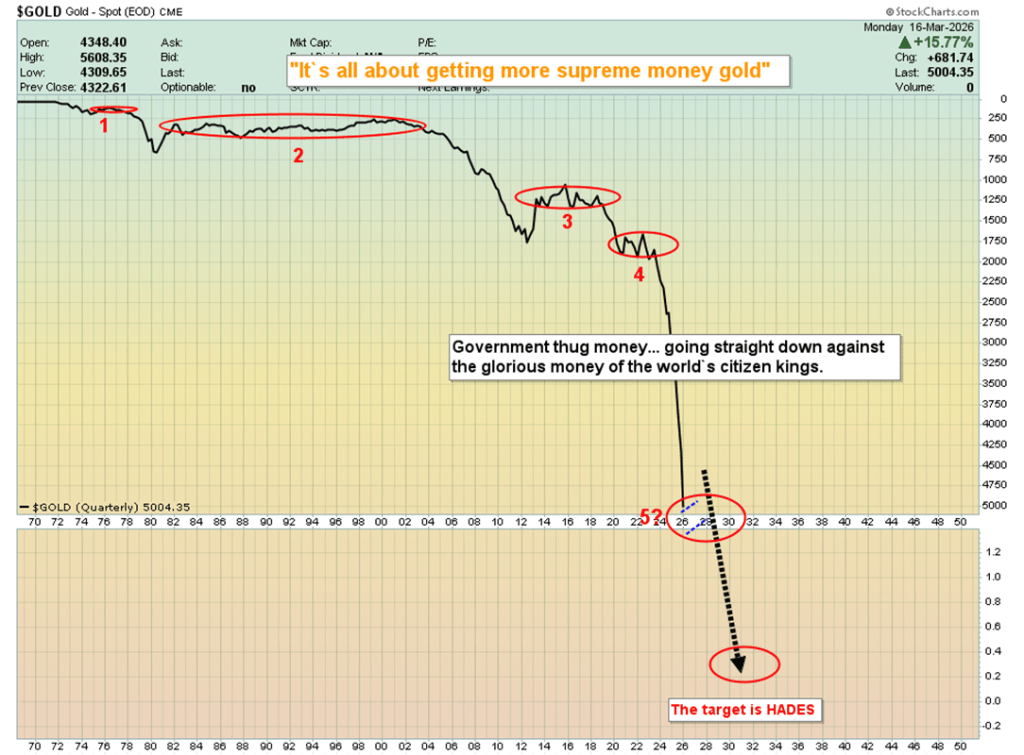
A broader perspective challenges the idea of a strong dollar rally. Viewed against gold over the long term, the dollar shows little real strength, with fiat currency appearing to be on a prolonged path of decline.
The persistent rise in the cost of essentials—such as food, housing, and transportation—is often linked to government reliance on fiat money. In this view, the long-term impact of fiat systems has been deeply damaging to citizens, rivaling the economic harm typically associated with major conflicts.
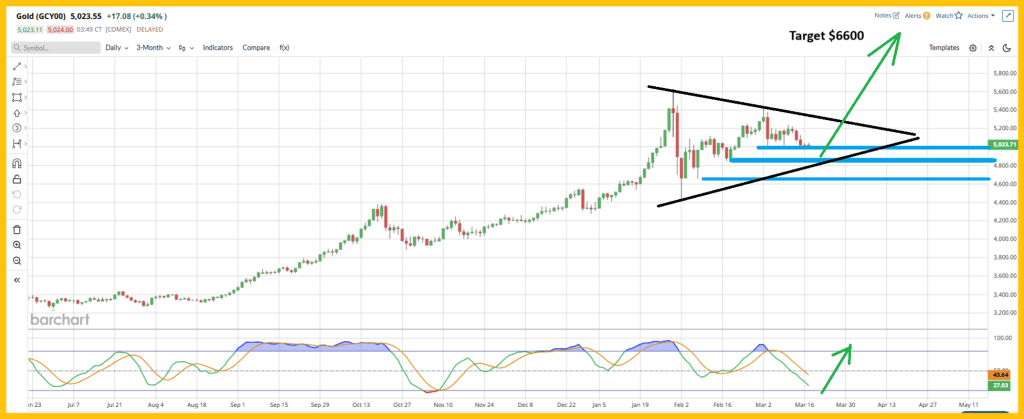
The argument here is that investors should consistently build positions in gold, taking advantage of key price zones such as $5,000, $4,850, and $4,650 to accumulate not only gold, but also silver and mining stocks.
From a technical perspective, momentum indicators like the Stochastics (14,7,7) are نزدیک oversold levels, and a dip toward $4,850 could help form a large bullish triangle pattern, with a potential upside target around $6,600.
In the near term, attention is on upcoming data and policy decisions—specifically the PPI report and the Federal Reserve’s rate announcement. With oil prices having surged significantly, the Fed may face challenges in addressing inflation while balancing pressure to support the economy. Policymakers could frame inflation as temporary, despite it remaining above their long-term target.
For long-term gold investors, however, the focus is less on short-term central bank actions and more on identifying attractive entry points to steadily accumulate precious metals and quality mining equities.
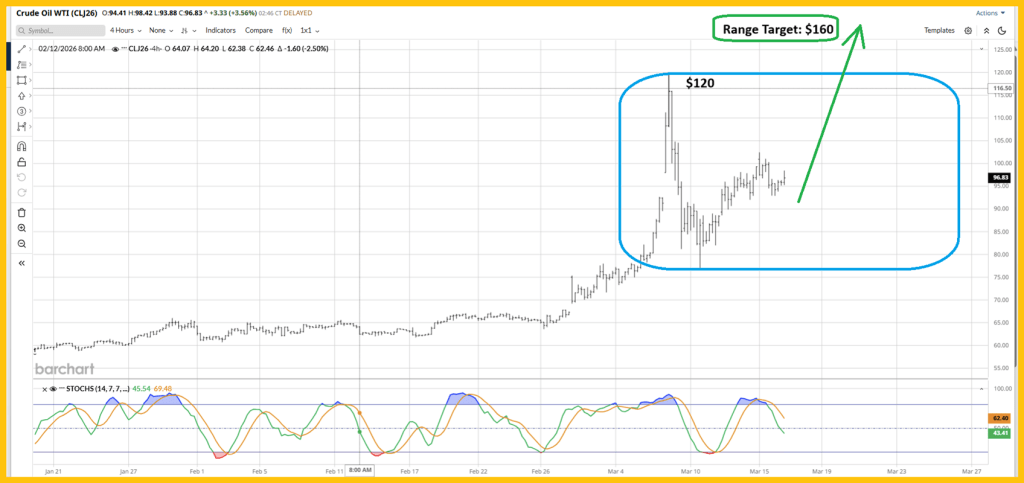
What about oil? The U.S. is aggressively trying—while piling on more debt—to contain the attacks around the Strait of Hormuz, and a positive headline could emerge within the next couple of weeks.
That could act as a catalyst for the stock market rally I’m expecting (including gold equities). Still, oil appears stuck in a wide $80–$120 range for now, though the odds favor an upside breakout, potentially driving prices toward $160.
The key point is this: oil production and transportation infrastructure across much of the Middle East has likely suffered meaningful damage, and restoring full capacity could take years.
As for Venezuela stepping in to offset the shortfall, that seems unlikely in the near term. Despite political maneuvering, international oil companies will likely expand production there very cautiously.
In short, $80 may now represent a structural floor for oil prices. If so, inflation floors—across CPI, PPI, and PCE—could settle in the 4%–5% range, or even higher.
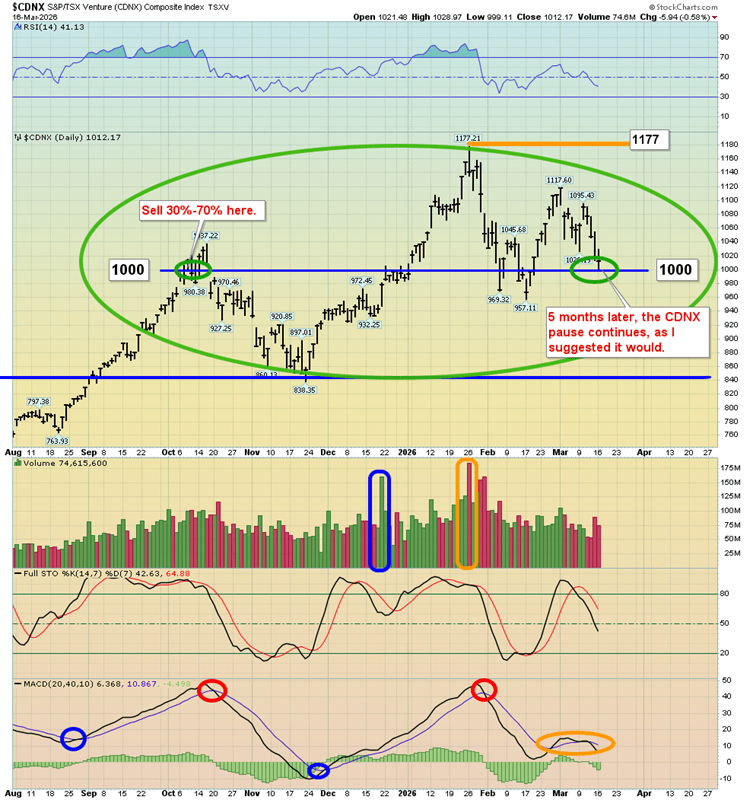
What about miners? The CDNX hasn’t made any meaningful progress since I flagged a profit-taking opportunity five months ago at the key psychological resistance level around 1000.
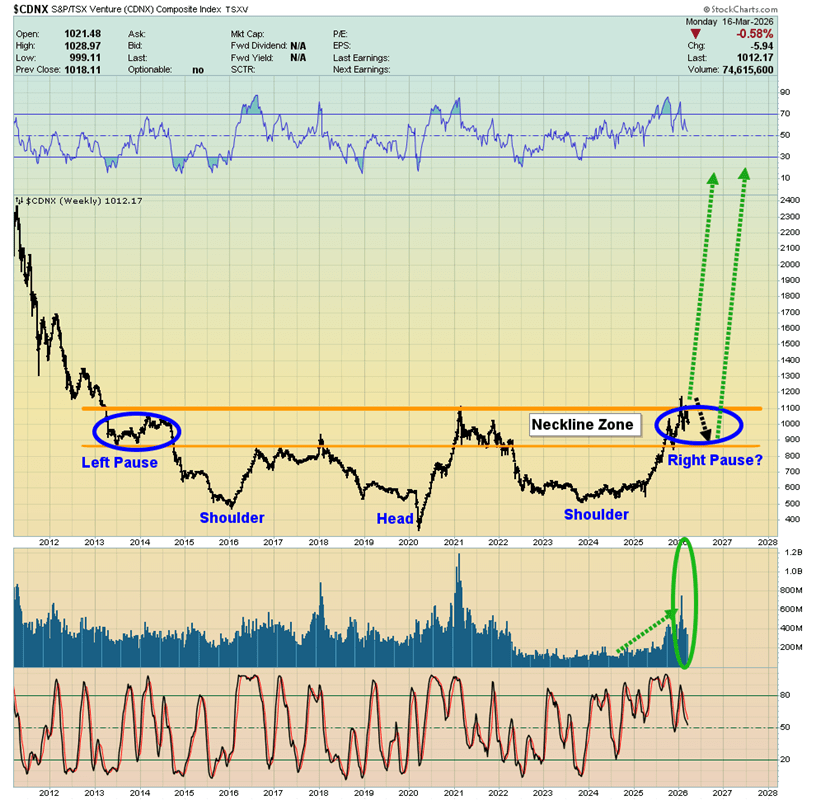
From a technical standpoint, this consolidation phase could persist into the fall, potentially forming a highly bullish, symmetrical structure on the chart.
In the meantime, gold stock investors should use this period to properly organize their allocations—positioning themselves to patiently ride out the lull and ultimately capitalize on the powerful breakout and multi-year advance that is likely to follow.
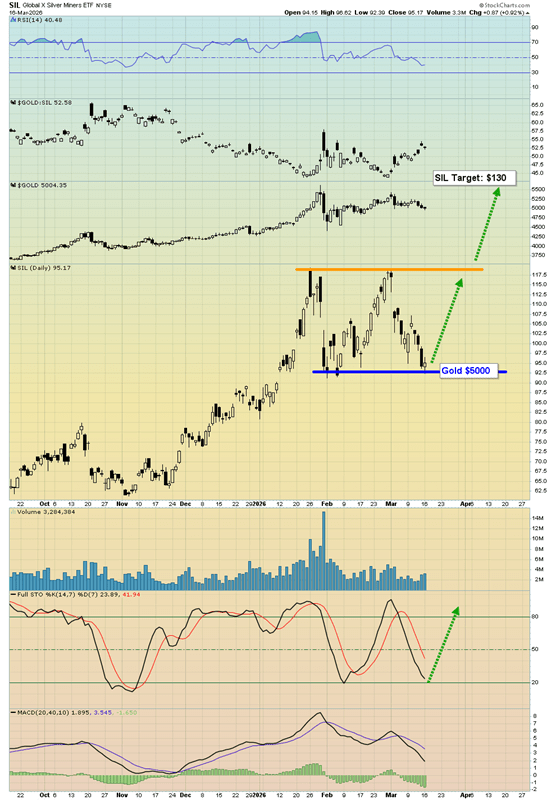
The chart for SIL (the silver miners ETF) remains bullish. Based on classical charting principles from Edwards & Magee, rectangle patterns tend to break to the upside about 67% of the time, implying a potential target near $130.
Rather than trying to pinpoint an exact bottom, investors are better off identifying strong accumulation zones—like the current one—and buying incrementally. A gold price of $5,000 aligns with roughly $92 for SIL, while additional positions in GDX, SIL, and related mining stocks could be added if gold dips toward $4,850.
With governments globally becoming increasingly debt-driven, the macro backdrop remains chaotic. In that environment, gold, silver, and mining investors can stay on the sidelines of the noise and focus instead on taking advantage of attractive entry zones.
Sources: Stewart Thomson

Leave a comment