The Chinese Spring Festival (Chinese New Year) holiday is now underway, a period that has historically coincided with softer fiat-denominated gold prices.
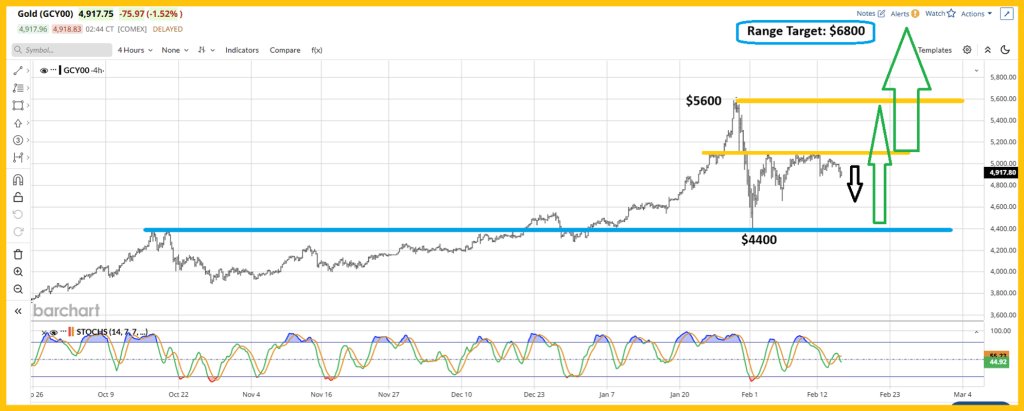
Meanwhile, gold is carving out a consolidation range between $4,400 and $5,600. The longer price action remains compressed within this band, the more constructive the setup becomes.
Extended consolidation typically builds pressure — increasing the probability of an eventual upside breakout and a potential rally toward $6,800.
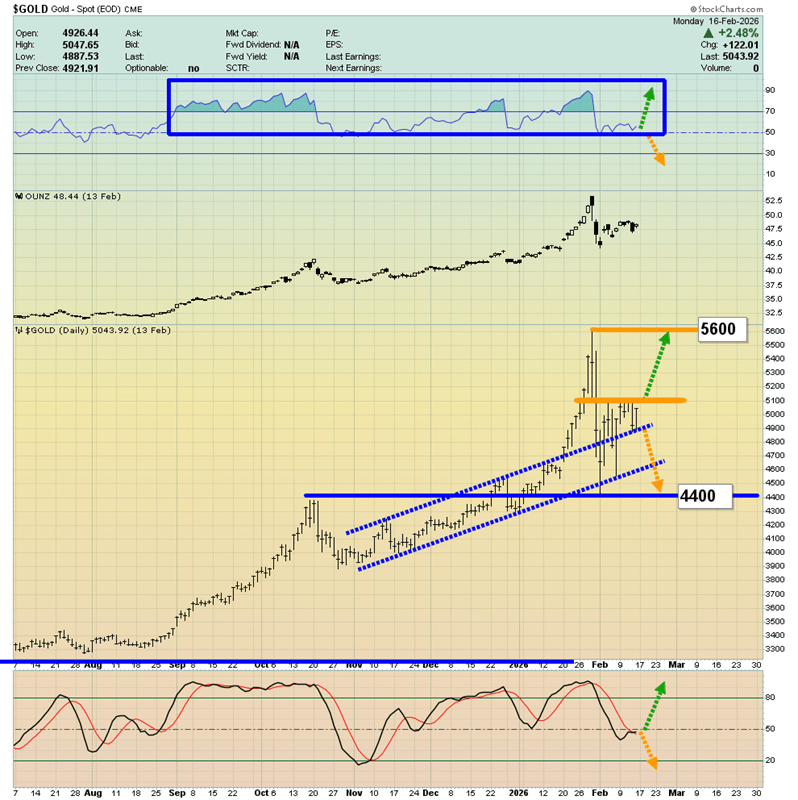
Here’s another perspective on the price action. Notice the channel outlined by the dotted blue trendlines.
Gold has broken decisively above that channel and now seems to be digesting the move, consolidating gains after the breakout.
Seasonal softness across the metals complex could linger until the Chinese holiday concludes. For enthusiastic Western gold investors, this pullback phase may present an opportunity to increase exposure to gold, silver, and mining equities.
I’ve outlined what I call an emerging “gold bull era,” driven less by Western fear-based demand and more by the structural economic ascent of China and India—an expansion powerful enough to overshadow the West’s traditional crisis trade.
This new phase could also unfold alongside rapid automation, with hundreds of millions of robots taking on work that inflation-strained populations—both East and West—are increasingly burdened by.
In such an environment, widespread income support could evolve into significantly higher baseline incomes, and gold-oriented Asian consumers may expand their purchases well beyond already robust levels.
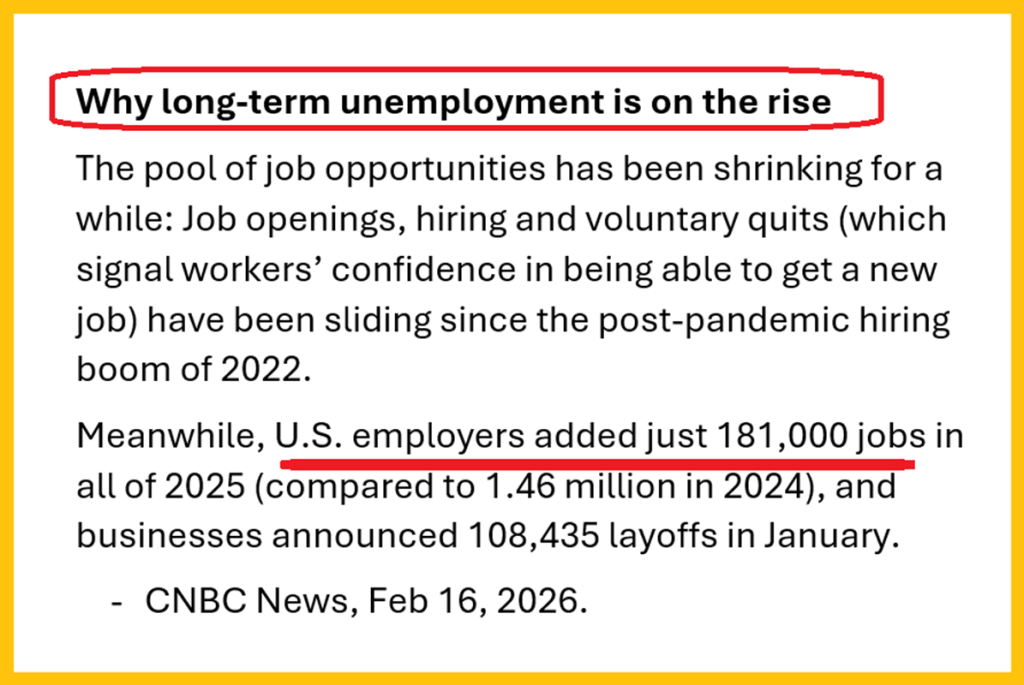
In the West, the backdrop looks increasingly fragile. Job growth in 2025 has been minimal, with the latest ADP data showing only around 22,000 positions added in January.
By contrast, the official government report showed a gain of 130,000 jobs. That wide gap raises questions—either the data contains significant distortions, or much of the hiring is concentrated in government roles funded by expanding public debt.
The core fear-trade argument is straightforward: if private-sector job creation continues to stall while debt-financed employment props up the headline numbers, underlying economic weakness may deepen.
Unless productivity gains from automation are formally reflected in economic measurements, the strain between slowing human employment and rising fiscal burdens could intensify.
For investors focused on hedging systemic risk, the question becomes familiar: is your portfolio positioned with assets designed to weather instability?
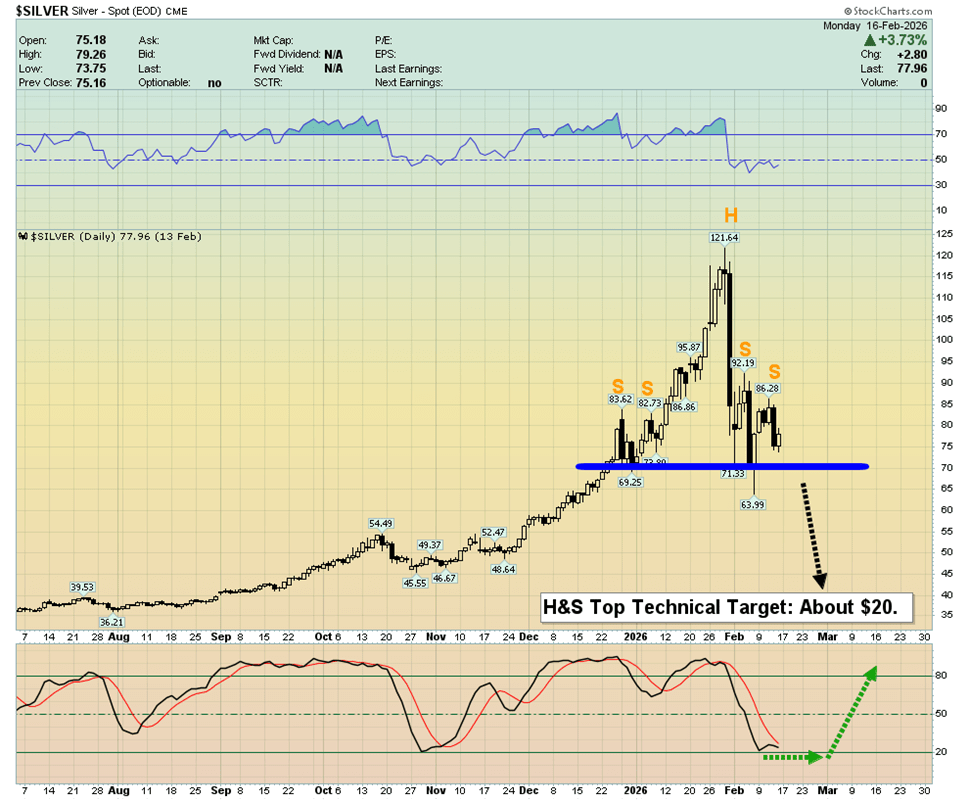
How about silver? The head-and-shoulders top currently forming is a bearish technical pattern pointing toward the $20 area. What might invalidate this setup?
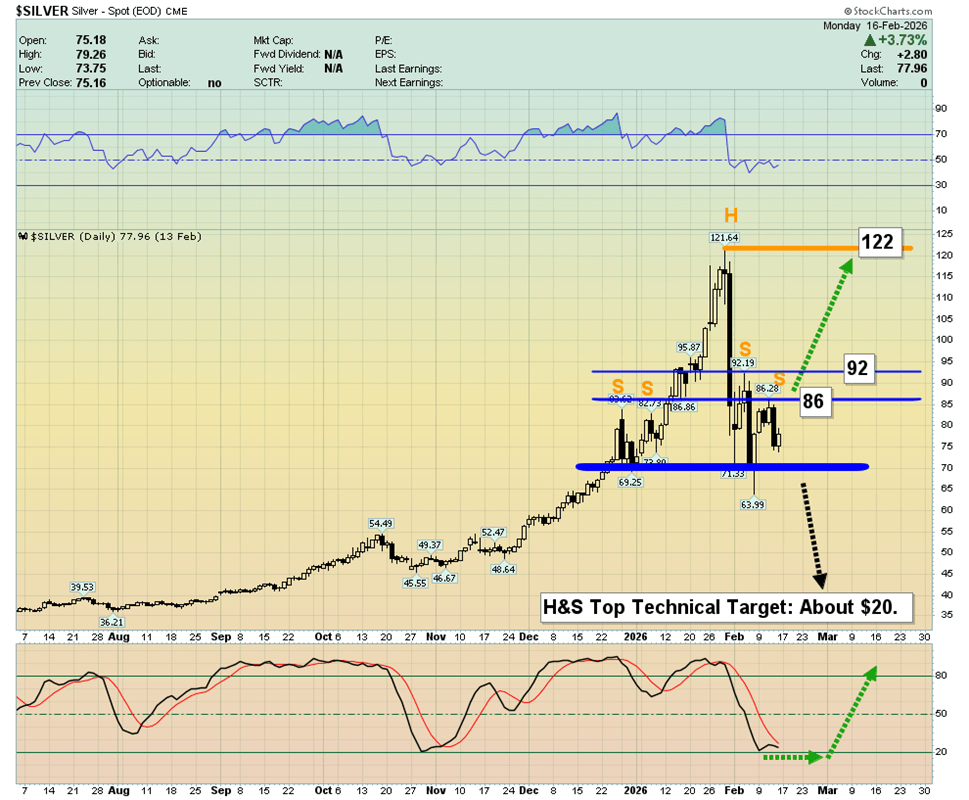
A rally to $87 would push silver back above three of the shoulders in the formation. An additional climb to $93 would fully invalidate the pattern and deal a severe blow to heavily leveraged bears.
Being a pure silver bug—someone almost entirely invested in silver—demands serious conviction and resilience. For the average investor newly drawn to this remarkable metal, it’s wise to keep ample cash on hand to take advantage of unexpected price pullbacks.
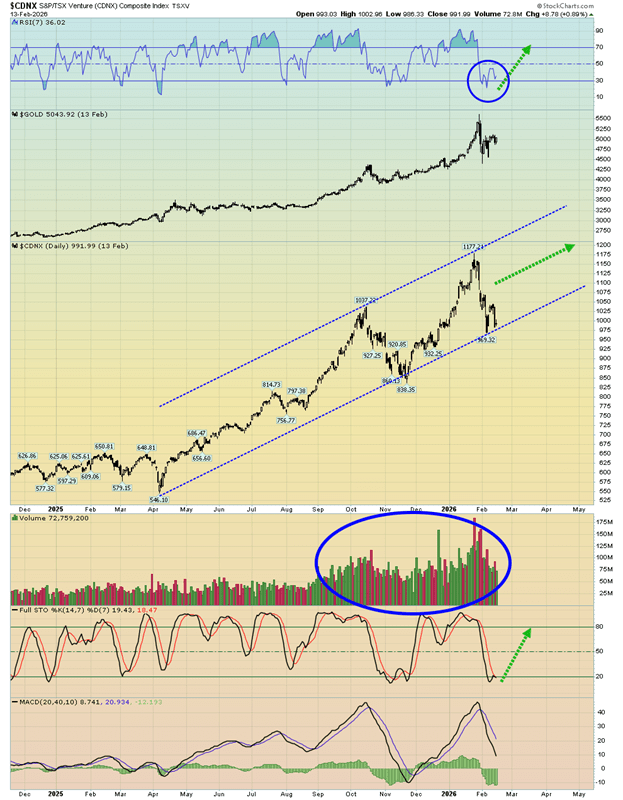
What about the miners? On the CDNX daily chart, the RSI and Stochastics are showing positive signals, but the key 20,40,10 MACD is still sluggish and lacking momentum. If that indicator begins to strengthen, the uptrend in junior mining stocks should pick back up.
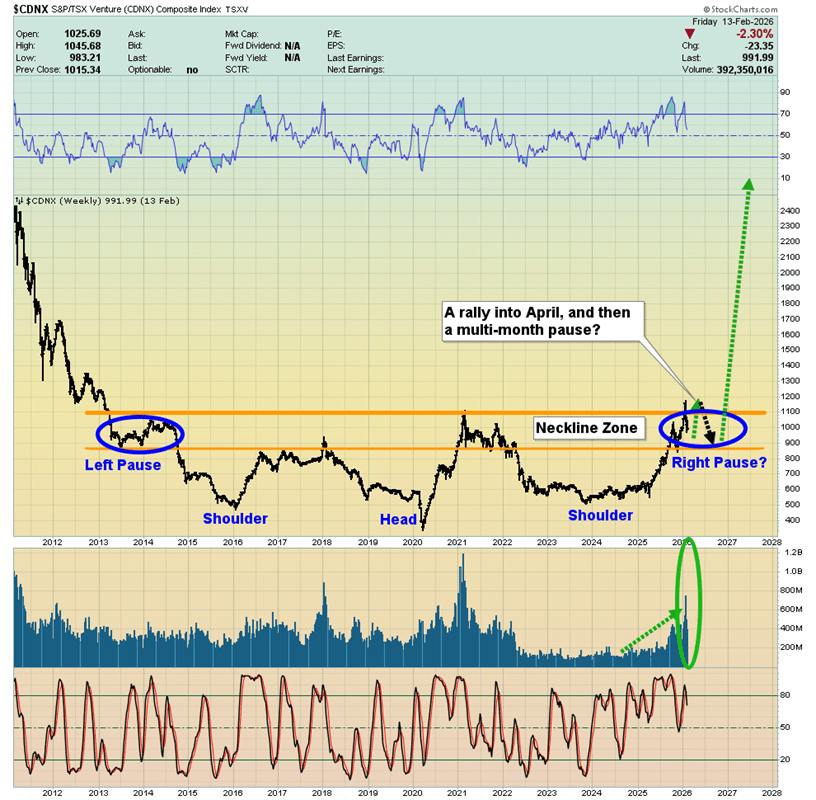
The CDNX weekly chart looks impressive. The base formation is strong and likely signals further upside not only for juniors, but also for intermediate and senior mining companies.
The most probable near-term outlook is a brief pause as Chinese investors step back for the New Year holiday, followed by a solid rally into April for the mining sector. After that, a seasonal consolidation through the summer seems likely, before a powerful, decisive breakout above the 1177 highs.
In the meantime, many individual mining stocks could “front-run” the CDNX, advancing to fresh highs ahead of the broader index.
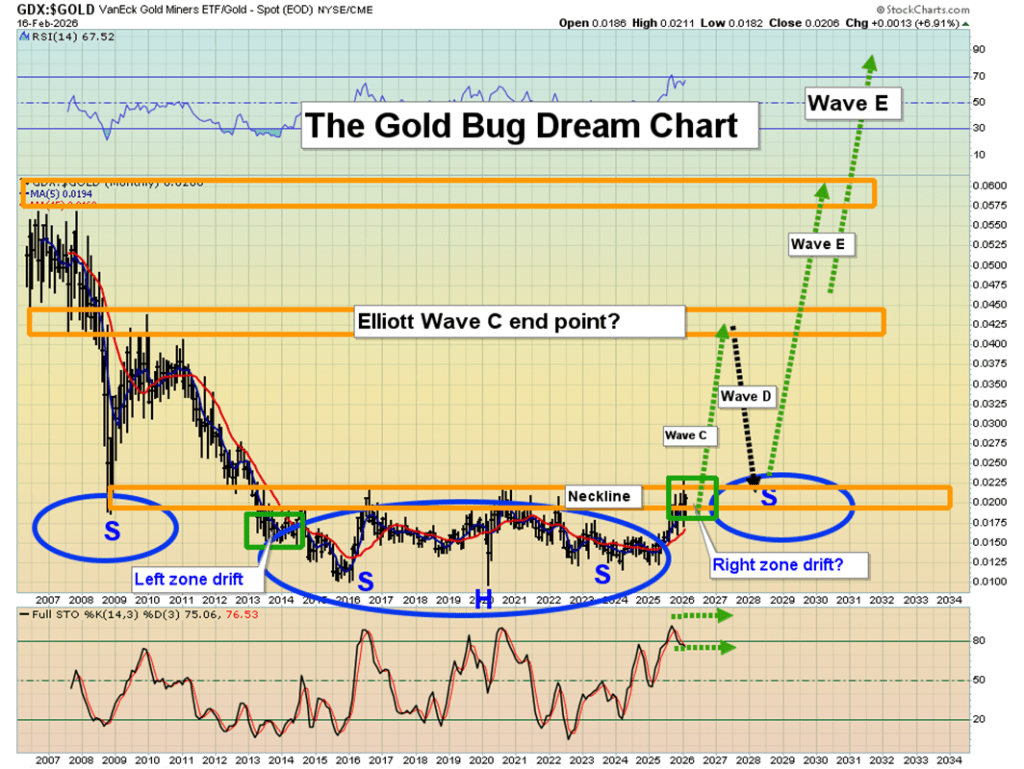
Looking at the long-term chart of the VanEck Vectors Gold Miners ETF versus gold, mining stocks appear strikingly undervalued—arguably the cheapest sector relative to its underlying asset in modern market history.
The encouraging part is that this imbalance may be only months away from correcting through the only reset that truly counts: a major revaluation of gold equities relative to gold itself.
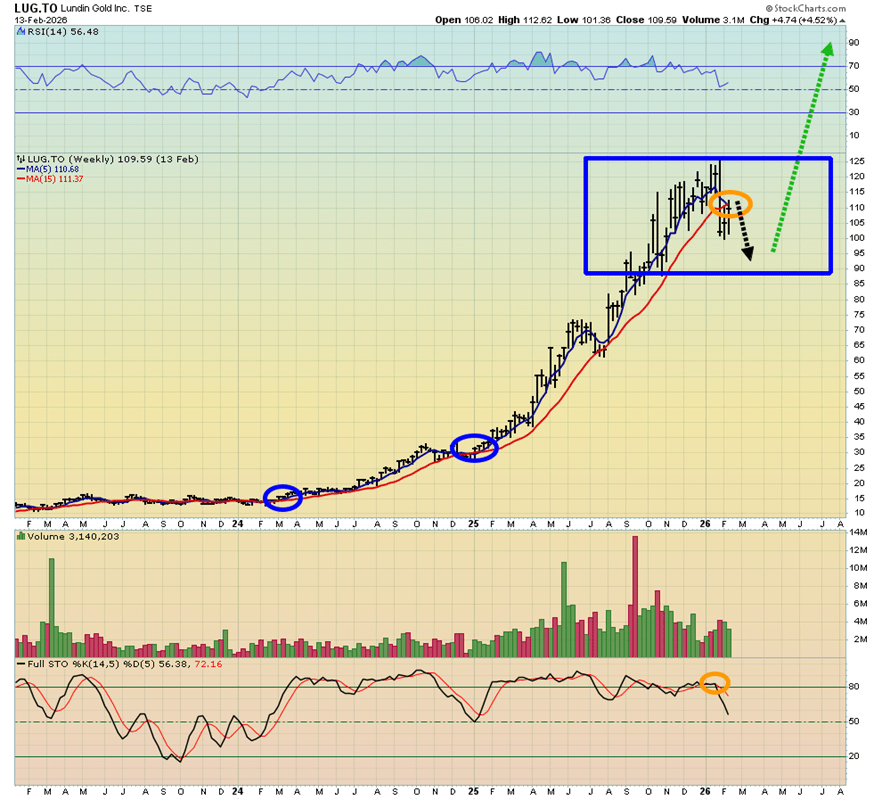
The weekly chart of Lundin Gold is particularly compelling. While most gold producers report all-in sustaining costs (AISC) below $2,000 per ounce—and silver producers around $20—Lundin’s AISC is closer to $1,000, underscoring its strong cost position. Still, even the most efficient miners require periodic technical pauses. The behavior of the key 5 and 15 moving averages highlights these natural consolidation phases.
Pullbacks across the mining sector—both juniors and seniors—can offer strategic entry points, especially as gold continues to consolidate following its broader fundamental breakout.
Some investors even speculate that the fiat price of gold could eventually exceed that of Bitcoin, viewing bitcoin primarily as a liquidity vehicle to accumulate more gold. Over time, rising global demand—particularly from China—could further reinforce gold’s long-term appeal.
Sources: Stewart Thomson

Leave a comment