- Solana extended its sell-off on Monday after posting a decline of more than 15% in the previous week.
- Derivatives data continues to reinforce the bearish move, with short positioning increasing and funding rates turning negative.
- From a technical standpoint, a decisive close below $100 would likely open the door to a deeper correction.
Solana (SOL) extended its correction on Monday, trading below $100 after shedding more than 15% the previous week. The bearish price action is reinforced by derivatives indicators, which show increasing short positions and negative funding rates. From a technical perspective, a daily close below $100 could pave the way for a deeper correction in SOL.
Derivatives data points to a deeper correction
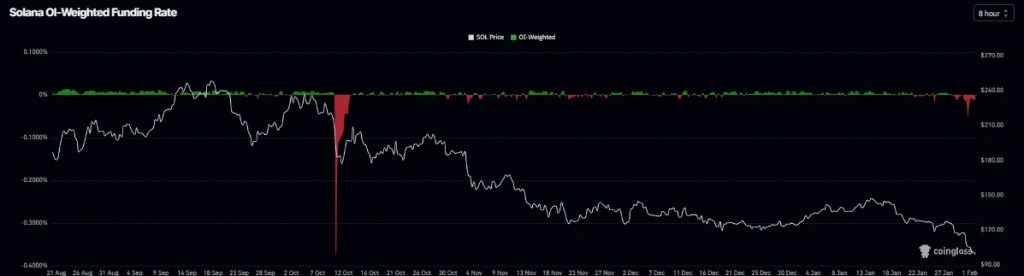
Derivatives data for Solana continues to support a bearish outlook. Coinglass OI-weighted funding rate data indicates that traders positioning for further downside in SOL now outnumber those expecting a rebound.
The metric turned negative on Saturday and stands at -0.0080% as of Monday, meaning short positions are paying longs—a clear signal of bearish sentiment toward Solana.
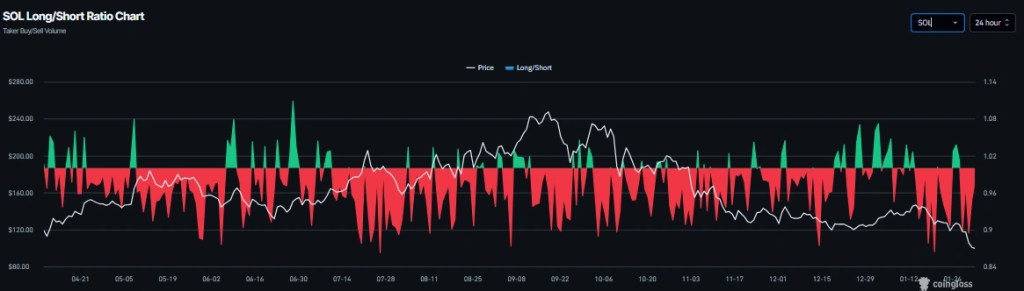
Additionally, Coinglass’s long-to-short ratio for SOL stood at 0.97 on Monday. A reading below 1.0 indicates bearish market sentiment, reflecting that a greater number of traders are positioned for further downside in Solana’s price.
Weakening institutional demand
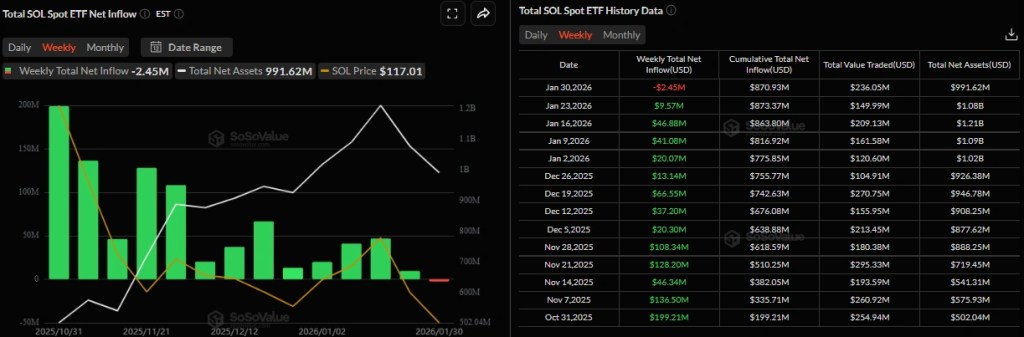
Institutional demand for Solana softened last week. Data from SoSoValue shows that spot Solana ETFs recorded $2.45 million in net outflows, marking the first weekly withdrawals since their launch. If these outflows persist or accelerate, SOL may face additional downside pressure.
Solana Price Outlook: SOL falls below $100
Solana was rejected at weekly resistance near $126.65 on Wednesday and went on to fall more than 15% through Sunday, breaking below the key $100 psychological level. As of Monday, SOL is trading around $99.60.
A daily close below $100 could extend the decline toward the April 7 low at $95.26. A sustained move below that level may open the door to further losses toward the January 23, 2024 low near $79.
On the momentum front, the Relative Strength Index (RSI) on the daily chart is at 25, signaling deeply oversold conditions and strong bearish momentum. Meanwhile, the MACD remains bearish after a crossover on January 19, with expanding red histogram bars below the zero line, reinforcing the negative technical outlook.
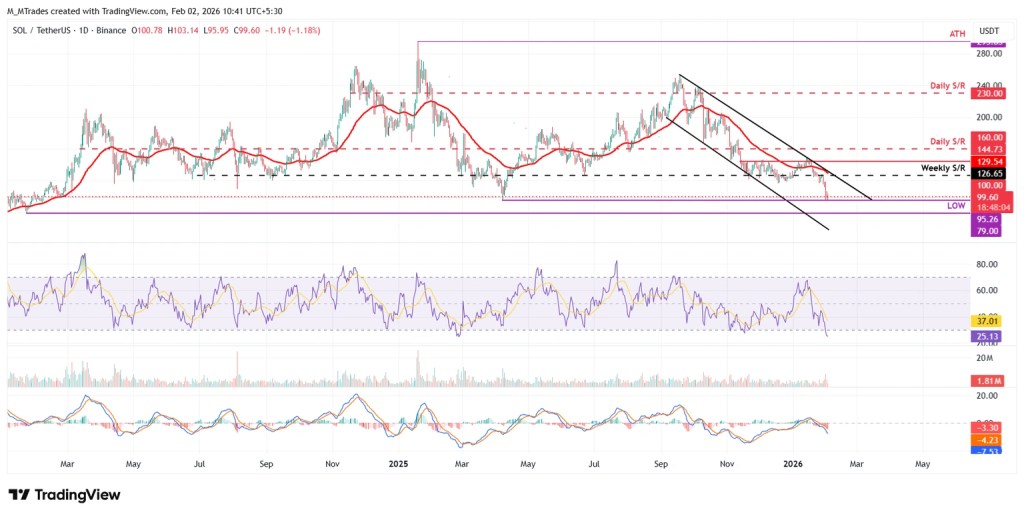
Conversely, a recovery could see SOL move back toward the weekly resistance at $126.65.
Sources: Manish Chhetri

Leave a comment