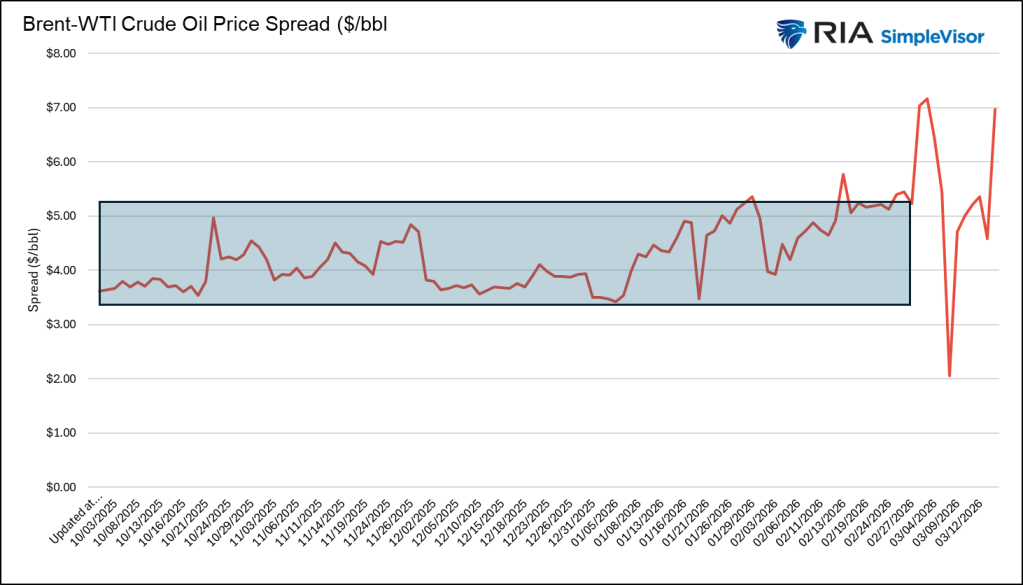
When geopolitical tensions tied to oil intensify, most investors focus on outright oil prices. While those prices matter, fewer pay attention to the spread between Brent and WTI—an equally revealing signal. West Texas Intermediate (WTI), priced in Cushing, Oklahoma, serves as the U.S. benchmark and mainly reflects North American supply-demand dynamics.
Brent, by contrast, is the global benchmark derived from North Sea crude and closely mirrors international supply-demand conditions—especially seaborne oil flows through key routes like the Persian Gulf and the Strait of Hormuz. Under normal circumstances, Brent trades at a premium of about $2–$5 over WTI.
Sharp changes in this premium carry important market signals. In the context of the Iran conflict, the Brent–WTI spread offers one of the clearest real-time indicators of how producers, consumers, and traders are interpreting the situation.
A widening spread suggests markets are pricing in a global supply disruption, while a stable or narrowing gap—even with high spot prices—implies expectations that any disruption will be limited and temporary.
Recently, the spread has been highly volatile. It currently stands at around $7, pointing to concerns that the conflict could continue to strain global supply. However, frequent swings in the spread show how quickly sentiment is shifting with each new development.
S&P 500 Trails Most Sectors
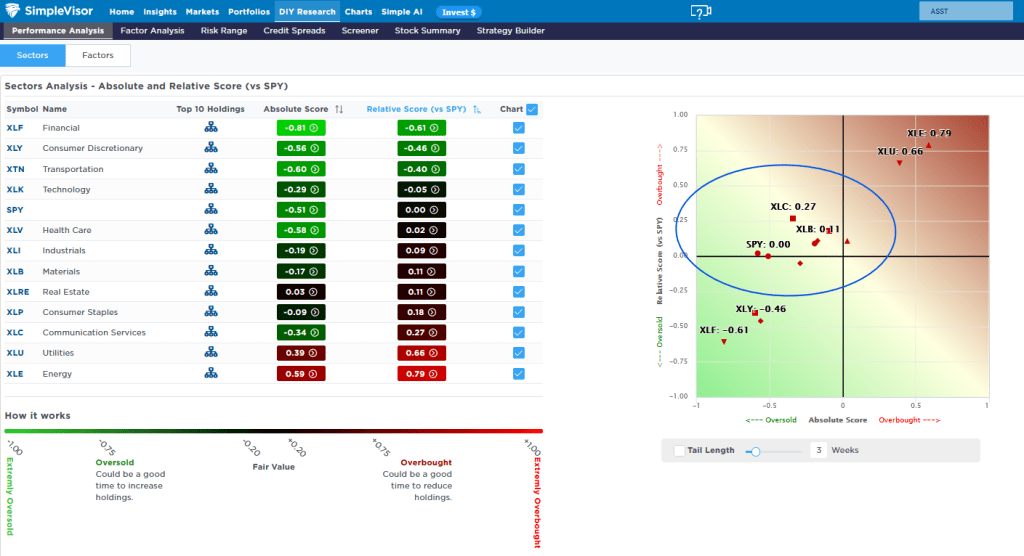
Last week, the S&P 500 slipped by less than 0.5%, but it has fallen just over 3% from its Tuesday peak and now sits roughly 5% below recent highs. As illustrated in the charts, most sectors are outperforming the broader market based on both absolute and relative measures. The blue circle in the first chart shows that many sectors are positioned in the top-left quadrant—suggesting they are somewhat overbought relative to the S&P 500, yet slightly oversold on a standalone technical basis.
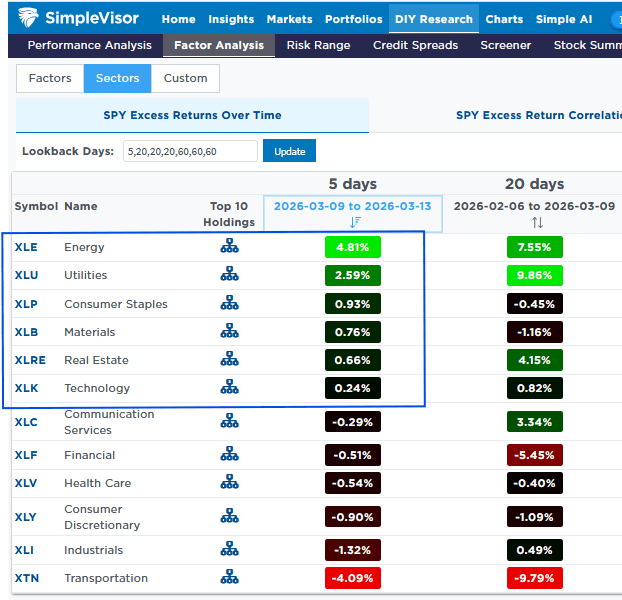
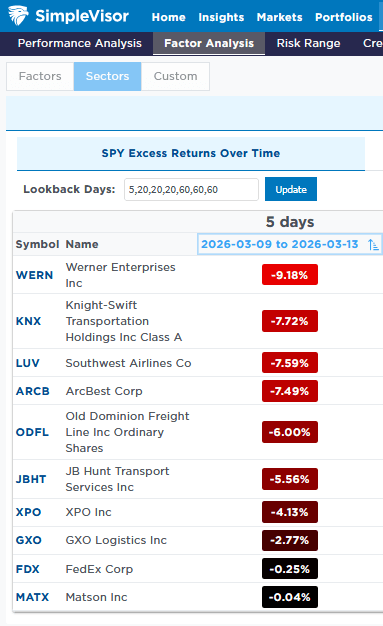
The second chart compares each sector’s performance versus the S&P 500 over the past five days and the prior 20-day period. Transportation stands out as a clear laggard. The third chart, which breaks down the sector’s top ten holdings, shows that oil-sensitive industries—such as trucking, freight, and airlines—have been hit the hardest. These businesses are also closely tied to overall economic activity.
As a result, elevated oil prices combined with rising concerns about economic slowdown are weighing heavily on transportation stocks. If the conflict drags on, the sector is likely to continue underperforming. Even if valuations become deeply oversold, they may stay depressed until there are clearer signs of stability or resolution.
Tweet of the Day
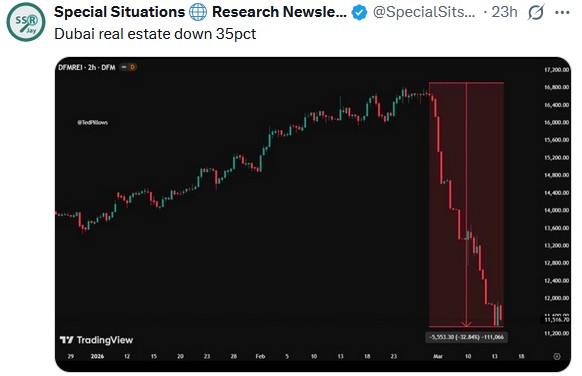
Sources: Lance Roberts

Leave a comment