Bitcoin’s latest decline is unfolding amid mounting macroeconomic headwinds and crypto-specific pressures, fueling fears that the downtrend could deepen, with some analysts eyeing a potential floor near $45,000.
Trump’s 15% Global Tariff Weighs on BTC
On Saturday, February 21, US President Donald Trump unveiled a 15% blanket tariff on imports, jolting global financial markets — cryptocurrencies included. The move followed a decision by the US Supreme Court to overturn his earlier sweeping tariff measures. The revised levy, initially proposed at 10% before being lifted to 15%, officially comes into force today, February 24, 2026.
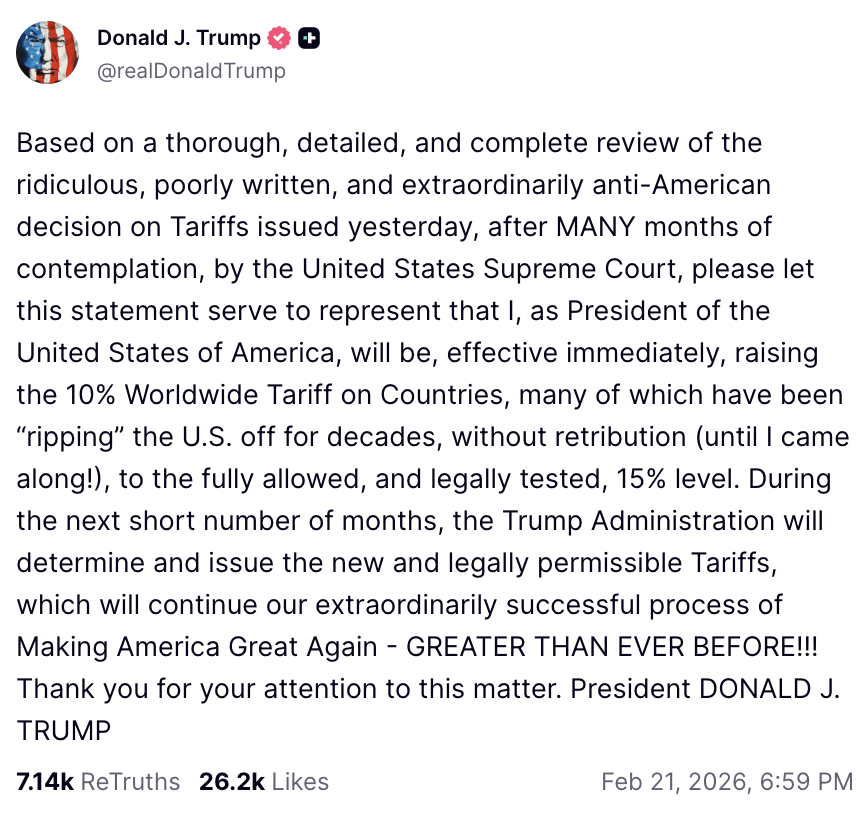
Activated under Section 122 of the Trade Act of 1974, the new tariff covers the majority of imported goods for an initial 150-day period, with any extension subject to congressional approval. Although intended to narrow trade imbalances, the measure has heightened economic uncertainty, triggering a widespread retreat from risk-sensitive assets.
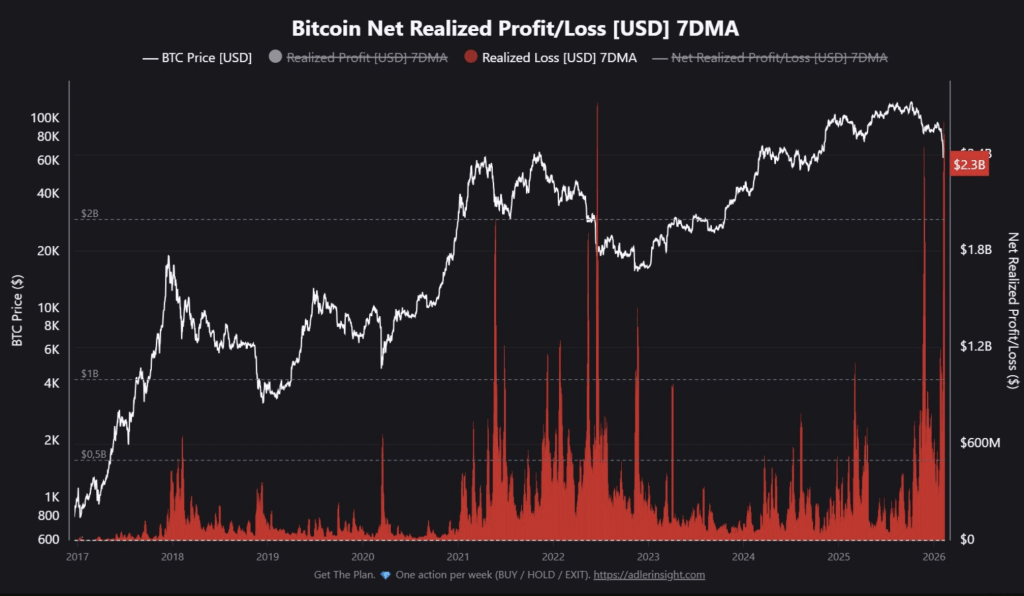
Within the crypto market, the development has reinforced a risk-off mood, as investors rotate out of volatile positions into safer havens. Bitcoin holders are increasingly realizing losses, with on-chain figures indicating more than $2.3 billion in realized losses over the past week.
Crypto analyst IT Tech described the move as one of the most significant capitulation phases in Bitcoin’s history, comparing it to the 2021 market crash, the 2022 Luna/FTX collapse, and the mid-2024 correction. In a post on X, he noted that the scale of losses ranks among the top three to five worst drawdowns ever recorded, adding that only a few moments in Bitcoin’s history have witnessed such intense capitulation.
The reaction reflects mounting concerns that higher import costs could reignite inflationary pressures, potentially forcing the Federal Reserve to delay rate cuts and keeping financial conditions tighter for longer.
Markets sold off swiftly following the announcement, with Bitcoin sliding intraday to below the $63,000 mark.
Spot Bitcoin ETFs Extend Outflow Streak to Five Weeks
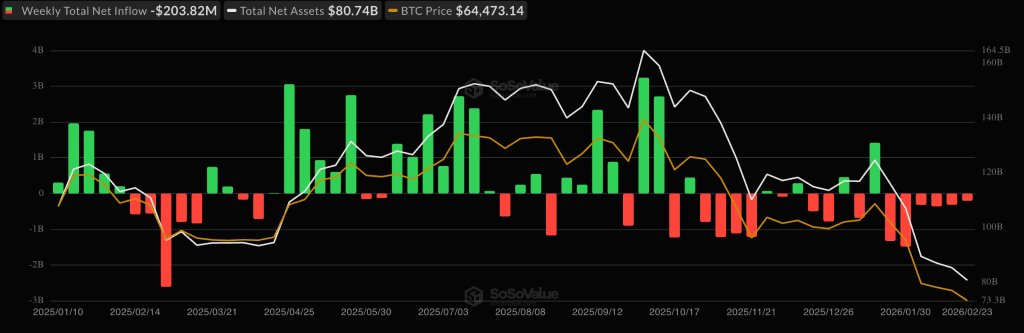
Adding to the tariff-driven volatility, U.S.-listed spot Bitcoin ETFs have now recorded five consecutive weeks of net outflows — the longest stretch of withdrawals since February 2025.
Data from SoSoValue shows that nearly $3.8 billion has exited these funds over the five-week period, including $316 million in redemptions last week alone.
BlackRock’s iShares Bitcoin Trust (IBIT) accounted for the largest share of the withdrawals, losing roughly $2.1 billion during the streak. Fidelity Investments’ Fidelity Wise Origin Bitcoin Fund (FBTC) and several other products also saw notable outflows.
The sharp reversal from the strong inflows seen in late 2024 highlights a cooling in institutional appetite, as portfolio managers trim crypto exposure amid heightened macro uncertainty and broader market turbulence.
The persistent ETF withdrawals are intensifying sell-side pressure on Bitcoin, as fund managers are forced to offload underlying BTC holdings to satisfy investor redemptions.
With total net outflows reaching $4.5 billion so far in 2026, much of the earlier inflow momentum has been erased. Analysts describe the environment as a “risk-off stress test,” where macro headwinds — including tariffs and geopolitical tensions — are discouraging fresh allocations into crypto.
Sentiment indicators reflect the strain. The Crypto Fear & Greed Index has plunged to one of its most extreme fear readings on record, reinforcing the ongoing wave of liquidation. Unless ETF flows stabilize or reverse, downside momentum may continue, particularly if institutional distribution remains dominant.
Bear Pennant Signals $45K Target for Bitcoin
From a technical perspective, Bitcoin’s chart structure remains bearish, with a well-defined bear pennant forming on the daily timeframe.
A bear pennant is a continuation pattern that follows a steep decline (the flagpole), then consolidates within a tightening symmetrical triangle before typically breaking lower.
The BTC/USD pair fell below a major support level at $80,117 — its November 2025 low — and slid to $60,000 on February 6, forming the flagpole. A rebound toward $72,000 followed, before price retreated again to around $63,100.
The pattern confirmed on Monday when Bitcoin broke beneath the pennant’s lower trendline near $67,000. Based on the measured-move technique — projecting the height of the flagpole from the breakout point — the downside target falls in the $45,000–$50,000 range.
A drop toward $45,000 would imply roughly a 28% decline from current levels, underscoring the risk of further capitulation if macro and flow dynamics fail to improve.
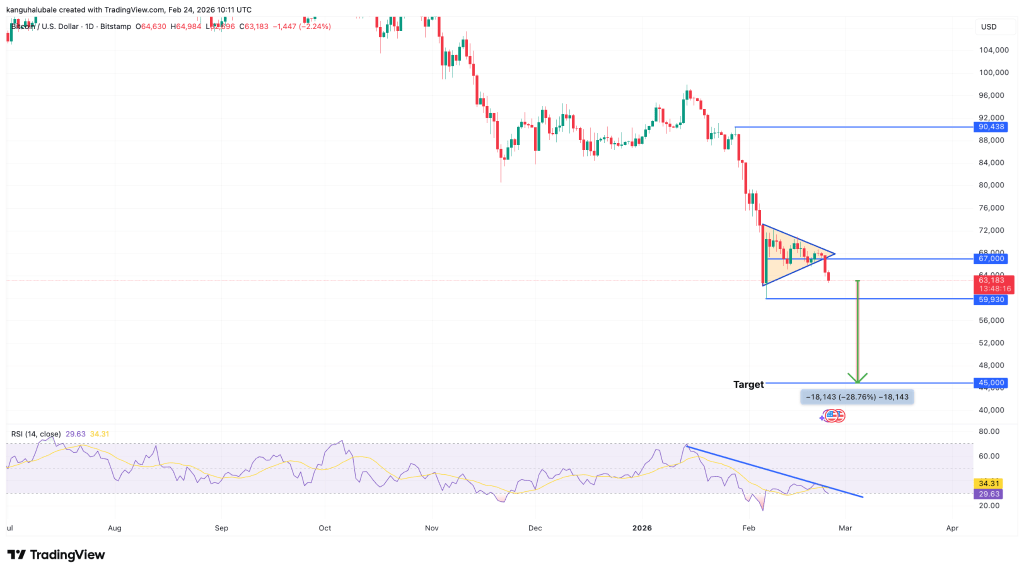
The bearish outlook is reinforced by strengthening downside momentum, with the RSI sliding from overbought territory near 70 on January 15 to around 29 currently — signaling growing selling pressure and near-oversold conditions.
Bitcoin continues to trade below key moving averages, keeping the broader technical structure fragile. A decisive break beneath the $60,000 threshold could intensify losses, opening the door toward the $52,450 realized price level — a historically significant support area.
On the other hand, a sustained move above $72,700 would invalidate the bear pennant setup and could shift momentum back in favor of the bulls, paving the way for a broader recovery.
Sources: Nancy Luu

Leave a comment