Gold futures are presently moving within a defined VC PMI mean-reversion structure, signaling a market positioned at a pivotal balance point between accumulation and expansion. The price hovering near 5,030 coincides exactly with the weekly VC PMI mean, reinforcing the idea that value and momentum are in equilibrium as traders wait for a clear directional trigger.
When prices consolidate around the mean, the probability outlook turns neutral. A decisive breakout above resistance or a pullback into lower value zones is needed to generate the next high-probability trading opportunity.
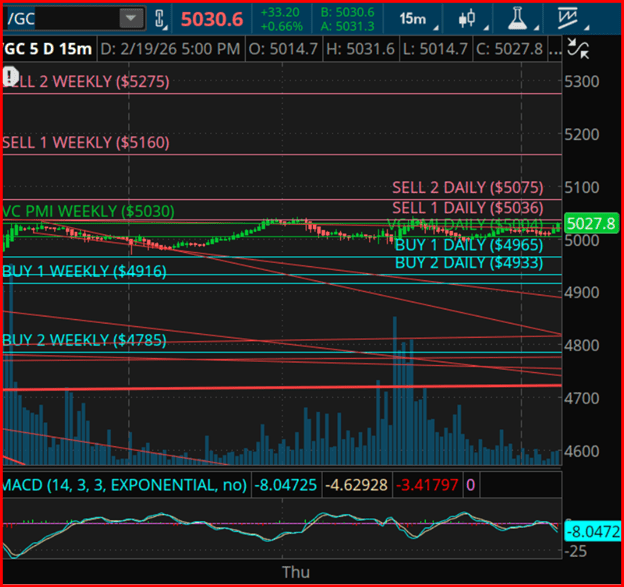
Under the VC PMI framework, a sustained close above the 5,030 weekly mean and the daily Sell-1 resistance around 5,036 shifts probabilities in favor of continued upside. That confirmation opens the path toward the daily Sell-2 level near 5,075 and the weekly Sell-1 target at 5,160. A firm break and close above 5,160 would mark the start of a volatility expansion phase, transitioning the market from consolidation into a directional trend, with former Sell-1 and Sell-2 levels converting into support.
In that bullish scenario, momentum could extend toward the weekly Sell-2 objective around 5,275, signaling stronger institutional flows and momentum-based participation. Historical probability metrics suggest that once price closes above the mean and sustains it, there is roughly a 70–80% chance of continuation toward the next resistance zone.
On the other hand, failure to hold above the VC PMI mean—particularly a close below 5,000—would tilt probabilities toward a corrective retracement into the daily Buy-1 level near 4,965 and Buy-2 around 4,933. These represent statistically extreme value areas, where the model identifies a 90–95% probability of reversion back toward equilibrium after being tested.
As long as price remains above the weekly Buy-1 level at 4,916, the broader technical structure stays constructive, implying pullbacks are corrective in nature rather than trend reversals. However, a decisive break below the weekly Buy-2 level at 4,785 would negate the current bullish outlook and point to a deeper cyclical correction.
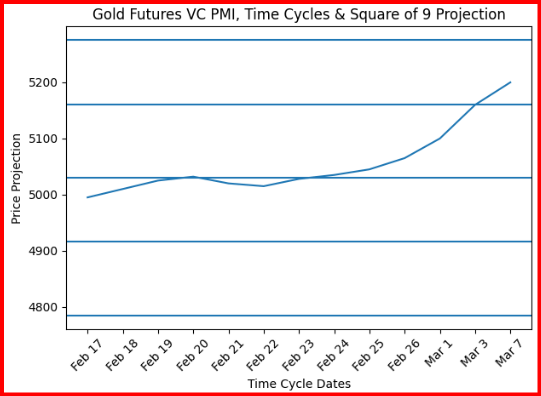
Time-cycle analysis heading into late February and early March highlights critical inflection windows around February 24–26 and March 3–7—periods that historically coincide with shifts from consolidation to expansion phases.
These timing cycles correspond with Square-of-9 harmonic resistance in the 5,075–5,160 range and support clusters between 4,965 and 4,916, forming a technically balanced and mathematically aligned trading range.
When time and price harmonics converge in this manner, the probability of volatility expansion increases significantly, often leading to directional breakouts accompanied by stronger momentum and broader market participation.
Sources: Patrick MontesDeOca

Leave a comment