Gold futures remain in a well-defined bullish consolidation, with prices oscillating around the VC PMI daily mean near 4,982. The market’s continued defense of the Buy-1 level at 4,768 and Buy-2 at 4,556 reinforces the view that institutional demand is emerging on pullbacks. This price action aligns with the core VC PMI mean-reversion framework: sustained trade above the mean increases the probability of a move toward the Sell-1 and Sell-2 targets.
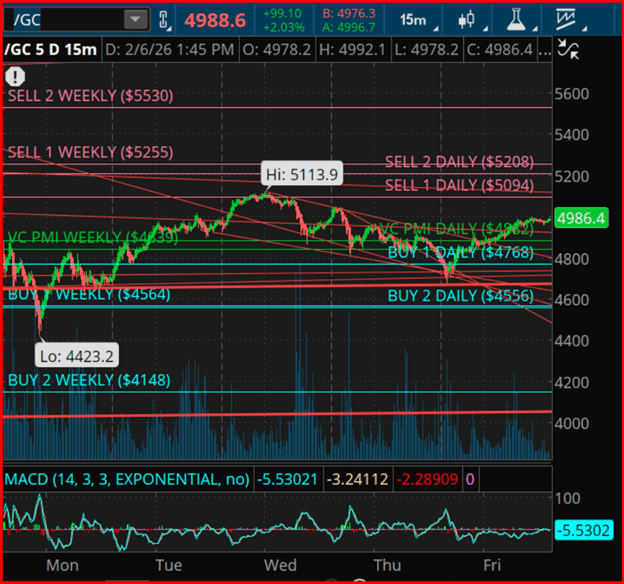
Within the VC PMI framework, the weekly mean around 4,839 has acted as the key pivot for directional bias. As long as price action remains above this level, bullish momentum is sustained, with upside projections toward the daily Sell-1 resistance at 5,094 and Sell-2 at 5,208. These zones mark statistically extreme levels where the probability of mean reversion typically exceeds 90% under normal market conditions. A decisive breakout and close above Sell-2 would indicate a transition into a higher-volatility regime, opening the door to the weekly Sell-1 level at 5,255 and potentially the weekly Sell-2 target near 5,530.
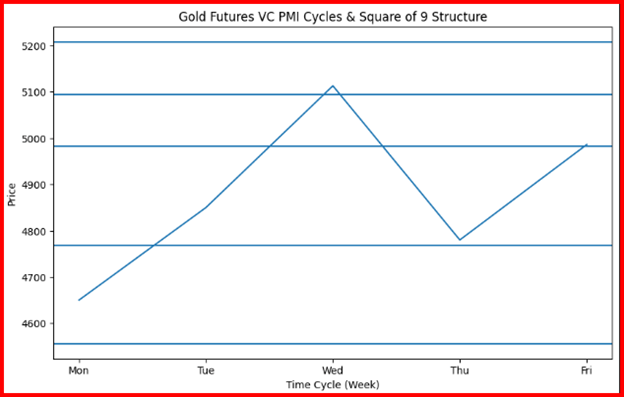
Square-of-9 geometry closely mirrors the current price structure, highlighting that the recent peak near 5,113 aligns with a harmonic resistance angle projected from prior cycle lows around 4,423. This geometric relationship suggests gold is completing a rotational phase ahead of its next directional move. When prices oscillate between key geometric angles, it often signals energy compression that ultimately resolves through a momentum expansion.
Time-cycle analysis into mid-February points to a critical inflection window. With prices consolidating above the mean, the higher-probability outcome favors continuation toward upper resistance bands. Conversely, a failure to hold the 4,982 pivot would likely prompt a corrective rotation toward 4,768 and potentially 4,556, levels where longer-term accumulation demand is expected to reappear.
The combined use of VC PMI price levels, time-cycle analysis, and Square-of-9 geometry creates a multidimensional framework for identifying high-probability inflection points. Rather than forecasting direction, traders should concentrate on price reactions at the mean and statistically extreme bands. Directional bias is ultimately confirmed by the market itself, once price closes decisively above or below these levels.
Sources: Patrick MontesDeOca

Leave a comment