Stellar continued its corrective move on Thursday after failing to reclaim a previously broken trendline. Derivatives data points to mounting weakness, with short positions increasing even as open interest declines. The technical picture remains bearish, suggesting sellers retain control and could push the price into a deeper correction.
Stellar (XLM) continued its corrective decline on Thursday, trading below $0.167 at the time of writing after facing rejection at a key resistance level. Derivatives indicators signal growing weakness, with short positions increasing even as open interest declines. From a technical perspective, bearish momentum remains dominant, leaving XLM vulnerable to further downside and potential new lows.
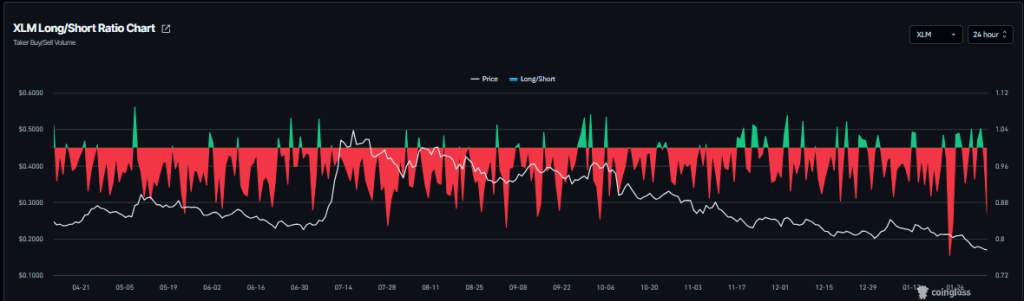
Derivatives data signals downside bias for XLM
CoinGlass data shows XLM’s long-to-short ratio at 0.85 on Thursday, close to its lowest level in a month. A reading below one indicates a bearish skew in market positioning, with a greater share of traders betting on further price declines.
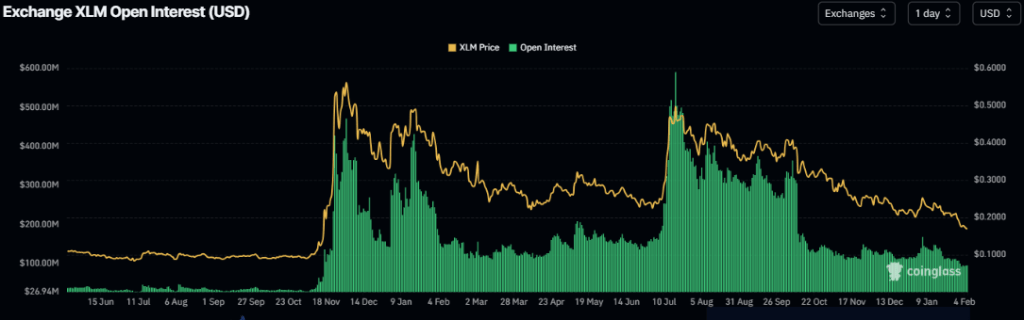
Stellar’s futures open interest fell to $95 million on Thursday, marking its lowest level since November 2024 and continuing a steady decline seen since the start of the year. The reduction in open interest signals diminishing trader participation and reinforces the broader bearish outlook for XLM.
Stellar Price Forecast: XLM deepens correction after slipping below key support
Stellar fell more than 13% last week, closing below the lower boundary of a falling wedge pattern on Saturday. Since then, XLM has repeatedly faced rejection near the broken trendline through Wednesday, extending losses by more than 5%. As of Thursday, the token is trading around $0.169.
If the corrective move continues, XLM could slide further toward its 2025 yearly low at $0.160, recorded on October 10.
Momentum indicators continue to point lower. The daily Relative Strength Index (RSI) stands at 26, signaling oversold conditions and strong bearish pressure. Meanwhile, the Moving Average Convergence Divergence (MACD) has remained in a bearish crossover since mid-January, with expanding red histogram bars below the zero line reinforcing the negative technical bias.
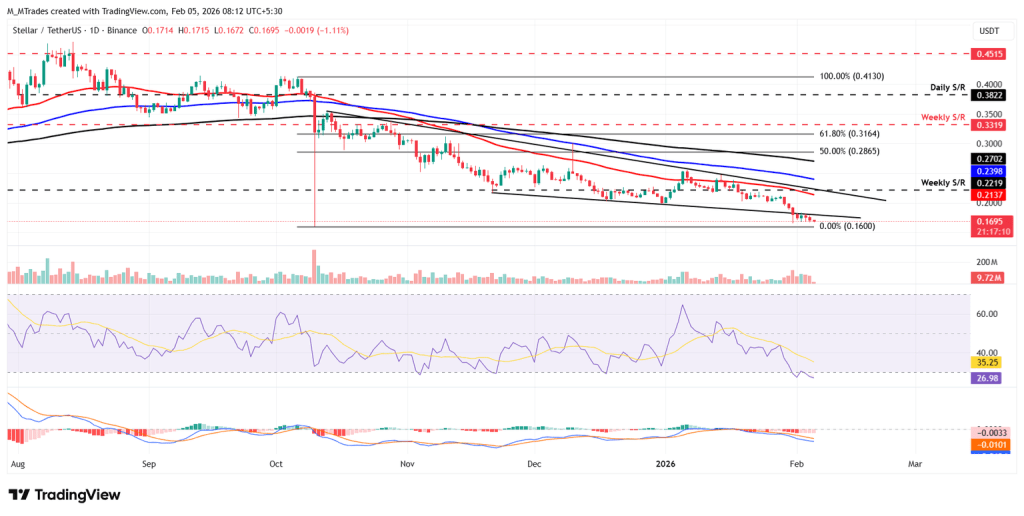
Alternatively, a recovery in XLM could see prices push higher toward the lower boundary of the trendline, near the $0.180 level.
Sources: Manish Chhetri

Leave a comment