Gold futures continue to show strong bullish momentum, holding well above the VC PMI Daily Pivot near $5,329, reinforcing higher-timeframe trend alignment across both daily and weekly cycles. The sharp, near-vertical advance that began earlier this week is characteristic of classic “escape velocity” behavior, with price accelerating away from the mean during a synchronized time-and-price harmonic window.
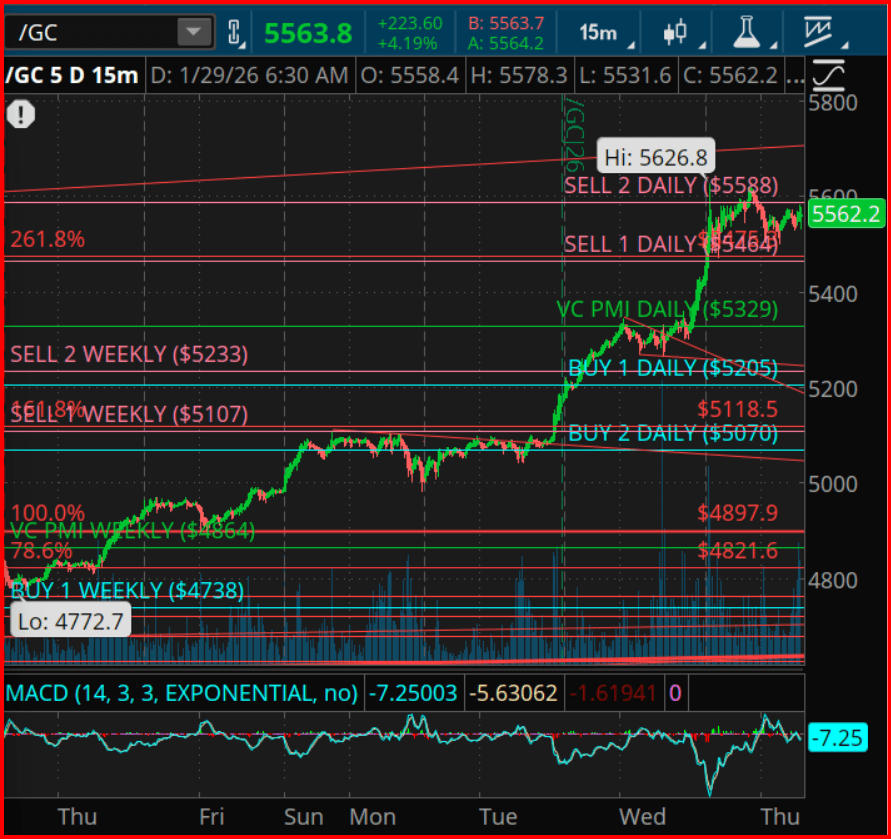
Within the VC PMI framework, price is now rotating inside the upper volatility band. Daily Sell 1 near $5,465 defines the first layer of structural resistance, while Daily Sell 2 around $5,588 marks the outer boundary of the current expansion envelope. The recent intraday peak near $5,626.8 indicates price is pressing into a late-stage extension phase, where probabilities begin to shift toward consolidation or orderly mean reversion rather than continued vertical advance.
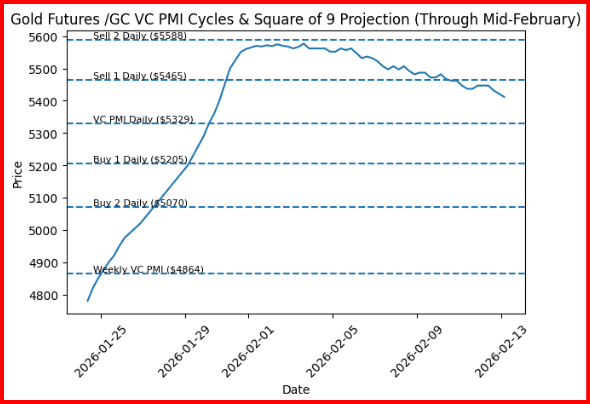
Square of 9 geometry supports this view. Angular projections from the latest weekly VC PMI Pivot near $4,864 project resistance harmonics into the $5,560–$5,620 region, closely overlapping with the Daily Sell 2 band. This confluence of time, price, and geometric resistance elevates the likelihood of a near-term inflection window.
On the downside, rotational support remains layered at Daily Buy 1 near $5,205 and Daily Buy 2 near $5,070, with deeper mean support at the weekly VC PMI Pivot around $4,864 should downside volatility expand.
Cycle analysis further identifies a key timing cluster between January 29 and February 2, derived from overlapping 30-day and 60-day harmonics. Historically, such windows tend to resolve momentum conditions via either range compression or a counter-trend rotation back toward the VC PMI mean. Momentum indicators, including MACD divergence behavior, suggest upside efficiency is fading, reinforcing the risk of a pause or rotational pullback rather than immediate continuation.
From a strategic standpoint, trend-following participants may continue to trail protective stops below $5,205, while mean-reversion traders will look for rejection signals within the $5,560–$5,620 Square of 9 resistance arc. A sustained close above $5,588 would negate the near-term mean-reversion risk and reopen the path toward higher geometric extensions.
Sources: Golden Meadow

Leave a comment