Zurich Insurance Group AG (SIX: ZURN) and Beazley PLC (LON: BEZG) have agreed in principle on the main financial terms of a potential all-cash offer, valuing the UK-based insurer at around £8 billion. Under the proposed transaction, Beazley shareholders would receive up to 1,335 pence per share, consisting of 1,310 pence in cash plus allowable dividends of up to 25 pence for the year ending December 31, 2025.
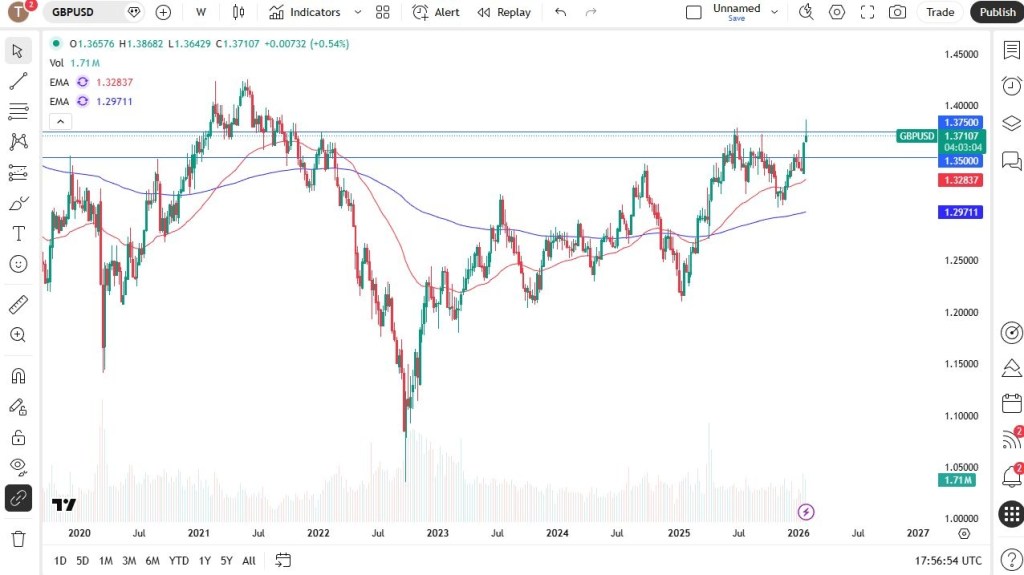
The indicative offer implies a premium of almost 60% to Beazley’s closing price of 820 pence on January 16, the final trading day before the offer period commenced, and represents a 34.6% uplift to the company’s record high of 973 pence reached on June 6, 2025.
Beazley’s board said it would be “minded to recommend” the proposal to shareholders should a firm offer be made on the outlined financial terms, subject to agreement on remaining conditions and the execution of definitive documentation.
The proposed deal would bring together two complementary operations, forming a leading global specialty insurance group with roughly $15 billion in gross written premiums, supported by Beazley’s strong position at Lloyd’s of London.
Zurich is required to announce a firm intention to proceed with an offer by February 16, or confirm that it does not plan to make a bid. The Swiss insurer currently owns a 1.479% stake in Beazley, equivalent to 8,866,051 ordinary shares.
Morgan Stanley published a new analysis of Japan’s tire industry, reaffirming Overweight (OW) ratings on two major companies with solid growth prospects despite differing market pressures. The report highlights firms well positioned to benefit from opportunities in North America while navigating sector-specific challenges.
1. Toyo Tire — Morgan Stanley reiterates its Overweight rating on Toyo, pointing to growing confidence in the company’s growth strategy and shareholder return outlook ahead of its Medium-Term Plan announcement on March 4. Analysts see additional upside as investors continue to factor in stronger demand for WLTR (Wide Light Truck Radial) tires in North America, where Toyo holds a well-established market position.
2. Bridgestone — Bridgestone also retains an Overweight rating, supported by initiatives to reinvigorate the Firestone brand in the North American market. Morgan Stanley highlights encouraging expectations from the company’s restructuring efforts, while cautioning that soft OE (Original Equipment) demand for TBR (Truck and Bus Radial) tires in North and South America presents a downside risk. Nonetheless, replacement demand in these regions remains resilient.
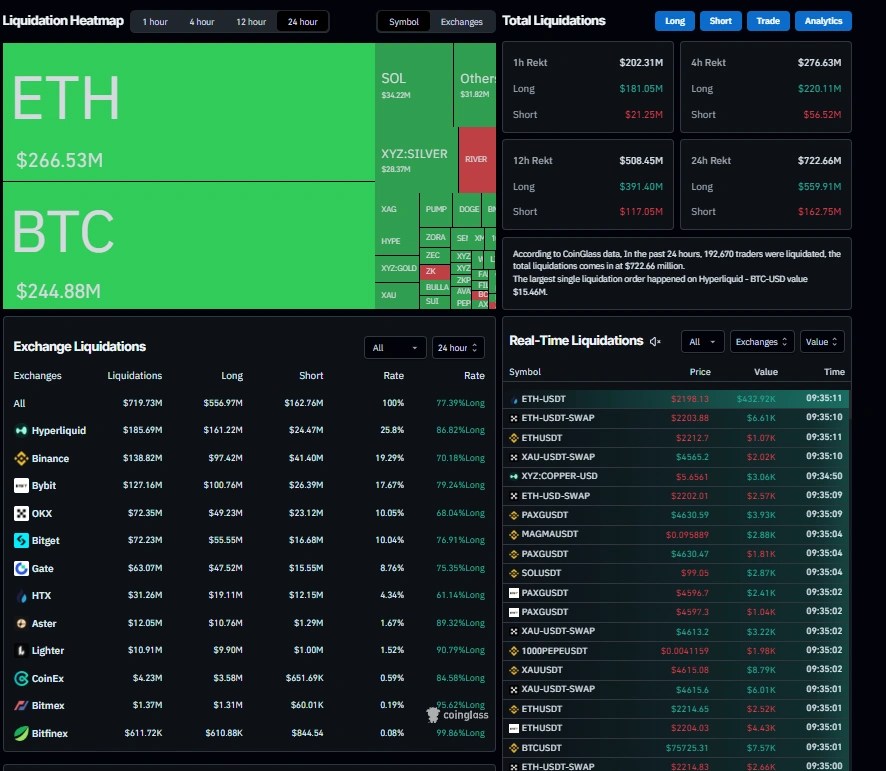
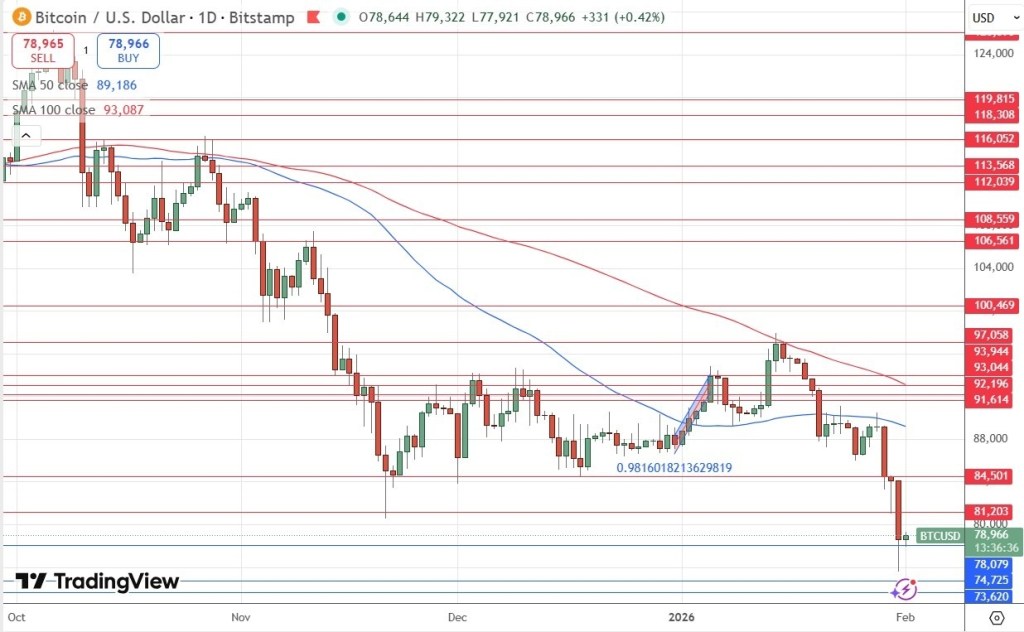
Bitcoin hovered just above 15-month lows on Wednesday after a sharp sell-off drove the world’s largest cryptocurrency down toward the $73,000 level amid a wave of liquidations and heightened risk aversion. The token was last trading 2.8% lower at $76,509.1 as of 01:56 ET (06:56 GMT), having earlier touched $73,004.3—its weakest level since November 2024.
Following the weekend’s slump, Bitcoin fell nearly 12% last week, building on a roughly 10% decline in the prior week. The latest drop marks its lowest point since Donald Trump’s U.S. election victory, wiping out gains that had previously been supported by optimism around potential regulatory easing for the cryptocurrency sector.
Bitcoin sinks to a 15-month low as mass liquidations accelerate
The downturn was accompanied by widespread liquidations of leveraged long positions. According to data from crypto analytics firm CoinGlass, nearly $740 million in bullish bets were erased over the past 24 hours, as falling prices triggered margin calls and forced traders to close positions.
Bitcoin’s latest weakness represents a sharp reversal from the strong rally seen late last year, when prices surged in the wake of Donald Trump’s election victory. At that time, investors poured into cryptocurrencies on expectations that a new U.S. administration would adopt a more supportive regulatory approach to digital assets. Additional tailwinds came from Federal Reserve rate cuts starting in December 2024, which helped fuel demand for higher-risk assets.
Gold and other traditional safe-haven assets rebounded on Wednesday as geopolitical tensions between the United States and Iran intensified.
At the same time, cryptocurrency markets remain under pressure amid uncertainty surrounding U.S. monetary policy following President Trump’s nomination of former Federal Reserve Governor Kevin Warsh as the next Fed chair. Warsh is widely regarded as a policy hawk, raising concerns over tighter liquidity conditions.
Most altcoins remained under pressure on Thursday, posting steeper losses than Bitcoin. Ethereum, the world’s second-largest cryptocurrency, slipped 2.3% to $2,268.92, while XRP, ranked third, edged 1.1% lower to $1.59.
Solana dropped 6%, while Cardano also moved lower and Polygon declined 3.5%. Among meme tokens, Dogecoin was marginally weaker, down 0.2%.
The mainstream narrative claims that a new Fed chair will safeguard the central bank’s independence from U.S. government influence—and that this alone justifies a $1,200/oz drop in gold and a $50 collapse in silver.
Put simply, that narrative is complete nonsense.
Fiat currency is best thought of as meme—or even junk—money, and despite its obvious flaws, it can still enjoy periodic rallies against what many see as the ultimate form of money: gold. These countertrend moves typically emerge during bouts of speculative excess, much like the frothy conditions that have dominated markets over the past couple of months.
From a fundamental standpoint, the gold bull market remains fully intact. Billions of gold-focused savers across China and India—along with a smaller group of informed Western investors—do not rely on central banks for validation. Their priority is building long-term wealth in gold, not accumulating ever more fiat currency and debt.
In the context of this broader bull cycle, it makes little difference who occupies the Fed chair. What matters is whether gold is attractively priced. When it is, prudent savers see it as an opportunity to accumulate more, regardless of short-term fiat-driven narratives.
The long-awaited “exciting buy zone” has finally come into play. Gold investors were encouraged to prepare for a meaningful dip into the $4,400 area, and that discounted opportunity has now materialized.
Sustainable wealth building is not about predicting prices, but about preparing for unexpected moves. This pullback unfolded over just a few days, leaving unprepared investors confused and still focused on guessing what happens next.
The key development now is that the $5,600 region has emerged as a major accumulation zone on any future pullback. Gold investors should already be positioning themselves to take advantage of that opportunity if and when it presents itself.
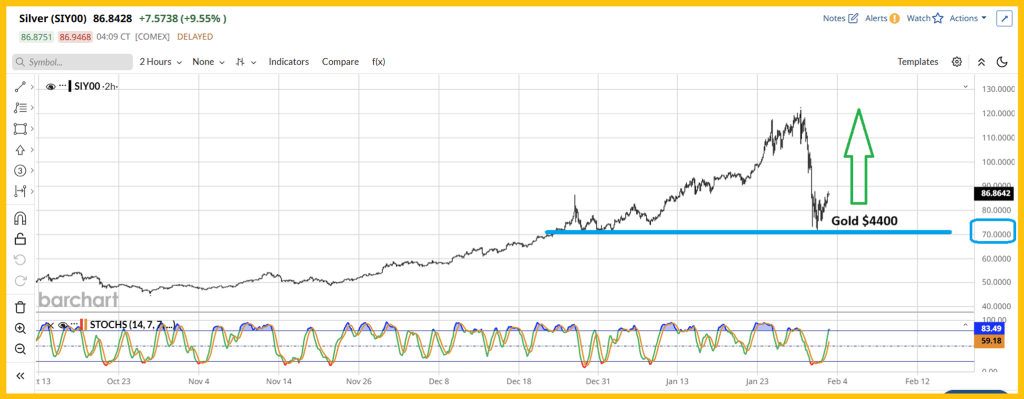
As for silver, the recent price sell-off was “super-sized,” driven by large and heavily leveraged bets against fiat currencies. That decline ultimately found support at the $70 buy zone, aligning perfectly with gold’s move into the $4,400 area.
Gold remains the undisputed leader of the precious metals complex. If silver investors and mining-stock enthusiasts take their cues from gold bullion, they position themselves to build substantial and durable wealth. The most likely near-term path for silver is a broad trading range between $70 and $120, followed by a powerful upside breakout that could propel prices toward the next target zone of $170–$200.
Over the longer term, silver has the potential to trade well above $1,000, largely because governments worldwide—both in the East and the West—continue to cling to fiat currencies and debt rather than returning to sound money anchored in gold.
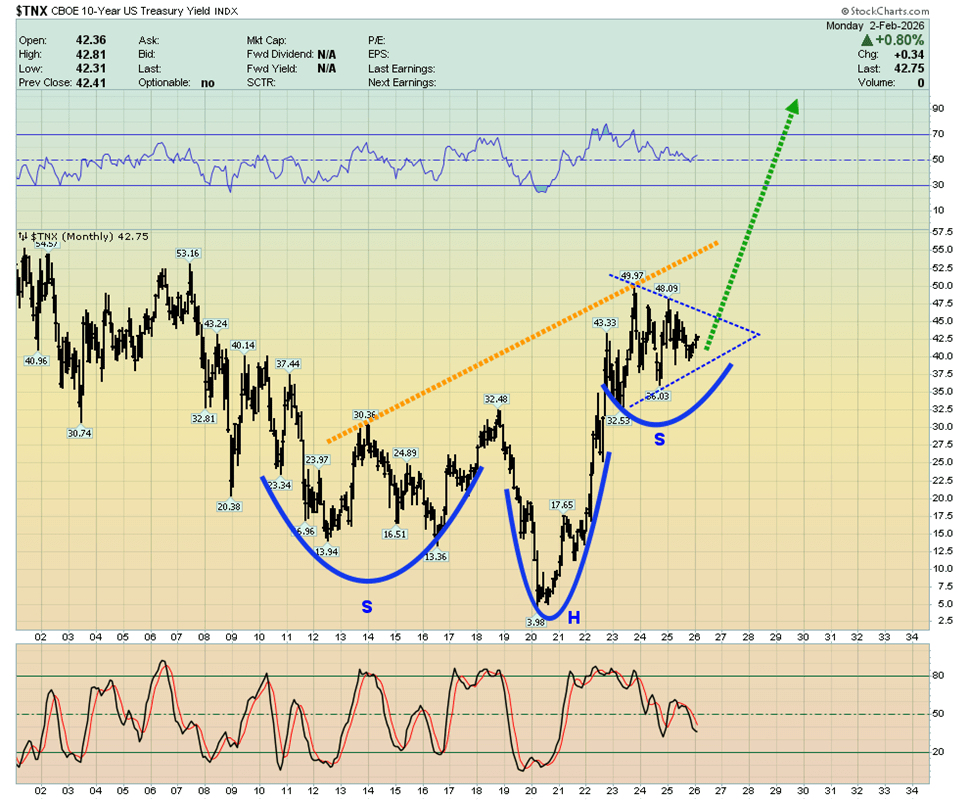
A new 40-year inflation cycle began in 2020 and is unlikely to end until U.S. interest rates reach record highs. Unlike the cycle’s conclusion in 1980, however, elevated rates this time are unlikely to curb inflation, as it is being driven by ongoing government policies rather than purely monetary conditions.
Another perspective on U.S. rates: the incoming Fed chair is more likely to lean toward fiscal restraint on a debt-addicted U.S. government than to dispense easy-money policies of QE and rate cuts. Such a stance would have implications for long-term sovereign yields worldwide, and global money managers are likely to continue shifting capital into gold as a strategic response.
As interest rates continue their relentless climb in the years ahead, governments will inevitably confront their “Queen Gold maker.” They will be forced to begin replacing fragile fiat currencies with gold—or face effective financial ruin.
As for robots, they will simply become another cost burden for citizens already trapped in stagflation. As automation expands rapidly and robot populations eventually outnumber humans, workers will be left competing for a shrinking pool of jobs. Confronted with government-driven stagflation and lacking the protection of gold savings, many will endure severe financial stress—conditions that would be further worsened by a stock market crash.
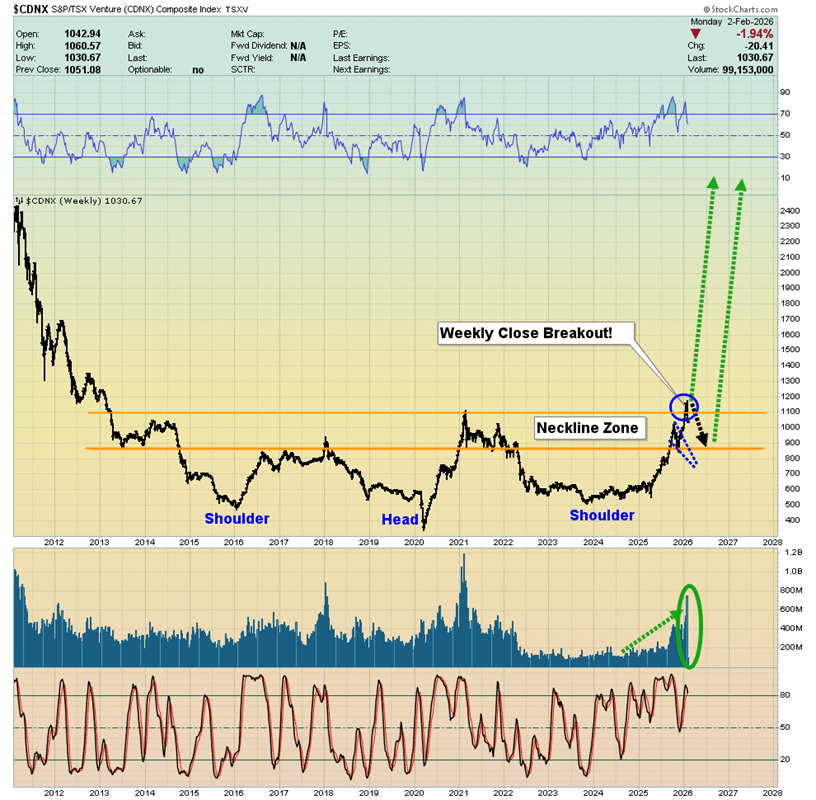
As for the miners, they too presented exceptional buying opportunities when gold dipped to $4,400. The CDNX is now starting to emerge from a decade-long base, with price action that closely resembles gold’s breakout above $2,000. The initial rally may appear deceptive, but it is genuine—because this type of breakout unfolds as a process rather than a single, short-lived move. Notably, trading volumes across CDNX-listed stocks have surged, reinforcing the strength of the move.
While pockets of speculative excess briefly appeared in gold and silver bullion, such froth has been absent in the mining sector. Several silver explorers nearing production are projecting all-in sustaining costs well below $20, while gold explorers with large-scale projects are reporting AISC figures under $2,000. The conclusion is clear: junior gold and silver miners may represent the most undervalued segment in market history.
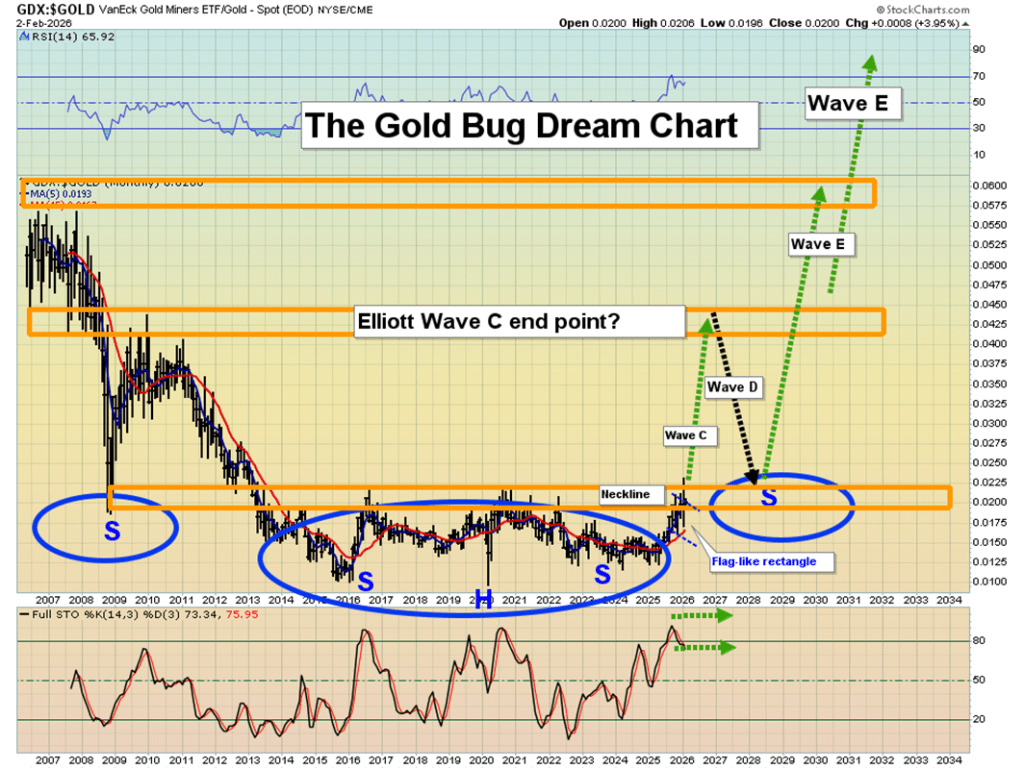
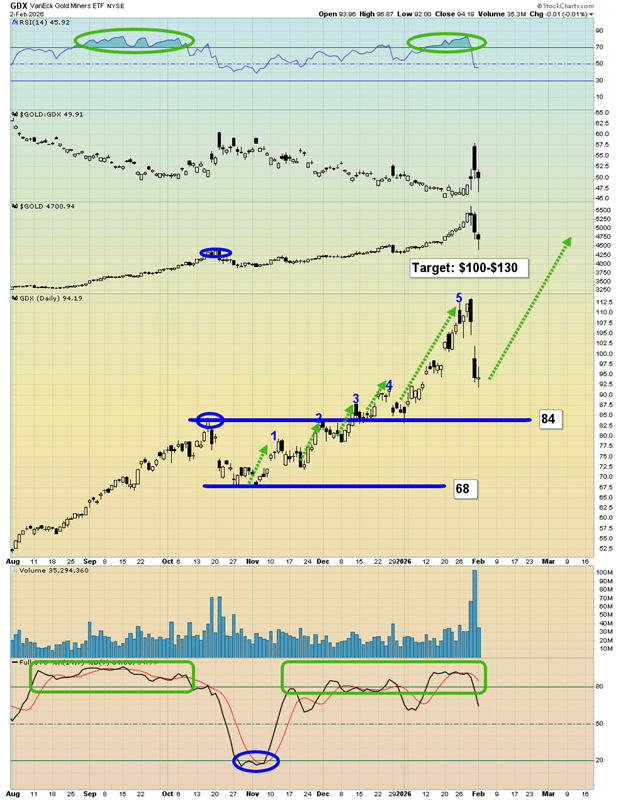
And what about the senior miners? The GDX versus gold chart is striking. Since the 2015 low—when the head of a massive inverse head-and-shoulders pattern began to form—I’ve been guiding investors through this setup. That structure points not merely to years, but potentially decades of strong performance for gold equities. In alignment with the CDNX-to-fiat picture, the breakout process is now underway.
The GDX daily chart delivers a real “wow factor.” The latest five-wave advance was remarkable—and signs suggest a new leg higher may already be unfolding. Notably, GDX’s recent pullback held well above its October highs, even as gold retraced back to that level. That kind of relative strength is a powerful signal that further upside is likely.
Even if gold consolidates between $5,600 and $4,400, and silver oscillates between $120 and $70, GDX and many of its underlying stocks could still push on to new highs. With 2026 marking the Chinese Year of the Fire Horse—symbolizing bold action and the fight for freedom—the question arises: are gold and silver equities poised for their own moment of liberation, breaking out to extraordinary new levels? The evidence suggests they are.
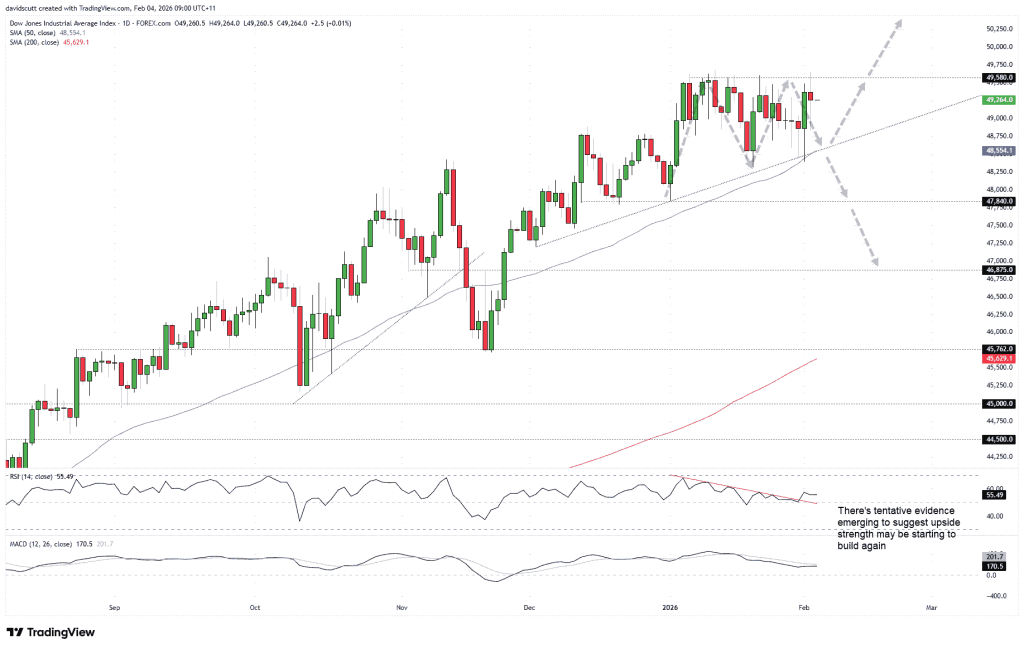
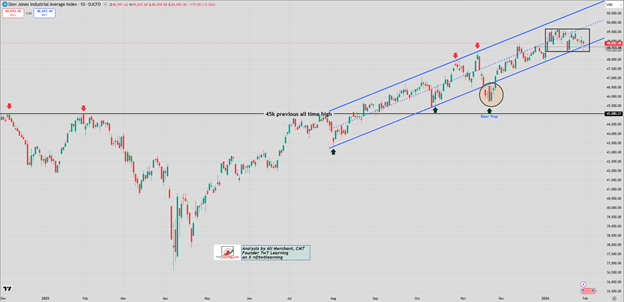
The Dow Jones continues to trade within an increasingly narrow range, as buyers find support along the December trendline while sellers cap advances near 49,580. The longer this compression persists, the higher the likelihood of a decisive and volatile breakout once the range is resolved.
Triangle pattern continues to tighten as pressure mounts.
49,580 stands as the critical upside barrier.
The breakout will determine direction, not strength.
Something has to give in the Dow Jones contract as price action continues to compress within an ascending triangle. Buyers remain active along the trendline support drawn from early December, while sellers continue to defend the 49,580 area. The market is effectively locked in a stalemate, and the longer this coiling persists, the greater the likelihood of a sharp, potentially explosive move once the pattern finally resolves.
Traditionally, this setup favors a bullish resolution, opening the door to fresh record highs, with a push beyond 51,000 possible given the placement of the triangle. A decisive break and close above 49,580 would allow long positions to be established above the level, with stops placed just below for risk management. While the 50,000 mark will naturally attract close attention due to its psychological importance, I would prefer to see a clear topping formation before reassessing whether to trim, exit, or maintain positions.
That said, technical conventions do not always play out—particularly against a backdrop of elevated valuations—so traders should remain mindful of the potential for a downside break from the pattern.
For now, the December uptrend is tracking closely alongside the 50-day moving average, creating a key zone where both long and short opportunities could emerge, depending on price behavior, should another pullback unfold.
A successful test and rebound from support could offer opportunities to establish long positions, targeting a retest of resistance near 49,580. Conversely, a decisive break and close below this zone would flip the bias, opening the door for short positions with stops placed above the trendline for protection. On the downside, 47,840 emerges as the first notable objective, aligning with multiple rebound points seen in December. Below that, 47,200—where the current uptrend originated—comes into focus, followed by the 46,875 area, which saw considerable two-way price action in the final quarter of 2025.
Adding some support to the bullish case, the 14-period RSI has broken its downward trend and is holding above the 50 level, indicating that downside momentum has stalled for now. The MACD echoes this view, turning back toward its signal line from below while remaining in positive territory. Overall, the signals suggest a neutral near-term bias, though with a slight edge still favoring the bulls.
The United Nations is considering a global tax framework that would tie oil and gas industry profits to climate compensation, though deep divisions among member states leave the outcome uncertain. Attempts to hold major energy producers financially accountable for climate change are not new. However, as the costs of the energy transition mount and legal efforts deliver mixed results, taxation is increasingly being viewed as an alternative policy instrument.
The United Nations is currently weighing the creation of a new international tax cooperation framework that could, among other objectives, channel funds from the oil and gas industry toward climate-related compensation. While the proposal reflects a familiar ambition to hold the industry financially accountable for climate change, its prospects remain uncertain.
The initiative falls under the Framework Convention on International Tax Cooperation, which is being negotiated at UN headquarters in New York. The broader goal is to strengthen global tax collection mechanisms and increase taxation on the world’s wealthiest entities and individuals. Sustainability features prominently in the discussions, with many countries—particularly those experiencing frequent climate-related disasters—supporting efforts to make major oil producers contribute financially. At the same time, resistance remains strong among other member states that oppose assigning climate liability to the energy sector or implementing a global wealth tax.
Recent proposals have suggested linking oil and gas profits directly to climate compensation payments. However, critics argue that these ideas lack sufficient clarity and enforcement power, limiting their viability. Supporters note that such measures could have generated as much as $1 trillion in additional revenue since the 2015 Paris Agreement, highlighting the scale of the opportunity lost if no agreement is reached.
Any move to formally tax Big Oil for its alleged role in man-made climate change would almost certainly provoke a strong response from the industry, likely through legal challenges. This would build on an already extensive record of climate-related litigation, where activist groups have achieved mixed results.
In the United States, California launched a lawsuit against major oil companies in 2024, accusing them of downplaying the climate risks associated with fossil fuels. The case targets companies including Exxon Mobil, Chevron, BP, and ConocoPhillips. State Attorney General Rob Bonta later strengthened the case by adding a provision aimed at forcing companies to surrender profits derived from alleged wrongful conduct. However, the lawsuit’s progress remains unclear, and California officials have recently softened their rhetoric toward oil companies in an effort to keep refineries operating and prevent fuel price spikes.
Maine has pursued a similar legal path, filing a “climate deception” lawsuit against several oil majors and the American Petroleum Institute. A federal judge allowed the case to proceed last year, with plaintiffs alleging that the defendants concealed information about the environmental and economic consequences of fossil fuel use.
This wave of so-called climate lawfare has become a favored strategy among activists seeking to penalize the fossil fuel industry. Yet given the uncertain outcomes of court cases, taxation is increasingly viewed as a more reliable alternative. The energy transition has proven far more expensive than initially anticipated, and governments are searching for sustainable funding sources.
Big Oil remains an obvious target due to its substantial profits from essential energy commodities that are widely blamed for climate change. Whether the UN negotiations ultimately result in a binding global tax remains to be seen. Even if they do, governments hoping for swift revenue may need patience—because the oil and gas industry is unlikely to accept such measures without a prolonged fight.
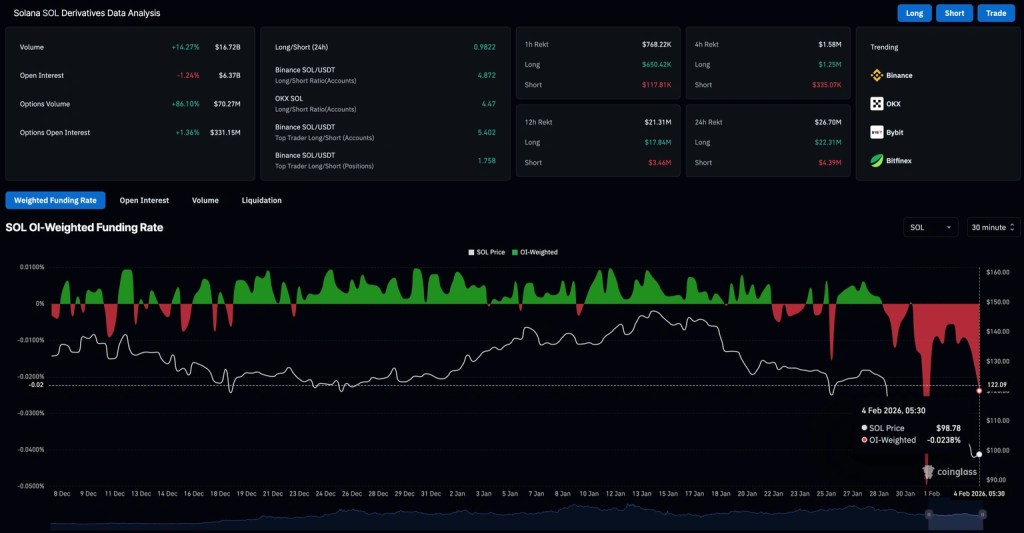
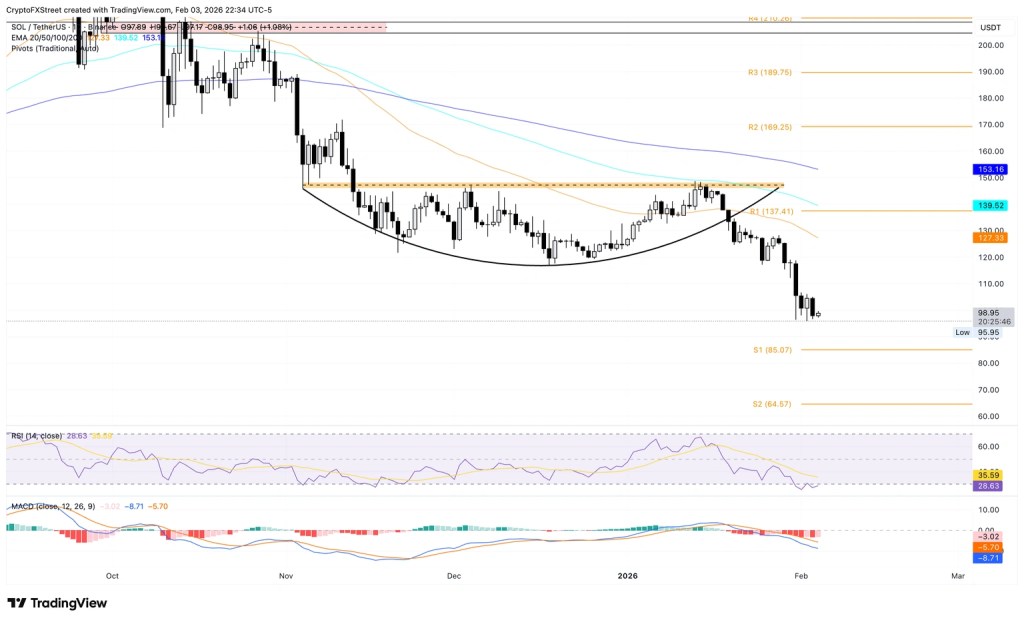
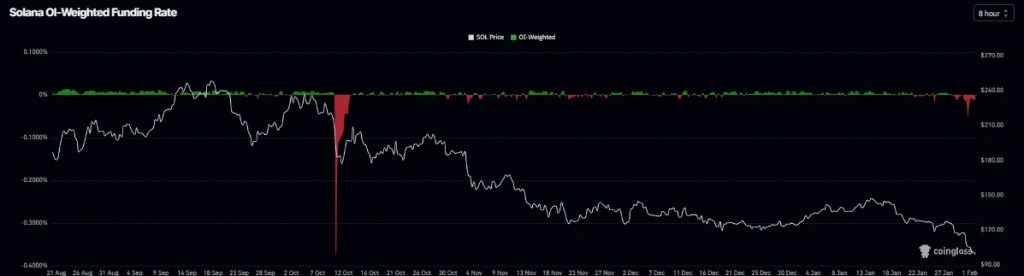
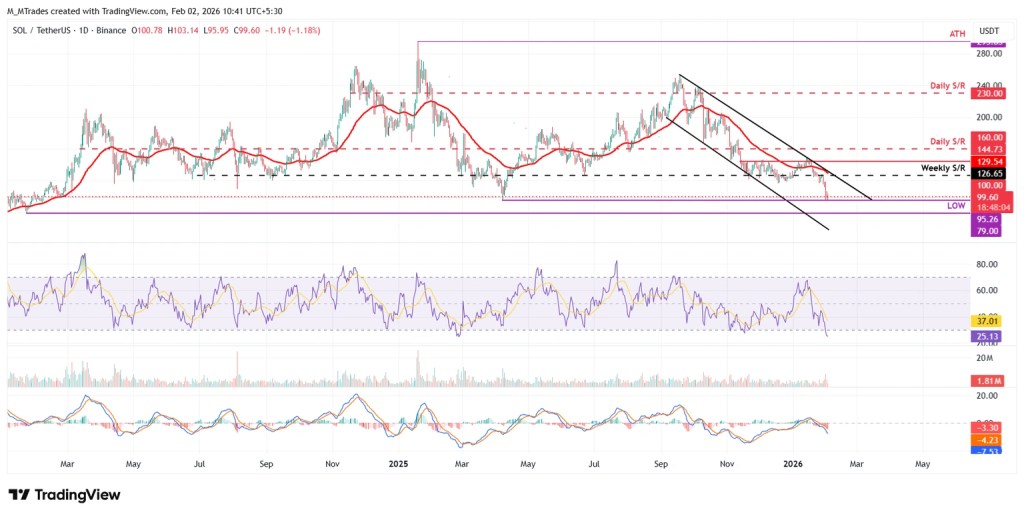
Solana remains below the $100 level on Wednesday after shedding more than 6% in the previous session.
Weakening retail sentiment alongside subdued institutional interest points to a growing bearish bias.
From a technical perspective, rising selling pressure suggests further downside toward the $85 region.
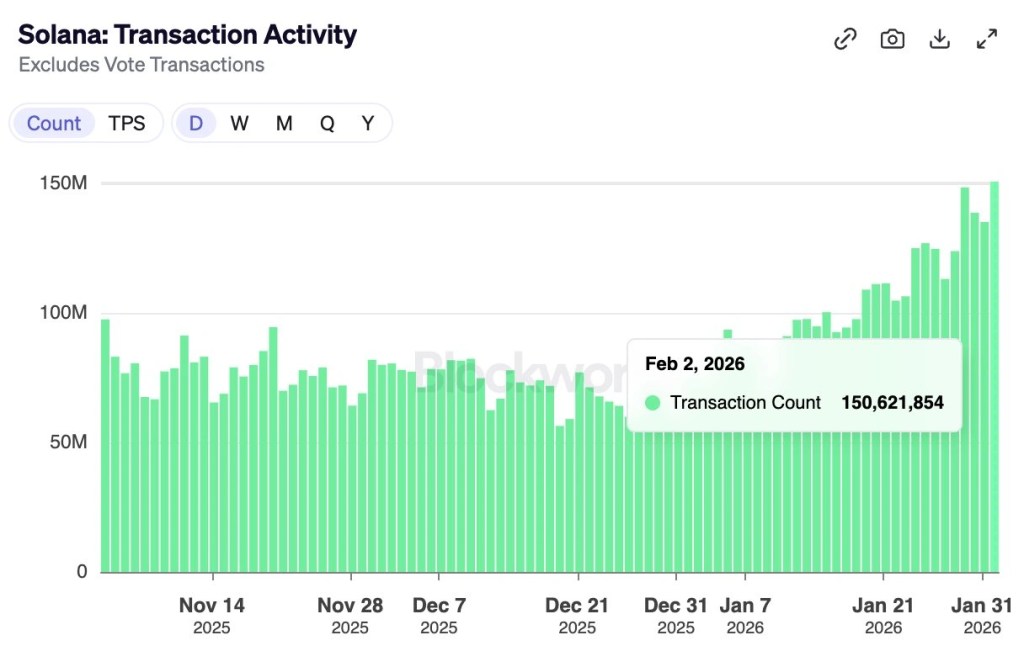
Solana (SOL) remains below the $100 mark at press time on Wednesday, following a decline of more than 6% in the prior session amid broader weakness across the cryptocurrency market. Both institutional and retail interest in Solana continue to fade, even as on-chain metrics recorded a record 150 million daily transactions on Tuesday. From a technical standpoint, strengthening bearish momentum points to the risk of a further slide toward the $85 level.
Solana continues to see robust on-chain user activity, with daily transaction volume reaching a record high on Tuesday. According to Blockworks data, the network processed over 150 million transactions during the day, averaging approximately 1,743 transactions per second.
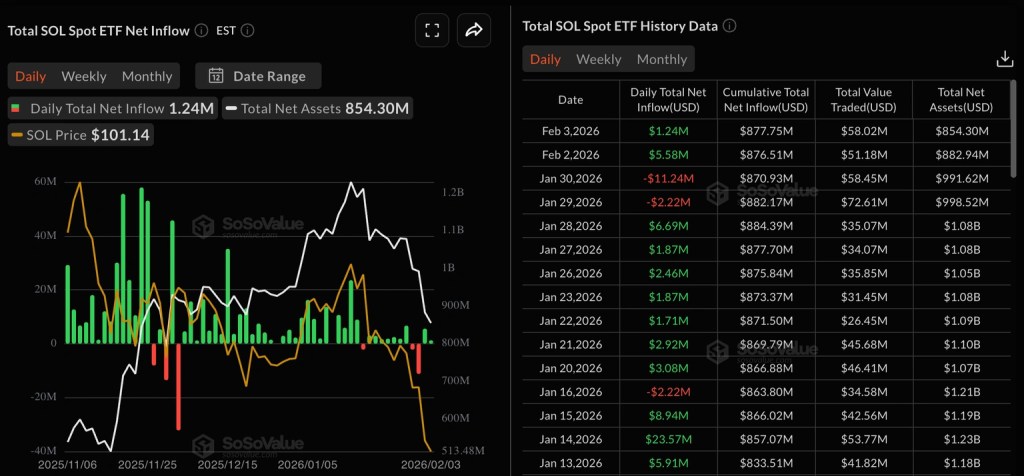
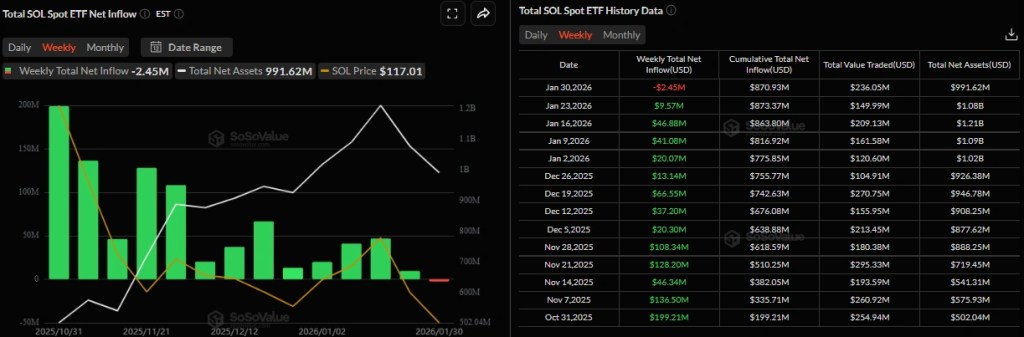
Despite resilient on-chain activity, institutional inflows have stayed muted over the past three weeks, averaging no more than $9 million per day since January and including three sessions of net outflows. Data from Sosovalue shows that U.S. Solana-focused exchange-traded funds (ETFs) posted inflows of $1.24 million on Tuesday, following a $5.58 million inflow recorded on Monday.
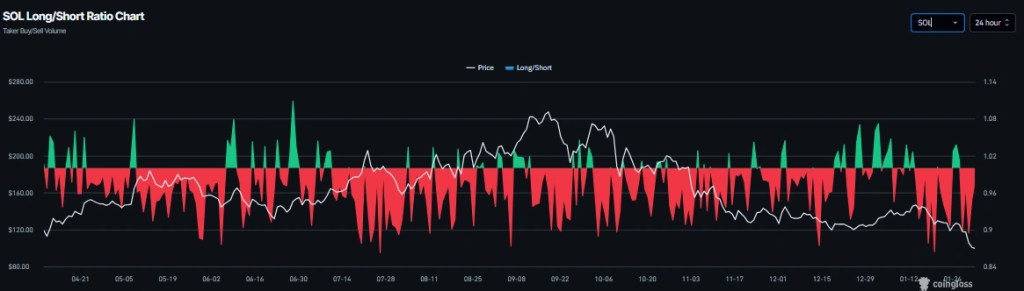
Meanwhile, signals from the derivatives market point to a bearish tilt in Solana sentiment, accompanied by capital outflows. CoinGlass data shows that SOL open interest fell by 1.24% over the past 24 hours to $6.37 billion, suggesting capital exited the market through position closures or reduced leverage.
Liquidation data further highlights the bearish bias, with long liquidations totaling $22.31 million during the period—more than five times the $4.39 million in short liquidations.
In addition, Solana’s OI-weighted funding rate has slipped to -0.0238%, underscoring increasingly negative sentiment as traders holding or initiating short positions are willing to pay a premium to maintain them.
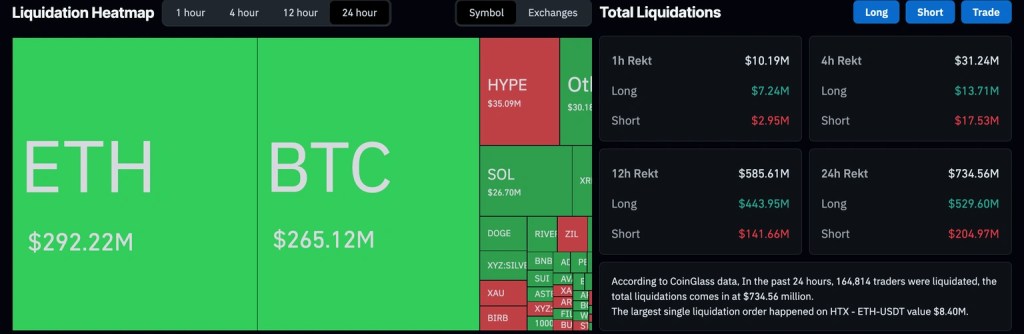
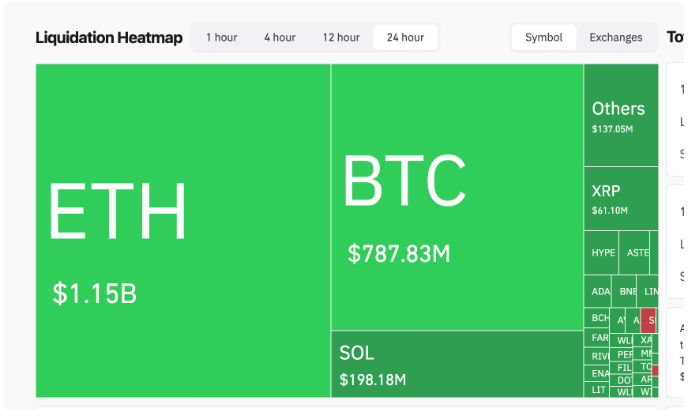
The waning bullish appetite for Solana mirrors the broader market downturn, which has seen total liquidations of around $735 million over the past 24 hours, including approximately $529 million from long positions.
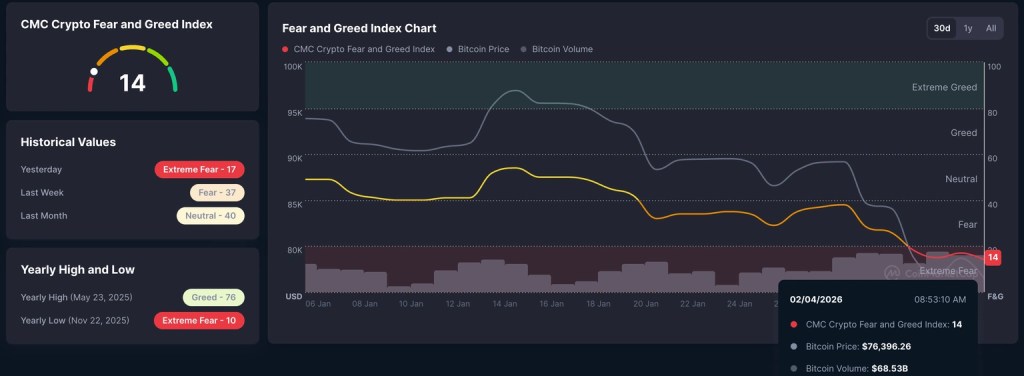
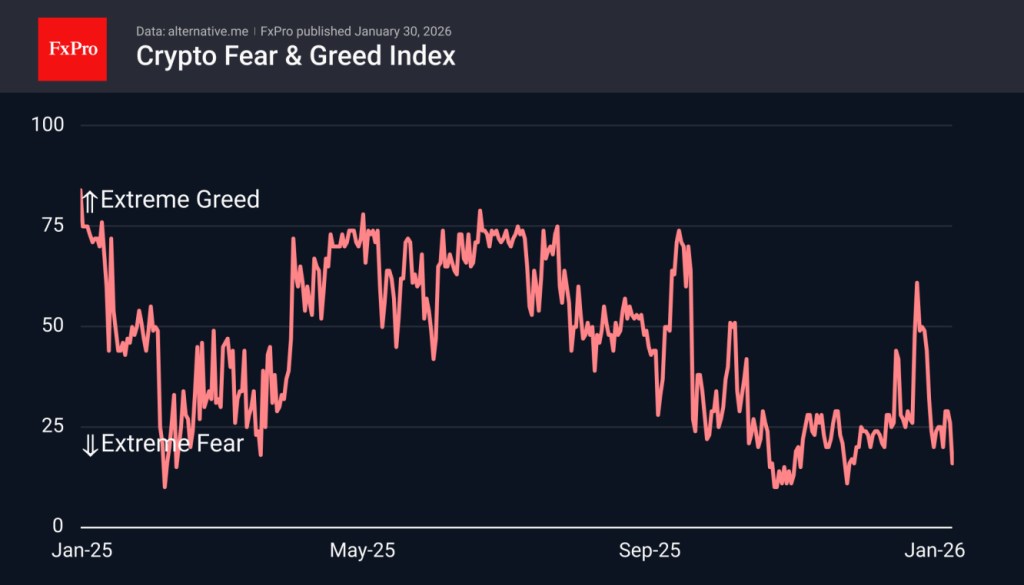
Moreover, the broader cryptocurrency market remains under pressure, with the Fear and Greed Index falling to 14 on Wednesday—pointing to extreme risk-averse sentiment among investors. Without a meaningful improvement in market mood, Solana may face additional downside.
Technical Outlook: Is Solana headed toward $85?
Solana continues to trade below its 50-, 100-, and 200-day Exponential Moving Averages at $127, $139, and $153, respectively, keeping the broader trend firmly under pressure. The shorter-term EMAs remain positioned beneath the longer-term averages, forming a bearish alignment that has capped recent rebound attempts.
A sustained move below the $95 level would leave the S1 Pivot Point at $85 as the next downside target.
Momentum indicators remain decisively negative, with the MACD and signal line both trending lower and extending further into bearish territory on the daily chart. Meanwhile, the Relative Strength Index stands at 28 and is consolidating within oversold territory, a setup that could still allow for additional downside despite stretched conditions.
On the upside, a recovery back above the $100 level could shift focus toward the 50-day EMA near $127 as the initial upside objective.
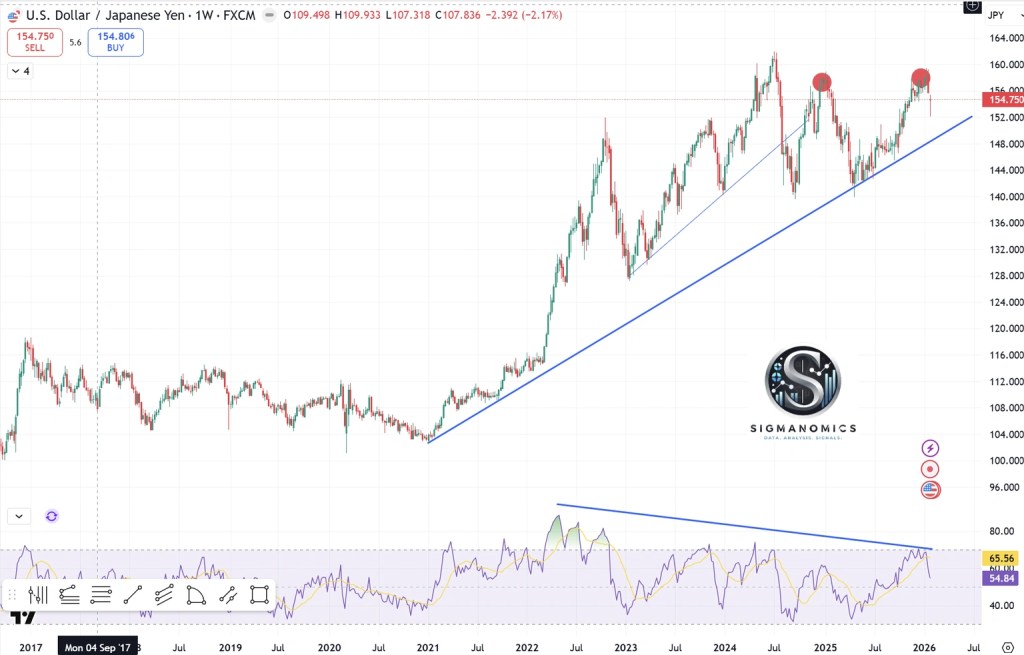
The Japanese yen stays under pressure as fiscal worries and political uncertainty outweigh stronger-than-expected data.
Concerns over possible intervention and the BoJ’s increasingly hawkish stance may deter traders from adding new bearish yen positions.
Rising expectations of further Fed easing weigh on the U.S. dollar and could limit upside in USD/JPY.
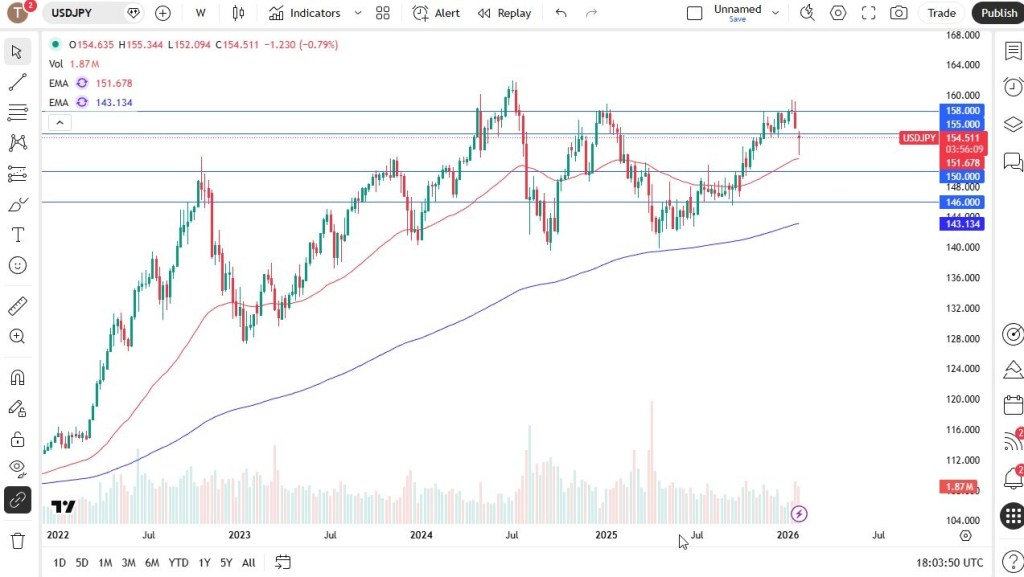
The Japanese yen (JPY) continues its downward trajectory against the U.S. dollar for a fourth consecutive session on Wednesday, sliding to a near two-week low during Asian trading. Persistent concerns over Japan’s fiscal position—linked to Prime Minister Sanae Takaichi’s expansionary spending agenda—remain a key drag on the currency. In addition, heightened political uncertainty ahead of the February 8 snap election further weakens sentiment toward the yen, driving USD/JPY above the 156.00 level.
At the same time, markets remain cautious amid the risk of coordinated Japan–U.S. intervention aimed at curbing excessive yen weakness. Expectations of gradual policy normalization by the Bank of Japan may also discourage traders from adding aggressive bearish positions. Meanwhile, expectations that the Federal Reserve will deliver two additional rate cuts limit U.S. dollar demand, potentially capping further upside in USD/JPY ahead of later U.S. economic data releases.
Yen sellers stay in charge as fiscal strains and political uncertainty persist.
Japan’s services sector gathered momentum at the start of 2026, with business activity expanding for a tenth straight month and at the fastest pace in nearly a year. The Jibun Bank Services PMI rose to 53.7 from 51.6 in December, coming in slightly above market expectations of 53.4. The figures point to a more sustained recovery in the services industry, which represents about 70% of Japan’s GDP.
Despite the encouraging data, market reaction was subdued as concerns over Japan’s fiscal outlook continued to weigh on sentiment. Investor unease has been amplified by Prime Minister Sanae Takaichi’s expansionary fiscal agenda, including aggressive spending plans and proposed tax cuts. As part of her campaign ahead of the February 8 snap lower house election, Takaichi has pledged to suspend the 8% consumption tax on food for two years, bringing renewed focus to Japan’s already stretched public finances and keeping the yen under pressure on Wednesday.
Meanwhile, a recent and unusual rate check by the New York Federal Reserve was interpreted as the clearest indication so far of coordination between Japanese and U.S. authorities to curb excessive yen weakness. This lowers the bar for potential intervention and could help limit further JPY losses, particularly alongside expectations of a more hawkish Bank of Japan.
The Summary of Opinions from the BoJ’s January meeting, released Monday, revealed that policymakers discussed rising inflationary pressures stemming from a weaker yen. Board members also agreed that additional rate hikes would be appropriate over time, a stance that could provide underlying support for the JPY.
On the other side, the U.S. dollar has struggled to extend last week’s rebound from a four-year low, despite support from the nomination of Kevin Warsh as the next Federal Reserve chair. Even the approval of a government funding package to end a partial shutdown failed to generate meaningful upside for the greenback.
Looking ahead, traders are awaiting the U.S. ADP employment report and the ISM Services PMI. In addition, remarks from influential FOMC members could shape near-term USD demand amid expectations for two more Fed rate cuts in 2026, with implications for the USD/JPY pair.
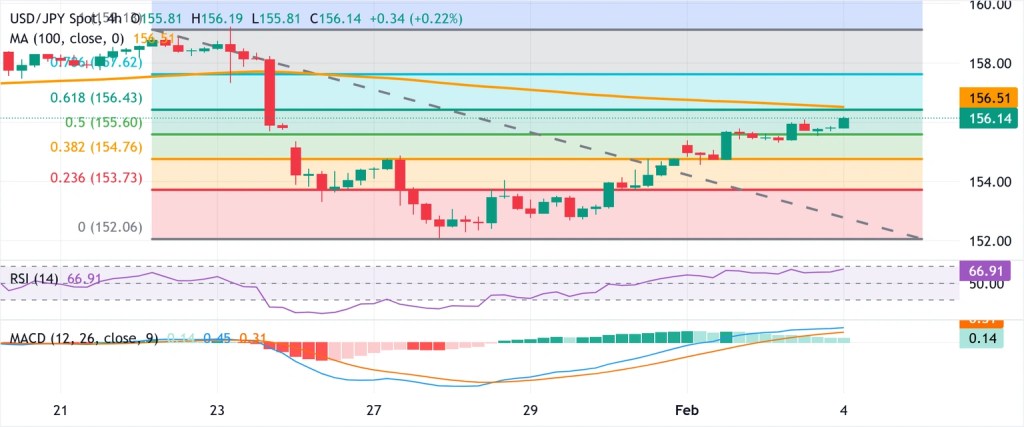
USD/JPY must clear the 156.50 confluence zone to reinforce bullish momentum.
Wednesday’s push above the 156.00 handle builds on the overnight breakout through the 50% retracement of the 159.13–152.06 decline, tilting the near-term bias in favor of USD/JPY bulls. The 14-period Relative Strength Index stands at 66.9, remaining below overbought territory and pointing to a solid, albeit increasingly mature, upswing.
That said, the MACD histogram, while still in positive territory, is narrowing—an early sign of waning bullish momentum. The MACD line remains above the Signal line, with both oscillating close to the zero level, underscoring a more cautious and transitional setup.
As a result, further upside is likely to face notable resistance around the 156.51 confluence, which combines the 100-period Simple Moving Average on the 4-hour chart and the 61.8% Fibonacci retracement. A sustained move above this zone would be required to reassert a constructive short-term outlook.
A decisive break could pave the way toward the 78.6% retracement at 157.62. Conversely, an inability to clear this hurdle would leave the rebound exposed to renewed downside pressure. Moreover, USD/JPY continues to trade below a downward-sloping 100-period SMA, suggesting that upside attempts may remain constrained for now.
U.S. President Donald Trump has signed legislation bringing the government shutdown to an end, an outcome that markets largely took in stride given how routine such episodes have become.
However, UBS Chief Economist Paul Donovan noted that Democrats have coalesced in opposition to confirming former Federal Reserve Governor Kevin Warsh as the next Fed chair until the administration’s legal challenge involving the Fed is resolved. This impasse raises the possibility that Chair Jerome Powell could remain in office beyond May.
Resolution of the government shutdown influences market conditions.
Government dysfunction in the U.S. has become so routine that financial markets largely ignored it.
Democrats have indicated they will block the confirmation of former Federal Reserve Governor Warsh as the next Fed chair unless the administration halts its legal actions against the Federal Reserve.
While this outcome was widely anticipated, it increases the likelihood that Chair Powell could remain as FOMC chair—though not as Chair of the Board of Governors—beyond May.
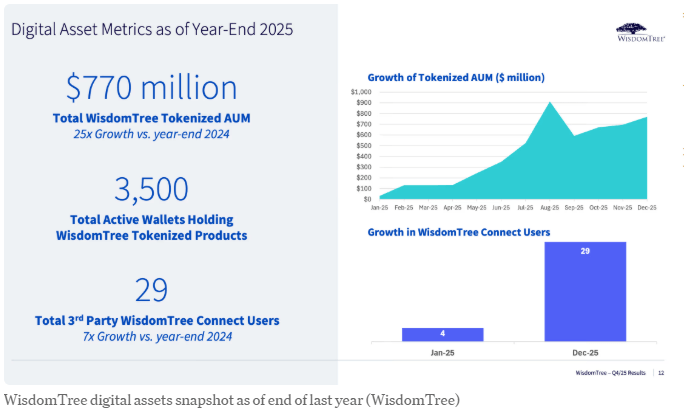
WisdomTree CEO Jonathan Steinberg said the firm’s push into tokenization is approaching profitability, underscoring a shift in which crypto has evolved from a small-scale experiment into a core pillar of the company’s strategy.
The asset manager has rapidly expanded its digital-asset business, growing tokenized assets under management from roughly $30 million to about $750 million, while extending its offerings across additional blockchains, including Solana.
Steinberg described crypto as a foundation for modernizing financial infrastructure, pointing to initiatives such as tokenized investment products, the WisdomTree Connect platform, and a deliberate focus on compliance-oriented tokenization technology as central to the firm’s long-term growth plans.
New York — WisdomTree’s crypto business has moved beyond the experimental phase and is now central to the firm’s long-term strategy, with profitability coming into view, CEO Jonathan Steinberg said during a fireside chat at the Ondo Summit in New York on Tuesday.
“We want to continue to scale,” Steinberg said, noting that the firm’s digital-asset business expanded from roughly $30 million to about $750 million in assets last year. While WisdomTree does not yet generate profits from its crypto operations, Steinberg said the company is now “within line of sight of taking this to a profitable business.”
The $150 billion asset manager has been investing heavily in blockchain infrastructure, rolling out tokenized investment products and expanding to additional blockchains, including Solana. Steinberg emphasized that the push reflects long-term conviction rather than short-term experimentation. “It’s still early days, but it’s not an experiment now,” he said. “We have conviction, and we believe that eventually everything will move on-chain.”
WisdomTree’s growing commitment to digital assets was also highlighted in its latest earnings presentation, which showed total tokenized assets under management rising to $770 million—an increase of roughly 25 times from 2024 levels.
WisdomTree has emerged as an early and aggressive leader among traditional asset managers in the digital-asset space, rolling out a range of tokenized funds and recently broadening distribution through WisdomTree Connect, a platform that allows these assets to move seamlessly across self-custodied wallets and institutional systems.
The firm has also made a strategic push into blockchain infrastructure, most notably through its acquisition of Securrency, a compliance-focused tokenization company that was later sold to the DTCC. Steinberg said the deal laid the groundwork for “compliance-aware tokens” and programmable finance, forming the backbone of WisdomTree’s long-term, interoperable digital-asset strategy.
For Steinberg, crypto represents far more than a new product line—it signals a transformation of the financial system itself. “This is bigger than asset management; it’s really about financial services,” he said. He noted that many financial institutions are built on layers of legacy infrastructure accumulated over centuries, underscoring the need for modernization.
The steep sell-off in cryptocurrencies eased on Tuesday after the U.S. House narrowly approved a funding package, sending the legislation to President Donald Trump’s desk and effectively ending the partial government shutdown.
The House passed the bill by a slim 217–214 margin, clearing the way for the government to reopen once the president signs it. While lawmakers will continue negotiations over funding for the Department of Homeland Security in the coming days, most major federal agencies will remain funded.
The development helped pause a panic-driven rout in crypto markets earlier in the session. Bitcoin briefly slid to around $72,800—its lowest level since before Trump’s election victory in November 2024—before stabilizing. At roughly $74,800, bitcoin was still down about 4.5% over the past 24 hours.
Ether traded near $2,181, down 7% on the day and roughly 26% over the past week. Other major tokens, including XRP and Solana, recorded similar losses.
U.S. equities also rebounded from their intraday lows but remained sharply lower overall, with the Nasdaq down around 2% and the S&P 500 lower by about 1.3%.
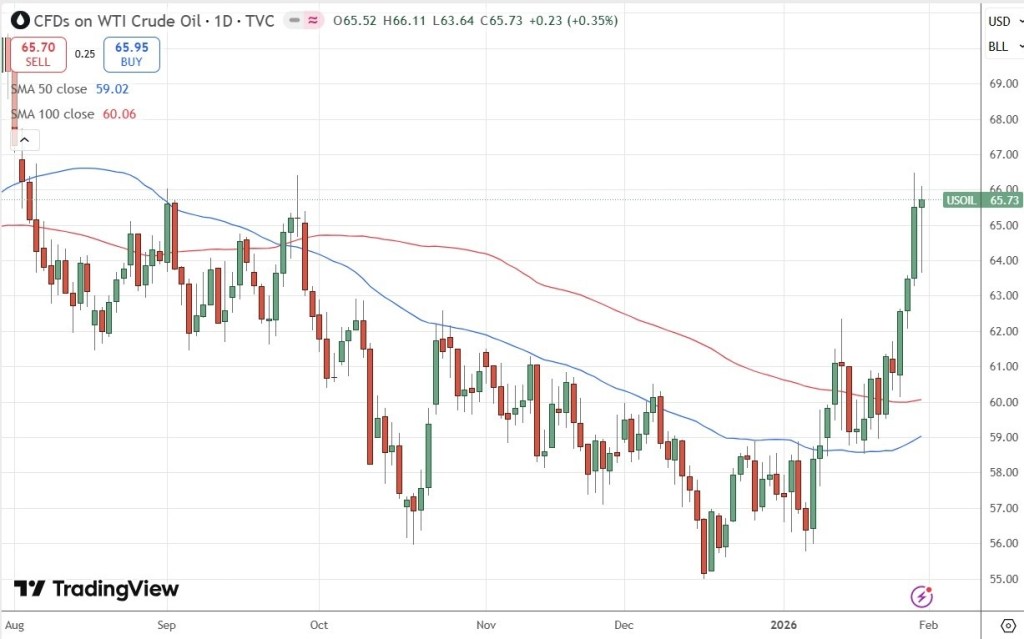
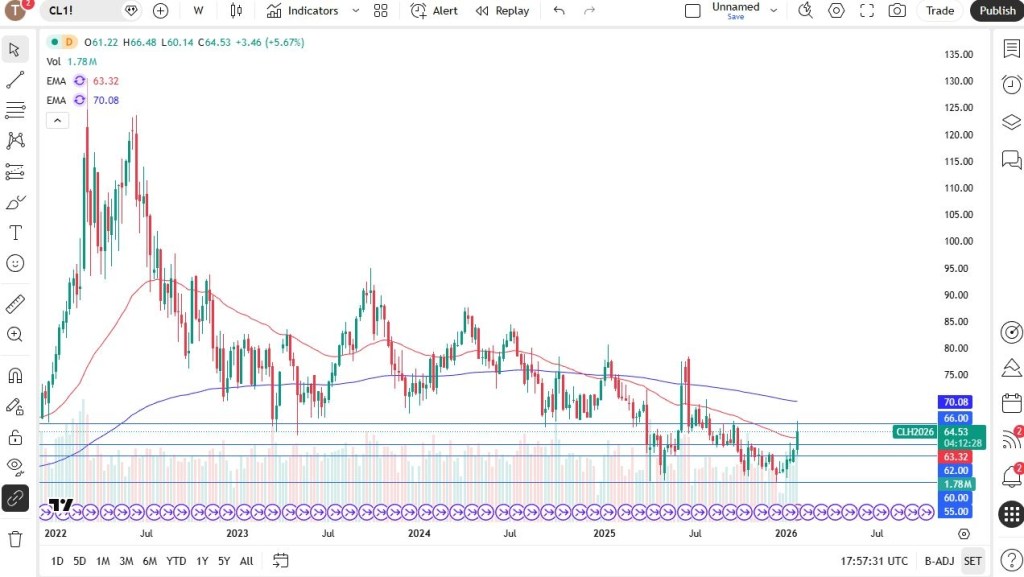
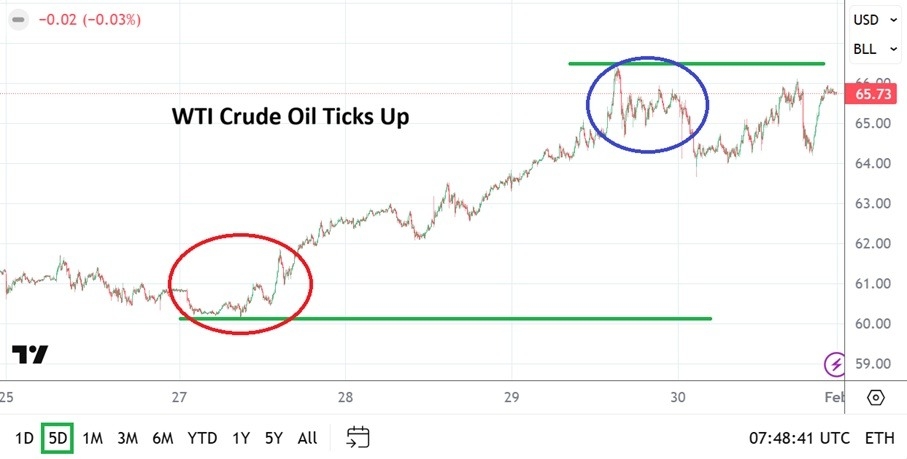
WTI crude prices edged higher to around $63.75 during Wednesday’s Asian trading session.
The move came after the U.S. military said it shot down an Iranian drone that “aggressively approached” a U.S. aircraft carrier, heightening geopolitical tensions.
Oil prices were also supported by data showing U.S. crude inventories recorded their largest decline since August 2023.
West Texas Intermediate (WTI), the U.S. crude oil benchmark, was trading near $63.75 during Asian hours on Wednesday, edging higher amid rising concerns over escalating tensions between the United States and Iran. Market participants are also positioning ahead of the release of the U.S. Energy Information Administration’s (EIA) crude oil inventory report later in the day.
According to CNBC, the U.S. military shot down an Iranian drone on Tuesday that had “aggressively” approached the USS Abraham Lincoln aircraft carrier in the Arabian Sea. The incident comes at a time of heightened Middle East tensions, as U.S. President Donald Trump weighs potential military action against Iran.
Iran has also insisted that talks with the United States this week be held in Oman rather than Turkey, and that negotiations be limited to bilateral discussions focused solely on nuclear issues, further complicating an already fragile diplomatic process. Any escalation in tensions between Washington and Tehran—OPEC’s fourth-largest crude producer—could provide near-term support to WTI prices.
Meanwhile, the American Petroleum Institute’s (API) weekly report showed that U.S. crude inventories fell by 11.1 million barrels in the week ended January 30, sharply deeper than the 250,000-barrel decline seen the previous week and well below market expectations for a 700,000-barrel build. The sizeable drawdown in stockpiles could lend additional support to oil prices.
On the downside, renewed demand for the U.S. dollar may cap gains in dollar-denominated commodities. U.S. President Donald Trump’s nomination of Governor Kevin Warsh as the next Federal Reserve chair has led traders to expect a slower pace of interest rate cuts and a greater emphasis on reducing the Fed’s balance sheet under his leadership.
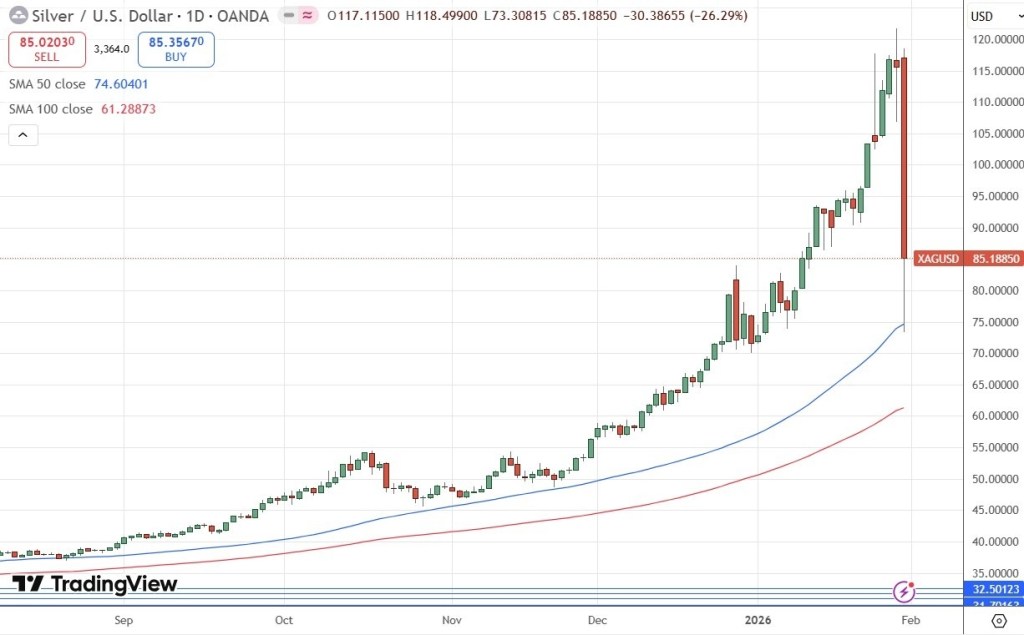
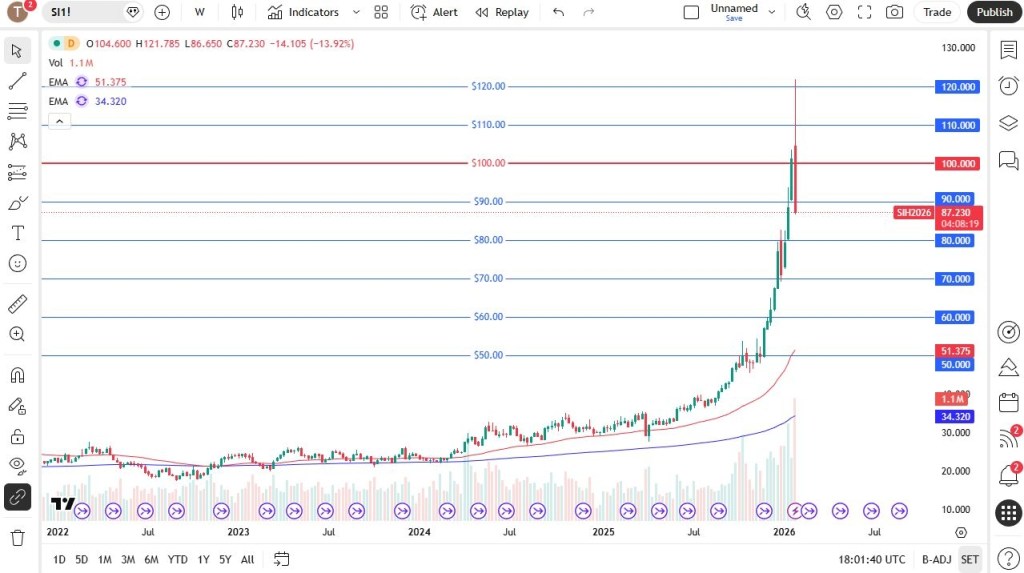
Silver prices climbed to around $87.60 during Wednesday’s Asian trading session.
However, shifting expectations surrounding the next Federal Reserve chair could limit further upside in the metal.
Demand for safe-haven assets strengthened after reports that the United States shot down an Iranian drone that was approaching an aircraft carrier.
Silver prices (XAG/USD) climbed to around $87.60 during Asian trading on Wednesday, rebounding after a historic correction last week as dip-buying activity returned to the market.
On Friday, U.S. President Donald Trump nominated Kevin Warsh to replace Jerome Powell as the next Chair of the Federal Reserve, with Warsh expected to assume the role when Powell’s term ends in May. Expectations that Trump’s nominee may favor keeping interest rates elevated to combat inflation have supported the U.S. dollar, potentially weighing on dollar-denominated commodities such as silver.
Precious metals have also faced pressure from margin hikes by the CME Group. Over the weekend, the exchange raised margin requirements for gold and silver, forcing many leveraged traders to liquidate positions to meet higher costs.
On the other hand, safe-haven demand has been underpinned by rising geopolitical risks and economic uncertainty. Reuters reported on Tuesday that the U.S. military shot down an Iranian drone that “aggressively” approached the Abraham Lincoln aircraft carrier in the Arabian Sea.
Separately, Iran requested that this week’s negotiations with the United States be held in Oman rather than Turkey and limited to bilateral discussions focused solely on nuclear issues. President Trump warned that with U.S. warships moving toward Iran, “bad things” could occur if an agreement is not reached.
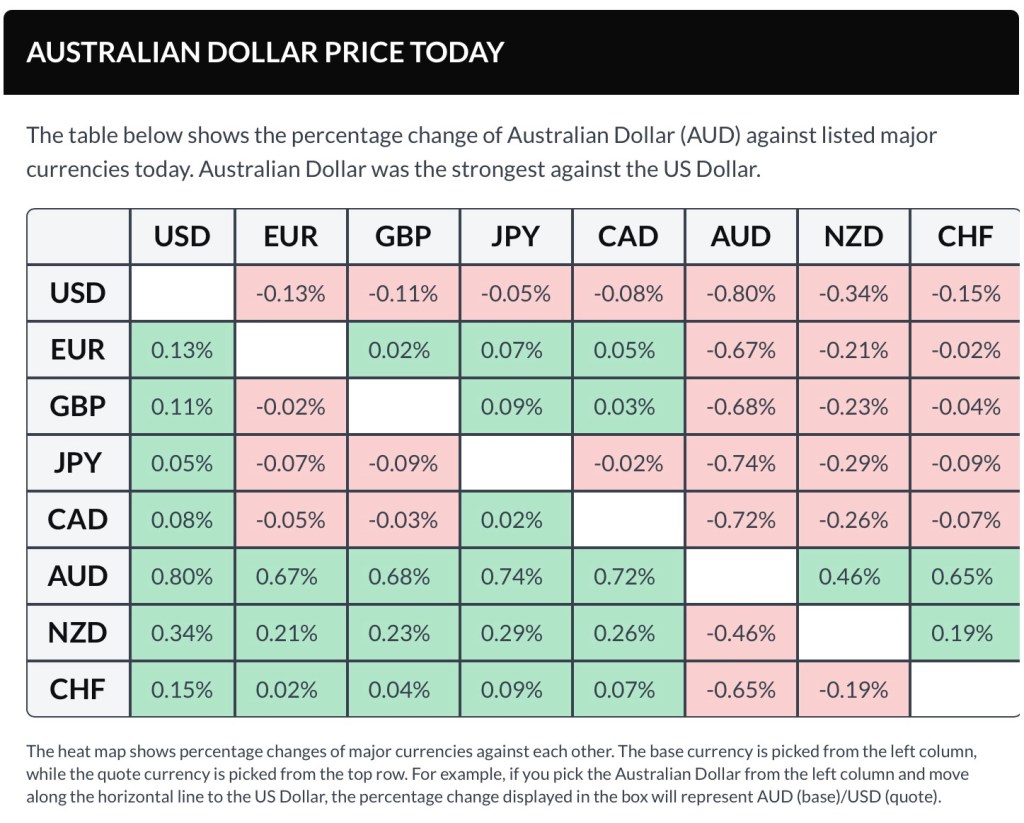
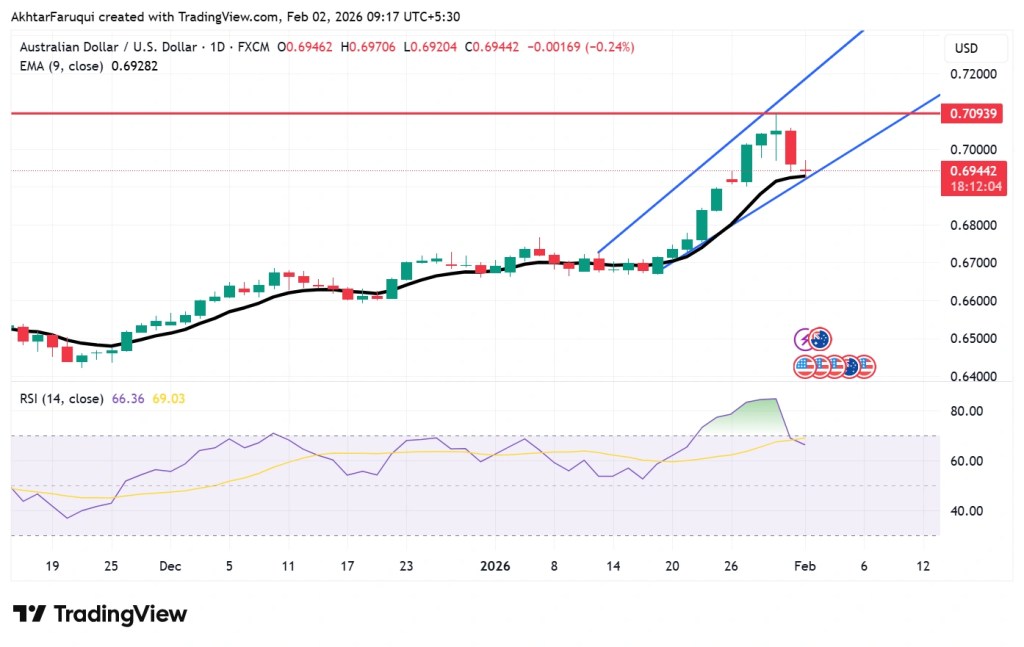
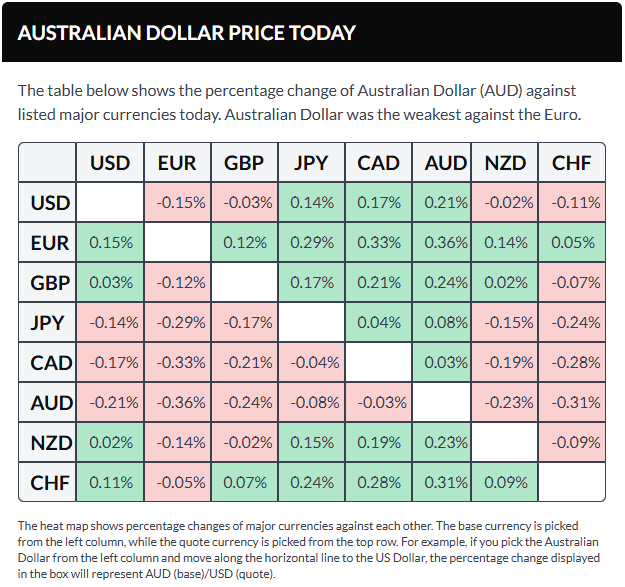
The Australian dollar strengthened after the Composite PMI surged to 55.7 in January, marking the fastest pace of expansion in nearly four years.
The Aussie also benefited as markets priced in an 80% probability of an interest rate hike in May, along with around 40 basis points of additional policy tightening.
Meanwhile, the U.S. dollar remained subdued for a second straight session.
The Australian dollar strengthened against the U.S. dollar on Wednesday, extending gains of more than 1% from the previous session. The AUD/USD pair held firm after China’s Services Purchasing Managers’ Index (PMI) rose to 52.3 in January from 52.0 in December, beating market expectations of 51.8. As China is Australia’s largest trading partner, improvements in Chinese economic activity tend to support the Aussie.
The AUD also drew support from upbeat domestic PMI data. Seasonally adjusted figures from S&P Global showed Australia’s Composite PMI climbed to 55.7 in January from 51.0 in December, marking the strongest expansion in 45 months. The Services PMI jumped to 56.3 from 51.1, its highest reading since February 2022, exceeding the flash estimate of 56.0 and remaining well above the 50.0 threshold. This extended the run of expansion in services activity to two years.
The Reserve Bank of Australia raised its Official Cash Rate by 25 basis points to 3.85% on Tuesday, pointing to stronger-than-expected economic growth and persistently elevated inflation. As the tightening cycle gathers momentum, markets have increased the odds of another rate hike in May to around 80% and are now pricing in roughly 40 basis points of additional tightening through the rest of the year.
Speaking at the post-meeting press conference, RBA Governor Michele Bullock said inflationary pressures remain uncomfortably high, warning that a return to the target range will take longer than previously expected and is no longer acceptable. She emphasized that the board will remain data-dependent and avoid providing forward guidance.
U.S. dollar little changed after recent losses
The U.S. Dollar Index (DXY), which tracks the greenback against six major currencies, remained subdued for a second straight session, trading near 97.40 at the time of writing.
Data released on Monday showed an unexpected rebound in U.S. manufacturing activity, underscoring economic resilience. The ISM Manufacturing PMI rose to 52.6 in January from 47.9 in December, comfortably beating expectations of 48.5.
Markets have also been assessing President Donald Trump’s nomination of Kevin Warsh as the next Federal Reserve chair, a move widely interpreted as signaling a more disciplined and cautious approach to monetary easing. The dollar found some support earlier as risk sentiment improved after the U.S. Senate reached an agreement to advance a government funding package, averting a shutdown, according to Politico.
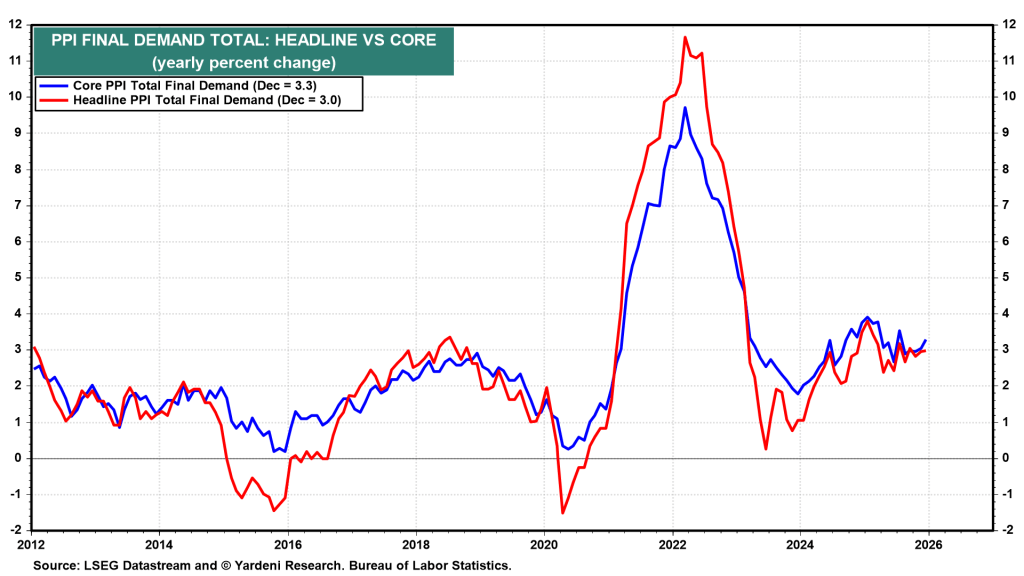
Producer-side inflation in the U.S. remained firm, reinforcing the Fed’s policy stance. Headline PPI held steady at 3.0% year-over-year in December, unchanged from November and above expectations for a slowdown to 2.7%. Core PPI, which excludes food and energy, accelerated to 3.3% from 3.0%, defying forecasts for a decline to 2.9% and highlighting persistent upstream price pressures.
Fed officials struck a cautious tone. St. Louis Fed President Alberto Musalem said additional rate cuts are not warranted at this stage, describing the current 3.50%–3.75% policy rate range as broadly neutral. Atlanta Fed President Raphael Bostic echoed this view, urging patience and arguing that policy should remain modestly restrictive.
In Australia, inflation data showed mixed signals. The RBA’s trimmed mean inflation rose 0.2% month-over-month and 3.3% year-over-year, while the monthly CPI jumped 1.0% in December, exceeding forecasts of 0.7%. Export prices climbed 3.2% quarter-on-quarter in Q4 2025—the first increase in three quarters and the strongest gain in a year—while import prices rose 0.9%, beating expectations for a decline.
China’s RatingDog Manufacturing PMI edged up to 50.3 in January from 50.1 in December, in line with expectations and marking the fastest pace of factory expansion since October.
Additional Australian indicators pointed to easing inflation momentum and improving labor demand. The TD-MI Inflation Gauge rose 3.6% year-over-year in January, while monthly inflation increased just 0.2%, the weakest pace since August. Meanwhile, ANZ Job Advertisements surged 4.4% month-over-month in December, posting the strongest increase since February 2022 and signaling renewed momentum in hiring toward year-end.
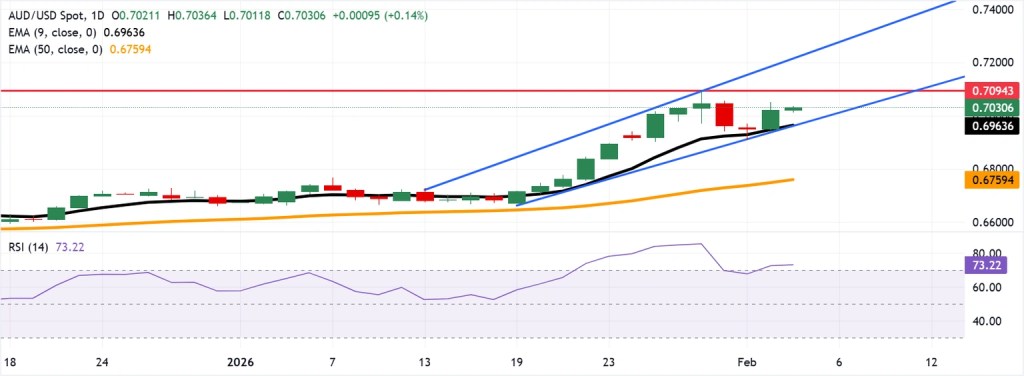
Australian dollar rebounds toward three-year highs near 0.7100
The AUD/USD pair was trading near 0.7030 on Wednesday. Analysis of the daily chart shows the pair remains within an ascending channel, pointing to a sustained bullish bias. The 14-day Relative Strength Index (RSI) stands at 73.30, signaling strong upward momentum, though conditions appear increasingly stretched.
AUD/USD recently rebounded toward 0.7094, its highest level since February 2023, reached on January 29. A decisive break above this resistance could open the way for a move toward the upper boundary of the ascending channel around 0.7210. On the downside, initial support is seen at the nine-day Exponential Moving Average (EMA) near 0.6964, which coincides with the channel’s lower boundary. A deeper pullback could bring the 50-day EMA at 0.6759 into focus.
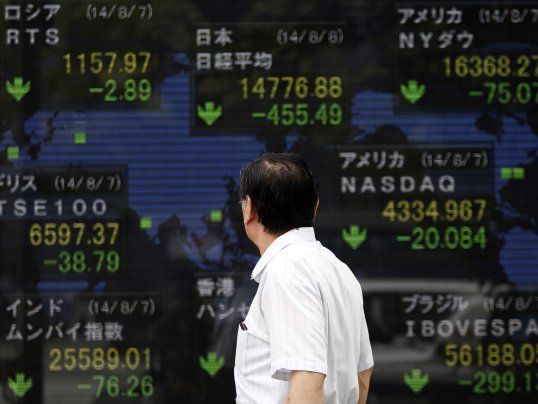
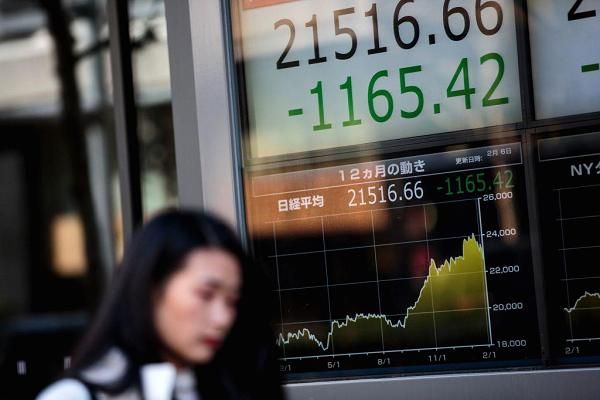
Asian equity markets were mixed on Wednesday, with South Korean stocks climbing to a record high, though broader gains were limited as a rally in technology shares lost momentum following a weaker close on Wall Street.
U.S. markets finished lower overnight, led by declines in the technology sector as concerns resurfaced over potential disruption stemming from the rapid pace of advancements in artificial intelligence.
The Nasdaq underperformed broader market indexes, as investors adopted a cautious stance ahead of key earnings reports from major U.S. technology companies.
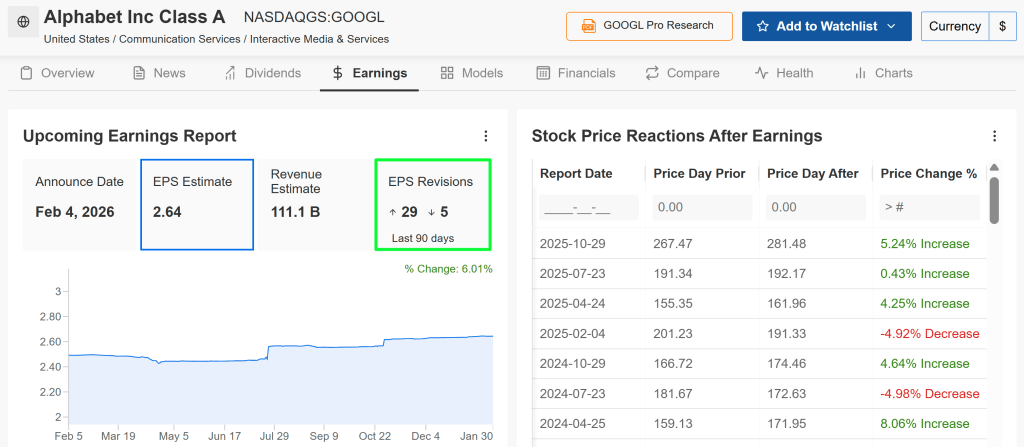
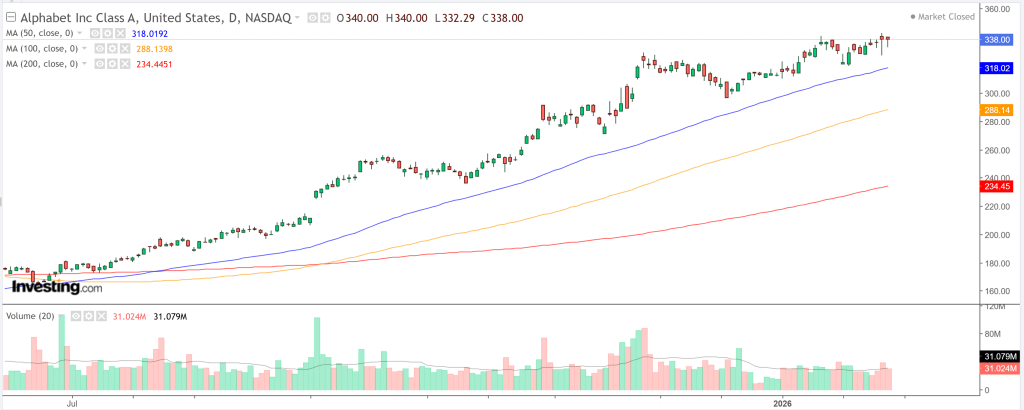
Alphabet (NASDAQ: GOOGL) is set to release its results later on Wednesday, followed by Amazon (NASDAQ: AMZN) on Thursday, with both reports expected to serve as important gauges of demand for advertising, cloud services, and AI-related spending.
Asian stocks mixed as South Korea’s KOSPI hits record high
Asian markets were coming off a strong previous session, when equities rallied broadly across the region.
South Korea’s KOSPI climbed nearly 1% on Wednesday to a record high of 5,361.85 points, after surging almost 7% the day before on strong gains in heavyweight chipmakers and technology stocks.
Japan’s Nikkei 225 slipped 0.7% following a roughly 4% advance in the prior session.
Sentiment toward artificial intelligence remained volatile, as overnight declines in U.S. technology shares weighed on regional peers and triggered some profit-taking after recent sharp rallies.
Elsewhere in the region, China’s Shanghai Composite edged up 0.1%, while the blue-chip CSI 300 slipped 0.2%. Hong Kong’s Hang Seng fell 0.5%.
Australia’s S&P/ASX 200 added 0.5%, Singapore’s Straits Times Index was flat, and futures for India’s Nifty 50 ticked higher. The Nifty surged nearly 3% on Tuesday after the U.S. signed a trade agreement with India that sharply reduced tariffs.
Fed overhaul concerns persist as China services PMI comes into focus
Investors also remained cautious over President Donald Trump’s nomination of former Federal Reserve governor Kevin Warsh as the next Fed chair.
Warsh is widely regarded as having a hawkish policy stance, fueling concerns that U.S. interest rates may stay higher for longer.
In China, a private-sector survey released on Wednesday showed that the services sector expanded in January at its fastest pace in three months.
While the data provided some reassurance about underlying demand in the world’s second-largest economy, investor sentiment remained restrained amid ongoing concerns about uneven growth and subdued consumer confidence.
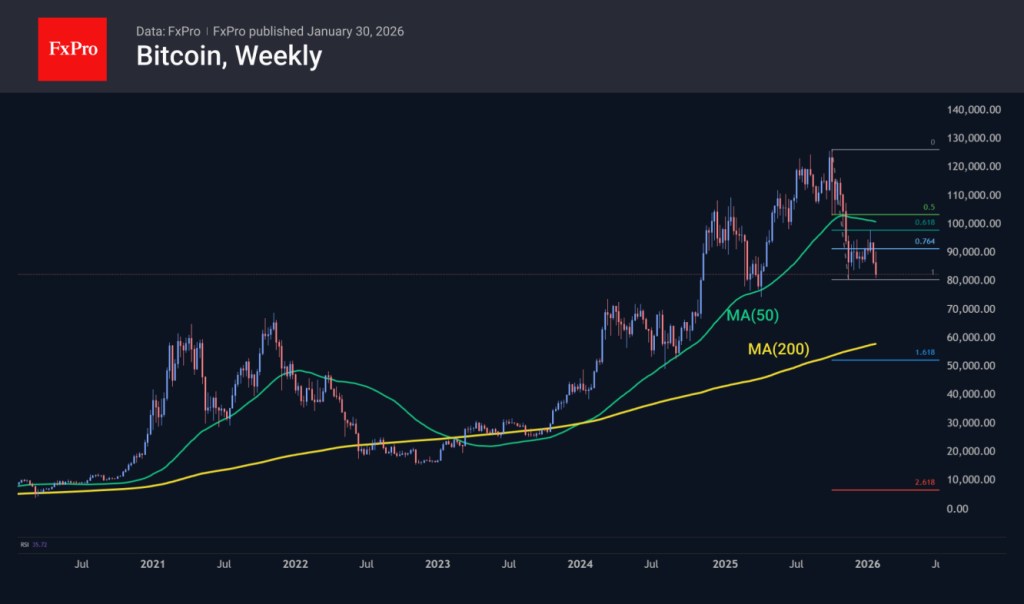
Bitcoin fell sharply on Tuesday, giving up all gains made since President Donald Trump’s election victory, as selling pressure remained intense following heavy liquidations over the weekend. Ongoing uncertainty surrounding U.S. monetary policy further weighed on sentiment.
The world’s largest cryptocurrency was last down 4.2% at $74,699.9 by 15:12 ET (20:12 GMT), marking its lowest level since early November 2024. Prices touched an intraday low of $73,004.3, leaving Bitcoin down roughly 59% from its record high and firmly entrenched in bear market territory.
Menno Martens, a crypto specialist and product manager at VanEck, said the market is simply entering another familiar phase of the cycle.
“There’s no question that this is a bear market,” Martens told Investing.com, noting that the current downturn differs from previous ones due to growing geopolitical and macroeconomic influences, particularly developments in the United States.
He explained that the path of this cycle does not mirror past bull and bear markets exactly, largely because of these new external factors. However, Martens emphasized that the broader outlook remains unchanged, adding that VanEck continues to maintain a long-term perspective despite the current bearish conditions.
Bitcoin weighed down by heavy liquidations and Trump’s Fed pick
The sharp sell-off in cryptocurrencies over the weekend was fueled by widespread liquidations of leveraged positions, underscoring the heavy speculative buildup that had accumulated during last year’s rally. Data from derivatives tracking firms showed that crypto positions worth several billion dollars were wiped out in a short span, with long trades accounting for most of the forced closures.
Thin market liquidity further amplified volatility, allowing relatively modest price moves to trigger cascading liquidations.
Investor sentiment has also been dampened by broader macroeconomic uncertainty. Markets are weighing the implications of Kevin Warsh’s nomination as the next chair of the U.S. Federal Reserve, prompting a reassessment of the outlook for interest rates.
Warsh is broadly perceived as leaning toward a more hawkish policy stance, stoking concerns that tighter financial conditions could persist for longer.
Separately, the release of January’s closely watched U.S. employment report—originally scheduled for Friday—has been delayed due to a partial government shutdown, according to the Bureau of Labor Statistics.
White House crypto meeting ends without agreement on stablecoin yields
The cryptocurrency industry and major U.S. banks remain divided over how to regulate stablecoin yields following a White House meeting, underscoring ongoing hurdles to advancing long-delayed crypto legislation, according to media reports.
Executives from crypto companies, representatives from large banks, and government officials gathered in Washington to discuss market-structure rules, but made little headway on the key question of whether stablecoin issuers should be permitted to offer yield-like returns.
Banks have warned that yield-bearing stablecoins could accelerate deposit outflows and threaten financial stability, while crypto firms argue that such features are essential for innovation, growth, and maintaining competitiveness.
Crypto prices today: altcoins rebound as Polygon surges 10%
Most altcoins also moved lower on Tuesday.
Ethereum, the world’s second-largest cryptocurrency, fell 4.9% to $2,242.43, while third-ranked XRP declined 3.6% to $1.58.
Solana dropped 4.1%, and Cardano eased 1.8%.
Among meme tokens, Dogecoin slipped 2.1%, while the $TRUMP token fell 1.4%.
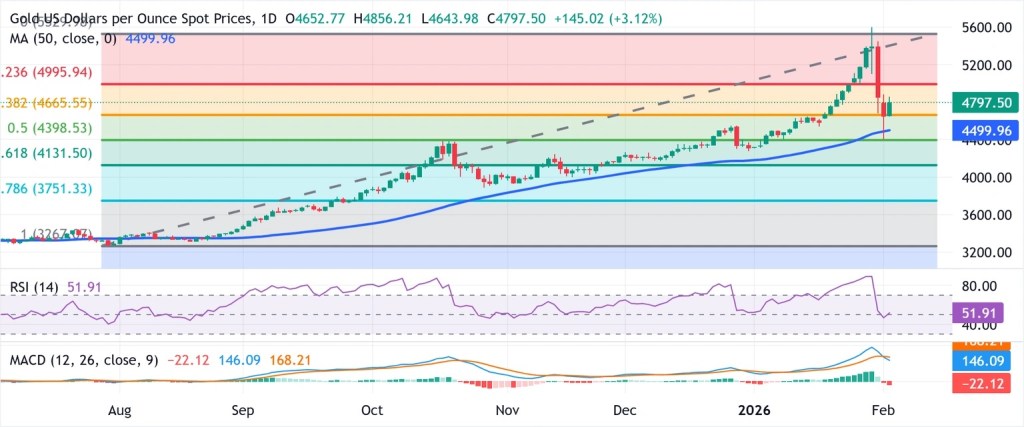
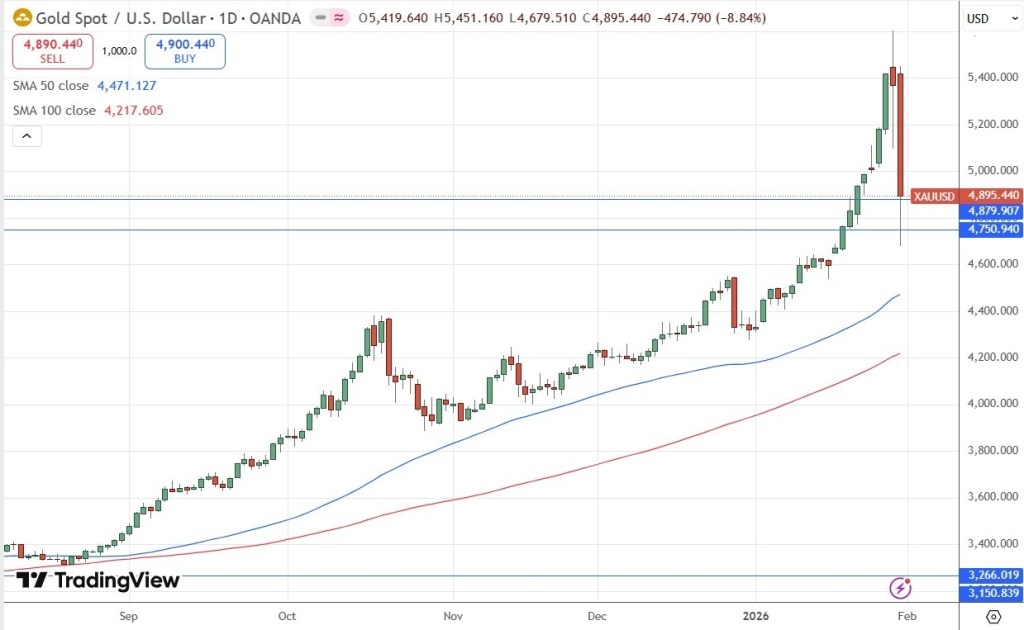
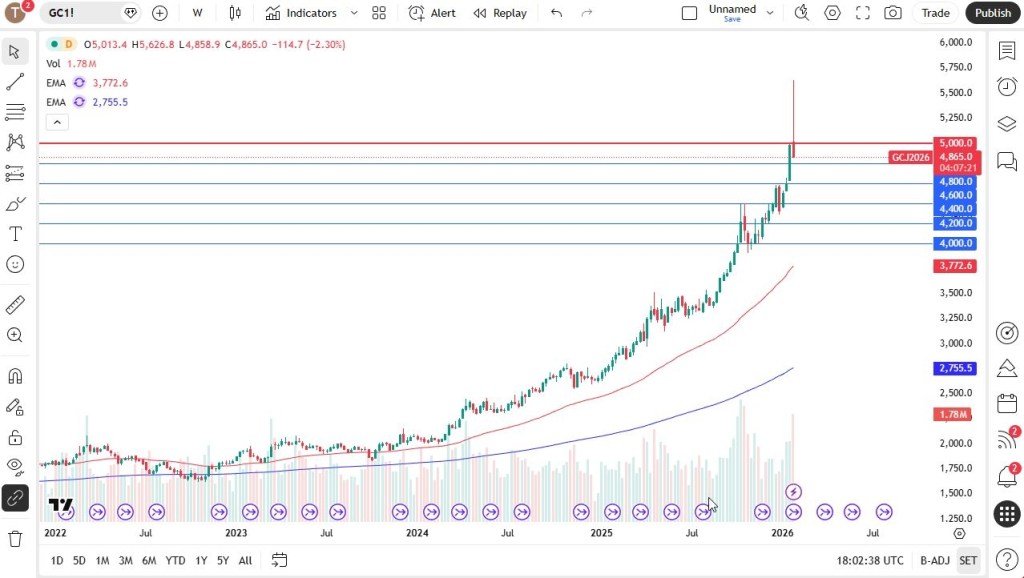
Gold prices climbed back above key technical levels during Asian trading on Wednesday, as renewed signs of tension between the United States and Iran fueled safe-haven demand for the precious metal.
Bullion extended its rebound from Tuesday after sharply recovering from recent losses, with dip-buying activity also remaining strong following last week’s more than $1,000 price sell-off.
Spot gold gained 2% to $5,048.37 per ounce by 21:00 ET (02:00 GMT), while April gold futures advanced 2.8% to $5,017.19 per ounce.
Other precious metals also moved higher on Wednesday, building on the rebound seen in the previous session. Spot silver gained 0.5% to $85.5245 per ounce, while spot platinum climbed 1.7% to $2,256.04 per ounce.
Iran concerns return ahead of upcoming nuclear talks
Renewed concerns over escalating tensions between the United States and Iran were a key catalyst for safe-haven demand, particularly after overnight reports that U.S. forces shot down an Iranian drone over the Arabian Sea.
In a separate development, Iranian gunboats were reported to have approached a U.S.-linked oil tanker in the Strait of Hormuz.
These incidents partially offset earlier statements from both Tehran and Washington indicating that talks would be held this Friday. News of the planned negotiations had previously eased market anxiety and weighed on safe-haven demand for gold.
Gold’s recent pullback was largely driven by expectations that U.S. President Donald Trump’s nominee for Federal Reserve chair, Kevin Warsh, may adopt a less dovish stance than markets had anticipated. This fueled a sharp rally in the U.S. dollar, pressuring precious metals, while gold also faced profit-taking after surging to a record high near $5,600 per ounce last week.
Despite the recent decline, gold remains up nearly 15% so far in 2026.
ANZ analysts noted that the core fundamentals underpinning gold’s strength—safe-haven demand, robust physical buying, and ongoing central bank purchases—remain firmly intact.
Oil prices climbed sharply during Asian trading on Wednesday, driven by reports of escalating tensions between the United States and Iran, which heightened fears of possible supply disruptions in the Middle East.
Crude prices also found support from industry figures showing an unexpected and substantial drawdown in U.S. oil inventories last week, as severe cold weather across the country curtailed production.
April Brent futures advanced 1.2% to $68.15 per barrel, while U.S. West Texas Intermediate crude rose 1.4% to $63.69 per barrel as of 21:01 ET (02:01 GMT).
Overnight reports indicated that U.S. forces shot down an Iranian drone that was approaching a U.S. aircraft carrier in the Arabian Sea.
In a separate incident, several Iranian gunboats were observed nearing a U.S.-flagged oil tanker in the Strait of Hormuz.
These developments came just ahead of planned talks between Washington and Tehran later this week. However, Iranian officials have reportedly insisted that the negotiations—scheduled for Friday—be limited to bilateral discussions focused solely on nuclear issues, raising uncertainty over whether the talks will proceed at all.
U.S. President Donald Trump has warned of further military action if Iran fails to comply with U.S. demands to rein in its nuclear program, while Tehran has vowed strong retaliation against any U.S. aggression.
Any escalation of military activity in the Middle East could potentially disrupt regional oil supplies, a risk that has helped support crude prices in recent trading sessions.
U.S. oil inventories fall sharply amid production disruptions, API data shows
Oil prices also found support from industry figures showing a large and unexpected drawdown in U.S. crude inventories.
Data from the American Petroleum Institute indicated that U.S. stockpiles fell by 11.1 million barrels in the week ended January 30, sharply contrasting with expectations for a 0.7 million-barrel build.
API figures often signal a similar outcome in the official inventory report due later in the day.
The sizeable drawdown was driven by severe cold weather across the United States, which disrupted oil production nationwide and hampered exports from the Gulf Coast.
Supply disruptions in the U.S. have also contributed to stronger oil prices in recent weeks.
European stocks inched higher on Tuesday, supported by a solid overnight close on Wall Street, as the recent sell-off in precious metals appeared to be short-lived.
By 03:05 ET (08:05 GMT), Germany’s DAX was up 0.8%, France’s CAC 40 added 0.4%, and the U.K.’s FTSE 100 edged 0.1% higher.
Global markets—including European equities—have steadied after several days of heightened volatility, marked in particular by sharp declines in gold and silver prices late last week and over the weekend.
Precious metals rebounded on Monday, restoring some investor confidence and helping lift the blue-chip Dow Jones Industrial Average by more than 500 points, or around 1%, on Wall Street.
Market sentiment also improved after U.S. President Donald Trump announced late Monday that the United States had reached a trade agreement with India, cutting tariffs on Indian goods to 18% from 50%.
The deal followed months of negotiations during which punitive tariffs had climbed as high as 50% and was widely viewed as a step toward normalizing trade relations.
Publicis draws investor attention.
Back in Europe, focus has returned to the quarterly earnings season, with a large number of major companies across the region scheduled to report results this week.
Publicis Groupe is in focus on Tuesday after a series of strong client wins helped the French advertising group deliver underlying fourth-quarter revenue ahead of expectations. The company generated €2.03 billion in free cash flow before working capital movements in 2025, up 10.6% from the previous year, and proposed a fully cash dividend of €3.75 per share, representing a 4.2% increase.
Elsewhere in France, asset manager Amundi posted a 6% rise in adjusted pretax income for 2025 to €1.86 billion, supported by record net inflows of €88 billion as it rolled out a new strategic plan aimed at driving growth through 2028.
In the Netherlands, Akzo Nobel reported a solid improvement in fourth-quarter margins compared with a year earlier, as the paints manufacturer contends with subdued demand while pursuing a potential merger with U.S. rival Axalta Coating Systems.
Attention is also on U.S. earnings later Tuesday, with results due from companies such as PayPal, Pfizer, and Marathon Petroleum, ahead of Advanced Micro Devices’ earnings after the close. Sentiment toward AI-related stocks remains fragile following poorly received results from Microsoft last week.
French consumer prices decline.
Data released earlier in the session indicated that inflation pressures remain subdued in France, the eurozone’s second-largest economy.
French consumer prices declined 0.3% month on month in January, while annual inflation stood at just 0.3%, undershooting expectations of 0.6%.
Attention now turns to the European Central Bank’s policy meeting later this week, where policymakers are widely expected to leave interest rates unchanged at 2% for a fifth consecutive meeting.
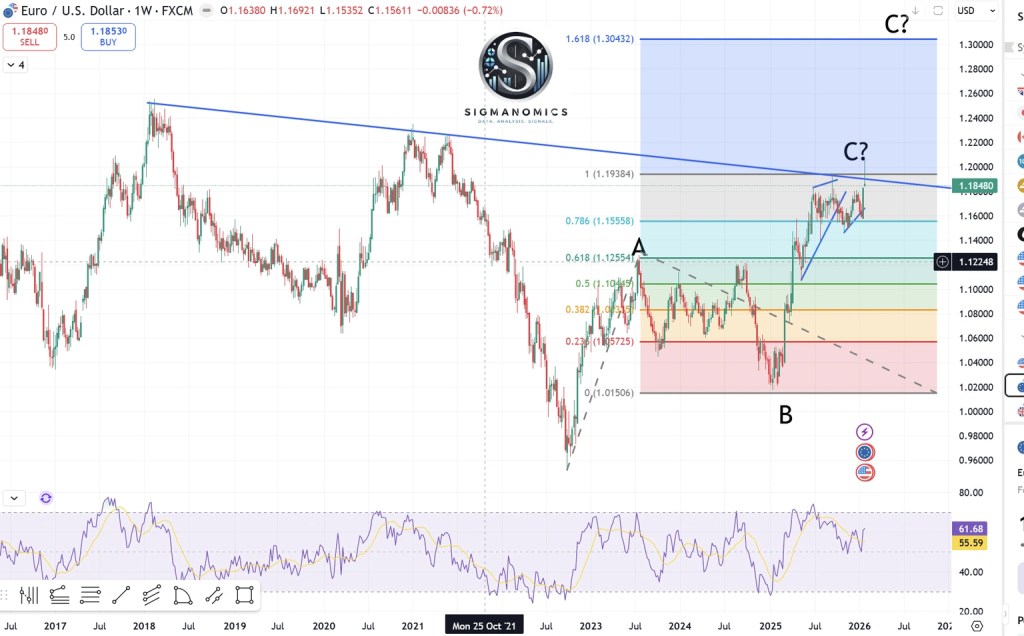
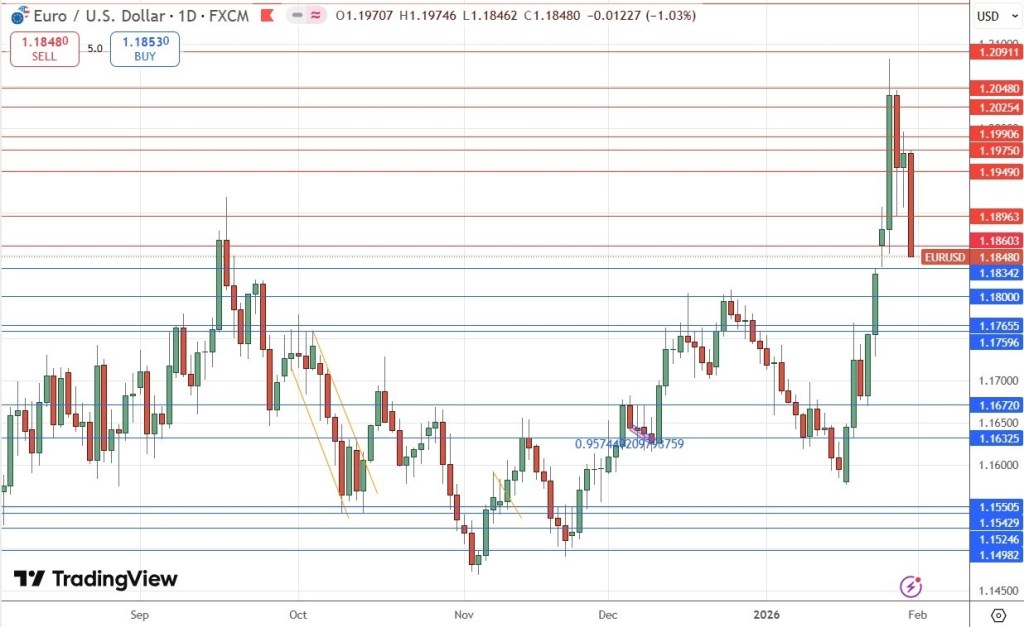
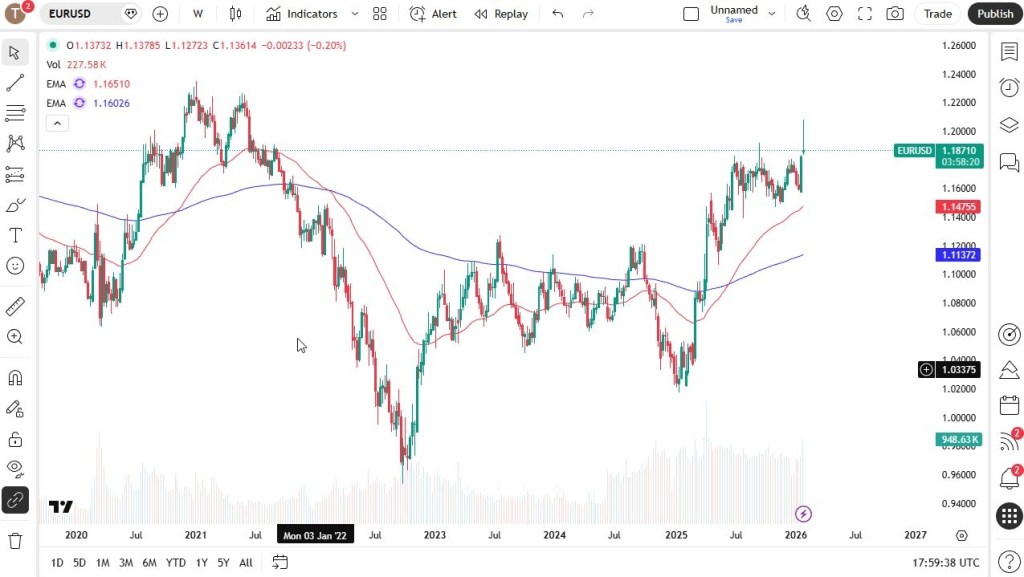
ECB President Christine Lagarde may also be pressed on the implications of a stronger euro for inflation, after the single currency briefly climbed above $1.20 last week, marking its highest level since 2021. It has since retreated but remains more than 2% higher over the past two weeks.
Crude prices continue to edge lower
Oil prices edged lower on Tuesday, extending losses for a second straight session, as easing tensions between the United States and Iran reduced the geopolitical risk premium in crude markets.
Brent futures slipped 0.4% to $65.96 a barrel, while U.S. West Texas Intermediate crude fell 0.4% to $61.90.
Both benchmarks dropped more than 4% in the previous session after President Donald Trump said Iran was “seriously talking” with Washington, signaling a potential de-escalation with the OPEC member.
Further pressure came from reports that Iran and the U.S. are set to resume nuclear talks on Friday in Turkey, according to Reuters.
Oil prices were also weighed down by a firmer U.S. dollar, with the dollar index hovering near a more-than-one-week high, dampening demand from holders of other currencies.
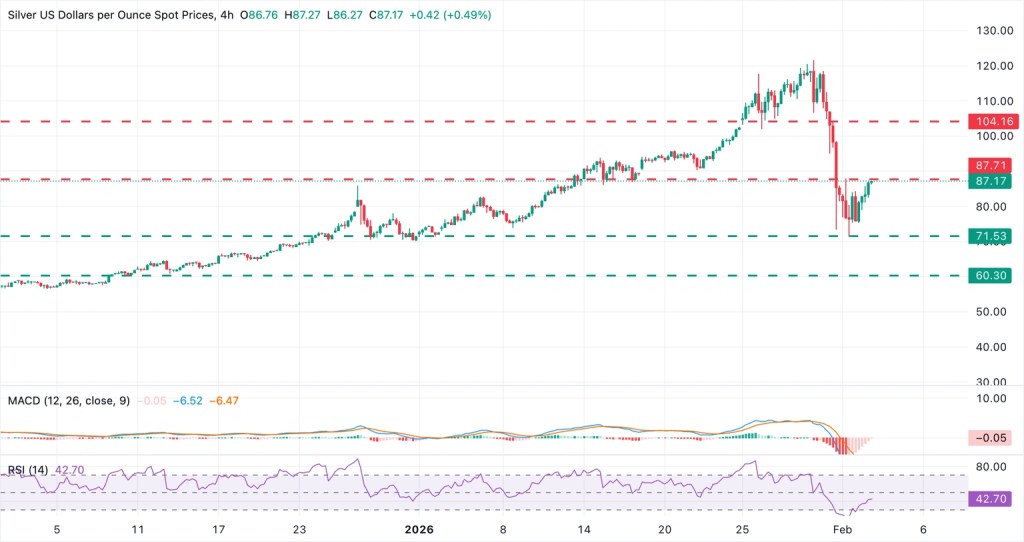
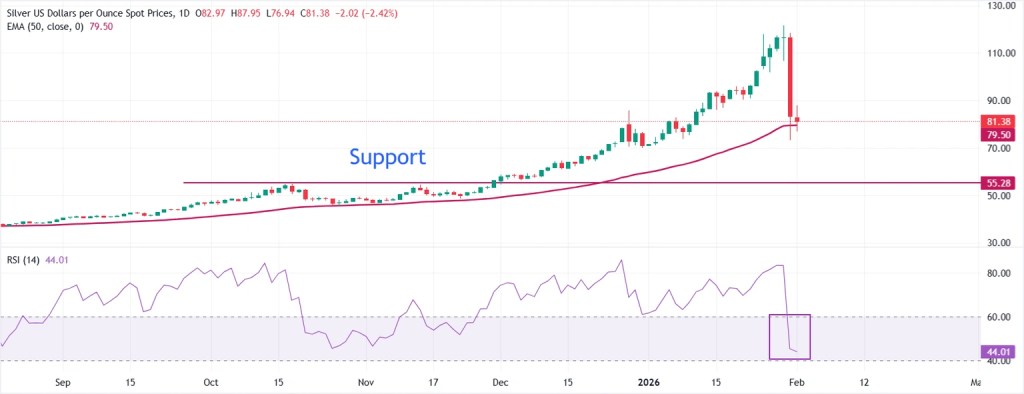
Silver has climbed above $87.00 after rebounding from one-month lows below $72.00. Precious metals are rising on Tuesday as overall market sentiment improves, though XAG/USD bulls may face resistance in the $88.00–$90.00 zone.
Silver (XAG/USD) is posting modest gains on Tuesday, trading around $87.05 at the time of writing. The white metal has stabilized after plunging more than 30% over the previous two sessions, which pushed prices to one-month lows just below the $72.00 level.
In a departure from their typical behavior, precious metals are rebounding alongside an improvement in broader market sentiment. Optimism stemming from a trade agreement between the United States and India, along with reports of forthcoming nuclear talks with Iran, has lifted investor confidence and increased appetite for risk assets.
Technical analysis: XAG/USD faces immediate resistance at $88.00.
XAG/USD has recovered part of its recent losses, though technical indicators continue to signal a bearish bias. The Moving Average Convergence Divergence (MACD) remains below both the signal line and the zero level, even as the negative histogram narrows toward zero. Meanwhile, the Relative Strength Index (RSI) is ticking higher, suggesting a gradual easing of downside pressure, but it remains below the critical 50 threshold.
On the upside, the pair is expected to encounter resistance near Monday’s highs around the $88.00 mark. A sustained break above this level could shift attention toward the psychological $100.00 handle, followed by intraday resistance near $104.00.
On the downside, immediate support is located at the monthly low of $71.37. A break below this level would expose the early-December highs and mid-December lows clustered around the $60.00 area.
UK grocery inflation slowed to 4.0% in the four weeks ending January 25, marking its lowest level since April last year, according to figures released Tuesday by market researcher Worldpanel by Numerator.
The reading eased from the 4.3% inflation rate reported in Worldpanel’s previous update, offering modest relief to households grappling with elevated food prices.
The data also serves as an early signal of price pressures ahead of the UK’s official inflation release scheduled for February 18.
Despite the moderation in inflation, Worldpanel noted that UK grocery sales increased 3.8% year on year in value terms over the four-week period. Adjusted for inflation, however, this translates into a decline in volumes, indicating that consumers are buying less even as overall spending rises.
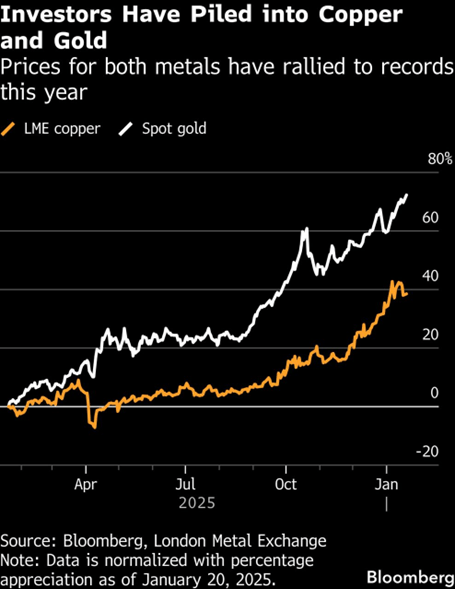
Although gold, silver, and platinum were the top-performing commodities over the past year, they came under pressure late last week.
Metals suffer a sharp pullback after hitting record highs.
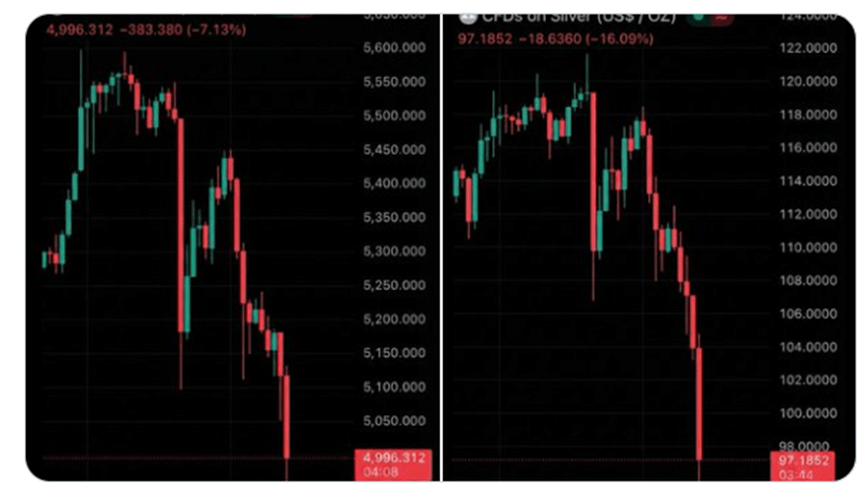
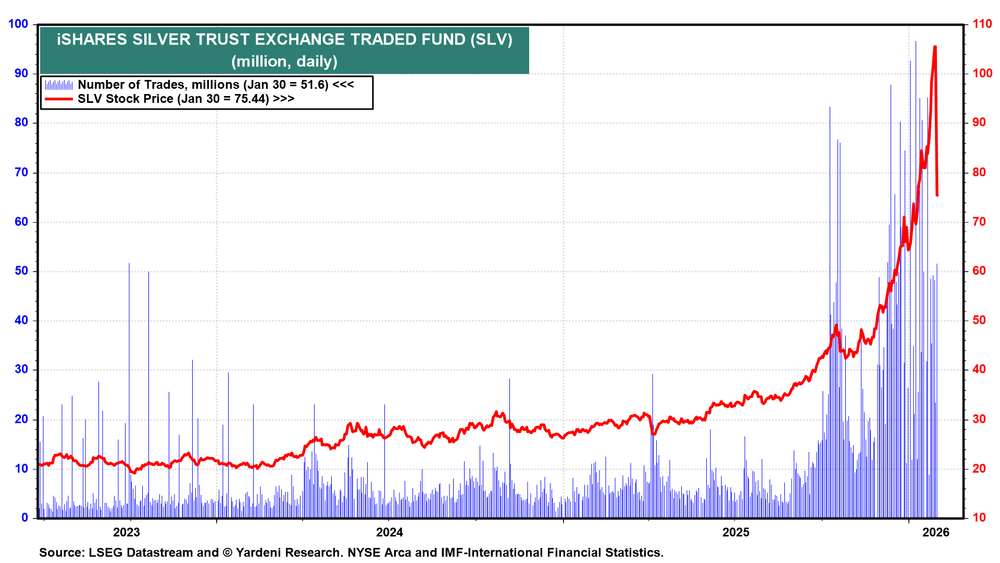
Silver and gold suffered a sharp sell-off early Friday, dragging mining stocks and related ETFs lower. After an exceptional run in 2025, both metals have begun to give back part of their gains. Silver slid roughly 15%, falling back below the $100 level, while gold dropped about 7% and struggled to hold above $5,000. Weakness spread across the sector, with platinum and palladium also declining by around 14% and 12%, respectively.
Mining equities and ETFs came under heavy pressure. Producers such as Fresnillo, along with silver miners Endeavour and First Majestic, posted double-digit losses in pre-market trading. Silver-focused ETFs were hit even harder, with some falling as much as 25%.
Following last year’s explosive rally—when silver surged 150% and gold gained 65%—the market appears to be undergoing a correction. Overcrowded positioning, uncertainty surrounding the Federal Reserve’s policy outlook, and shifts in geopolitics and the U.S. dollar have all fueled the sell-off.
The move underscores that even traditional safe-haven assets are vulnerable to sharp volatility. When positioning becomes one-sided, even fundamentally strong markets can reverse quickly. Investors are now reassessing exposure, with some stepping in to buy the dip while others remain on the sidelines.
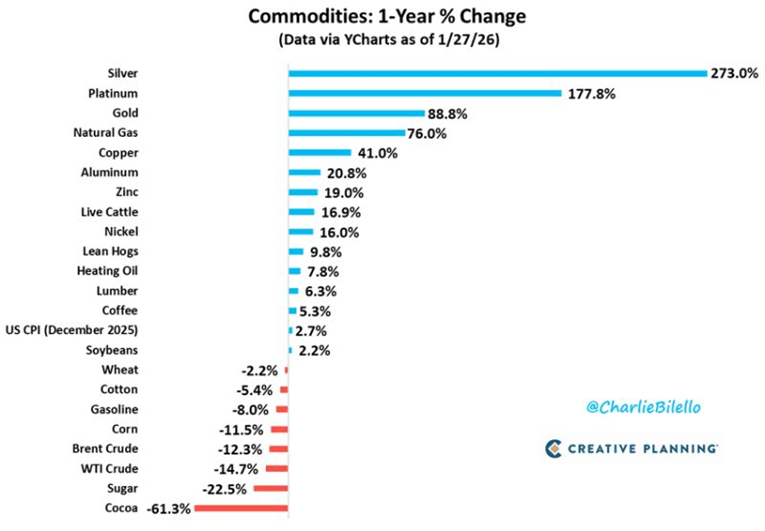
Top-Performing Commodities Over the Past Year
The three best performers are silver (+273%), platinum (+178%), and gold (+89%). These mark the strongest year-over-year gains for the metals since 1979–1980.
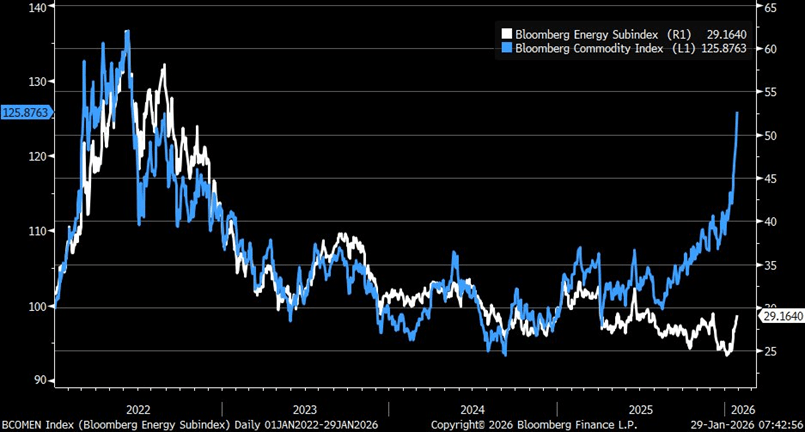
Can oil keep pace with the broader commodities rally?
The Bloomberg Commodity Index has surged, but the gains are not being driven by energy. Instead, strength is coming from other commodities, highlighting an unusual source of the rally.
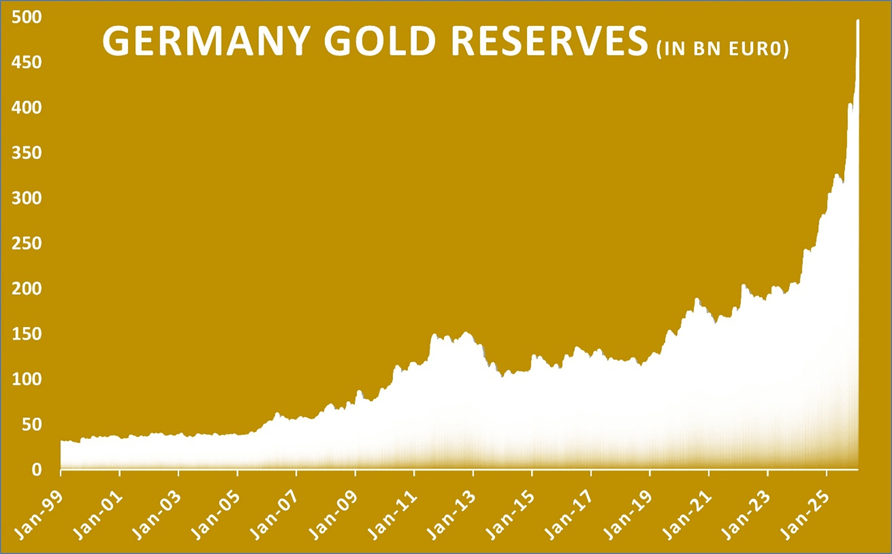
Germany’s gold reserves are valued at nearly €500 billion.
Germany’s gold reserves are now valued at €496 billion. The Bundesbank holds 3,352 tonnes in total, with more than 1,200 tonnes stored in New York and the rest kept in Frankfurt and London.
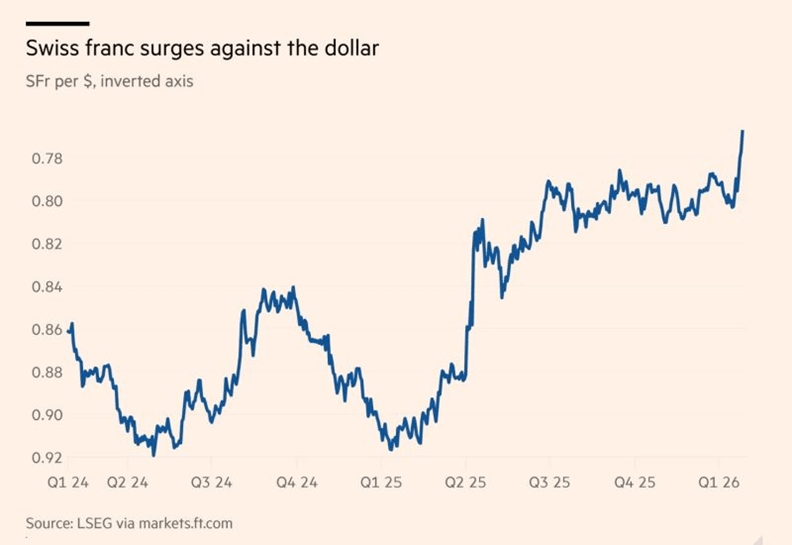
The Swiss franc strengthens against the U.S. dollar.
While market attention remains focused on the U.S. dollar and the yen, the Swiss franc has quietly climbed to its strongest level in more than a decade.
Here’s why the move matters globally:
The “safe-haven” appeal
Investors are gravitating toward stability. With gold pushing above $5,000 an ounce and political uncertainty weighing on major economies, the Swiss franc has reasserted itself as a preferred refuge. The currency is up about 3% so far this year, building on a strong 14% gain last year.
The Swiss National Bank’s policy challenge
Such strength is a double-edged sword. While it helps keep inflation exceptionally low—currently around 0.1%—it also increases pressure on Switzerland’s export-driven economy. This leaves the Swiss National Bank facing a difficult decision:
Cut interest rates? With rates already at 0%, a return to negative territory would be a step policymakers are reluctant to take.
Here is a refined paraphrase that flows naturally from the previous section:
Intervene? Direct action in currency markets risks accusations of manipulation and could spark diplomatic frictions.
The global backdrop
When the world’s primary reserve currency—the U.S. dollar—shows signs of instability, capital doesn’t disappear; it reallocates. Increasingly, those flows are moving toward perceived safe havens, with the Swiss franc emerging as a key beneficiary.
In an era of heightened market volatility, genuine stability has become one of the rarest—and most valuable—assets.
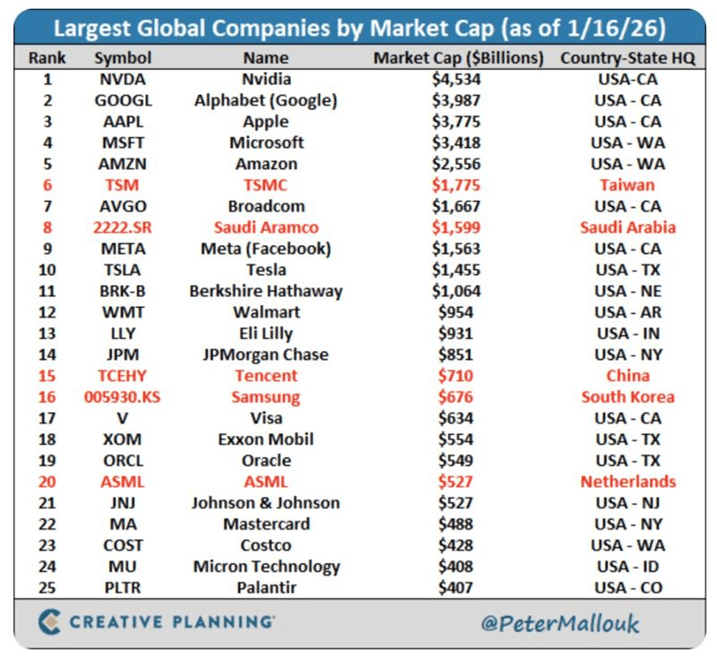
U.S. companies account for 20 of the world’s 25 largest market capitalizations.
The remaining five companies are based outside the U.S., with one each from Europe, China, Taiwan, South Korea, and Saudi Arabia.
Within the United States, California dominates with six of the world’s largest companies by market value. Texas and Washington follow with three each, while New York is home to two. Nebraska, Arkansas, Indiana, New Jersey, Idaho, and Colorado each host one of the top global firms.
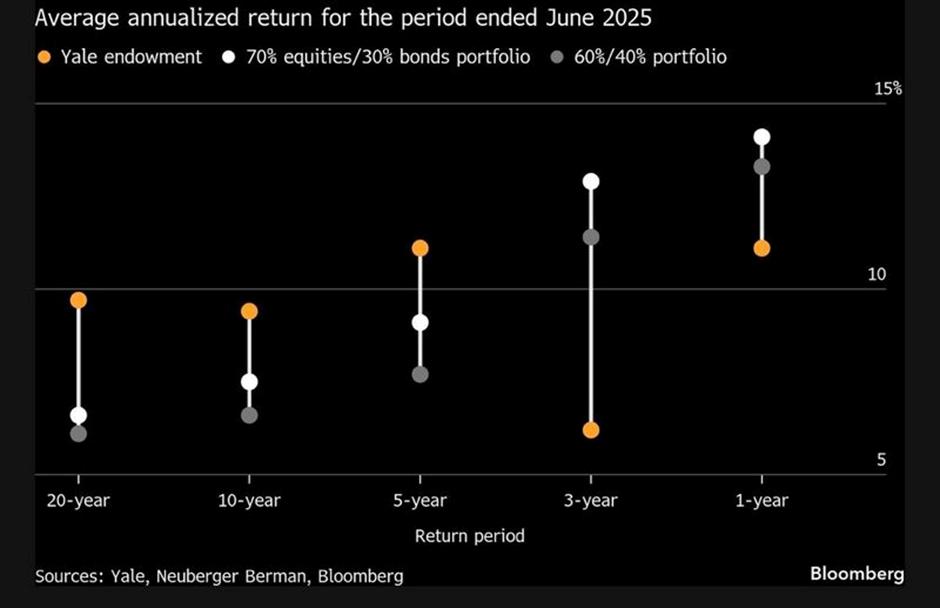
The endowment model faces mounting challenges.
For years, the endowment model—heavily tilted toward private assets—was held up as the gold standard for long-term investment success. Its track record was so compelling that institutions across the globe rushed to replicate it.
But every “secret sauce” loses its edge once it becomes common knowledge. As capital flooded into the same private markets, the once-distinct advantage began to erode.
Today, the space is increasingly crowded, and the classic endowment model is showing signs of strain. At the same time, more traditional portfolios with greater exposure to public markets are quietly regaining relevance.
The drivers are clear: too much money is chasing a limited pool of private opportunities, alpha in private equity is harder to extract, and liquid, public-market portfolios are proving more resilient than many expected.
This raises a critical question: is the era of private-heavy allocations coming to an end, or merely pausing? It may be time to revisit the “Yale model,” with a sharper focus on less congested private strategies and new sources of return—especially if the strong 60/40 performance of the past one and three years turns out to be more cyclical than enduring.
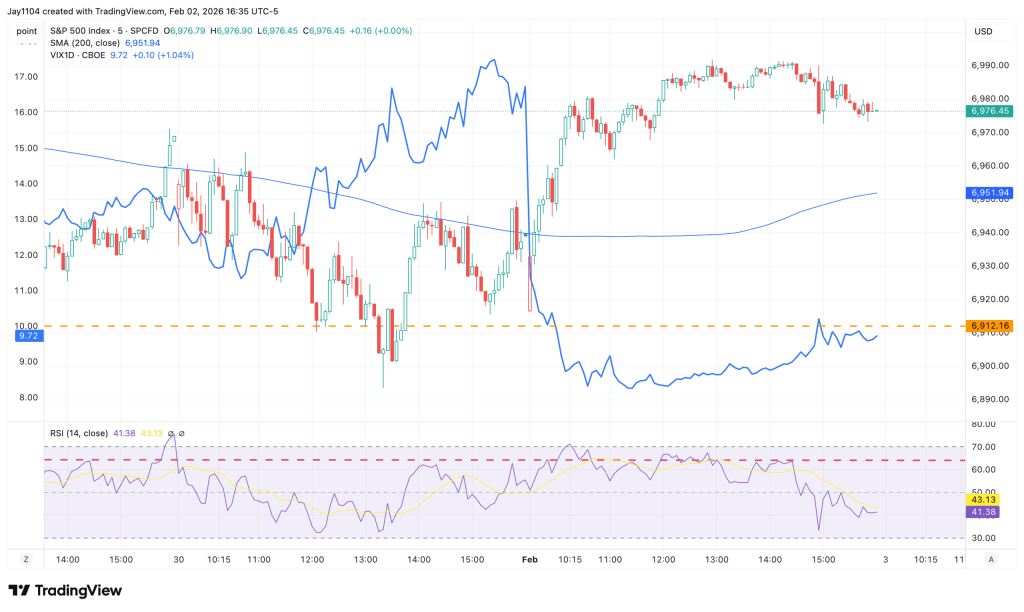
The S&P 500 closed the session up just over 50 basis points, in what felt like a familiar Monday pattern following Friday’s sharp drop in the 1-day VIX from 16.4 to 9.5. While the repetition can feel tiresome, the signal is clear: with volatility effectively reset, the index is once again at risk of stalling.
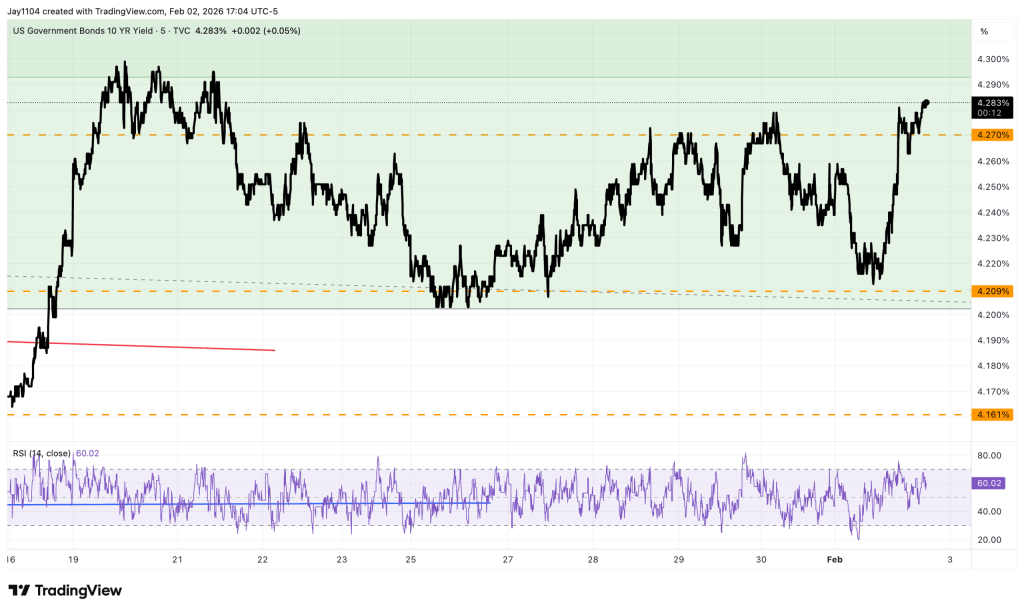
In other developments, the quarterly refunding announcement came in stronger than anticipated based on prior guidance, with the second quarter standing out as the key surprise. The Treasury now expects to issue $109 billion, assuming a Treasury General Account balance of $900 billion. The increase in the TGA target from $850 billion was unsurprising given the scale of U.S. debt and is a point that has been repeatedly highlighted.
Treasury yields were higher for much of the session following the stronger-than-expected ISM manufacturing data and extended those gains after the Treasury’s 3:00 p.m. ET announcement. Further clarity on the composition of the issuance is expected Wednesday morning.
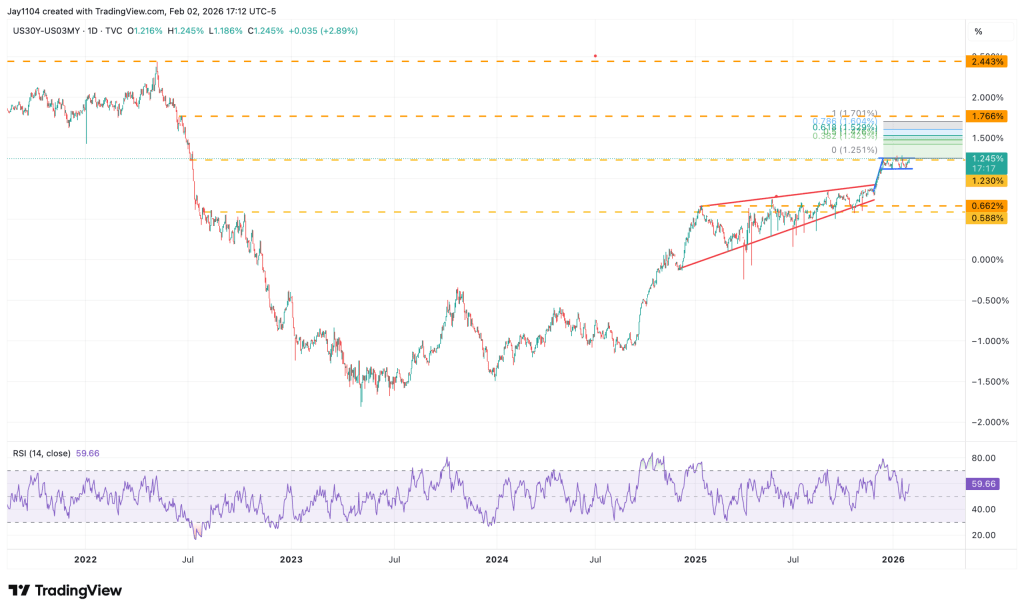
The 30-year minus 3-month spread has returned to the upper boundary of its bull-flag formation. A decisive break above the 1.25% level could trigger further upside momentum, with scope for a move toward the 1.7%–1.75% range.
Absent a meaningful downside shock, the yield curve is likely to continue steepening, driven primarily by higher long-end yields.
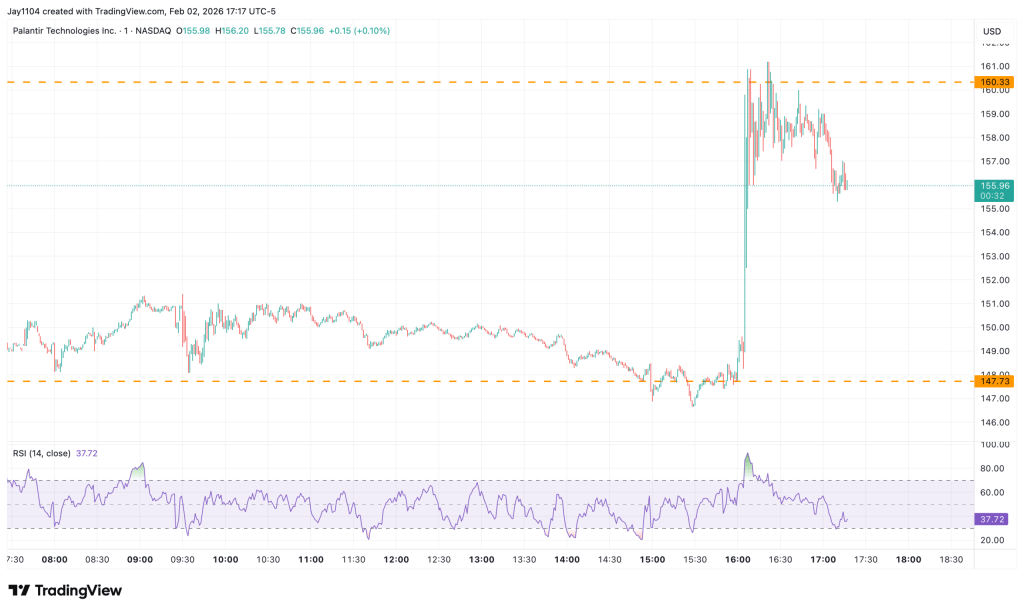
As highlighted yesterday, Palantir’s (NASDAQ: PLTR) key resistance level from an options-positioning perspective sits near $160, which is where the stock stalled in after-hours trading. If shares fail to break decisively above that level, a reversal of recent gains and a sharp pullback during today’s session would not be unexpected.
The U.S. dollar weakened broadly in January, defying its usual seasonal strength — what lies ahead in February?
Key Takeaways From February Forex Seasonality
The U.S. dollar weakened broadly in January, defying its typical seasonal strength. While USD/JPY has historically underperformed in February, the relevance of seasonal averages may be diminished amid anticipated political developments on both sides of the Pacific. Meanwhile, tonight’s RBA meeting could be pivotal in determining whether AUD/USD retreats from three-year highs and aligns with its traditionally weak February seasonality.
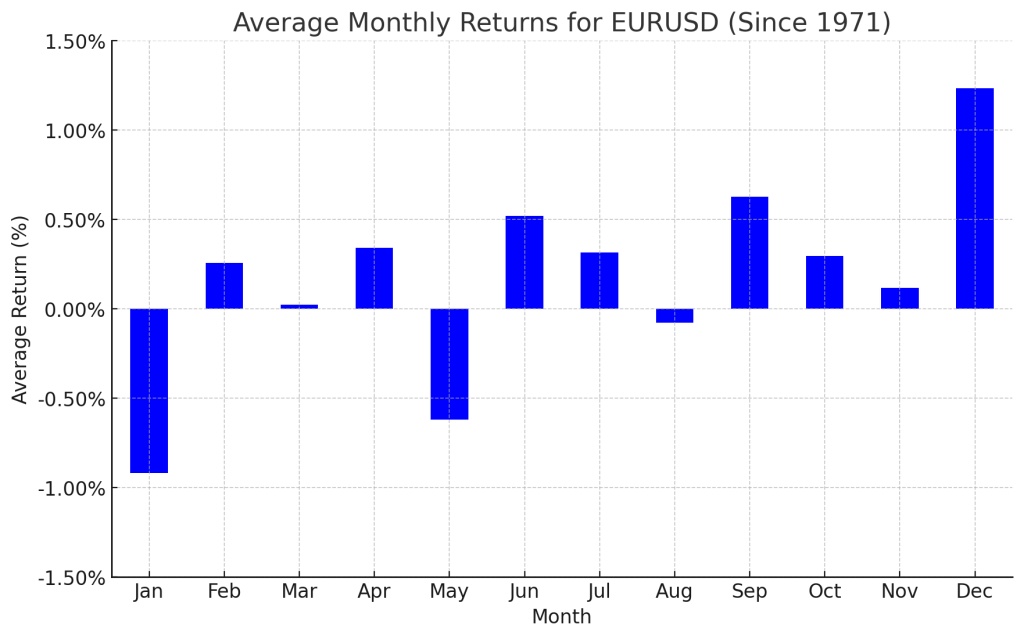
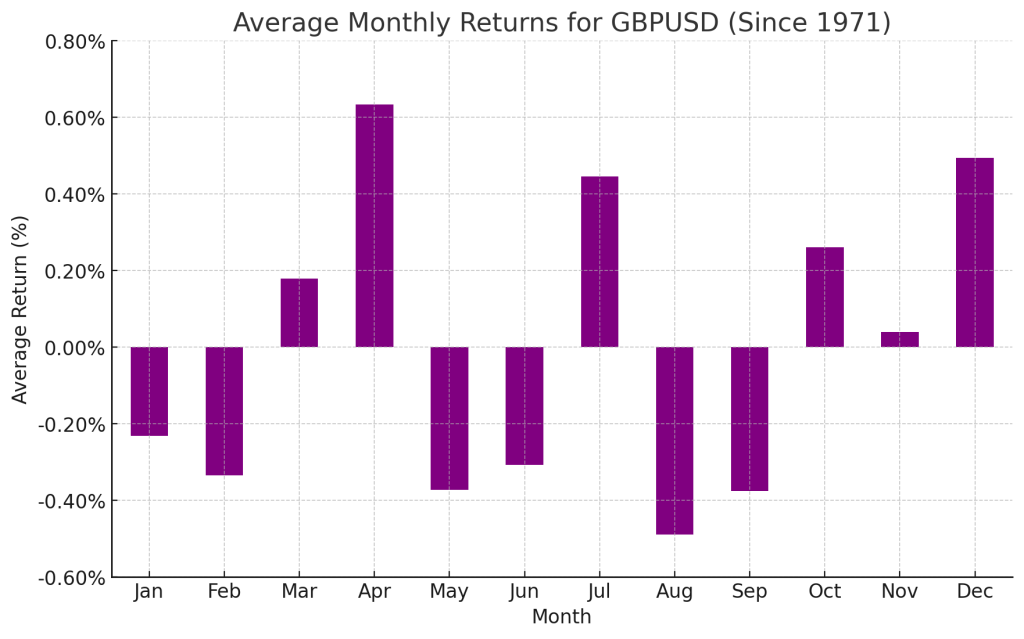
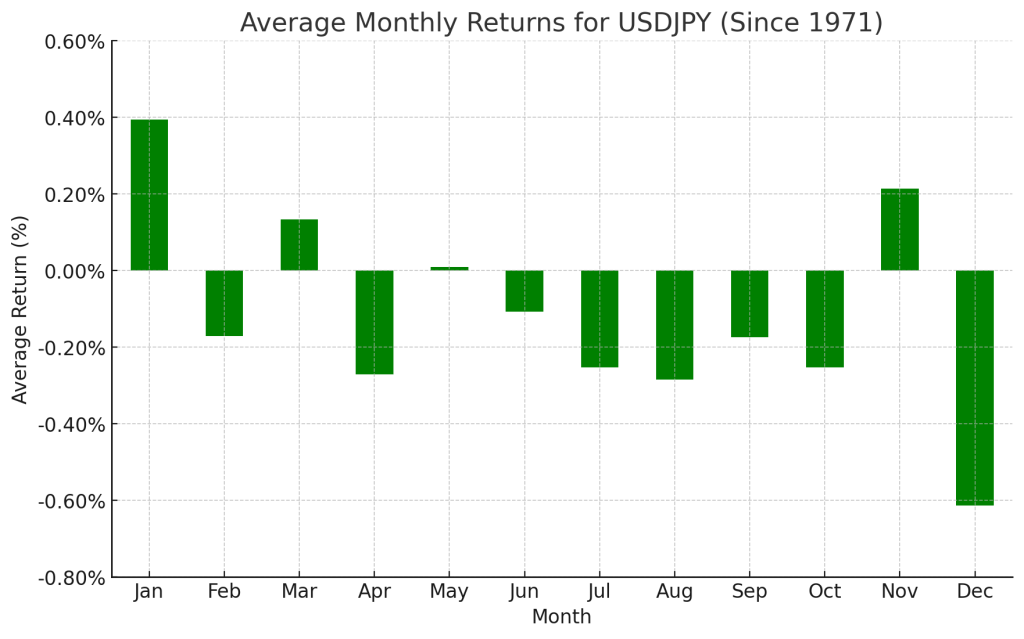
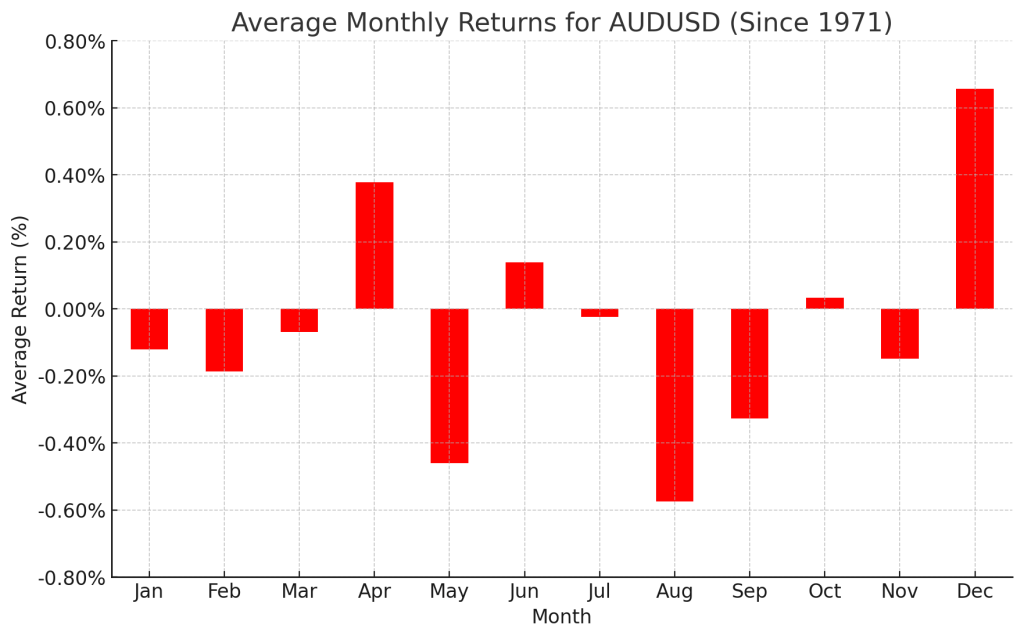
The start of a new month provides an opportunity to revisit the seasonal patterns that have shaped the forex market over more than five decades, following the dismantling of the Bretton Woods system in 1971 and the emergence of the modern foreign exchange regime.
As always, these seasonal tendencies reflect historical averages, and individual months or years can deviate from long-term norms. As such, seasonality should be used alongside other forms of analysis when building a robust, long-term trading strategy, as past performance is not necessarily indicative of future results.
Euro Forex Seasonality – EUR/USD Chart
Historically, February has tended to be mildly bullish for EUR/USD, with the world’s most heavily traded currency pair posting an average gain of around 0.3% over the past 50-plus years. In January, EUR/USD defied its typical seasonal pattern, pushing higher to briefly touch a 4.5-year high near 1.21 before retreating to finish the month lower. For a U.S. dollar that has historically underperformed against the euro, the prospect of another government shutdown—potentially delaying key economic releases such as the NFP report—offers an encouraging backdrop.
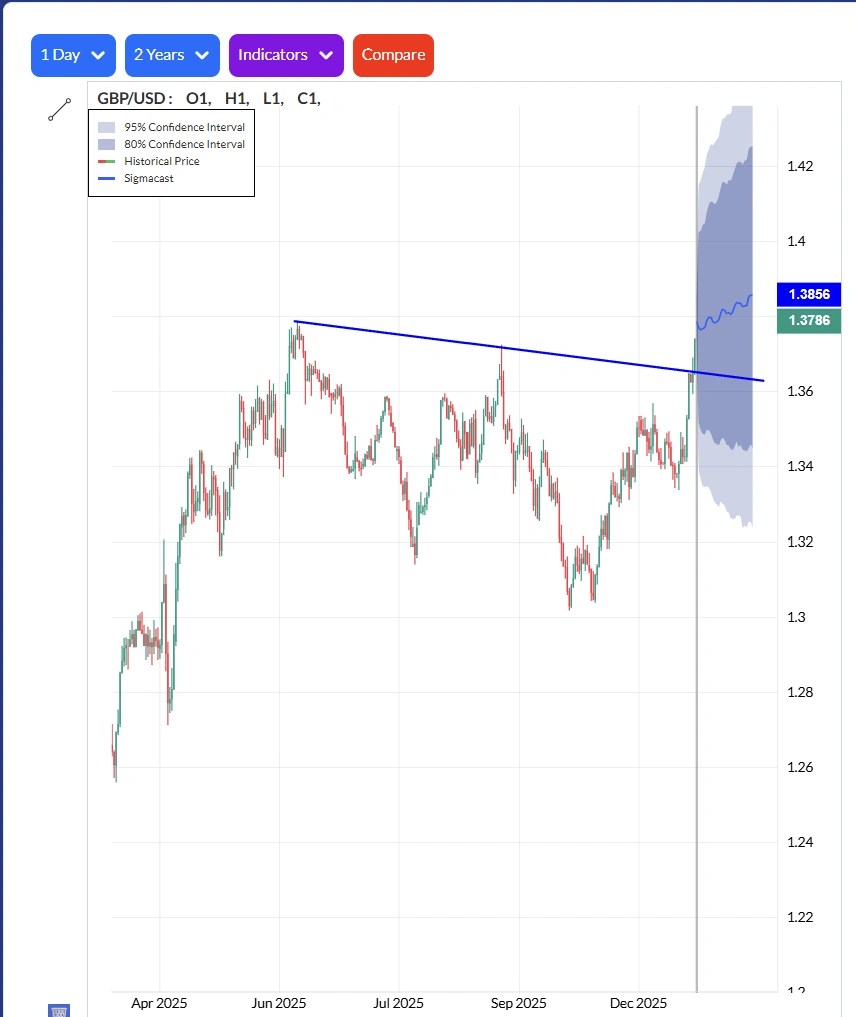
British Pound Forex Seasonality – GBP/USD Chart
As shown in the chart above, GBP/USD has historically tended to decline in February, posting average returns of roughly -0.3% since 1971. Similar to the euro, sterling has advanced for three consecutive months and briefly surged to multi-year highs in January before retreating to finish back within last year’s trading range. While no changes to interest rates are anticipated, this week’s BOE and ECB meetings remain key event risks for European currencies.
Japanese Yen Forex Seasonality – USD/JPY Chart
February has historically been a mildly bearish month for USD/JPY, with the pair posting average declines of around 0.2% since the Bretton Woods era. The year began with a volatile but ultimately weaker January for USD/JPY, running counter to its usual seasonal pattern amid broad-based U.S. dollar softness. With idiosyncratic political factors exerting an outsized influence on markets on both sides of the Pacific, traders may want to be cautious about placing too much weight on USD/JPY’s seasonal history at present.
Australian Dollar Forex Seasonality – AUD/USD Chart
Shifting focus to Australia, AUD/USD has historically posted modest declines in February, averaging losses of around 0.2% since 1971. In January, the Australian dollar rallied sharply, breaking out of a three-year range on the back of strong domestic employment and inflation data. While the RBA is widely expected to deliver a rate hike shortly after publication, the central bank’s forward guidance for the remainder of the year may prove more influential for the currency than the rate decision itself.
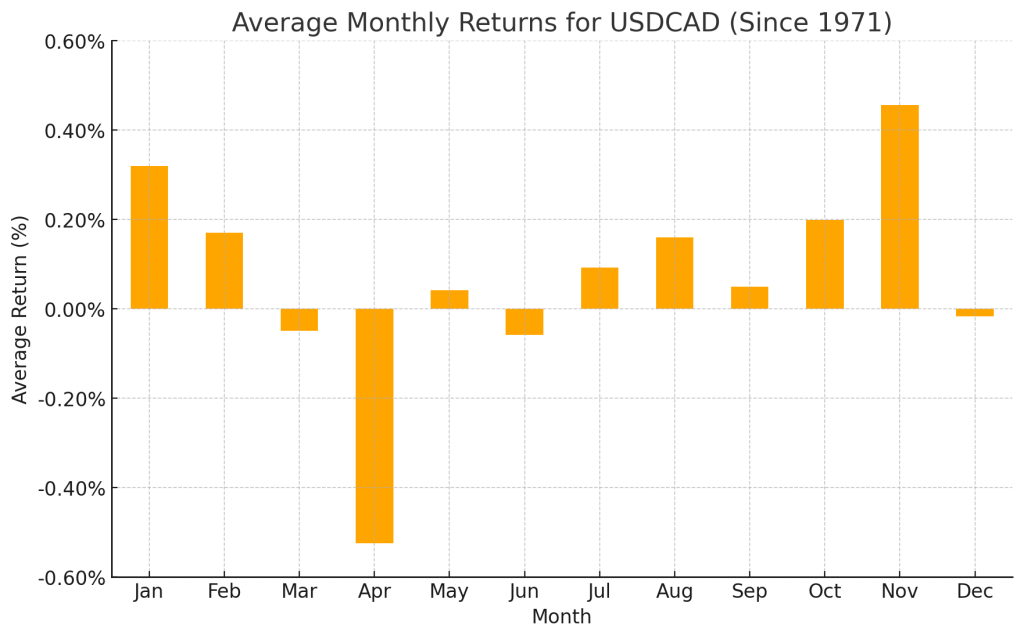
Canadian Dollar Forex Seasonality – USD/CAD Chart
Finally, February has historically been a mildly supportive month for USD/CAD, delivering an average gain of around 0.2%. At the time of writing, the pair is holding above support near its 15-month low in the mid-1.3500s after briefly dipping below that level last month. However, USD/CAD remains below its key medium- and long-term moving averages clustered around the 1.3800 area, marking that zone as a critical hurdle if bulls are to regain control after a difficult three-week stretch.
As always, we close by emphasizing that seasonal patterns are not definitive—even when they appear to be tracking well. This analysis should be paired with a thorough review of current fundamental and technical conditions across the major currency pairs.
Stablecoin issuer Tether said its newly launched MiningOS is a modular, self-hosted software stack designed to support mining operations ranging from small home rigs to large, multi-site industrial facilities.
What to know:
Tether has introduced MiningOS, an open-source, modular operating system for Bitcoin mining designed to streamline infrastructure management and lessen reliance on proprietary vendor software.
The self-hosted platform uses a peer-to-peer architecture, allowing miners to manage operations without centralized services and scale seamlessly from home rigs to multi-site industrial facilities.
Released under the Apache 2.0 license and built on Holepunch peer-to-peer protocols, MiningOS is hardware-agnostic and positions Tether alongside other advocates of open-source mining solutions, including Jack Dorsey’s Block.
Tether has unveiled an open-source operating system for Bitcoin mining, positioning it as a tool to simplify infrastructure management while cutting dependence on closed, vendor-controlled software. On Monday, the stablecoin issuer announced the launch of MiningOS (MOS), a modular and scalable mining platform built to serve everyone from individual hobbyists to large institutional operators.
The software aims to eliminate the “black box” nature of many existing mining setups, where hardware and monitoring systems are tightly locked into proprietary ecosystems. According to Tether, MiningOS prioritizes transparency, openness, and collaboration, and is designed with no vendor lock-in.
MOS operates on a self-hosted architecture and uses an integrated peer-to-peer network to communicate with connected devices, enabling miners to manage operations without centralized services. Operators can tailor settings via a companion interface based on their scale and production needs. Tether CEO Paolo Ardoino described MOS as a “complete operational platform” capable of scaling from a single home rig to industrial-grade mining sites spread across multiple locations.
Tether first outlined plans for an open-source mining operating system in June last year, saying new miners should be able to compete without relying on costly third-party software and management providers. The launch puts Tether alongside other crypto companies advocating open-source mining infrastructure, including Jack Dorsey’s Block.
MiningOS is released under the Apache 2.0 license and is built on Holepunch peer-to-peer protocols, a design choice intended to keep the software stack independent of external third-party dependencies.
Bernstein notes that the ongoing pullback in the crypto market may be short-lived, with Bitcoin potentially starting a recovery in the first half of the year.
The firm’s analysts point to rising institutional inflows and shifting US policy dynamics as factors that could underpin what they describe as Bitcoin’s “most consequential cycle.”
Other market participants anticipate capital rotation away from “overcrowded” precious metals and into Bitcoin.
Bitcoin may find a price floor near its previous cycle peak in the $60,000 area before staging a potential recovery in the first half of the year, according to analysts at Bernstein.
Led by Gautam Chhugani, the analysts noted that the recent pullback in crypto prices follows a period of strong outperformance by gold relative to Bitcoin over the past year. They added that Bitcoin’s market capitalization compared to that of gold is nearing a two-year low, as central banks have significantly increased their gold purchases over the past year.
Bernstein added that the recent market softness may represent a short-lived correction rather than the start of a prolonged bearish cycle, driven by several underlying factors.
New catalysts help Bitcoin remain resilient despite price weakness
The firm argued that robust institutional inflows into Bitcoin ETFs — which now hold roughly $165 billion in assets — alongside growing allocations from corporate treasuries, have helped the market move beyond the traditional boom-and-bust cycle.
Bernstein also pointed to the lack of miner-led capitulation, a feature commonly seen in past market downturns. Instead, miners have increasingly diversified their revenue by expanding into AI-focused data center operations, reducing their reliance on Bitcoin price fluctuations.
US policy developments were cited as another potential upside catalyst. Bernstein highlighted the creation of a Strategic Bitcoin Reserve funded by seized government BTC holdings, while potential changes in Federal Reserve leadership under nominee Kevin Warsh could further enhance Bitcoin’s standing. The analysts suggested that broader political alignment with the crypto sector could pave the way for Bitcoin to be viewed as a sovereign or reserve-like asset.
“We do not expect a passive response from the U.S. government if digital asset markets continue to decline,” the analysts wrote.
The latest assessment follows Bernstein’s projection last month that Bitcoin had bottomed near $80,000. At the time of publication, the world’s largest cryptocurrency was trading around $78,000, up 1.8% over the past few hours.
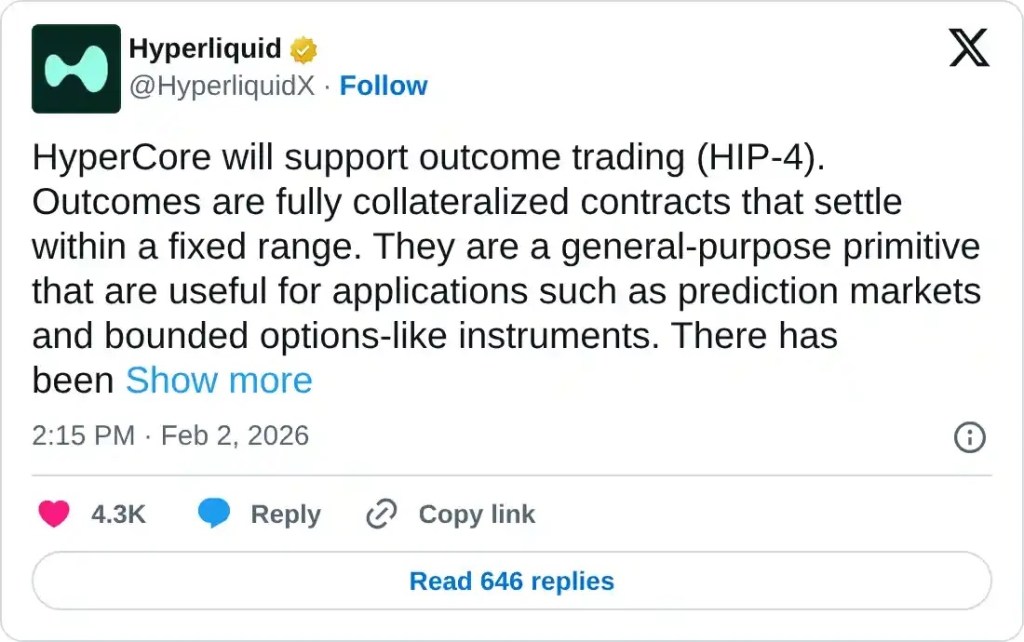
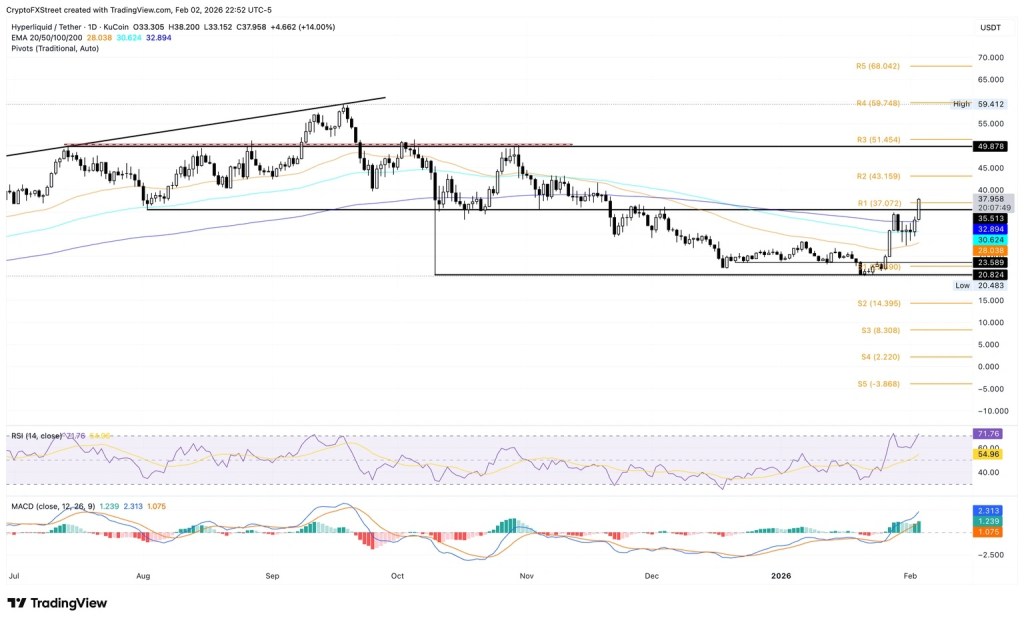
Hyperliquid rises 8% above its 200-day EMA on Tuesday, extending Monday’s nearly 9% advance.
The project unveiled plans to support outcome trading through the HIP-4 proposal.
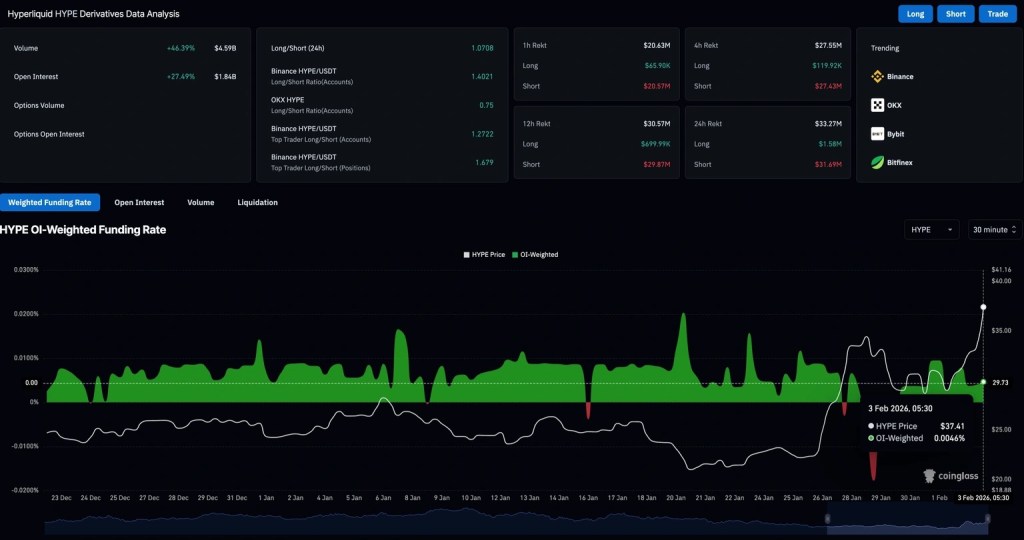
Retail participation picks up as HYPE futures Open Interest posts double-digit gains to around $1.85 billion.
Hyperliquid (HYPE) continued its recovery on Tuesday, rising 8% at the time of writing, fueled by optimism surrounding the HIP-4 proposal aimed at introducing outcome trading, including prediction markets and bounded options contracts. Growing retail engagement with the decentralized exchange and its native token is reflected in a more than 25% jump in HYPE futures Open Interest, signaling strong capital inflows. From a technical perspective, HYPE maintains a bullish bias, with strengthening buying pressure and improving trend momentum.
Hyperliquid rekindles retail interest with prediction market plans
Hyperliquid unveiled the HIP-4 proposal on Monday during early US trading, outlining plans to introduce prediction markets and fixed-range options contracts in an effort to compete with established platforms such as Polymarket and Kalshi. Retail participation in prediction markets has surged amid heightened volatility across global financial markets and geopolitical developments.
The latest initiative marks an expansion of the Hyperliquid exchange beyond commodity trading, which was introduced under the HIP-3 proposal, and underscores the platform’s ongoing development aimed at better meeting trader demand.
CoinGlass data shows that HYPE futures Open Interest (OI) jumped 27% over the last 24 hours to $1.84 billion, indicating significant inflows. Typically, such a large capital inflow in futures markets during an uptrend indicates an upside bias among traders.
A massive wipeout of short sellers over the last 24 hours, evidenced by short liquidations of $31.69 million outpacing long liquidations of $1.58 million, corroborates the upside bias in HYPE futures. Additionally, the funding rate of 0.0046% signals a bullish interest among traders.
Technical outlook on Hyperliquid: Can HYPE reach the $50 level?
Hyperliquid rebounded from the 100-day Exponential Moving Average (EMA) at $30.61, posting gains of around 24% so far this week. At the time of writing on Tuesday, HYPE is up 14% on the day and has reclaimed the 200-day EMA at $32.89. The next upside hurdles are seen at $35.51 — aligned with the August 2 low — and the R1 Pivot Point at $37.07.
The broader technical structure reinforces a strong recovery bias, with longer-term EMAs trending higher above shorter-term averages on the daily chart. A sustained close above $37.07 could pave the way toward the R2 Pivot Point at $43.15, followed by a key resistance zone near the $50.00 psychological mark.
Momentum indicators also favor further upside. The Moving Average Convergence Divergence (MACD) continues to strengthen, with histogram bars expanding above the zero line, signaling accelerating bullish momentum. Meanwhile, the Relative Strength Index (RSI) stands at 71, entering overbought territory and reflecting strong buying pressure.
On the downside, a failure to sustain a move above the 200-day EMA at $32.89 would undermine the bullish outlook and could trigger a pullback toward the 100-day and 50-day EMAs, located at $30.62 and $28.03, respectively.
NZD/USD sees renewed buying interest on Tuesday as multiple factors weigh on the US Dollar.
Expectations for two additional Fed rate cuts in 2026, along with a positive risk environment, undermine demand for the greenback.
The Reserve Bank of New Zealand’s relatively hawkish stance supports the NZD and adds to the pair’s upside.
The NZD/USD pair shows notable resilience below the 0.6000 psychological level and gathers strong upside momentum during Tuesday’s Asian session. Spot prices advance to the 0.6040–0.6045 zone in the past hour, snapping a two-day losing streak amid a modest pullback in the US Dollar.
As markets digest Kevin Warsh’s nomination as the next Federal Reserve Chair, expectations that the Fed will deliver two additional rate cuts this year continue to cap the US Dollar’s rebound from a four-year low reached last week. At the same time, an upbeat risk environment weighs on the Greenback’s safe-haven appeal and supports demand for the risk-sensitive New Zealand Dollar.
Investor sentiment was further buoyed after US President Donald Trump announced on Monday that the United States and India have finalized a trade agreement and will immediately move to reduce tariffs on each other’s goods. In addition, signs of easing tensions between the US and Iran over Tehran’s nuclear program have reduced fears of military escalation, reinforcing the positive market mood.
Further support for the Kiwi comes from the Reserve Bank of New Zealand’s relatively hawkish outlook on the policy path. The RBNZ has signaled a potential end to its easing cycle after cutting rates to 2.25% in November, and now projects the cash rate at 2.20% in the first quarter of 2026 and 2.65% by the fourth quarter of 2027.
Meanwhile, the release of the December 2025 Job Openings and Labor Turnover Survey (JOLTS) and the US Nonfarm Payrolls (NFP) report has been delayed due to a partial US government shutdown. As a result, commentary from key FOMC officials will be closely watched for cues on USD direction and could provide fresh impetus to NZD/USD, which appears poised to extend its two-week uptrend.
Gold sees modest buying interest on Tuesday as the USD takes a breather from its rebound off a four-year low.
Kevin Warsh’s nomination as the next Fed Chair may help limit USD downside and restrain gains in the precious metal.
Easing geopolitical and trade tensions could continue to cap further upside in XAU/USD.
Gold (XAU/USD) extends Monday’s rebound from the $4,400 area — its lowest level since January 6 — and picks up modest follow-through during the Asian session on Tuesday. However, the metal struggles to sustain the upside momentum, paring part of its intraday gains and easing back toward the $4,856 zone amid a confluence of bearish factors.
US President Donald Trump’s nomination of Kevin Warsh as the next Federal Reserve Chair has removed a major source of uncertainty. In addition, a stronger-than-expected US ISM Manufacturing PMI released on Monday has helped the US Dollar hold onto its recent recovery from a four-year low, creating headwinds for gold prices.
Further weighing on the precious metal are signs of easing US–Iran tensions over Iran’s nuclear program, the US–India trade agreement, and CME Group’s decision to increase margin requirements for precious metals futures. These factors, combined with a generally positive risk tone in global equity markets, call for caution among XAU/USD bulls.
As a result, it may be prudent to wait for sustained follow-through buying before concluding that the recent sharp corrective decline from the $5,600 region — the record high reached last week — has fully played out. Looking ahead, the US JOLTS Job Openings data could provide fresh direction later in the North American session.
Daily Digest Market Movers: Gold supported by a weaker USD; upside remains limited amid upbeat risk sentiment
US President Donald Trump on Friday nominated Kevin Warsh to replace Jerome Powell as Federal Reserve Chair in May, subject to Senate confirmation. Given Warsh’s hawkish credentials, he is expected to remain alert to any rise in inflation expectations.
Separately, CME Group announced over the weekend that margin requirements for precious metals futures will be raised from Monday’s market close. This triggered a second consecutive day of liquidation, pushing gold to a four-week low on Monday.
On the data front, the Institute for Supply Management reported that US manufacturing activity expanded for the first time in a year. The Manufacturing PMI jumped to 52.6 in January from 47.9 previously, signaling a sharp rebound.
Meanwhile, Trump said on Monday that the US and India have finalized a trade agreement and will immediately begin lowering tariffs on each other’s goods. In addition, expectations that the US and Iran will resume nuclear talks on Friday further lifted investor confidence.
The US Dollar eases on Tuesday, retreating from an over one-week high reached the previous session, offering some support to gold during Asian trading. However, the aforementioned headwinds may continue to cap upside in the precious metal.
Market participants will look ahead to the US JOLTS Job Openings report on Tuesday, followed by Wednesday’s US ADP private employment data and ISM Services PMI. These releases, along with Fed commentary, are likely to influence the USD and XAU/USD.
Gold’s mixed technical picture calls for caution before aggressive directional positioning
The commodity displayed resilience below its 50-day Simple Moving Average (SMA) and rebounded from the 50% Fibonacci retracement of the July 2025–January 2026 rally on Monday. The rising slope of the SMA indicates that downside moves may continue to attract buying interest. In addition, XAU/USD remains above the 38.2% retracement level, located around the $4,645–4,650 region, which should provide immediate support. The Relative Strength Index (RSI) is currently at 51.91 and trending higher, signaling stabilizing momentum.
That said, the Moving Average Convergence Divergence (MACD) remains below both the signal line and the zero line, maintaining a bearish bias. The expanding negative histogram suggests that downside momentum is gaining traction. On the upside, any further recovery could shift focus toward the 23.6% retracement at $4,995.94. Conversely, a failure to defend the initial support zone may leave the rebound exposed to deeper consolidation.
The Reserve Bank of Australia’s board voted on Tuesday to raise the Official Cash Rate by 25 basis points to 3.85% from 3.60% at the conclusion of its February policy meeting, in a move widely anticipated by markets.
Overview of the RBA’s Monetary Policy Statement
The Reserve Bank Board’s policy decision was unanimous. The Board reaffirmed that it will continue to closely monitor incoming data and evolving risks when determining future policy settings.
Although inflation has fallen significantly from its 2022 peak, it rose materially in the second half of 2025. Recent data confirm a renewed strengthening in inflationary pressures, partly reflecting tighter capacity constraints and stronger-than-expected private demand. The Board judged that inflation is likely to remain above the target range for some time and therefore considered an increase in the cash rate target appropriate.
While some of the inflation pickup is expected to be temporary, demand has been growing faster than anticipated and capacity pressures are greater than previously assessed. Labour market conditions remain slightly tight, though they have stabilised in recent months. The Board reiterated its commitment to achieving price stability and full employment and stated it would take whatever action it deems necessary to meet its mandate.
There remains considerable uncertainty around the outlook for domestic activity, inflation, and the degree of monetary policy restrictiveness. The forecasts assume the cash rate rises to 3.9% by June and 4.2% by December, with higher inflation projections extending through to the end of 2027. The assumed policy tightening is expected to help restore balance between demand and supply, although the economy is currently judged to be operating above potential.
Private demand growth was much stronger than expected in late 2025, financial conditions may now be somewhat accommodative, and credit growth has accelerated, with the cash rate sitting below some estimates of neutral. The RBA significantly lifted its forecasts for business investment—partly driven by data centre expansion—as well as government spending and dwelling investment, while noting that some sector-specific demand may not persist.
GDP growth is projected at 2.3% in Q4 2025, slowing to 1.8% in Q4 2026 and 1.6% in Q4 2027. CPI inflation is forecast at 4.2% in Q2 2026, easing to 3.6% by Q4 and returning to around 2.6–2.7% by 2027–28. Trimmed mean inflation follows a similar path. The unemployment rate is expected to gradually rise to 4.3% by Q4 2026 and 4.6% by mid-2028.
Globally, economic growth in 2025 has been stronger than anticipated, with downside risks diminishing.
AUD/USD response to the RBA’s interest rate decision
The Australian Dollar attracts renewed buying interest immediately after the RBA’s decision, pushing AUD/USD back above 0.7000. At the time of writing, the pair is up 0.75% on the day.
The following section was published on February 2 at 21:45 GMT as a preview of the Reserve Bank of Australia’s (RBA) policy announcement.
The Reserve Bank of Australia is expected to raise interest rates by 25 basis points to 3.85% in February. Comments from RBA Governor Michele Bullock and updated economic forecasts may provide guidance on the future path of rate hikes. The Australian Dollar is likely to experience heightened volatility around the RBA policy announcement.
The Reserve Bank of Australia is widely anticipated to lift the Official Cash Rate (OCR) from 3.6% to 3.85% following the conclusion of its first monetary policy meeting of 2026.
The decision is scheduled for release at 03:30 GMT on Tuesday, alongside the Monetary Policy Statement (MPS) and quarterly economic forecasts. This will be followed by a press conference with RBA Governor Michele Bullock at 04:30 GMT.
The Australian Dollar is expected to see sharp moves as markets digest the RBA’s policy decision and revised economic outlook.
RBA is set to break the global easing trend
The Reserve Bank of Australia is widely expected to deliver its first interest rate increase in more than two years at its February policy meeting on Tuesday, breaking from the global easing trend as it seeks to rein in mounting inflationary pressures.
Speaking at the press conference following the December policy decision, RBA Governor Michele Bullock stressed the central bank’s commitment to controlling inflation, stating that “the Board will do what it needs to do to get inflation down.” She added that if incoming data showed inflation was not easing, it would be taken into account at the February meeting.
Data released by the Australian Bureau of Statistics (ABS) last Wednesday showed inflation accelerating, with the monthly Consumer Price Index (CPI) rising to 3.8% in December from 3.4% in November, exceeding market expectations of a 3.6% increase.
Core inflation also surprised to the upside, as the trimmed mean CPI — the RBA’s preferred underlying inflation gauge — climbed 0.9% quarter-on-quarter in the fourth quarter, above forecasts of a 0.8% rise.
In response to the stronger inflation data, money markets lifted the implied probability of a February rate hike to 73%, up from 60% previously, according to Reuters.
Australia’s four major banks — ANZ, Westpac, Commonwealth Bank of Australia and National Australia Bank (NAB) — have also revised their outlooks, now expecting a 25-basis-point rate increase from the RBA in February.
Further support for a policy tightening came from the labour market. ABS data released on January 22 showed the unemployment rate unexpectedly falling to 4.1% in December from 4.3%, marking its lowest level since May. Net employment rose sharply by 65.2K after declining by 28.7K in November.
How will the RBA’s decision affect AUD/USD?
The Australian Dollar faces two-way risks against the US Dollar in the run-up to the RBA policy decision.
AUD/USD could end its recent correction and regain upside momentum if Governor Michele Bullock’s remarks and updated economic forecasts indicate that further rate increases remain likely in the months ahead.
On the other hand, the pair may extend its pullback should Governor Bullock temper expectations for additional tightening, particularly if inflation projections appear stable.
Dhwani Mehta, Asian Session Lead Analyst at FXStreet, outlines the key technical levels to watch following the policy announcement.
“AUD/USD is trading below the 0.7000 mark ahead of the RBA rate decision, consolidating after a pullback from a three-year high of 0.7094 reached on Thursday. The 14-day Relative Strength Index (RSI) has retreated from overbought conditions and is now testing the 60 level, indicating that the broader bullish bias remains intact.”
Mehta adds, “The pair could reverse higher and embark on a fresh uptrend toward the 0.7050 psychological level if the RBA delivers a hawkish rate hike. Further resistance is located at the 2026 high of 0.7094, followed by the February 2023 peak at 0.7158. Conversely, a dovish outcome could see AUD/USD probe the 0.6900 region. A decisive break below this area may open the door to further losses toward the 0.6850 psychological level, with the 0.6800 round figure acting as the final support for buyers.”
Taiwan should prioritise trade and economic cooperation with fellow democracies rather than China, President Lai Ching-te said on Tuesday, as his government outlined plans to deepen collaboration with the United States in areas such as artificial intelligence and critical minerals.
Senior officials from Taiwan and the United States discussed cooperation on AI, technology and drones at a high-level forum held last week, with the U.S. State Department describing Taiwan as a “vital partner.” The two sides also signed statements on economic security cooperation and endorsed the Pax Silica Declaration, a U.S.-led initiative aimed at safeguarding AI and semiconductor supply chains amid growing competition with Beijing, which claims Taiwan as its territory.
Speaking at a news conference following the U.S.-Taiwan Economic Prosperity Partnership Dialogue, Lai praised the outcome of the talks, saying Taiwan was on the right economic trajectory and ready to work with democratic partners to drive future growth.
His remarks came as Kuomintang (KMT) deputy chairman Hsiao Hsu-tsen was in Beijing for a think-tank exchange with China’s Communist Party on issues including AI and tourism. Lai acknowledged the opposition’s differing views, contrasting slower economic growth under previous KMT administrations—which pursued closer trade ties with China—with stronger growth since his Democratic Progressive Party took office in 2016.
Lai said Taiwan faced a clear choice between closer cooperation with the U.S., Japan and Europe, or renewed economic dependence on China. The KMT did not immediately respond, though Hsiao said in Beijing that cross-strait cooperation served both sides’ interests.
China has refused to engage with Lai, branding him a separatist, a charge he rejects, saying Taiwan’s future can only be decided by its people. Lai reiterated his willingness to hold talks with Beijing on the basis of equality and mutual respect.
The Reserve Bank of Australia raised its policy rate by 25 basis points on Tuesday, in line with expectations, and cautioned that inflation is likely to stay above target in the months ahead.
The unanimous decision lifted the cash rate target to 3.85% from 3.65%, following a renewed uptick in inflation late last year that pushed underlying price pressures back above the RBA’s 2%–3% target range.
The central bank said private demand remained resilient and domestic capacity constraints persisted, factors it expects will keep inflation elevated for some time. While some of the recent rise in inflation reflects temporary influences, the RBA noted that demand has been expanding faster than anticipated, capacity pressures are stronger than previously assessed, and labour market conditions remain tight.
The RBA stopped short of signalling further rate increases, instead reaffirming its commitment to maintaining price stability and full employment, and said it would take whatever action it deems necessary to achieve those objectives.
Asian equities bounced back strongly on Tuesday, led by advances in South Korean and Japanese markets as AI-linked stocks rallied, while investors looked ahead to the Reserve Bank of Australia’s policy announcement later in the session.
The recovery came after a solid overnight close on Wall Street, driven by gains in technology and semiconductor shares. Market participants are also focused on major earnings releases this week, including results from Amazon and Alphabet.
U.S. equity index futures ticked higher during Asian trading hours on Tuesday.
KOSPI surges 5% while Nikkei gains 3% amid tech-led rally
Sentiment toward AI-related equities has been choppy in recent sessions. Earlier optimism over rapid adoption and robust long-term growth prospects was tempered by heavy profit-taking after Microsoft’s earnings underscored substantial capital expenditure needs, prompting concerns about near-term margin pressure.
Tuesday’s rally, however, indicated that investors were prepared to overlook short-term challenges, betting that sustained demand for AI infrastructure will continue to underpin chipmakers and technology suppliers.
South Korea’s KOSPI surged close to 5%, with major chipmakers Samsung Electronics and SK Hynix rising between 6.5% and 8%.
Investors rotated back into AI-linked stocks on expectations that long-term demand for advanced memory and processors remains solid.
Japan’s Nikkei 225 advanced more than 3%, supported by broad gains in chipmakers and technology shares, as well as a weaker yen.
Defying the broader regional rally, Hong Kong’s Hang Seng Index fell more than 1%. In mainland China, the CSI 300 edged down 0.4%, while the Shanghai Composite was little changed. By contrast, gains were seen elsewhere in the region, with Australia’s S&P/ASX 200 rising 1.1% and Singapore’s Straits Times Index up nearly 1%.
US, India finalize trade agreement; RBA policy decision awaited
India’s Nifty 50 futures surged more than 1% ahead of the market open after U.S. President Donald Trump announced a trade agreement with India on Monday, cutting tariffs on Indian exports to 18% from 50%.
The deal follows months of negotiations marked by sharply higher punitive tariffs and is widely viewed as a move toward restoring normal trade relations. It reportedly includes India gradually reducing purchases of Russian oil while boosting imports of U.S. energy and other goods.
Regional focus now shifts to Australia, where the Reserve Bank of Australia is set to deliver its interest rate decision later on Tuesday. Markets and economists are pricing in a 25-basis-point increase, which would lift the cash rate to around 3.85%, effectively reversing the RBA’s brief easing phase amid stubborn inflation and a tight labour market.
S&P 500 futures edge lower as investors prepare for a packed week of corporate earnings and major central bank meetings.
The U.S. payrolls report looms as a critical test for market direction following the Fed’s pause in rate cuts.
Japan’s Nikkei records a rare gain, supported by polls pointing to a likely LDP majority victory.
Gold and silver extend sharp losses after Friday’s volatility, adding to broader market unease.
The dollar stabilizes while the yen stays weak; Asian equities mostly track Wall Street futures lower.
Roughly 25% of S&P 500 companies report earnings this week, including Alphabet, Amazon, and Eli Lilly.
The dollar jumped after reports that President Trump nominated Kevin Warsh as Fed chair, while CFTC data show asset managers increased bearish dollar positions by $8.3 billion in the week to Jan. 27.
Copper falls further, extending last week’s steep declines as metals traders brace for continued volatility; U.S. natural gas futures slump, reversing Friday’s spike on milder weather forecasts.
Bitcoin slips below $76,000 in thin weekend trading, down about 40% from its 2025 peak, with demand fading amid thinning liquidity and subdued investor sentiment.
Dow Jones, S&P 500, and Nasdaq futures fell on Sunday night. The U.S. federal government entered another shutdown on Saturday, although it is widely expected to be resolved quickly.
A busy week of earnings lies ahead, led by Alphabet (NASDAQ: GOOGL), Amazon (NASDAQ: AMZN), Eli Lilly (NYSE: LLY), Palantir (NASDAQ: PLTR), Advanced Micro Devices (NASDAQ: AMD), and Disney (NYSE: DIS), with Disney set to report early on Monday.
Key U.S. Economic Data and Earnings Ahead
Wall Street will also be closely focused on the U.S. monthly jobs report due on February 6, after the Federal Reserve signaled some stabilization in the labor market by pausing its rate-cutting cycle last week.
Following the decision to hold interest rates steady, Fed officials will be watching hiring trends closely, balancing persistent inflation risks against signs of cooling job growth. Some policymakers continue to argue that additional rate cuts may be needed to support employment. Investors will also keep an eye on February consumer sentiment, consumer credit figures, and PMI data for both manufacturing and services.
Economic calendar:
Mon, Feb 2: ISM manufacturing PMI (Jan); Atlanta Fed President Raphael Bostic speaks.
Tue, Feb 3: Job openings (Dec).
Wed, Feb 4: ADP employment (Jan); remarks from Fed Governor Lisa Cook; ISM services PMI (Jan) in focus.
Thu, Feb 5: Initial jobless claims (week ending Jan 31).
Fri, Feb 6: U.S. employment report (Jan); preliminary consumer sentiment (Feb) and consumer credit data also due.
Earnings calendar:
Mon, Feb 2: Palantir (PLTR), Disney (DIS), Mizuho Financial (MFG)
Wed, Feb 4: Alphabet (GOOG, GOOGL), Eli Lilly (LLY), AbbVie (ABBV), Novartis (NVS), Novo Nordisk (NVO), Uber (UBER), Qualcomm (QCOM)
Thu, Feb 5: Amazon (AMZN), Philip Morris (PM), Shell (SHEL), ConocoPhillips (COP), Bristol-Myers Squibb (BMY)
Fri, Feb 6: Toyota Motor (TM)
Amazon (AMZN) shares jumped after the company reported strong third-quarter results, posting adjusted EPS of $1.95, up 36% year over year, on revenue of $180.2 billion, a 13% increase. AWS revenue rose 20% to $33 billion, while advertising sales climbed 24% to $17.7 billion. According to The Wall Street Journal, Amazon is in discussions to invest as much as $50 billion in OpenAI, having already committed $8 billion to Anthropic, for which AWS serves as the primary cloud and AI-training partner using its Trainium and Inferentia chips. Looking ahead, FactSet forecasts Amazon’s fourth-quarter EPS at $1.96, up 6%, with revenue expected to rise 13% to $211.4 billion.
FactSet estimates that Advanced Micro Devices (AMD) will report fourth-quarter EPS of $1.32 on revenue of $9.65 billion, while analysts forecast EPS of $1.23 and revenue of $9.38 billion for the following quarter. Some analysts expect AMD to exceed fourth-quarter expectations when it reports on February 3.
Analysts also anticipate that Alphabet (GOOGL) will report quarterly EPS of $2.58, representing 20% year-over-year growth, on revenue of $94.7 billion, up 16%. Consensus EPS estimates for the quarter have been trimmed by 0.4% over the past 30 days.
Technical Analysis:
DJIA Index
The Dow Jones Industrial Average is currently trading in a rectangular consolidation pattern, with prices compressing between 49,700 and 48,450. A decisive breakout above or breakdown below this range is likely to set the direction of the next major trend.
DJIA Daily Candlestick Chart
Nasdaq 100 Index
The Nasdaq 100 (NDX) failed to sustain gains above 25,860 last week and remains range-bound between 25,860 and 25,200, with stronger support near 24,650. A clear break below 25,200 would increase the risk of a decline toward 24,650. Conversely, if 25,200 continues to hold on repeated tests, the index is likely to remain choppy within the 25,860–25,200 range.
NDX Daily Candlestick Chart
SPX Index
The S&P 500 (SPX) has been hovering around the 6,900–6,890 zone for several weeks, with 7,000 acting as a key psychological resistance for bulls. For now, price action is expected to remain range-bound between 7,000 and 6,880. A decisive break below 6,880 would likely open the door to a deeper pullback toward 6,830.
The U.S. dollar has extended its modest recovery as gold and silver have sold off sharply, and conditions now appear stable enough for incoming data to drive FX markets this week. The U.S. economic calendar is set to culminate in solid payrolls and unemployment figures, potentially leaving room for further upside in the dollar.
Elsewhere, the European Central Bank may avoid focusing heavily on the euro in its messaging, while the Reserve Bank of Australia could deliver a rate hike as soon as tonight.
USD: Some Health Restored
The dollar is showing renewed strength. The de-basement trade that appeared to drive last week’s sharp decline in the USD has begun to unwind following Kevin Warsh’s nomination by President Donald Trump as the next Federal Reserve chair. The steep correction in previously overbought precious metals has likely provided additional support for the dollar, although we have consistently argued that the earlier USD selloff had become overly disconnected from underlying macro fundamentals.
With the dollar now partially recovered, we expect price action to realign more closely with incoming data and short-term rate dynamics this week. The U.S. economic calendar is busy, featuring ISM surveys (with manufacturing due today), JOLTS and ADP reports ahead of Friday’s payrolls release. Our expectation is for around 80,000 jobs added and an unchanged unemployment rate of 4.4%, which could help underpin further stabilization or recovery in the dollar.
In the meantime, we are watching closely for signs of dip-buying interest in EUR/USD. We see the key support zone around 1.1880–1.1900, and the recent break below this area suggests some renewed confidence in the dollar. A renewed rally in the euro without clear data or event-driven justification would imply that damage to the dollar may be more persistent. For now, however, we maintain a short-term bullish outlook for the USD.
EUR: Concerns over euro strength may be overstated
This week’s key question is how concerned the European Central Bank truly is about the euro’s recent appreciation. With EUR/USD no longer hovering near the much-feared 1.20 level, the likelihood of an explicit reaction from ECB officials has diminished—any comments were always more likely to emerge after the meeting or in the minutes rather than in the main policy statement.
At Thursday’s meeting, there may be little to prompt a change in President Christine Lagarde’s long-standing reluctance to comment on exchange rate levels. At the same time, markets do not appear to be pricing in significant risk of verbal pushback against euro strength, suggesting that the threshold for a negative euro response is relatively low.
Eurozone core inflation data due on Wednesday are expected to ease slightly to 2.2%. Our economists see a marginally higher print of 2.3%, but either outcome is unlikely to have much impact on the currency. For now, EUR/USD should continue to be driven largely by dollar sentiment, and if confidence in the USD continues to recover as expected, we see the pair moving toward our short-term fair value estimate of 1.1770 in the near term.
AUD: RBA rate hike hangs in the balance
The Australian dollar has been among the hardest hit by the abrupt unwinding of long positions in gold and silver. More broadly, AUD/USD appeared to be pricing in an excessive amount of optimism in January, particularly given unchanged interest rate differentials. Unlike EUR/USD—where rate expectations have shifted little on the euro side—AUD/USD has seen notable moves at the front end of the curve on both sides.
Markets are now pricing in around 19 basis points of tightening from the Reserve Bank of Australia at tonight’s meeting, and we align with consensus in expecting a 25 bp rate hike to 3.85%. That said, the decision looks finely balanced. While the upside surprise in December CPI, coupled with a strong housing market, supports a hike, the RBA is unlikely to signal the start of a new tightening cycle. With markets already pricing at least one additional hike by year-end, any indication that this move is “one and done” would limit the support a hike could provide to the Australian dollar.
In our view, the impact of RBA tightening on AUD/USD is more likely to become apparent beyond the near term, once the overwhelming volatility in the U.S. dollar subsides. Consistent with our USD outlook, and given that market pricing is already skewed toward a hawkish outcome, we expect AUD/USD to trade lower in the coming weeks before eventually settling into a more sustainable recovery path beyond the 0.70 level.
The Lone Ranger began as a radio series in 1933 and later ran as a television show for 21 years until 1954. The story follows the last surviving Texas Ranger, who is nursed back to health by Tonto, a Potawatomi tribesman. Together, they ride across the American West on their horses, Silver and Scout, fighting injustice while financing their mission through a silver mine that supplies both income and ammunition.
When the pair set off in pursuit of villains, the announcer famously cried, “Hi-Yo Silver, Away!” The show’s iconic theme music was written for the film The Lone Ranger and the City of Gold.
On Friday, however, silver traders were echoing a very different refrain: “Hi-No Silver, Away!” Silver led a broad selloff across precious metals and related ETFs. The SLV ETF plunged 28.5%, while GLD fell 10.3%. Despite the steep losses, trading volumes did not point to a full-blown panic in either fund.
Along with our colleague Michael Brush, we spent the morning reviewing the various explanations behind silver’s one-day bear market and gold’s sharp one-day correction. Early on Friday, the initial selloff may have been triggered by President Donald Trump’s nomination of Kevin Warsh to replace Jerome Powell as Federal Reserve chair. On the geopolitical side, reports that Iran is willing to negotiate with the U.S.—but only on terms Washington finds unacceptable—seem unlikely to have driven the rout.
Later in the day, at 2:00 p.m. EST, CME Group announced another increase in maintenance margin requirements—the second hike in three days—taking effect after the market close on Monday, February 2. Maintenance margins were raised to 8% from 6% for gold, to 15% from 11% for silver, to 15% from 12% for platinum, and to 16% from 14% for palladium. Margins on copper were also increased.
By announcing the margin increase ahead of Friday’s close, the CME effectively signaled to traders that any positions carried into the weekend would face substantially higher collateral requirements by Monday. This prompted many market participants to unwind positions in the final hours of Friday’s session, contributing to the sharp late-day acceleration in the price decline.
As a result, we discount the various conspiracy theories circulating in the market, including suggestions that the move marks the beginning of another Hunt Brothers–style silver crisis like March 27, 1980, when silver prices collapsed from about $21 to below $11 in a single day.
Notably, Warsh’s nomination should arguably have been supportive for precious metals, as he has favored boosting growth through lower interest rates and has downplayed the need for the Fed to be overly concerned about inflation at present.
Friday’s December PPI report was also hotter than expected and, in theory, should have added to the bullish case for precious metals. Headline producer prices rose 0.5% month over month, while the core index increased 0.7%. On a year-over-year basis, headline and core PPI inflation climbed to 3.0% and 3.3%, respectively. The data suggest producers may be beginning to pass on higher costs from tariffs and a weaker currency further along the supply chain.
We asked Michael Brush for an update on insider buying activity, and he said: “It’s still early, but so far corporate executives and directors have shown little interest in buying the recent market weakness. Their cautious stance remains in place. Buying by investors classified as insiders due to large holdings—10% owners—has increased slightly, but this type of activity is generally less meaningful as a market signal.”
JPMorgan has lifted its year-end 2026 gold price forecast to $6,300 an ounce, pointing to sustained and strengthening demand from central banks and investors despite the recent bout of sharp price volatility.
Gold and silver both saw steep pullbacks late last week after rapid rallies left prices overstretched, with the move partly driven by a rebound in the U.S. dollar. Even so, JPMorgan analysts said the broader environment continues to favor gold, arguing that the “longer-term rally momentum will remain intact” and that they remain “firmly bullish” over the medium term, supported by a structural diversification trend.
A key factor behind the higher forecast is stronger-than-expected buying from the official sector. Central banks purchased around 230 tonnes of gold in the fourth quarter, taking total buying for 2025 to roughly 863 tonnes, even as prices moved above $4,000 an ounce. JPMorgan now expects about 800 tonnes of central bank demand in 2026, citing ongoing reserve diversification that still has room to run.
Investor demand has also picked up, with analysts highlighting rising ETF holdings, solid physical bar and coin purchases, and broader portfolio allocations to gold as a hedge against macroeconomic and geopolitical risks.
“Gold remains a dynamic, multi-faceted portfolio hedge, and investor demand has continued to exceed our previous expectations,” analysts led by Gregory Shearer wrote. “As a result, we now see sufficient demand from central banks and investors to push gold prices to $6,300 per ounce by the end of 2026.”
While acknowledging the speed of the rally, the analysts dismissed concerns that prices are nearing unsustainable levels, noting that demand remains well above the historical threshold needed to keep the market tightening. “While the air gets thinner at higher price levels, we are not yet close to a point where the structural gold rally risks collapsing under its own weight,” they added.
On silver, JPMorgan struck a more cautious tone following the metal’s sharp surge and subsequent pullback. Without central banks acting as consistent dip buyers, the analysts said they are “somewhat apprehensive” about the risk of a deeper near-term correction in silver relative to gold.
Even so, they see a higher average price floor of around $75 to $80 an ounce, arguing that silver is unlikely to fully give up its recent gains. Over the longer term, JPMorgan expects higher prices to reshape fundamentals, gradually easing the supply-demand imbalance that underpinned silver’s recent rally.
European stocks moved lower on Monday as a selloff in precious metals rattled investor sentiment at the start of a week packed with corporate earnings, central bank meetings, and key economic data.
By 03:05 ET (08:05 GMT), Germany’s DAX was down 0.4%, France’s CAC 40 slipped 0.5%, and the U.K.’s FTSE 100 fell 0.6%.
Investor sentiment pressured by further declines in precious metals
Market sentiment was sharply dented on Monday as gold and silver extended their selloff, deepening losses from Friday’s rout. The nomination of Kevin Warsh as the next Federal Reserve chair sparked a strong rebound in the U.S. dollar, triggering widespread profit-taking and bringing an end to a rally that had pushed precious metals to record highs only days earlier.
Spot gold slid just under 6% to $4,597 per ounce on Monday, after plunging nearly 10% on Friday—its steepest single-day decline since 1983.
Silver, which had surged alongside gold on safe-haven demand and speculative inflows, also remained under heavy pressure following last Friday’s 30% collapse, marking its worst session since March 1980.
Adding to investor unease, CME announced increases to margin requirements on several metals contracts effective from Monday’s market close, suggesting some traders may be struggling to meet margin calls and could be forced to sell liquid assets.
Intesa Sanpaolo posts strong 2025 profit
Shifting back to the corporate sector, another heavy week of quarterly earnings is ahead, with roughly 30% of the EuroSTOXX index’s market capitalization due to report results.
Earlier on Monday, Intesa Sanpaolo (BIT: ISP) posted a 7.6% increase in 2025 net profit to €9.3 billion and unveiled plans to return €8.8 billion to shareholders through dividends and share buybacks, reinforcing its status as one of Europe’s most profitable banks.
Meanwhile, Swiss lender Julius Baer (SIX: BAER) reported 2025 net profit of CHF 764 million, down 25% from the previous year but slightly above market expectations of CHF 679 million.
In the U.S., attention this week will focus on technology heavyweights Alphabet (NASDAQ: GOOGL) and Amazon (NASDAQ: AMZN), especially as sentiment toward AI-related stocks has weakened after Microsoft (NASDAQ: MSFT) flagged rising costs from heavy AI investment, raising doubts over near-term returns.
German retail sales edge up
Data released earlier in the session showed that German retail sales increased by 0.1% in December from the previous month, improving from a 0.5% decline in November.
Manufacturing activity figures for January are due later in the session for the eurozone and are expected to show a modest improvement, although remaining in contraction territory.
Meanwhile, data released on Saturday indicated that China’s official manufacturing PMI fell further below the 50 threshold in January, signaling continued contraction in factory activity and underscoring ongoing weakness in domestic demand.
Both the European Central Bank and the Bank of England are set to hold policy meetings this week, with each widely expected to leave interest rates unchanged.
Oil falls as geopolitical risk premium fades
Oil prices dropped sharply on Monday as fears of a potential U.S. strike on Iran eased after President Donald Trump said the Middle Eastern oil producer was “seriously talking” with Washington.
Brent crude futures fell 4.8% to $65.97 a barrel, while U.S. West Texas Intermediate crude slid 5% to $61.91 a barrel.
Oil prices had surged last week as markets priced in a higher risk of supply disruptions from the region, following repeated threats by Trump toward Iran over its nuclear program and ongoing domestic unrest.
Those geopolitical risks appeared to recede after Trump’s comments over the weekend.
Meanwhile, the Organization of the Petroleum Exporting Countries and its allies, known collectively as OPEC+, left output levels unchanged at their weekend meeting, in line with expectations.
U.S. stock index futures edge lower as a sharp selloff in gold and silver weighs on investor sentiment ahead of a packed week of major corporate earnings and key economic releases. Bitcoin continues to slide after dropping below $80,000 over the weekend. Elsewhere, Oracle signals plans for fresh fundraising, while speculation over potential executive changes at Walt Disney grows ahead of its upcoming quarterly results.
Futures edge lower
U.S. equity index futures moved lower on Monday, pointing to a continuation of last session’s losses at the start of the new trading week.
As of 03:11 ET (08:11 GMT), Dow futures were down 323 points, or 0.7%, S&P 500 futures had declined 62 points, or 0.9%, and Nasdaq 100 futures were lower by 291 points, or 1.1%.
Market participants are closely watching a heavy slate of upcoming corporate earnings alongside a new monthly jobs report. Together, these releases could shed light on the health of the U.S. economy and test the resilience of a stock market rally now in its fourth year.
Beyond ongoing questions over the durability of the artificial intelligence-driven rally, investors are also weighing the implications of President Donald Trump’s nomination of Kevin Warsh as the next Federal Reserve Chair. If confirmed by the Senate, Warsh would bring his long-held calls for a shift in the monetary policy framework to the world’s most influential central bank.
Gold and silver extend their selloff
A sharp decline in both gold and silver, continuing the historic drop seen on Friday, weighed heavily on market sentiment—especially in Asia, where equities broadly fell.
Following a nearly 10% plunge late last week, spot gold fell another 4.9% to $4,626.80 per ounce by 03:27 ET, slipping well below the $5,000 mark it had just recently surpassed. Silver, which had benefited from speculative interest and industrial demand, also faced selling pressure but had somewhat stabilized around $79 an ounce as of 03:30 ET.
Analysts attribute the metals’ losses to a stronger U.S. dollar and widespread profit-taking after their significant rally in recent months.
Investors also showed concern about Kevin Warsh’s potentially hawkish stance in the long term. Although Warsh—formerly a Federal Reserve governor—has supported President Trump’s calls for sharply lower interest rates, he has been critical of the Fed’s asset purchase programs.
“Warsh is viewed as the most inflation-focused candidate for the Fed chair, reducing the chances of aggressive monetary easing. This sparked a wave of selling, with gold enduring its steepest decline in four decades,” ANZ analysts noted.
Bitcoin continues to decline
The risk-averse mood extended to cryptocurrencies, with Bitcoin dropping over 2% to $76,892.4. On Saturday, the leading digital currency fell below the $80,000 mark, continuing its decline from Friday. Some investors worried that Kevin Warsh might support shrinking the Federal Reserve’s balance sheet, which could reduce liquidity in the financial system.
Larger Fed balance sheets have historically supported cryptocurrencies by injecting cash into money markets, providing backing for riskier assets.
This latest slide marks another downturn for Bitcoin since reaching its all-time high last October. Once buoyed by optimism over increased cash flows and a friendlier regulatory environment under Trump, the token has now lost about one-third of its value.
With turmoil spreading across stocks, commodities, and crypto, Jonas Goltermann, Deputy Chief Markets Economist at Capital Economics, described the past few days as “unusually hectic […] for financial markets” in a recent note.
Oracle announces plans for new fundraising
On Sunday evening, Oracle Corporation announced plans to raise new capital in 2026 to support the expansion of its AI and cloud infrastructure amid rising demand for computing power.
The company aims to generate between $45 billion and $50 billion in gross proceeds during 2026, utilizing a mix of debt and equity financing.
About half of the funds will come from a combination of equity derivatives and common stock, according to a company statement.
Oracle plans to raise its debt funding through a single, one-time issuance of investment-grade senior unsecured bonds in early 2026, with no additional debt expected afterward.
Analysts at Vital Knowledge highlighted that roughly half of the total funding will come from equity-linked securities, including a $20 billion at-the-market (ATM) common equity program.
They noted, “Oracle’s $20 billion ATM offering is the first time a major tech company has been compelled to raise equity since the AI boom began. If this signals a shift toward greater fiscal caution in the industry, it could lead to a slower overall pace of spending.”
Disney set to release earnings
Walt Disney is set to release its earnings before the opening bell on Monday.
While the company’s continued focus on its streaming services, alongside its vital parks and studios divisions, will be closely watched, much of the attention may center on leadership succession.
According to the Wall Street Journal, Disney CEO Bob Iger has informed colleagues that he intends to step down and reduce his day-to-day involvement before his contract expires on December 31.
Board members are expected to convene soon to decide on Iger’s successor, with several media outlets naming Experiences division head Josh D’Amaro as the likely frontrunner.
As January 2026 draws to a close, FX markets find themselves at a pivotal juncture, shaped by diverging central bank policies and evolving technical signals. After delivering a cumulative 175 basis points of rate cuts since September 2024, the Federal Reserve now faces a critical inflection point. Meanwhile, the European Central Bank has wrapped up its easing cycle, and the Bank of Japan appears poised to begin its first substantive tightening phase in decades.
Together, these dynamics have fueled sustained U.S. dollar weakness—a trend that looks set to continue as U.S. economic growth moderates and investor confidence deteriorates.
From a technical standpoint, the dollar is underperforming against its major counterparts and is trading near multi-month lows. In this outlook, we examine the greenback’s performance versus USD/JPY, EUR/USD, and GBP/USD, incorporating both fundamental drivers and technical considerations.
USD/JPY – Weekly Timeframe
USD/JPY is currently trading in the mid-150s after failing to sustain gains near the 160 region, where price action appears to have formed a double-top structure. While the pair continues to find support along a rising trend line in place since January 2021, bearish RSI divergence has intensified, signaling potential downside risk for the U.S. dollar in the months ahead.
Key resistance remains near 160, while a support base is evident in the 148–150 zone. A decisive weekly close below this area would strengthen the bearish outlook, potentially opening the door toward the 138 level and aligning with the broader theme of ongoing dollar selling.
EUR/USD – Weekly Timeframe
EUR/USD is currently trading near a key resistance zone around 1.19. This area carries both psychological significance and technical importance, representing a measured move based on Fibonacci projections. With no evident bearish divergence at present, the possibility of a sustained break above 1.20 cannot be dismissed. Such a move would likely open the path toward the 1.30 level over the coming months, in line with the broader outlook of continued U.S. dollar weakness.
GBP/USD – Daily Timeframe
Sterling’s advance against the U.S. dollar appears to be driven more by dollar weakness than by underlying pound strength. JP Morgan strategist Nelligan cautions that any meaningful outperformance in sterling is more likely to materialize in the first half of the year, with fiscal concerns potentially resurfacing in the second half.
GBP/USD projections align with the broader bearish-dollar theme outlined in this report, with the Sigmacast ensemble from Sigmanomics’ classical models pointing to higher levels over the medium term. From a technical perspective, the pair has recently pulled back after closing above a key descending trend line that had capped upside since early 2025.
EUR/USD began a renewed downturn after failing to hold above 1.2080.
The pair slipped below a crucial bullish trend line, with prior support located around 1.1880 on the 4-hour chart.
EUR/USD Technical Outlook
On the 4-hour timeframe, EUR/USD broke beneath an important ascending trend line at 1.1880, triggering the latest leg lower. Price action also moved below the 38.2% Fibonacci retracement of the rally from the 1.1577 swing low to the 1.2083 peak.
Near-term support is seen around 1.1820, aligning with the 50% Fibonacci retracement of the same upward move. A stronger support zone for buyers could emerge near the 1.1800 level.
The key support level is positioned at 1.1770. A break below this zone could expose EUR/USD to a test of the 200-period simple moving average (green, 4-hour), followed by the 100-period simple moving average (red, 4-hour).
On the upside, any renewed advance is likely to encounter resistance near 1.1910. The first major obstacle for buyers stands around 1.1940, with an additional barrier near 1.1960. A decisive close above 1.1960 would strengthen the bullish case and potentially pave the way for a move back toward the 1.2080 area.
The U.S. jobs report, ISM PMI data, and another round of AI-driven tech earnings will be in the spotlight this week. Alphabet is poised to deliver robust results and upbeat guidance, making it an attractive buy. Meanwhile, Strategy heads into a difficult week as Bitcoin volatility and concerns over its BTC holdings weigh on the stock.
Wall Street stocks closed lower on Friday after President Donald Trump nominated former Federal Reserve Governor Kevin Warsh as the next Fed chair. Sharp sell-offs in gold and silver prices further unsettled markets.
Despite Friday’s pullback, the major U.S. stock indexes ended the month higher. The Dow Jones Industrial Average and the S&P 500 posted January gains of 1.1% and 1.2%, respectively, while the Nasdaq Composite rose 1%. Small caps outperformed, with the Russell 2000 climbing more than 4% for the month.
Volatility may pick up in the days ahead as investors weigh the outlook for economic growth, inflation, interest rates, and corporate earnings.
The key economic release will be Friday’s January U.S. jobs report, which is expected to show payroll growth of 67,000, with the unemployment rate unchanged at 4.4%. Ahead of that, the ISM manufacturing and services PMI readings will also be in focus.
A busy earnings calendar is also on tap, featuring reports from several major companies. These include “Magnificent Seven” members Alphabet and Amazon (NASDAQ: AMZN), along with AI-focused leaders Palantir Technologies (NASDAQ: PLTR) and Advanced Micro Devices (NASDAQ: AMD). Other high-profile reporters include Eli Lilly, Novo Nordisk, Pfizer, PepsiCo, Walt Disney, PayPal, Uber, Reddit, Roblox, Snap, Qualcomm, and Super Micro Computer.
Meanwhile, the federal government entered another shutdown on Saturday, though it is expected to be resolved by Monday.
No matter how markets move, I outline below one stock that could attract buying interest and another that may face renewed downside pressure. Keep in mind that this outlook applies only to the week ahead, from Monday, February 2, through Friday, February 6.
Buy Call: Alphabet
Alphabet goes into its quarterly earnings release with expectations for an upside surprise on both profit and revenue, driven by two key growth engines: a rebound in advertising and rising AI-driven contributions across Search, YouTube, and Google Cloud.
The company is set to report fourth-quarter results after the market closes on Wednesday at 4:00 p.m. ET. Options markets are pricing in a potential move of about ±6.4%, with positioning tilted to the upside as roughly 80% of whisper estimates point to a beat.
Earnings forecasts have been raised 29 times in recent weeks, compared with just five downward revisions, underscoring increasing confidence in Alphabet’s earnings outlook.
Wall Street expects Alphabet to deliver earnings of $2.64 per share, up 21.8% from a year earlier, while revenue is projected to rise 15.7% year over year to $111.1 billion. Cloud remains a standout performer, with Google Cloud Platform revenue forecast to grow more than 37% annually, driven by robust demand for AI infrastructure and enterprise offerings.
A meaningful earnings beat, paired with upbeat forward guidance, could propel the stock to fresh record highs as the search giant continues to unlock monetization from its expanding suite of AI initiatives and builds on accelerating cloud momentum.
GOOGL shares are trading near their 52-week high of $342.29 and remain above the 50-day moving average at $317.97. The stock is up about 8% year to date and has gained 66.3% over the past 12 months. From a technical perspective, the shares have held up well, consolidating above key support near $325 and setting up for a potential breakout above $350 if earnings exceed expectations.
Trade Setup:
Entry: $338–$340 (ahead of earnings)
Target: $350–$355 (approximately 5% upside)
Stop-Loss: $330 (around 2.4% downside risk)
Sell Call: Strategy
Strategy heads into its earnings release under markedly different conditions. The Michael Saylor–led company, which has transformed itself into the world’s largest corporate holder of Bitcoin, is facing mounting pressure as cryptocurrency markets turn volatile.
The firm holds roughly 712,647 Bitcoin, accumulated at an average cost of about $76,037 per coin, representing more than $54 billion at recent market prices. Over the weekend, however, Bitcoin fell below Strategy’s average purchase price for the first time since October 2023, pushing the company’s holdings into an unrealized loss position and heightening investor concerns.
Strategy is scheduled to report its fourth-quarter earnings after the market closes on Thursday at 4:20 p.m. ET.
Wall Street is forecasting a loss of $0.08 per share on revenue of $118.8 million, though investors’ attention will center less on the core figures and more on the company’s Bitcoin treasury and any related impairment charges.
In the third quarter of 2025, the company booked a massive $17.44 billion in unrealized losses tied to cryptocurrency price declines, and the prospect of similar write-downs could pressure fourth-quarter results as well.
Even with the stock trading at an estimated 0.7x the value of its Bitcoin holdings, Strategy’s elevated beta of 3.4 magnifies downside exposure in a risk-off market environment.
MSTR shares have plunged 55.3% over the past year and are currently trading around $149.71, just above their 52-week low of $139.36. From a technical standpoint, the stock has fallen below both its 50-day and 200-day moving averages, while momentum indicators point to oversold conditions without signaling a decisive reversal.
Elevated short interest and negative sentiment leave the shares vulnerable to additional downside, particularly if the earnings report points to slower Bitcoin accumulation or greater dilution from further capital-raising efforts.
Solana extended its sell-off on Monday after posting a decline of more than 15% in the previous week.
Derivatives data continues to reinforce the bearish move, with short positioning increasing and funding rates turning negative.
From a technical standpoint, a decisive close below $100 would likely open the door to a deeper correction.
Solana (SOL) extended its correction on Monday, trading below $100 after shedding more than 15% the previous week. The bearish price action is reinforced by derivatives indicators, which show increasing short positions and negative funding rates. From a technical perspective, a daily close below $100 could pave the way for a deeper correction in SOL.
Derivatives data points to a deeper correction
Derivatives data for Solana continues to support a bearish outlook. Coinglass OI-weighted funding rate data indicates that traders positioning for further downside in SOL now outnumber those expecting a rebound.
The metric turned negative on Saturday and stands at -0.0080% as of Monday, meaning short positions are paying longs—a clear signal of bearish sentiment toward Solana.
Additionally, Coinglass’s long-to-short ratio for SOL stood at 0.97 on Monday. A reading below 1.0 indicates bearish market sentiment, reflecting that a greater number of traders are positioned for further downside in Solana’s price.
Weakening institutional demand
Institutional demand for Solana softened last week. Data from SoSoValue shows that spot Solana ETFs recorded $2.45 million in net outflows, marking the first weekly withdrawals since their launch. If these outflows persist or accelerate, SOL may face additional downside pressure.
Solana Price Outlook: SOL falls below $100
Solana was rejected at weekly resistance near $126.65 on Wednesday and went on to fall more than 15% through Sunday, breaking below the key $100 psychological level. As of Monday, SOL is trading around $99.60.
A daily close below $100 could extend the decline toward the April 7 low at $95.26. A sustained move below that level may open the door to further losses toward the January 23, 2024 low near $79.
On the momentum front, the Relative Strength Index (RSI) on the daily chart is at 25, signaling deeply oversold conditions and strong bearish momentum. Meanwhile, the MACD remains bearish after a crossover on January 19, with expanding red histogram bars below the zero line, reinforcing the negative technical outlook.
Conversely, a recovery could see SOL move back toward the weekly resistance at $126.65.
Months after the October 10 liquidation cascade, crypto market depth has yet to fully recover, while debate continues over Binance’s role as Bitcoin’s sell-off persists.
Key points to know:
Liquidity across major crypto markets remains thin and fragmented following the Oct. 10 crash. Wider bid-ask spreads and weakened order books are being cited as key factors behind Bitcoin’s decline from around $125,000.
Binance has denied allegations that an internal malfunction triggered the crash. However, critics argue that the exchange’s limited transparency has contributed to growing distrust and fueled speculation and conspiracy theories.
Market makers and industry leaders say the episode highlighted deeper structural vulnerabilities in crypto markets, particularly shallow liquidity and heavy dependence on leverage. Many stress that the issue extends beyond any single platform and may justify regulatory-style oversight of market structure.
At first glance, the $19 billion liquidity wipeout on October 10 appeared to be a familiar event: a rapid cascade of liquidations across major crypto exchanges as Bitcoin, the world’s largest cryptocurrency, plunged sharply.
What followed—and the continued lack of transparency surrounding the day’s events—has made the episode far more consequential. The sell-off became the largest single-day liquidation by dollar value in crypto history, leaving traders frustrated and fundamentally reshaping how crypto markets are viewed. At the center of the controversy is one name: Binance.
For many market participants, the world’s largest crypto exchange has become the symbol of the crash, which saw Bitcoin drop by as much as 12.5%, its steepest decline in 14 months. The move triggered widespread forced closures of leveraged positions as margin levels were breached across exchanges.
Whether due to Binance’s sheer size, its dominance in derivatives trading, or the limited clarity around what exactly transpired, the exchange has faced persistent accusations on social media, with many claiming it played a central role in the Oct. 10 event—now widely referred to as “10/10.” Binance continues to deny responsibility, maintaining that the liquidations were not caused by an internal failure. The company did not respond to a request for comment from CoinDesk for this article.
In the absence of a clearly established narrative, it is unsurprising that traders remain unsettled.
In the months since the crash, market liquidity has remained noticeably impaired. Order books have not fully recovered, market depth remains uneven, and bid-ask spreads have widened. Many traders argue that this weakened market structure accelerated Bitcoin’s decline from around $124,800 to $80,000 and further eroded confidence across the market.
Adding to the debate, Ark Invest CEO Cathie Wood has publicly weighed in, attributing Bitcoin’s continued weakness to what she described as a “Binance software glitch.”
Why Binance has re-emerged at the center of the debate
Wood said in a late-January appearance on Fox Business that the alleged glitch triggered approximately $28 billion in deleveraging.
In response, Binance co-founder He Yi pushed back online, emphasizing that Binance does not serve U.S. customers, though the post was later removed.
Rival platforms were quick to capitalize on the moment. Star Xu, founder of competing exchange OXK, said the October 10 event caused “real and lasting damage to the industry.” While he did not name Binance directly, the remarks were widely viewed as an implicit criticism of the exchange’s role in the episode.
At the same time, challengers such as the decentralized exchange Hyperliquid pointed to rising derivatives volumes and improving liquidity depth, positioning themselves as credible alternatives as Binance continues to grapple with reputational pressure.
Binance has reiterated that the October 10 event was not caused by an internal system failure.
Speaking during a Friday ask-me-anything session, co-founder and former CEO Changpeng “CZ” Zhao dismissed claims that Binance triggered the crash as “far-fetched.”
According to the company, the sell-off was driven by broader market forces, including macroeconomic pressures, excessive leverage, thin liquidity, and congestion on the Ethereum network. Binance said its core systems remained fully operational throughout the episode and that it paid approximately $283 million in compensation to affected users.
“A slap in the face”
For some market participants, Binance’s explanation has fallen short—particularly given the sheer scale of the liquidations. The $19 billion figure has taken on disproportionate symbolic significance, with Binance’s compensation payments often viewed less as meaningful restitution and more as a small fraction of the overall damage.
“This is a f***ing joke,” wrote the pseudonymous Bitcoin Realist on X. “You… liquidated $19 billion on 10/10 alone… This is like spitting in our faces.”
That frustration reflects more than outrage over a single bout of volatility. For many traders, October 10 has come to represent a deeper mistrust of crypto market structure itself.
Still, not everyone believes Binance should bear the blame.
“10/10 was very obviously not a ‘software glitch,’” wrote Evgeny Gaevoy, CEO of market maker Wintermute, on X. “It was a flash crash in a highly leveraged market during an illiquid Friday night, driven by macro news.”
He added: “Finding a scapegoat is comfortable, but pinning this on one exchange is intellectually dishonest.”
The underlying argument is straightforward: crypto markets remain heavily dependent on leverage, and liquidity is often conditional rather than continuous. During periods of stress, market makers widen spreads or withdraw altogether. In such thin conditions, liquidation cascades can quickly accelerate.
While Binance was the largest venue where the crash unfolded, it was not necessarily the origin of the shock itself.
A lack of transparency continues to fuel speculation
What remains absent is a formal public review and an authoritative account of what happened. Critics argue that without a thorough, transparent inquiry, speculation is free to grow unchecked.
Salman Banaei, a former regulator at the U.S. Commodity Futures Trading Commission (CFTC), has suggested that the events of October 10 merit regulatory scrutiny, even without any allegation of wrongdoing.
“Whether you love or hate crypto, there should be a regulatory investigation into Oct. 10, 2025,” Banaei wrote, drawing a comparison to the May 6, 2010 stock market flash crash. “One benefit of regulation is that the mere possibility of such investigations acts as a deterrent to manipulation.”
He emphasized that he was not asserting manipulation took place, but rather highlighting a broader structural issue: crypto markets lack the formal post-event reviews that traditional financial markets routinely conduct after systemic disruptions.
Meanwhile, a trader known as Flood suggested that a major exchange had been steadily selling altcoins since 10/10, a claim that has fueled conspiracy theories around excess inventory.
Whether accurate or not, such narratives tend to gain traction when liquidity dries up and market confidence weakens.
The real problem lies in market depth, not a single exchange
October 10 may ultimately be remembered less for the scale of the liquidations and more for what it exposed about crypto market structure.
In bull markets, order books appear deep, leverage accumulates quietly, and liquidity feels plentiful. Bear markets reveal the opposite reality: liquidity evaporates, market makers pull back, volatility becomes concentrated, and the next shock breaks through far faster than expected.
Reflecting on the comparison with the FTX collapse in 2022, Mike Silagadze, CEO of Ether.fi, wrote on X that “this feels far worse than the post-FTX environment. In some ways, fundamentals are stronger than ever, yet price action has virtually no bids.”
Binance has become the most convenient scapegoat—not necessarily because it caused the crash, but because it is the largest and most visible exchange, making it an obvious target.
The more fundamental problem, however, is structural. Crypto market liquidity remains heavily reliant on leverage, conditional market making, and confidence—all of which have steadily eroded over the past four months.
As Eric Crown, a former options trader at NYSE Arca, put it: “I don’t know if Binance deliberately played a role in wrecking the market in October. I’d lean toward the obvious explanation: excessive leverage, insufficient liquidity, and largely ineffective or unwanted altcoin ‘technologies’ created the conditions for a massacre—and that’s exactly what happened.”
Bitcoin fell below $75,000 on Monday, sliding to its lowest level in nearly ten months.
Momentum indicators continue to weaken, pointing to intensifying bearish pressure and reinforcing the deteriorating technical outlook.
From a technical perspective, price action suggests Bitcoin could retest the $70,000 psychological support if selling pressure persists.
Bitcoin (BTC) slipped below the $75,000 level on Monday after posting an almost 11% decline over the previous week, falling to its lowest level in nearly ten months. Market momentum has decisively turned bearish, with technical indicators signaling the potential for further downside toward the $70,000 support zone.
Bitcoin may retest the $70,000 level if the correction extends
Bitcoin extended its sell-off at the start of the week, falling more than 2% on Monday after a decline of over 11% the previous week. At the time of writing, BTC is trading below $75,000, a level not seen since early April.
If Bitcoin maintains its downward trajectory, the correction could deepen toward the next major psychological support at $70,000.
On the daily chart, the Relative Strength Index (RSI) is hovering near 21, signaling strong bearish momentum and deeply oversold conditions. In addition, the MACD produced a bearish crossover on January 20, which remains in place, with expanding red histogram bars below the zero line—further reinforcing the negative technical outlook.
BTC/USDT daily chart
Conversely, a recovery could see Bitcoin push toward the key psychological level at $80,000.
More than $700 million in liquidations over the past 24 hours
Bitcoin slid to levels not seen since early April, triggering a sharp wave of liquidations across the crypto market. More than $700 million in leveraged positions were wiped out over the past 24 hours, according to Coinglass.
Long positions accounted for 77.39% of the liquidations, highlighting the market’s overly bullish positioning. The single largest liquidation occurred on Hyperliquid, where a BTCUSD position worth $15.46 million was forcibly closed. Ethereum (ETH) also experienced significant pressure, with nearly $270 million liquidated in the last 24 hours.
Traders should remain cautious, as continued price weakness could spark further liquidations, particularly among highly leveraged participants.
Long EUR/USD after a daily close above 1.1866, resulting in a 0.24% loss.
Long Silver, which ended with a loss of 18.62%.
Long Gold after a daily close above $5,000, producing a 2.26% loss.
Taken together, these positions generated a total loss of 21.12%, or 7.04% per asset. While this was a sizable drawdown, the broader performance of my weekly forecasts over recent weeks remains positive, as earlier gains were exceptionally strong and more than offset this setback.
Key market data from last week:
U.S. Federal Reserve policy meeting: No surprises, with interest rates left unchanged.
U.S. Producer Price Index (PPI): The standout data release of the week. Inflation came in far hotter than expected, with headline PPI rising 0.5% month-on-month and core PPI increasing 0.7%, versus forecasts of just 0.2% for both. This reinforced a more hawkish Fed outlook, lifted the U.S. dollar, and accelerated the sharp reversal in Silver (and Gold). As a result, expectations for a second U.S. rate cut in 2026 were pushed back to October.
Bank of Canada policy meeting: No change to interest rates, as anticipated.
Australian CPI: Inflation exceeded expectations, with an annual rate of 3.8% versus 3.5% forecast, strengthening the case for possible RBA rate hikes and supporting the Australian dollar early in the week.
Canadian GDP: Slightly weaker than expected, showing zero month-on-month growth.
U.S. unemployment claims: In line with forecasts.
While PPI and Australian inflation influenced market moves, two broader developments likely had an even greater impact:
Federal Reserve leadership: President Trump announced his nominee for the next Fed Chair, Kevin Warsh. Although regarded as a hawk, Warsh is now thought to favor lower interest rates. The nomination contributed to the collapse of the Silver rally and provided additional support to the U.S. dollar.
Geopolitical tensions: The U.S. continued its military buildup near Iran, raising the risk of a wider regional conflict. Polymarket currently assigns a high probability to a U.S. strike on Iran in March, despite President Trump still referencing the possibility of a diplomatic agreement. These tensions appear to be supporting crude oil prices, with WTI crude reaching a new four-month high last week.
Meanwhile, the S&P 500 briefly pushed to a fresh record above 7,000. Although the index remains resilient, upside momentum is limited. In my view, a clearer resolution to U.S.–Iran tensions is needed before a more decisive directional move can develop.
The Week Ahead: 2nd – 6th February
The most significant data releases for the coming week, ranked by expected market impact, include:
U.S. Average Hourly Earnings and Non-Farm Payrolls
Preliminary University of Michigan Inflation Expectations
European Central Bank main refinancing rate decision and monetary policy statement
Bank of England official bank rate decision, voting breakdown, and monetary policy report
Reserve Bank of Australia cash rate decision, rate statement, and monetary policy statement
U.S. JOLTS job openings
Preliminary University of Michigan consumer sentiment
U.S. ISM services PMI
U.S. ISM manufacturing PMI
U.S. unemployment rate
New Zealand unemployment rate
Canadian unemployment rate
U.S. weekly unemployment claims
This will be a particularly busy and potentially market-moving week, with three major central banks delivering policy decisions. Please note that Friday is a public holiday in New Zealand, which may reduce liquidity in related markets.
Monthly Forecast February 2025
For the month of January 2026, I forecasted that the USD/JPY currency pair would rise in value. Unfortunately, this was a losing trade.
For the month of February, I forecast that the EUR/USD currency pair will rise in value.
Weekly Forecast 2nd February 2026
Last week, three currency crosses experienced unusually high volatility, prompting the following weekly trade forecasts:
Short NZD/JPY, which resulted in a 0.57% loss.
Short AUD/JPY, ending with a 0.32% loss.
Short NZD/CAD, producing a 0.39% loss.
Overall, the Swiss franc and the New Zealand dollar emerged as the strongest major currencies of the week, while the U.S. dollar was the weakest. Market conditions were relatively subdued, with directional volatility dropping sharply—only 11% of major currency pairs and crosses moved by more than 1% over the week.
Technical Analysis
Key Support/Resistance Levels for Popular Pairs
US Dollar Index
Last week, the U.S. Dollar Index formed a notably large bullish pin bar, rejecting a fresh four-year low. On its own, this price action is bullish. However, the broader technical structure remains bearish, with the index still trading below its levels from 13 and 26 weeks ago. As a result, the technical outlook for the U.S. dollar is mixed.
The nomination of Kevin Warsh as Federal Reserve Chair provided some support to the dollar during the week. Nevertheless, the forward outlook remains uncertain, and I believe the most attractive trading opportunities in the near term are likely to be independent of U.S. dollar direction.
EUR/USD
The EUR/USD pair recently staged a strong long-term bullish breakout as the U.S. dollar accelerated lower and printed a new 3.5-year low. However, the move quickly failed, with price retreating sharply and finding minimal follow-through support.
This price action suggests the breakout may have been a temporary spike, although the potential for a sustained bullish trend should not be dismissed, as EUR/USD has historically shown a tendency to trend cleanly once momentum is established.
That said, the appointment of a new Fed Chair and the renewed strength in the U.S. dollar late in the week—driven by hotter inflation data—argue for a more cautious stance.
Accordingly, I would only consider a long position following a daily (New York close) above 1.2039.
WTI Crude Oil
WTI crude oil has surged strongly in recent sessions as the risk of a regional conflict centered on Iran has intensified. Prediction markets are currently assigning a high probability to a U.S. strike on Iran in March, a scenario that could significantly disrupt global crude supply. Against this backdrop, prices pushed to a new four-month high by the end of last week, with a daily close above $66.25 marking a potential six-month high.
However, two important cautions should be noted:
While a daily close above $66.25 would typically attract trend-following buying, the current moving average structure does not confirm a bullish setup. Even in the event of military conflict, the move could prove to be a short-lived spike, especially if a rapid U.S. victory follows, potentially resulting in a failed breakout.
Unlike recent Democratic administrations, the Trump administration is likely to take aggressive steps to suppress crude oil prices, which could cap or reverse upside momentum.
Bitcoin
BTC/USD has finally completed a decisive bearish breakdown below the long-term support zone just above $81,000. Price is now firmly established beneath this level and has pushed to a new nine-month low, a development that is technically significant and clearly bearish.
While equities and precious metals have rallied strongly in recent months, Bitcoin peaked at a record high several months ago and has since trended steadily lower. This divergence highlights a broader downturn across the crypto sector, with Bitcoin now showing clear signs of structural weakness.
Despite early expectations that Bitcoin would fundamentally reshape global finance, real-world adoption remains limited outside parts of Africa. Practical usability is still constrained, and its underlying value proposition remains uncertain.
Although I generally avoid short-selling, Bitcoin appears entrenched in a long-term bearish trend. I would not consider buying at current levels. Short positions may be worth considering, but only with strict risk management, as shorting is best suited to experienced traders.
XAG/USD
Silver experienced an exceptionally volatile week, surging more than 15% to hit a new all-time high and the long-discussed $120 options target, before suffering a dramatic reversal. The sell-off unfolded sharply on Thursday and Friday—particularly Friday—when prices plunged 28% in a single session.
I had previously cautioned that the move was highly vulnerable to a sharp correction, and that while a long position was justified, it should be taken with a reduced position size.
The sheer magnitude of the collapse, even with some bullish undertones and modest resilience in the bounce from the weekly lows, strongly suggests that another record high is unlikely in the near term. This extraordinary rally appears to be finished, and the most probable next phase is a period of erratic consolidation, marked by large swings and gradually diminishing volatility.
XAU/USD
Much of the analysis above regarding Silver also applies to Gold. That said, gold’s volatility was noticeably lower, and its price action showed greater resilience at the lows.
While gold is also likely to enter a period of sideways consolidation, the underlying structure suggests it may recover to the upside more quickly than silver.
Bottom Line
My preferred trade for the coming week is:
Long EUR/USD, contingent on a daily (New York) close above 1.2039.
USD/JPY traded steadily after the Bank of Japan signaled that the risk of falling behind the curve has not increased meaningfully. Japanese Prime Minister Sanae Takaichi noted that a weaker Yen supports exports and helps offset the impact of US tariffs on the auto sector. Meanwhile, the US Dollar gained support following Kevin Warsh’s nomination as Federal Reserve Chair.
USD/JPY is holding steady after three consecutive days of gains, trading near 155.20 during Asian hours on Monday. Upside momentum may be capped as the Japanese Yen remains relatively calm following the Bank of Japan’s January Summary of Opinions.
The BoJ’s Summary of Opinions indicated that the risk of falling behind the policy curve has not increased materially, though members emphasized that timely policy action is becoming more important. With real interest rates still deeply negative, policymakers agreed that additional rate hikes would be appropriate if the outlook for growth and inflation remains intact, while continuing to favor a gradual tightening path. Over the weekend, Japanese Prime Minister Sanae Takaichi said a weaker Yen could benefit export-driven industries and help shield the auto sector from the impact of US tariffs.
The pair may still find support as the US Dollar strengthens following President Donald Trump’s nomination of Kevin Warsh as the next Federal Reserve Chair. Markets view Warsh’s appointment as signaling a more disciplined and cautious approach to monetary easing.
US producer inflation data also underpinned the Dollar, reinforcing the Federal Reserve’s restrictive policy stance. Headline PPI remained unchanged at 3.0% year over year in December, above expectations for a slowdown to 2.7%, while core PPI accelerated to 3.3% from 3.0%, defying forecasts for a decline to 2.9% and highlighting persistent upstream price pressures.
Echoing this view, St. Louis Fed President Alberto Musalem said further rate cuts are not justified at this stage, describing the current 3.50%–3.75% policy rate range as broadly neutral. Atlanta Fed President Raphael Bostic also urged patience, arguing that monetary policy should remain modestly restrictive.
NZD/USD edged higher to around 0.6025 during early Asian trading on Monday. China’s RatingDog Manufacturing PMI increased to 50.3 in January 2026, in line with expectations. Meanwhile, US producer prices rose strongly in December, with PPI climbing 0.5% month over month.
The NZD/USD pair is trading on a positive note around 0.6025 during early Asian hours on Monday. The New Zealand Dollar remains supported against the US Dollar following the release of China’s Manufacturing PMI data, while traders await further direction from the US ISM Manufacturing PMI report due later in the day.
Data published by RatingDog showed that China’s Manufacturing Purchasing Managers’ Index rose to 50.3 in January from 50.1 in December, marking the highest reading since October 2025 and coming in line with market expectations. The data may offer modest support to the China-sensitive Kiwi, given China’s status as New Zealand’s largest trading partner.
US President Donald Trump’s selection of Kevin Warsh as the next Federal Reserve (Fed) Chair could boost the US dollar. Markets expect Warsh may lean toward a smaller Fed balance sheet and likely favor lower interest rates but would stop well short of the more aggressive easing associated with some of the other potential candidates.
Additionally, hotter-than-expected US producer price inflation could lift the Greenback and create a headwind for the pair. The Bureau of Labor Statistics revealed on Friday that US Producer Price Index (PPI) rose to 3.0% year-over-year (YoY) in December, beating estimates of 2.7%. Meanwhile, the PPI rose to 0.5% month-over-month (MoM) in December, above the market consensus and the previous reading of 0.2%. This report could further strengthen the case for the Fed to hold rates steady while policymakers monitor how inflation trends.
Silver prices are struggling to regain momentum after a sharp selloff on Friday. The metal came under heavy pressure as a stronger US Dollar—boosted by Kevin Warsh’s nomination as the next Federal Reserve Chair—combined with profit-taking to trigger a steep decline.
Market participants are now turning their attention to the upcoming US Nonfarm Payrolls report for fresh clues on the Federal Reserve’s monetary policy outlook.
Silver (XAG/USD) is trading cautiously around $80 during the Asian session at the start of the week, holding slightly above Friday’s fresh four-week low of $73.33. The white metal is attempting to stabilize after last week’s sharp selloff, during which it shed more than 30% from its record high of $121.66. The decline was driven by a stronger US Dollar, profit-taking following a strong rally, and expectations of a more hawkish Federal Reserve policy outlook.
From a technical perspective, the firmer US Dollar continues to undermine Silver’s risk-reward profile. At the time of writing, the US Dollar Index, which measures the Greenback against six major currencies, remains near its weekly high at around 97.33.
The US Dollar drew strong support on Friday after the White House nominated former Federal Reserve Governor Kevin Warsh to succeed Jerome Powell as Fed Chair. Analysts see Warsh’s nomination as preserving the central bank’s independence, countering earlier concerns sparked by President Donald Trump’s repeated comments that the next Chair would deliver additional rate cuts.
Warsh is known for favoring a strong US Dollar during his previous tenure at the Fed, suggesting monetary conditions could remain relatively tight going forward.
Looking ahead, investor focus will turn to the US Nonfarm Payrolls report for January, which is expected to play a key role in shaping expectations for the Federal Reserve’s future policy path.
Silver technical analysis
On the daily chart, XAG/USD is trading around $81.38, holding above the rising 50-day Exponential Moving Average near $79.50 and preserving the medium-term uptrend. The upward slope of the moving average continues to underpin the broader bullish bias. Meanwhile, the Relative Strength Index sits near 44, in neutral territory, reflecting a cooling in momentum after a previously overbought phase.
As long as prices remain supported above the 50-day EMA, pullbacks are likely to attract initial buying interest around that dynamic level. However, the RSI’s position below 50 limits near-term upside, with a recovery above the midline needed to strengthen bullish momentum. If momentum stabilizes, buyers may look to extend the rebound, while a failure to regain traction could keep price action range-bound or tilt risks to the downside.
The Australian Dollar softened even as China’s RatingDog Manufacturing PMI edged up to 50.3 in January from 50.1. Meanwhile, Australia’s TD-MI Inflation climbed 3.6% year over year, though the monthly increase eased to 0.2%, its slowest pace since August. The US Dollar could gain further support after Donald Trump nominated Kevin Warsh as Fed Chair, a move seen as signaling a more cautious stance on monetary easing.
The Australian Dollar weakened against the US Dollar on Monday, extending losses after falling more than 1% in the prior session. The AUD/USD pair stayed under pressure despite China’s RatingDog Manufacturing PMI ticking up to 50.3 in January from 50.1 in December, in line with market expectations. While the reading signaled a modest expansion in factory activity, it marked the strongest growth since October.
Meanwhile, Australia’s TD-MI Inflation Gauge rose to 3.6% year over year in January from 3.5% previously. On a monthly basis, inflation increased by 0.2%, easing sharply from December’s two-year high of 1% and registering its slowest pace since August.
ANZ Job Advertisements surged 4.4% month over month in December 2025, rebounding from a revised 0.8% decline and marking the first increase since July. The rise was also the strongest monthly gain since February 2022, pointing to renewed hiring momentum toward the end of the year.
The data come ahead of the Reserve Bank of Australia’s policy meeting on Tuesday, following the central bank’s decision to keep the cash rate unchanged at 3.6% for a third consecutive meeting in December. Policymakers are widely expected to maintain a cautious stance, as underlying inflation remains above target and labor market conditions stay relatively tight, supporting a restrictive and data-dependent policy approach.
Meanwhile, Australia’s Consumer Price Index increased 3.8% year over year in December, up from 3.4% previously. With headline inflation still exceeding the RBA’s 2–3% target range, recent PMI and employment indicators strengthen the argument for a tighter monetary policy bias.
US Dollar edges lower ahead of ISM Manufacturing PMI
The US Dollar Index (DXY), which tracks the Greenback against six major currencies, is edging lower after posting gains of more than 1% in the previous session, trading near 97.10 at the time of writing. Market attention is turning to the release of the US ISM Manufacturing PMI for January later in the day.
Despite the modest pullback, the US Dollar had recently drawn support following President Donald Trump’s nomination of Kevin Warsh as the next Federal Reserve Chair, a move markets viewed as signaling a more disciplined and cautious approach to monetary easing. The Greenback also benefited from improved risk sentiment after the US Senate reached an agreement to advance a government funding package, averting a potential shutdown, according to Politico.
US producer-side inflation data further underpinned the Dollar, reinforcing the Federal Reserve’s restrictive policy stance. Headline PPI remained unchanged at 3.0% year over year in December, exceeding expectations for a slowdown to 2.7%. Core PPI, which excludes food and energy, accelerated to 3.3% YoY from 3.0%, defying forecasts for a decline to 2.9% and highlighting persistent upstream price pressures.
Federal Reserve officials echoed a cautious tone on easing. St. Louis Fed President Alberto Musalem said additional rate cuts are not justified at present, describing the current 3.50%–3.75% policy rate range as broadly neutral. Atlanta Fed President Raphael Bostic also urged patience, arguing that monetary policy should remain modestly restrictive.
In Australia, inflation and trade data pointed to continued price pressures. The RBA’s Trimmed Mean inflation rose 0.2% month over month and 3.3% year over year, while the monthly CPI jumped 1.0% in December from zero previously, exceeding forecasts of 0.7%. Export prices increased 3.2% quarter over quarter in Q4 2025, rebounding from a 0.9% decline in Q3 and marking the strongest gain in a year, while import prices climbed 0.9%, beating expectations for a fall and reversing a prior decline.
Following the data, markets now price in more than a 70% probability of a 25-basis-point rate hike by the Reserve Bank of Australia from the current 3.6% cash rate, up from around 60% previously. Rates are fully priced at 3.85% by May and near 4.10% by September.
Australian Dollar slides toward key confluence support near 0.6900
The AUD/USD pair is trading near 0.6940 on Monday. Analysis of the daily chart shows the pair continuing to move higher within an ascending channel, pointing to a sustained bullish bias. The 14-day Relative Strength Index has eased from the 70 level to around 67, suggesting a cooling in bullish momentum rather than a trend reversal.
On the upside, AUD/USD could recover toward 0.7093, its highest level since February 2023, reached on January 29. A sustained break above this level would open the door for a test of the channel’s upper boundary near 0.7190. On the downside, initial support is seen at a confluence zone around the nine-day Exponential Moving Average at 0.6927, which aligns closely with the lower boundary of the ascending channel near 0.6920.
Shares of Australia’s GrainCorp (ASX: GNC) fell to four-year lows on Monday after the company issued a weaker earnings outlook for fiscal 2026, citing depressed global grain prices and continued pressure on export margins.
The grain handler forecast underlying EBITDA of A$200 million to A$240 million for FY26, down from A$308 million a year earlier, while underlying net profit after tax is expected to come in between A$20 million and A$50 million, compared with A$87 million in FY25.
GrainCorp’s Sydney-listed shares dropped as much as 19.3% to A$5.81, their lowest level since November 2021.
The company said global grain markets remain constrained by cyclical oversupply and subdued pricing, despite a strong winter harvest along Australia’s east coast. Slower grower selling and export margins at multi-year lows are also expected to weigh on earnings this year.
GrainCorp anticipates grain receivals of 11.0 million to 12.0 million tonnes in FY26, compared with 13.3 million tonnes last year, while exports are forecast at 5.5 million to 6.5 million tonnes.
The company added that it is stepping up cost-control efforts while continuing to maintain service levels.
Most Asian currencies traded in narrow ranges on Monday, while the dollar strengthened as investors assessed U.S. President Donald Trump’s nomination for the next Federal Reserve chair.
The Japanese yen weakened in volatile trading after remarks from Prime Minister Sanae Takaichi suggested a reduced likelihood of currency market intervention by Japanese authorities.
Broader moves across Asian currencies were subdued as investors awaited further economic signals this week, including a policy meeting by the Reserve Bank of Australia and the release of key U.S. jobs data.
Dollar gains after Trump taps Warsh as Fed chair nominee
The dollar index and its futures each rose around 0.1% in Asian trading, extending last week’s gains after the greenback staged a sharp rebound from a near four-year low.
The dollar’s advance was driven largely by U.S. President Donald Trump’s nomination of former Federal Reserve governor Kevin Warsh to succeed Jerome Powell as Fed chair.
Warsh is broadly seen as aligned with Trump’s push for significantly lower interest rates, but is also viewed as a critic of the Fed’s asset-purchase programs—suggesting that longer-term monetary policy under his leadership may prove less dovish than markets initially expected.
“We expect a Warsh-led Fed to favour a smaller balance sheet, limiting support for large-scale fiscal expansion,” ANZ analysts said in a note.
The analysts added that Warsh may view labour market weakness as the greater threat to the Fed’s dual mandate of maximum employment and price stability, and would likely back additional rate cuts if confirmed in the months ahead.
Powell’s term is set to expire in May. The current Fed chair said last week that his successor should remain independent of political pressures.
Yen weakens after Takaichi remarks
The Japanese yen underperformed its Asian peers on Monday, with USD/JPY climbing as much as 0.5% to trade above the 155 level.
The currency weakened after comments from Sanae Takaichi highlighted the benefits of a softer yen during a recent campaign speech—remarks that contrasted with earlier warnings from her administration against sustained currency weakness. Takaichi later appeared to moderate her stance, noting that a weaker yen supports exporters.
Previously, a series of comments from Japanese officials, including Takaichi, cautioning against excessive yen moves had fueled speculation of possible government intervention. That speculation helped the yen strengthen sharply in January, though it remains near levels that have triggered intervention in the past. Recent media reports have suggested Japan and the United States may be considering coordinated measures to support the currency.
Elsewhere in Asia, currencies traded in a narrow to softer range amid a lack of near-term catalysts. The Australian dollar slipped about 0.2% against the U.S. dollar, with attention focused on Tuesday’s Reserve Bank of Australia meeting, where a 25-basis-point rate hike is widely expected.
Expectations of a rate hike by the Reserve Bank of Australia were driven mainly by data pointing to a rebound in Australian inflation during the second half of 2025.
The South Korean won weakened, with USD/KRW climbing about 0.5%, as heavy outflows from domestic equity markets weighed on the currency amid selloffs in major technology stocks.
The Chinese yuan was largely unchanged, with USD/CNY flat as markets showed little response to mixed January purchasing managers’ index readings.
The Singapore dollar edged higher, with USD/SGD slipping 0.1%, while the Taiwan dollar was steady against the greenback.
The Indian rupee also weakened, with USD/INR rising roughly 0.2% and hovering near record levels, after investors reacted cautiously to the government’s fiscal 2027 budget, which signaled increased spending to bolster the manufacturing sector.
Oil prices slid sharply in Asian trading on Monday after reports of talks between the U.S. and Iran reduced some of the geopolitical risk premium in crude, while traders also took profits following recent gains.
The decline came after the Organization of the Petroleum Exporting Countries and its allies (OPEC+) kept output levels unchanged at a weekend meeting, in line with expectations.
Brent crude futures for April delivery plunged 3.3% to $67.07 a barrel by 20:31 ET (01:31 GMT).
Oil had climbed to near six-month highs last week amid fears of increased U.S. military action against Iran, while severe cold weather in North America was also seen as a threat to supply. However, prices came under pressure on Monday as traders moved to lock in profits.
Crude was further weighed down by a rebound in the U.S. dollar from recent four-year lows, after the greenback strengthened following President Donald Trump’s nomination of Kevin Warsh as the next Federal Reserve chair.
Trump says Iran is in “serious talks” with the U.S.
U.S. President Donald Trump said over the weekend that Iran was engaged in “serious talks” with his administration, raising the prospect of a possible easing of tensions between the two countries.
His remarks followed statements from Iranian officials indicating that preparations were underway for negotiations with Washington.
Trump has repeatedly warned of potential military action against Iran amid disputes over its nuclear program and domestic unrest, and has ordered the deployment of U.S. naval forces to the Middle East.
The move heightened fears of renewed U.S. strikes on Iran, raising the risk of further geopolitical instability in the Middle East and potential disruptions to regional oil supply. Crude prices surged as markets factored in a higher geopolitical risk premium.
Escalating tensions, alongside recent weather-related disruptions in the United States, helped lift oil prices despite lingering concerns over weak global demand and the possibility of an oversupplied market in 2026.
More recently, a significant production outage in Kazakhstan has also provided support to oil prices.
OPEC+ keeps output levels unchanged
OPEC+ on Sunday kept its oil output for March unchanged, reinforcing its decision to pause further production increases despite a recent rise in crude prices.
The group has raised output by roughly 2.9 million barrels per day through 2025, but announced an open-ended halt to additional hikes in November, after oil prices fell by around 20% over the past year.
OPEC+ also offered no forward guidance on production, likely reflecting elevated uncertainty surrounding the global economic outlook and ongoing geopolitical risks.
U.S. stock futures ticked down Sunday night as investors grew more cautious ahead of a heavy slate of earnings reports and economic releases, after technology stocks retreated following Microsoft’s results last week.
S&P 500 futures slid 0.7% to 6,915.25, while Nasdaq 100 futures dropped 0.9% to 25,428.75 as of 21:51 ET (02:51 GMT). Dow Jones futures were marginally lower, down 0.1% at 48,825.0.
Alphabet Amazon earnings loom amid AI worries
The move follows a weak finish for U.S. stocks last week, led by losses in the Nasdaq Composite as investors re-evaluated optimistic assumptions about artificial intelligence spending and its potential returns.
Market sentiment took a hit after Microsoft’s (NASDAQ:MSFT) earnings report, which, despite continued revenue growth, did little to ease concerns about the near-term benefits of its heavy investment in AI infrastructure.
The update pressured the broader tech sector and reignited worries that large-scale AI spending could take longer than expected to generate meaningful profits.
Adding to the unease, a Wall Street Journal report over the weekend said Nvidia’s (NASDAQ:NVDA) planned investment of up to $100 billion in OpenAI has been put on hold following internal deliberations at the chipmaker.
Focus now turns to upcoming results from other megacap tech companies, which are likely to influence market direction. Google parent Alphabet (NASDAQ:GOOGL) is set to report on Tuesday, with investors closely monitoring advertising performance, cloud momentum, and management’s outlook on AI-related capital spending.
Amazon (NASDAQ:AMZN) is scheduled to report on Thursday, with investors focusing on results from its Amazon Web Services cloud division and margin trends in its core retail operations.
Attention turns to the Fed nomination, with key jobs data also in the spotlight.
Beyond corporate earnings, investors are also parsing political and policy signals. President Donald Trump on Friday announced Kevin Warsh as his nominee for Federal Reserve chair.
Markets are assessing the implications of a Warsh-led Fed for interest rates, inflation management, and the trade-off between supporting growth and maintaining financial stability, at a time when policy guidance remains especially influential.
Upcoming economic data could further shape rate expectations. The U.S. January jobs report, due Friday, is expected to point to solid employment growth and an unchanged unemployment rate.
A large ETH liquidation on Hyperliquid triggered a leverage-driven cascade, sending total crypto liquidations above $2.5 billion in 24 hours.
What to know:
More than $2.5 billion in crypto positions were liquidated over 24 hours, including a single $222.65 million ether position on the Hyperliquid exchange.
Ether led the sell-off, with over $1.15 billion in liquidations as prices dropped by as much as 17%, followed by roughly $788 million in bitcoin and nearly $200 million in Solana.
The liquidation wave was heavily skewed toward long positions and amplified by thin market liquidity, highlighting how leverage can fuel cascading price declines and sudden market reversals.
One trader suffered losses exceeding $220 million on an ether position as a renewed wave of forced liquidations rippled through crypto markets, driving total liquidations over the past 24 hours to nearly $2.6 billion.
The largest individual liquidation took place on decentralized derivatives exchange Hyperliquid, where an ETH-USD position valued at $222.65 million was erased, according to data from CoinGlass.
The sell-off unfolded as ether fell by as much as 17% over the past 24 hours, dragging down bitcoin and other major tokens in a thinly traded market.
In total, 434,945 traders were liquidated during the period, with losses overwhelmingly concentrated in long positions. About $2.42 billion of the $2.58 billion in total liquidations came from bullish bets, while short positions accounted for just $163 million.
Hyperliquid suffered the most severe impact, logging $1.09 billion in liquidations — almost entirely from long positions — representing more than 40% of total losses across exchanges. Bybit followed with $574.8 million, while Binance recorded roughly $258 million in liquidations.
Ether absorbed the bulk of the damage, with more than $1.15 billion in ETH positions wiped out over 24 hours. Bitcoin saw about $788 million in liquidations, and nearly $200 million in Solana positions were erased, according to liquidation heatmap data.
Liquidations happen when leveraged positions are automatically closed after prices move beyond a trader’s margin limits. These forced exits often lock in large losses and can amplify price swings by setting off cascading sell-offs during volatile periods.
Market participants track liquidation data to assess positioning and sentiment. Heavy long liquidations can point to panic-driven bottoms, while large short liquidations may signal the start of a squeeze. Sudden spikes also highlight overcrowded trades and areas where reversals may emerge.
When combined with open interest and funding rate data, liquidation metrics can help identify potential entry and exit points, particularly in overleveraged markets vulnerable to abrupt flushes or sharp rebounds.
Such liquidation-driven moves have become increasingly frequent during low-liquidity conditions, where relatively modest price moves can ripple through derivatives markets and trigger outsized reactions.
Morgan Stanley said the recent pullback in Nvidia shares appears disconnected from the company’s strong near-term fundamentals, noting that investors remain puzzled by the stock’s underperformance despite a “very robust AI environment.”
Analyst Joseph Moore said his team was “somewhat surprised” by Nvidia’s year-to-date weakness following a soft finish to 2025. He added that investors frequently ask what factors drove the decline and how those pressures could dissipate in 2026.
Moore said business checks remain “very strong and getting stronger,” while market optimism around upcoming earnings is building. He noted growing discussion of Nvidia’s earnings power exceeding $9 per share this year, well above the consensus estimate of $7.75, which he believes makes near-term upside “highly likely.”
In his view, several concerns weighing on sentiment are exaggerated. Moore said AI beneficiaries are expanding as demand accelerates and supply constraints spread across the industry. He also addressed investor focus on financing risks tied to frontier AI model developers and Nvidia’s involvement, saying this will require some recalibration in how the market assesses the risk.
Concerns about rising competition from custom ASICs and AMD persist, but Moore described them as overblown. Looking ahead, he highlighted Nvidia’s upcoming Vera Rubin platform as a key catalyst that should reinforce the company’s technology leadership and help alleviate momentum concerns.
“Ultimately, we expect the stock to outperform from here,” Moore wrote, adding that while Nvidia still faces a “wall of worry,” it appears well positioned to move past it.
Lynx warns Apple margins under renewed pressure as NAND prices jump
Lynx Equity Strategy warned that Apple could be facing a deeper profitability squeeze than investors currently expect, arguing there is “further downside” to the stock even after its roughly 10% decline this year.
The brokerage said channel checks point to rising memory costs, with Apple confronting a sharp increase in NAND flash prices after talks with long-time supplier Kioxia broke down. Lynx said tensions emerged after Apple secured lower long-term pricing that created a margin gap for Kioxia, potentially leading the supplier to ship below Apple’s projected demand.
As a result, Apple has reportedly turned to Samsung to cover the shortfall. Without long-term supply agreements, Lynx said Samsung can charge prevailing market rates, which may be significantly higher. A Taiwan report cited by the firm suggested Samsung may have lifted NAND prices by as much as 100%, with Apple likely among the affected customers.
Lynx also highlighted technical risks, noting that Apple’s flash controller is optimized for Kioxia’s NAND process and may not perform as effectively with Samsung’s chips, increasing the possibility of performance issues or product returns.
“The Street is underestimating the impact,” Lynx said, warning that both Apple’s margins and its share price could remain under pressure in the coming period.
Barclays upgrades ASML on record orders, sees further upside
ASML shares moved higher earlier in the week after Barclays upgraded the stock to Overweight, pointing to record order growth, accelerating AI-driven demand and upside potential that it says the market has yet to fully reflect.
Analyst Simon Coles said expectations were already elevated going into the results, but those hopes were exceeded as orders hit record levels, prompting significant upward revisions to forecasts. Barclays raised its price target to €1,500 from €1,200, arguing there is still “room for further upside” given what it views as conservative guidance despite improving fundamentals.
ASML reported record order intake of €13.2 billion, almost double last year’s figure and well above market expectations. The company also increased its 2026 revenue outlook to a range of €34 billion to €39 billion, surpassing consensus estimates and improving on its prior outlook for largely flat growth versus 2025.
In addition to the strong demand outlook, ASML announced plans to reduce its workforce by around 1,700 roles as part of a broader restructuring effort aimed at simplifying management structures while increasing investment in engineering capacity.
Barclays said lithography demand linked to large-scale data center construction remains a key growth driver for ASML, while further upside could emerge from consumer AI adoption, humanoid robotics and a more resilient memory spending cycle.
The bank also highlighted intensifying foundry competition as a particularly supportive factor. Analyst Simon Coles said increased rivalry is likely to spur higher capital investment, creating upside risk that should benefit ASML and the broader semiconductor capital equipment sector through 2027.
Concerns around China were described as overstated. Coles noted that ASML’s guidance already assumes China revenue declines of more than 10% year over year at the start of 2026, but recent strength in imports suggests demand remains robust.
Barclays now forecasts low-teens revenue growth for ASML in both 2026 and 2027, translating into mid- to high-teens earnings upgrades, with additional upside possible if AI investment and foundry spending accelerate beyond current expectations.
Mizuho lifts Applied Materials on strengthening chip equipment demand
Applied Materials was upgraded to Outperform from Neutral by Mizuho, which cited a sharp rebound in semiconductor capital spending and improving demand from foundry and logic customers.
Analyst Vijay Rakesh raised the firm’s price target to $370 from $275, saying Applied Materials is positioned to benefit from a “meaningful acceleration” in wafer fab equipment (WFE) spending through 2027. Mizuho now forecasts WFE growth of 13% year over year in 2026, followed by 12% growth in 2027, marking a notable step-up from its prior outlook.
With roughly 65% of revenue exposed to foundry and logic customers, Rakesh highlighted rising capital expenditures from TSMC and improving tool spending at Intel as key growth drivers. TSMC’s capital spending from 2026 to 2028 is expected to be significantly higher than in the 2023–25 period, with 2026 outlays alone projected to climb 32% to about $54 billion.
Memory demand is also seen as supportive, with DRAM tied to high-bandwidth memory accounting for roughly 30% of Applied Materials’ revenue base. While China remains a headwind, with revenue from the region expected to decline 4% this year, Rakesh said growth elsewhere — representing about 70% of sales — is accelerating more rapidly.
He added that AI-driven investment is pushing leading-edge development below the 2-nanometer node, and said the broader recovery in global WFE spending is creating “strong tailwinds” for equipment suppliers, underpinning the upgrade and higher earnings estimates for 2026 and 2027.
BofA reiterates Snowflake as top software pick, says AI to accelerate growth
Bank of America said Snowflake remains “one of the fastest-growing stories in software,” reaffirming its Buy rating and keeping the stock as a top pick within infrastructure software.
Analyst Koji Ikeda said Snowflake is well positioned to benefit from accelerating enterprise investment in data analytics and artificial intelligence, given its role as a core cloud data platform. He said the key investor debate is whether Snowflake can sustain product revenue growth in the high-20% year over year range or even reaccelerate into the 30s — an outcome he believes is achievable.
Ikeda pointed to Snowflake’s expanding product portfolio, strong AI-related demand and rising customer consumption as key growth drivers. “The blizzard is just starting to form around broad AI adoption, and we believe Snowflake will play a foundational role,” he wrote.
BofA expects Snowflake’s growth to remain top-tier within infrastructure software, far outpacing peers growing at around 10%. The bank also raised its price target to $275, reflecting an updated valuation framework incorporating its revised growth outlook, risk assessment and peer multiple trends.
Ikeda described Snowflake as increasingly becoming the “king of enterprise data in the cloud,” highlighting its OLAP data lakehouse architecture, which enables customers to scale compute and storage independently to optimize performance and costs.
While acknowledging that the shares are not inexpensive — trading at a roughly 123% premium to peers — Ikeda said the valuation appears more reasonable on a growth-adjusted basis, where Snowflake trades in line with its peer group.
Gold and Bitcoin have diverged sharply in recent months, with Yardeni Research arguing that currency movements are becoming a key driver of that split.
In its latest report, the firm revisited the long-standing question of whether Bitcoin can be considered “digital gold,” pointing out that both assets are difficult to value since neither generates interest or dividends. However, Yardeni cautioned that Bitcoin’s purely digital form could make it “potentially vulnerable someday to hacking by quantum-computing algorithms,” whereas gold’s main drawback is the need for physical storage.
Bitcoin’s volatility has persisted. Yardeni noted that the cryptocurrency surged to a record near $125,000 in late 2025 before retreating toward $90,000.
Gold, by contrast, has been in a strong uptrend since it “decisively broke out” in March 2024. Prices have climbed roughly 2.5 times since then, moving above $3,000 an ounce in early 2025. The firm maintains its long-term outlook that gold could reach $10,000 by the end of the decade.
According to Yardeni Research, recent currency shifts are widening the gap between the two assets. The firm said a weaker U.S. dollar tends to hurt Bitcoin because it lowers Bitcoin’s value in other currencies, potentially encouraging foreign investors to sell. Some of those flows, it suggested, may be rotating into gold instead.
In addition, a softer dollar can put upward pressure on U.S. inflation, which would further support gold prices. Yardeni also noted that dollar weakness generally favors U.S. investors in overseas markets, reinforcing its overweight stance on emerging-market equities.
SpaceX, widely regarded as the most sought-after and richly valued private company, is widely expected to list publicly this year in what could become the biggest IPO on record. The Financial Times reports that the company aims to raise up to $50 billion, implying a valuation of roughly $1.5 trillion.
Why Everyone Wants a Slice of SpaceX
Elon Musk founded SpaceX in May 2002, predating his involvement with Tesla (NASDAQ: TSLA). Today, the company effectively dominates the global rocket-launch market, while its satellite internet unit, Starlink, is widely viewed as a major profit engine. Musk has said that SpaceX has generated positive cash flow for many years.
Like many marquee startups, SpaceX opted to stay private as institutional capital continued to flow in. More recently, Musk’s vision of building data centers in orbit has emerged as a key catalyst behind the company’s push toward a public listing.
SpaceX is not alone in pursuing solar-powered space-based data centers. Jeff Bezos’ Blue Origin is developing a competing concept, while Google (GOOG) is working on its own orbital data center initiative, known as Project Suncatcher.
Constructing data centers in space would require hundreds of billions of dollars in investment, with major technical challenges including thermal management, radiation shielding, and ultra-low-latency data transmission back to Earth.
By combining two of today’s most compelling investment themes—artificial intelligence and space—SpaceX has attracted intense investor interest.
Because SpaceX remains privately held, gaining exposure is difficult for most investors unless they are private equity firms, venture capitalists, or company employees. As a result, retail investors are increasingly seeking indirect exposure by investing in funds that hold SpaceX shares.
Baron Capital–Managed ETFs and Mutual Funds
Billionaire investor Ron Baron has long been a vocal backer of Elon Musk. According to a letter dated July 16, 2024, Baron has been steadily adding SpaceX shares each year since 2017 across his mutual funds and other investment vehicles.
The Baron First Principles ETF (NYSE: RONB) currently allocates roughly 16% of its portfolio to SpaceX. Launched just last month, the fund has already attracted about $124 million in assets.
Meanwhile, SpaceX represents 29% of assets in the Baron Partners Fund (BPTRX) and 19% of net assets in the Baron Focused Growth Fund (BFGFX) as of December 31, 2025. Both funds have delivered substantial outperformance relative to their benchmarks since inception.
Under SEC rules, open-ended funds are generally capped at 15% exposure to illiquid investments, defined as securities that cannot be sold within seven days without materially affecting their price. However, Baron funds no longer classify SpaceX as illiquid, citing the depth and activity of its secondary market, according to Bloomberg.
Entrepreneur Private-Public Crossover ETF (XOVR)
XOVR is the first exchange-traded fund to hold a private company. Although the fund revised its ticker and investment strategy in August 2024, it has continued to focus on entrepreneur-led businesses.
The ETF gained exposure to SpaceX last year through a special-purpose vehicle (SPV), a move that has coincided with a sharp increase in assets. However, as The Wall Street Journal has noted, SPVs can charge performance fees of up to 25%, raising questions about how such costs may affect the value of XOVR’s SpaceX stake.
There is also limited transparency around how the ETF determines the fair value of its SpaceX holdings, a requirement under SEC rules.
Driven by investor demand for indirect access to SpaceX, the fund’s assets have surged to more than $1.6 billion. NVIDIA (NVDA) and Meta Platforms (META) rank among its other largest holdings. Despite the inflows, the ETF has significantly lagged the S&P 500 over the past year.
The $66 level in WTI crude oil has proven to be a notable resistance zone, and prices are now retreating from that area. There is considerable uncertainty in the market over whether potential strikes against Iran could occur over the weekend, adding a layer of geopolitical risk.
Even so, underlying supply-and-demand dynamics remain a significant constraint on price action. As a result, large, sustained moves appear unlikely, and the prevailing strategy may continue to favor selling into rallies rather than chasing upside momentum.
British Pound
The British pound pushed above the 1.3750 level, but buying momentum now appears to be fading as selling pressure shows signs of exhaustion. Notably, the weekly candlestick resembles a shooting star, a pattern that often signals difficulty in sustaining further gains.
From here, a pullback could see GBP/USD slide toward the 1.35 area, a major round number with strong psychological significance. Part of this shift in sentiment may be tied to Kevin Warsh’s nomination as the next Federal Reserve Chair, as his comparatively hawkish stance has strengthened expectations for tighter U.S. monetary policy, weighing on the pound.
EUR/USD
The euro staged a strong rally earlier in the week but then reversed sharply after the initial upside move. This price action suggests the market may be entering a period of consolidation, raising the possibility that the recent breakout was a false move.
Much will depend on how traders respond to the nomination of the new Federal Reserve Chair. For now, the euro appears to be losing momentum. On the downside, the 1.16 level could come into play. However, if buyers step back in quickly over the coming week, the pair could regain strength and push higher, potentially revisiting the 1.20 area, with a further extension toward 1.23 if bullish momentum builds.
DAX
The German DAX has spent most of the week in negative territory but continues to hold above the 24,500 level, an area that has become important support after previously acting as resistance. This ability to stabilize at a former breakout zone suggests underlying buying interest remains intact.
Overall, the index appears to be in the process of bottoming and potentially turning higher, with scope for a renewed push to the upside. Looking further ahead, the outlook remains constructive. Ongoing fiscal support and heavy government spending in Germany should provide a tailwind for equities, leading to expectations that the DAX could be among the stronger-performing indices this year. As a result, the broader bias remains bullish.
Silver
Silver has become the focal point of market discussion after an extraordinary week of price action. After surging to around $122, the metal suffered a dramatic reversal, ending Friday in what can only be described as a sharp selloff.
In a single session, silver plunged below the $90 level, and momentum now suggests a potential move toward $80. After such an extreme rally, a correction was inevitable, and the market now appears to be experiencing that long-overdue pullback.
The selloff was likely exacerbated by the nomination of a more hawkish-than-expected Federal Reserve Chair, adding pressure to precious metals. Even in normal conditions, silver is known for its volatility, and the current environment has only amplified those swings. For now, price action has become exceptionally unstable, making silver largely untradeable for many participants.
Gold
Gold has been hit hard as well, but unlike silver, it benefits from strong central bank support, which should help it recover more quickly. Silver had moved so far beyond its fundamental norms that it began to resemble the kind of speculative excess often seen in smaller cryptocurrencies.
Gold, by contrast, continues to attract substantial institutional and central bank demand. That said, it is possible the market has already set a peak, although it may be too soon to say so definitively. Given the way trading unfolded on Friday, it is difficult to ignore the risk of continued downside follow-through.
Still, considering that gold was trading near $1,700 just two years ago, some form of correction was inevitable. When markets become stretched and overheated, this kind of reset is ultimately unavoidable.
USD/JPY
The U.S. dollar initially sank sharply against the Japanese yen over the week, but that move has since reversed decisively. The rebound suggests markets may be reassessing what now appears to have been an overly aggressive bet against the dollar.
Given the significant interest rate differential between the two currencies, this type of recovery is broadly in line with how the pair might be expected to trade. Technically, USD/JPY found support at the 50-week EMA, and if prices can reclaim the 155 level, the next upside target could be a move toward 158 yen.
USD/CHF
The U.S. dollar declined sharply against the Swiss franc, briefly testing the 0.76 level. While that price point may not be especially significant on its own, it does raise the possibility of Swiss National Bank intervention if franc strength becomes excessive—a risk that remains in the background.
Technically, the pair appears to be forming a hammer pattern following the breakdown, and more importantly, the U.S. dollar has begun to strengthen more broadly across global markets. Taken together, these factors suggest USD/CHF could be setting up for a rebound in the near term.
WTI crude oil has delivered two consecutive weeks of gains, giving day traders a favorable backdrop, and closed the weekend trading near $65.73. Prices at this level were last seen in the final week of September.
The previous period when WTI consistently held at similar elevated levels was from mid-June through the end of July 2025. While crude has traded higher at times since then, the notable development for technical traders is the growing durability of the current upward momentum.
From a chart perspective, support around $60.00 per barrel remained intact throughout the past week and began to demonstrate strength as early as Friday, January 23. As the new trading week gets underway, this technical stability may encourage renewed speculative buying, with some traders positioning for further upside in WTI prices.
Volatility and Turmoil Mark Commodity Markets Over the Past Week
In reality, WTI crude oil has remained relatively orderly, particularly given the absence of any extreme or destabilizing price swings. While the commodity did move higher, the advance was measured rather than explosive.
On Tuesday, WTI rose from the mid-$60 range to around the mid-$62 level, showing early signs of upward pressure. By Wednesday, prices continued to firm, reaching the mid-$63 area. Momentum strengthened further into Thursday and Friday, when price action clearly accelerated to the upside, reinforcing the constructive tone in crude oil trading.
By comparison with the turmoil seen in metals markets—and even in soft commodities such as cocoa and coffee—WTI crude oil has remained relatively restrained. Whether that composure will persist is an open question.
Commodity markets often experience bursts of speculative intensity in cycles, yet WTI has been notably subdued over the past several months. That said, the prolonged bearish trend, marked by steadily declining prices, appears to have paused and reversed, with crude moving higher over the last two weeks.
While geopolitical risks tied to Iran remain in the background, they are unlikely to be the primary driver behind the recent upside move in WTI prices.
Iran, Venezuela, and Shifting Dynamics in the Global Energy Market
Few things dominate markets like noise, with well-intentioned commentary offering countless explanations for sudden price moves in commodities. Weather events, wars, politics, trade agreements—even trivial anecdotes—are all quickly cited as causes. But the question remains: how many of these explanations actually reflect the true drivers behind price changes?
Commodity traders are highly seasoned, and major market participants operate with extensive intelligence gathered over months and even years. They work within long-term outlooks, but there is also one unavoidable factor: speculation.
At times, commodities move quickly simply because large orders enter the market and collective sentiment shifts. WTI crude oil is no exception to these forces. Over the past two weeks, buying interest in the energy sector has clearly increased.
Is this driven by speculative positioning, concerns about potential instability in the Middle East, or a blend of both? Beyond those considerations, fundamentals such as supply and demand also play a role—and by most measures, they remain relatively strong.
WTI Crude Oil Weekly Outlook: Market Poised After Recent Stabilization
The speculative trading range for WTI crude oil is seen between $59.20 and $70.10.
WTI has clearly pushed higher, with the $60.00 level and the mid-$60s now appearing to act as near-term support. As the new week begins, the key question is whether the $65.00 area can hold and establish itself as a more durable floor. Broader commodity markets have displayed renewed strength across several sectors in recent weeks.
The sharp advance in WTI may seem sudden, but it reflects a noticeable return of buying interest. Seasoned traders know crude oil has sustained higher price levels in the past, and its ability to post and maintain incremental gains has been evident over the last two weeks.
That said, risk management remains critical when trading WTI. Price reversals can occur quickly, and without disciplined controls, such moves can result in significant losses for speculative traders.
Ethereum was trading at $2,434.30 as of 12:14 local time (17:14 GMT) on Saturday, according to the Investing.com Index, marking a 10.26% daily decline. This represented its steepest one-day percentage drop since October 10, 2025.
The selloff reduced Ethereum’s market capitalization to $298.41 billion, accounting for about 11.08% of the total crypto market. At its peak, Ethereum’s market cap had reached $583.89 billion.
Over the past 24 hours, Ether fluctuated between $2,378.01 and $2,714.59. Weekly performance has also been weak, with Ethereum down 16.31% over the last seven days. Trading volume during the most recent 24-hour period totaled $36.56 billion, representing 25.68% of overall cryptocurrency turnover. Over the past week, prices ranged from $2,378.01 to $3,044.24.
Despite its recent rebound attempts, Ethereum remains 50.88% below its all-time high of $4,955.90, recorded on August 24, 2025.
Elsewhere in crypto markets, Bitcoin was last seen at $79,266.0, down 4.65% on the day. Tether USDt was effectively flat at $0.9990.
Bitcoin’s market capitalization stood at $1.60 trillion, representing 59.35% of the total crypto market, while Tether’s market cap was $185.07 billion, or 6.87% of the overall market value.
Canada’s opposition Conservative Party has voted by a wide margin to keep Pierre Poilievre as leader following a mandatory leadership review triggered by its loss in the last federal election.
At a party convention in Calgary on Saturday, Conservatives backed Poilievre with 87.4% of the vote, reaffirming his leadership after the party was defeated by the Liberals under Prime Minister Mark Carney in April.
The result comes after a sharp political reversal. In January, the Conservatives were polling more than 20 points ahead of the Liberals, but momentum shifted after repeated remarks by U.S. President Donald Trump about Canada becoming the 51st U.S. state helped rally voters around Carney.
Although Poilievre lost his own parliamentary seat in the election, he returned to the House of Commons after winning a by-election in August.
Ahead of the vote, Ashton Arsenault, a former aide in Stephen Harper’s Conservative government, said Poilievre needed at least 75% support to clearly demonstrate confidence in his leadership. The final result exceeded that threshold comfortably, signaling unity within the party heading into the next election cycle.
Meanwhile, public opinion remains mixed. Pollster Angus Reid reports Carney’s approval rating has climbed to 60%, the highest since he became Liberal leader. While about 80% of Conservative supporters back Poilievre, broader public sentiment is less favorable, with 58% of Canadians viewing him negatively.
What’s going on? On Monday, Needham upgraded AppLovin Corp (NASDAQ: APP) to Buy and set a $700 price target.
TL;DR: Needham turns bullish, lifting its 2026 ecommerce revenue forecast to $1.45B.
The full picture: Needham raised its rating after a deeper dive into AppLovin’s ecommerce business, strengthening its conviction in accelerating revenue growth by 2026—particularly as the stock has pulled back from last month’s highs. The firm views the recent weakness as a market mispricing, arguing that opportunistic advertisers are stepping in despite typical seasonal softness.
Needham increased its 2026 ecommerce revenue estimate to $1.45B from $1.05B, citing upcoming self-service launches that should expand the advertiser base and drive higher spending. This, in their view, could overpower usual Q1 seasonality and deliver sequential growth.
Even with the higher forecast, Needham sees further upside in a bull-case scenario—especially if AppLovin’s ecommerce trajectory begins to resemble TikTok’s rapid monetization curve, reinforcing the idea that in markets, replication can be a powerful catalyst for outsized returns.
American Axle
What’s going on? On Tuesday, BWS Financial launched coverage of American Axle & Manufacturing with a Buy rating and set a $17 price target.
TL;DR: AXL is merging with Dowlais, and the shares appear undervalued.
The bigger picture: American Axle & Manufacturing Holdings Inc. (AXL), which plans to rebrand as Dauch Corp. (NYSE: AXL), is nearing completion of its merger with Dowlais Group plc (DWLAF). According to BWS Financial, the deal will significantly diversify the business—expanding its automaker customer base, strengthening its global footprint, and broadening its product offerings. The combined company is expected to become a major force among auto suppliers, able to capitalize on greater scale, geographic reach, and meaningful operating efficiencies.
These advantages are projected to drive a sharp increase in free cash flow starting in 2027.
At the same time, AXL is adjusting its pricing and bidding approach to improve gross margins. While this strategy may weigh on revenue in 2025, it should support stronger cash generation. The analyst believes this near-term revenue softness has pushed the stock into deeply discounted territory.
Despite trading at valuation levels often associated with distressed companies, AXL remains profitable and continues to generate free cash flow. For investors searching for overlooked value opportunities, BWS Financial sees a compelling disconnect between fundamentals and the current share price.
Applied Materials
What happened? On Wednesday, Mizuho raised its rating on Applied Materials (NASDAQ: AMAT) to Outperform and lifted its price target to $370.
TL;DR: Mizuho expects stronger wafer fab equipment (WFE) growth and rising global capex to power further upside for AMAT.
The full story: Mizuho upgraded AMAT from Neutral with a $275 target to Outperform at $370, citing a much more favorable industry backdrop. As the world’s second-largest supplier of wafer fab equipment, Applied Materials is seen as a prime beneficiary of a powerful upswing in semiconductor capital spending across the U.S., Taiwan, and Japan.
The bank points to sharply improving WFE forecasts, with 2026 estimates now projected to jump 13% year over year, followed by another 12% increase in 2027—a dramatic acceleration compared with earlier expectations and a meaningful boost to AMAT’s earnings potential.
Core growth drivers include foundry and logic, which account for about 65% of revenue, supported by TSMC’s substantially higher capital spending plans for 2026–2028 versus 2023–2025, alongside a more constructive outlook for Intel’s tool purchases in 2026. On the memory side, DRAM—roughly 30% of revenue—stands to benefit from strong demand for high-bandwidth memory.
Concerns around China have also eased, as about 70% of AMAT’s revenue now comes from outside China, where growth is accelerating. With global WFE momentum building and major customers like TSMC and Intel increasing investment, Mizuho believes the setup strongly favors AMAT and justifies the Outperform call.
First Solar
What happened? On Thursday, BMO Capital Markets cut its rating on First Solar (NASDAQ: FSLR) to Market Perform and set a $263 price target.
TL;DR: BMO turns cautious on FSLR, citing competitive risks from Tesla and concerns that rising capacity could pressure module pricing.
The full story: BMO downgraded First Solar amid growing uncertainty around Tesla’s expanding solar ambitions. The firm questions how much of Tesla’s excess module capacity—given its proven ability to scale clean-energy platforms such as energy storage systems and inverters—could spill into the broader market rather than being used internally.
With U.S. utility-scale solar demand running at roughly 45–50 GW per year, First Solar’s 14.1 GW of capacity, alongside T1 Energy’s 2.1 GW (with potential expansion to 5.3 GW), could face intensified competition if Tesla moves toward its stated 100 GW capacity goal. Such a scenario could weigh on long-term module pricing or leave a persistent overhang on FSLR shares.
BMO notes that the bullish case for First Solar depends heavily on elevated U.S. module average selling prices (ASPs). However, after the stock’s 56% gain over the past 12 months, valuation now implies module pricing of about $0.29 per watt, even as backlog pricing sits closer to $0.30–$0.33 per watt. Earlier analysis suggested prices could climb into the high-$0.30s or low-$0.40s if Section 232 tariffs on polysilicon imports tightened supply—each $0.01 per watt increase potentially adding $23 per share in value.
That upside, however, may be tempered by a recent presidential order on semiconductors that includes exemptions for data centers, an area where Tesla could focus its solar deployments, potentially easing pressure from polysilicon-related restrictions.
Taken together—rising industry capacity, uncertain pricing durability, and Tesla’s looming presence—BMO sees limited justification for sustained pricing optimism and adopts a more neutral stance on First Solar.
Broadcom Inc.
What happened? On Friday, Wolfe Research upgraded Broadcom (NASDAQ: AVGO) to Outperform and raised its price target to around $370–$400.
TL;DR: Stronger expectations for TPU-driven AI growth led Wolfe to lift its outlook for Broadcom.
The full story: Wolfe Research upgraded Broadcom to Outperform, citing accelerating demand tied to the AI buildout—particularly from Google’s Tensor Processing Units (TPUs). Channel checks suggest TPU deployments could reach 7 million units by 2028, and Alphabet’s decision to offer TPUs to external customers is seen as creating a credible alternative to Nvidia’s ecosystem. Wolfe views Broadcom as the primary beneficiary of this shift.
As a result, the firm raised its long-term forecasts, projecting CY27 revenue of $154.5 billion and EPS of $16, implying a valuation of roughly 21x earnings. Additional upside could come from AI accelerator (XPU) programs at companies like Meta and OpenAI that are not yet fully reflected in estimates.
Wolfe also revised its AI ASIC revenue outlook higher, estimating $44 billion in CY26 based on 3.3 million TPU shipments, rising sharply to $78.4 billion in CY27 on 5.1 million units. TPUs are expected to account for the bulk of this growth, with other AI projects contributing smaller portions. Networking revenue is forecast to jump 75% to $15.1 billion in CY26, followed by 55% growth in CY27, while non-AI semiconductor and software segments are expected to remain relatively stable.
From a valuation standpoint, Wolfe argues the stock remains attractive. Its base case of $16 EPS in CY27 suggests room for multiple expansion, while a bullish scenario—with AI revenue doubling again—could push earnings toward $18 per share. Wolfe’s upper-end target reflects a valuation below Broadcom’s three-year average multiple of around 25x since the AI cycle began, reinforcing its positive stance on the stock.
The U.K. economy is at risk of a “significant recession,” a scenario that could force the Bank of England into a far more aggressive easing cycle, according to BCA Research.
In a research note, analysts led by Robert Timper said key indicators of U.K. economic growth continue to show weakness, with business sentiment and labor market data sending what they described as recession-like signals.
They noted that although layoffs remain relatively contained for now, slowing profit growth increases the risk of deeper job cuts ahead.
“The bottom line is that the U.K. labor market is deteriorating at a concerning pace and, in many respects, already appears recessionary,” the analysts wrote. “If incoming data fails to improve, labor market conditions could tip the U.K. economy into recession.”
At the same time, wage growth has moderated and price pressures in the services sector have normalized, reinforcing expectations that underlying inflation will ease toward the Bank of England’s 2% target later this year.
Against this backdrop, the BoE is expected to deliver rate cuts broadly in line with market pricing, totaling around 41 basis points this year. The central bank cut interest rates by 100 basis points in 2025.
From an investment perspective, BCA Research said U.K. equities remain appealing despite domestic economic softness, supported by the prospect of lower borrowing costs, a weaker pound, and strong overseas revenue exposure. The firm favors U.K. stocks over Eurozone equities over the next three to six months.
The analysts said U.K. equities remain attractively valued and have yet to show signs of being overbought.
They added that energy markets could again provide support, noting that a potential collapse of Iran’s ruling regime could trigger what they described as a historic shock to global oil supply.
Given the heavy weighting of oil and gas companies in major U.K. indexes, they said the broader U.K. market has historically outperformed Eurozone equities during periods of rising oil prices.
The United Steelworkers (USW) said late Saturday that it had agreed to extend negotiations with Marathon Petroleum, temporarily avoiding a strike involving roughly 30,000 workers at U.S. refineries and chemical plants.
Under the rolling 24-hour extension, the existing labor contract—originally set to expire at 12:01 a.m. ET on Sunday—will remain in force unless either the union issues a 24-hour strike notice or Marathon provides a 24-hour lockout notice.
Since talks began just over a week ago, the union has turned down at least five proposals from Marathon. The most recent offer, made Saturday, included a 14% wage increase over a four-year contract for refinery and chemical plant employees.
Marathon is serving as the lead negotiator for 26 U.S. refining and chemical companies, including Exxon Mobil, Chevron, and Valero Energy. The USW represents workers at facilities that together account for about two-thirds of U.S. crude oil refining capacity.
Earlier Saturday, Marathon spokesperson Jamal Kheiry said the company continued to meet with USW representatives and remained committed to bargaining in good faith toward a mutually acceptable agreement.
Meanwhile, Mike Smith, chairman of the Steelworkers’ National Oil Bargaining Program, said union members were pushing for fairness and justice, emphasizing that their industry-wide unity demonstrated readiness to fight for a fair contract.
People familiar with the negotiations said key sticking points include cost-of-living adjustments for the roughly 30,000 union-represented oil workers, healthcare expenses, and rules governing the use of artificial intelligence at refinery and chemical plants.
The United Steelworkers is also seeking stronger safety standards, though sources said this demand appears unacceptable to Marathon.
“Marathon believes workers in this industry are already overpaid,” one source said, speaking on condition of anonymity because they were not authorized to comment publicly. “There’s very little movement on economic issues, and aside from AI, they aren’t seriously engaging with the rest of our proposals. Even on AI, the approach hasn’t been constructive.”
In past contract negotiations, the USW has repeatedly agreed to roll over contracts for several days beyond their expiration through 24-hour extensions.
The current talks are focused on a national pattern agreement that establishes wages for hourly union workers, healthcare costs, and nationwide standards on safety and other matters.
Refinery operators typically earn around $50 an hour after completing their probationary period.
The national framework is paired with site-specific agreements to form individual contracts at each facility.
On Friday, Marathon and workers reached agreement on local issues at the company’s largest facility, the Galveston Bay Refinery, which has a capacity of 631,000 barrels per day.
The euro’s recent surge has brought renewed attention to the European Central Bank, though economists argue it is unlikely to prompt any near-term policy action.
Last week, the single currency climbed to $1.20 against the U.S. dollar for the first time since mid-2021, marking an unusually swift move by historical standards. According to Capital Economics, the euro has strengthened by a similar scale over a 10-day period only a few times in the past decade, while its trade-weighted exchange rate has reached a record high.
Even so, analysts expect the inflationary impact across the euro zone to remain modest. Capital Economics cited ECB sensitivity analysis showing that if the euro stabilizes at current levels, headline inflation next year would be roughly 0.1 percentage points lower than projected in the ECB’s December forecasts.
While this slightly increases downside risks to inflation, the brokerage said it falls far short of the threshold that would justify foreign-exchange intervention on price-stability grounds.
The ECB is likely to address the euro’s strength at its meeting next week, but concrete action appears improbable. Although the central bank has the authority to intervene in currency markets to prevent disorderly moves that could threaten price stability, Capital Economics noted that the euro would need to rise much further before such measures were considered. Even then, intervention through dollar purchases is viewed as highly unlikely.
Historically, the ECB has stepped into currency markets only twice—once in late 2000 and again in March 2011—both times to support, rather than weaken, the euro. Those interventions were coordinated with other major central banks. Capital Economics added that a coordinated effort to push the euro lower now looks extremely unlikely, particularly given the U.S. administration’s preference for a weaker dollar.
ECB officials have so far played down the recent appreciation. Vice President Luis de Guindos has previously described levels above $1.20 as “complicated,” while also calling the level itself “perfectly acceptable.” Meanwhile, Austria’s central bank governor has characterized the latest rise as “modest.”
Capital Economics expects ECB President Christine Lagarde to reiterate that policymakers are closely monitoring exchange-rate developments, but not to actively try to talk the currency down.
Although intervention is unlikely in the near term, prolonged euro strength could influence policy over time. Capital Economics said ECB analysis suggests that if the euro were to appreciate gradually to between $1.25 and $1.30 over the next three years, headline inflation in 2028 would be about 0.3 percentage points lower.
Under such conditions, policymakers would be more inclined to respond through stronger verbal guidance and lower interest rates rather than direct currency market intervention.
For now, economists say the euro’s rise largely reflects U.S. dollar weakness rather than stronger euro zone fundamentals, reducing the need for an immediate response. As a result, the ECB is expected to remain on the sidelines unless the appreciation becomes substantially larger and more persistent, according to Capital Economics.
Gold prices climbed to a new record above $5,600 an ounce this week, as persistent economic and geopolitical uncertainty continued to push investors toward traditional safe-haven assets.
The metal is up more than 17% so far this year, building on last year’s strong advance. Gold’s sustained rally has been driven by a combination of heightened global uncertainty, expectations of lower U.S. interest rates, and consistent purchases by central banks as part of a broader move to diversify away from the U.S. dollar.
Market anxiety has intensified in recent days after President Donald Trump said he intends to impose new tariffs on imports from South Korea, while concerns over a potential partial U.S. government shutdown re-emerged ahead of the January 30 funding deadline.
Following bullion’s surge to record highs, Investing.com spoke with John McCluskey, chief executive of Canadian miner Alamos Gold (NYSE: AGI), to explore the factors behind the rally and his outlook for gold prices over the rest of the year.
To what extent is today’s gold price driven by long-term structural demand, as opposed to short-term momentum and fear of missing out (FOMO)?
McCluskey noted that gold prices are currently strongly underpinned by sustained central bank purchases from at least six countries, including China, Russia, and their trading partners. This long-term structural demand has steadily pushed gold higher over the past decade, with prices hitting a new peak above $5,000 this week.
That rise has increasingly drawn in retail investors. According to fund managers, gold funds are experiencing record inflows, which is boosting both bullion prices and gold equities. Overall, structural demand remains the primary driver of current prices, but it has now spilled over into momentum-driven buying from retail investors.
How much does gold’s outlook hinge on additional U.S. interest rate cuts, and what would be the impact if the easing cycle ends earlier than markets anticipate?
“While U.S. Fed rate cuts may play a role, I don’t think gold’s outlook hinges on further easing, as prices have been—and continue to be—strongly supported by central bank buying. This trend has been in place for around a decade, and I believe there is still plenty of upside, with or without rate cuts,” McCluskey said.
Would a potential easing of global geopolitical tensions be sufficient to trigger a significant pullback in gold prices?
“While de-escalation could weigh on gold prices, there are numerous other tailwinds supporting the market, and I don’t see those trends fading anytime soon,” McCluskey told Investing.com.
“I expect gold prices to continue rising. And it’s not just gold mining CEOs saying this—chief executives at major banks are also pointing to a stronger gold outlook,” he added.
What is your outlook for gold prices by year-end?
I believe the fundamental drivers supporting gold remain firmly in place, pointing to a sustained bull market. With retail investors only now beginning to participate, gold could consolidate around the current $5,000 level and potentially move toward analysts’ year-end targets in the $5,400–$6,000 range.
Despite hitting record highs earlier in the week, precious and industrial metals retreated on Friday, as gold, silver, and copper declined amid profit-taking. The pullback followed a reassessment of expectations for aggressive U.S. interest rate cuts, alongside a stronger dollar.
Spot gold slid more than 6% to $5,042 by 10:55 ET (15:55 GMT).
The dollar gained after President Donald Trump announced former Federal Reserve Governor Kevin Warsh as his choice to lead the central bank, boosting the greenback against major currencies.
Bitcoin, the world’s largest cryptocurrency by market capitalisation, slid 6.53% to $78,719.63 by 12:48 p.m. ET (1748 GMT) on Saturday, extending losses from the previous session.
On Friday, bitcoin touched a low of $81,104 — its weakest level since November 21 — as the U.S. dollar strengthened following the selection of former Federal Reserve Governor Kevin Warsh as the next Fed chair. Investors have voiced concerns that Warsh could pursue tighter liquidity conditions across the financial system.
Warsh has argued for sweeping changes at the central bank and has advocated, among other measures, reducing the size of the Federal Reserve’s balance sheet.
Bitcoin and other digital assets have often benefited from an expanded Fed balance sheet, typically gaining when abundant liquidity supported risk and speculative investments.
Brian Jacobsen, chief economist at Annex Wealth Management in Menomonee Falls, Wisconsin, said the Fed’s “oversized balance sheet, coupled with heavy-handed banking regulation,” had effectively trapped liquidity within Wall Street rather than allowing it to flow to the broader economy, contributing to asset bubbles in areas such as bonds, cryptocurrencies, metals and meme stocks.
Ether also dropped sharply, falling 11.76% to $2,387.77 on Saturday afternoon. Cryptocurrencies have struggled to find clear direction since their sharp decline last year, lagging behind strong rallies in gold and equities.
“Sometimes these price corrections can become self-reinforcing,” Jacobsen said, noting that Friday’s sudden sell-off had served as a reminder of market risk. He added that further selling in the coming days was “possible, if not likely.”
Cryptocurrencies are struggling during what had been expected to be a period of strong inflows and supportive regulation under President Donald Trump. Bitcoin, the market leader, has shed about one-third of its value since hitting record highs last October.
Japanese Prime Minister Sanae Takaichi highlighted the advantages of a weaker yen during a campaign speech, striking a note that contrasted with her finance ministry’s stance, which has kept all measures on the table to address excessive currency volatility.
She later walked back her remarks, clarifying that she holds no particular preference regarding the yen’s direction.
“Many people argue that the weak yen is a negative at the moment, but for exporters it represents a significant opportunity,” Takaichi said on Saturday, ahead of the snap election scheduled for February 8.
“Whether in food exports or automobile sales, even with U.S. tariffs in place, the weaker yen has acted as a cushion. That support has been extremely valuable,” she added.
Takaichi also said she aims to strengthen Japan’s economy against currency swings by encouraging greater domestic investment.
FILE PHOTO: Japan’s Internal Affairs Minister Sanae Takaichi attends a news conference at Prime Minister Shinzo Abe’s official residence in Tokyo, Japan September 11, 2019. REUTERS/Issei Kato/File Photo
The yen has been trading near 18-month lows against the U.S. dollar, fuelling inflation and raising expectations of potential interest-rate increases by the central bank. Finance Minister Satsuki Katayama has repeatedly stated that authorities are prepared to step in to stabilise the currency if needed — comments widely interpreted by markets as a signal of possible intervention.
In a post on X on Sunday, Takaichi reiterated that she does not support either a strong or weak yen.
“I did not state that one is better or worse,” she wrote, adding that the government is closely watching financial markets and that, as prime minister, she will avoid making specific remarks on exchange-rate levels.
“My intention was simply to say that we want to build an economic framework capable of withstanding exchange-rate volatility, not — as some reports have implied — to promote the advantages of a weak yen.”
Former prime minister and finance minister Yoshihiko Noda, who co-leads the largest and newly formed opposition group, the Centrist Reform Alliance, said a weak yen is hurting households, according to Nikkei on Sunday.
“Amid an excessive depreciation of the yen, no one feels comfortable when they look at their household finances,” Noda was quoted as saying. “The viewpoint of ordinary citizens is absent, which once again raises serious concerns for me.”
The yen jumped after reports that the New York Federal Reserve had joined Japanese authorities in contacting banks to inquire about exchange rates for potential yen purchases — a move traders often view as a signal that intervention could be imminent.
The currency’s prolonged slide, alongside a recent surge in Japanese government bond yields to record levels, underscores investor unease over the country’s stretched fiscal position.
Takaichi is seeking voter approval for her push to revive inflation and reflate the economy.
The total cryptocurrency market capitalisation dropped by about 5% to $2.82 trillion over the past 24 hours, briefly touching $2.78 trillion twice—its lowest level since April last year. As anticipated, weakness in commodity and equity markets added further pressure to crypto, triggering a sell-off on elevated volumes as traders tightened stop-loss orders after a prolonged period of consolidation. In our worst-case scenario, market cap could fall into the $1.8–2.0 trillion range, corresponding to a 161.8% extension of the initial downside move seen in October–November.
The Crypto Sentiment Index dropped to 16 by Friday, marking its lowest reading in six weeks and a return to extreme fear—a zone the market managed to escape for only two days this week. While such depressed sentiment is often viewed as a buying opportunity, we continue to stress that a more prudent strategy is to wait for a clear exit from extreme fear, helping to reduce the risk of sudden and sharp downside moves.
Bitcoin has fallen 6% over the past 24 hours, briefly dropping to $81K and revisiting the lows seen in late November. The market is now testing the resilience of a support level that previously absorbed heavy selling pressure last year. About $10K lower lies a zone where prior cycle highs from 2021–2022 and the first half of 2024 converge. If that area fails to hold, Bitcoin could slide toward the $52–60K range.
In the near term, however, attention should remain on BTC’s price action around $80K. This level may prove difficult to break decisively and is viewed by many market participants as an attractive buying zone.
More than 22% of Bitcoin’s circulating supply is now underwater. Glassnode identifies a key support level at $83,400; a break below this could open the door to a drop toward the “true average market price” near $80,700. A deeper decline risks pushing long-term holders into losses, potentially accelerating selling pressure.
According to Wintermute Ventures, speculative excess in crypto is likely to fade this year, with digital assets evolving into the core financial and settlement layer of the internet. In this scenario, stablecoins are expected to emerge as the primary medium of exchange in the digital economy.
Santiment reports that Ethereum balances held on exchanges have fallen for a sixth straight month, driven by strong interest in staking. Since July last year, exchange-held ETH has declined by roughly one-third to about 8.15 million tokens.
TRM Labs estimates that illegal cryptocurrency transaction volumes hit a record $158 billion in 2025, up 145% year on year. During the same period, hackers stole $2.87 billion across nearly 150 separate attacks.
Meanwhile, the USD1 stablecoin issued by World Liberty Financial, a company linked to US President Donald Trump, reached a market capitalisation of $5 billion in under a year, making it the world’s fifth-largest stablecoin.
Over the past year, market focus has largely centered on gold and silver, with investors weighing safe-haven demand, central bank purchases, and inflation concerns. Meanwhile, copper has been quietly revaluing. So far this year, copper is up about 4%, following a roughly 40% surge in 2025. Analysts increasingly warn that copper demand could exceed supply within the next decade.
Introduction
When Thomas Edison brought electricity to cities in the late 1800s, copper was essential for carrying power from generating stations to homes, factories, and public lighting. Over time, it has become a cornerstone of modern economies, deeply integrated into energy networks, industrial activity, transportation, and communications. Today, its role is more critical than ever.
Copper now underpins electrification, AI infrastructure, electric vehicles, and defence systems. Yet the pace and scale of this shift are pushing the limits of global supply. According to S&P Global, without substantial new investment, the world could face a copper deficit of roughly 10 million metric tons by 2040.
Copper’s record-high prices point to a fundamental shift in demand dynamics.
At the start of the year, copper prices reached new record highs on the London Metal Exchange (LME), climbing to $13,407 per metric ton. So far this year, copper is up about 3%, building on a strong rally of roughly 40% in 2025.
Historically, copper has behaved as a cyclical commodity, moving in step with global economic growth, especially construction and manufacturing. In past upswings, prices typically weakened once growth cooled or inventories were replenished. This time, though, the forces supporting demand look wider in scope and more enduring.
A growing proportion of copper use is now tied to long-term electrification trends that are far less sensitive to short-term economic cycles.
From the demand side, copper is indispensable as an electrical conductor. It allows efficient power transmission, resists corrosion, has inherent antimicrobial properties, and can be recycled repeatedly without losing performance. Viable substitutes are scarce. Aluminium is often mentioned as an alternative, but with only about 60% of copper’s conductivity, it requires thicker cables to deliver the same current and typically needs extra insulation because it dissipates heat less effectively.
S&P Global projects that global copper demand will rise by roughly 50% by 2040, increasing from about 28 million metric tons today to around 42 million. This expansion is being driven by four key forces: baseline economic demand, the energy transition and new capacity build-out, AI and data centres, and defence modernisation.
While traditional economic uses and energy-transition applications are expected to remain the dominant sources of growth, Asia is likely to account for around 60% of the additional demand.
Around three-quarters of global copper demand comes from electrical uses, including power generation, transmission and distribution, electronics, and electrical equipment. Construction remains the largest single end-market, with copper heavily used in building wiring, plumbing, heating and cooling systems, and renovation projects. This provides a relatively stable foundation for demand, even when economic growth slows.
The energy transition adds another powerful layer of demand. As transport and power systems become increasingly electrified, copper usage is rising across the economy. Electric vehicles are a key driver of this shift, as they contain nearly three times as much copper as internal combustion engine vehicles—about 2.9 times more—reflecting the added requirements for wiring, batteries, power electronics, and electric motors.
More recently, AI and data centres have become a rapidly expanding source of copper demand. S&P Global estimates that copper consumption from data centres could increase from about 1.1 million metric tons in 2025 to roughly 2.5 million metric tons by 2040. Much of this growth reflects the copper needed for internal power distribution, cooling infrastructure, and the grid connections that supply these facilities. By the end of the decade, AI training data centres alone are expected to represent more than half of total data-centre-related copper demand.
Beyond these established drivers, emerging technologies may provide additional upside. Humanoid robotics is still in its early stages, but it is relatively copper-intensive. A single humanoid robot typically contains between 4 and 8 kilograms of copper, used across motors, actuators, wiring, sensors, batteries, and semiconductors. Even modest adoption scenarios could therefore have a meaningful impact on demand.
Defence is another area where copper consumption is set to rise. Heightened geopolitical tensions and the modernisation of military capabilities are leading to higher defence spending and quicker deployment of advanced technologies. Copper is extensively used in military equipment and infrastructure due to its conductivity, durability, and reliability in electrical systems, communications, and propulsion.
Given copper’s strategic role, much of this investment is relatively insensitive to price. At the 2025 NATO summit in The Hague, member states committed to lifting defence spending to 5% of GDP. As a result, annual copper demand from defence applications is expected to approach 1 million metric tons by 2040—around three times current levels.
A Constrained and Rigid Supply Landscape
While global demand continues to rise, supply is expected to stay tight as existing mining assets age. Without substantial additions to capacity, the market could face a shortfall of roughly 10 million metric tons by 2040.
Bridging this gap will be one of the major challenges of the coming decades, as the supply response is both complex and structurally limited. Substitution offers little relief, given copper’s unmatched conductivity, durability, and recyclability.
Over time, mine depletion has made copper extraction more technically difficult and more expensive, while producers are also contending with tighter regulation and rising environmental and social opposition from local communities.
These vulnerabilities have already led to repeated supply disruptions. Freeport-McMoRan has declared force majeure at its Grasberg mine—the world’s second-largest copper operation, accounting for roughly 4% of global output—with a full recovery not expected until 2027. Disruptions are also set to continue this month following strikes at Capstone Copper’s Mantoverde mine in Chile.
Source: Morgan Stanley
Bringing new copper projects online is a lengthy process, typically taking close to two decades—around 17 years—from initial discovery to first production, reflecting regulatory, environmental, political, and cost hurdles. Even so, today’s price levels do not provide strong enough incentives to develop major new deposits by 2040. Most high-quality, easily accessible resources have already been exhausted or are currently in production.
This underscores the importance of maximising output from existing mines, improving operational efficiency, and simplifying permitting processes and incentive structures for new developments. Future supply growth will increasingly rely on deeper exploration, which is both more expensive and technically challenging. Although several deposits have been identified that could theoretically help meet future demand, many are unlikely to be developed because they are not viable under current prices or with existing technologies.
Secondary supply from recycling offers an important supplementary source but cannot fully bridge the gap. Unlike many other metals, copper retains its key properties when recycled, making recycled material virtually indistinguishable from newly mined copper. As copper use expands across the economy, more scrap will become available as equipment and infrastructure reach the end of their life cycles.
End-of-life copper waste is expected to grow by about 4% annually, surpassing 15 million metric tons by 2040. S&P Global estimates that if recycling rates increase from 50% in 2025 to 66% by 2040, recycled copper from end-of-life sources could add roughly 6 million metric tons to total supply.
The expansion of recycling hinges on more efficient collection and processing systems. While scrap supply is more flexible than mined output, policy support will be critical to scaling recycling globally. Regions such as the United States, the European Union, and China have already implemented measures to set recycling targets or invest in supporting infrastructure.
These initiatives are designed to boost secondary copper supply while lowering environmental impacts. Even with significant gains in processing efficiency, recycling is expected to account for at least one-third of total copper supply by 2040.
Meanwhile, smelting and refining are heavily concentrated in China, making them a strategic chokepoint in the global supply chain. China controls a large share of global smelting capacity—around 12 out of 29 million metric tons worldwide—and continues to expand this position, further increasing industry concentration.
Processing margins are coming under growing pressure as treatment and refining charges decline, while costs and regulatory burdens vary widely by region. At the same time, the high concentration of capacity—estimated at around 40–50% of the global total—adds to systemic fragility and increases exposure to geopolitical disruptions.
For these reasons, governments increasingly view mineral supply chains as strategically vital. New models of international cooperation, along with greater participation by sovereign wealth funds, are emerging as alternative ways to strengthen and diversify access to critical minerals and reduce reliance on China-centric supply chains.
Conclusion: A Global Race for Critical Metals
The global economy is entering a phase of exceptional expansion in renewable energy, electric vehicles, artificial intelligence, data centres, and defence, all of which are driving a sharp increase in copper demand—the cornerstone metal of electrification. New technologies, ranging from electrified military systems to advanced robotics, are likely to intensify this trend further. The pace of electrification is now running ahead of the growth in copper supply.
This race extends beyond geological availability to the downstream stages that determine mineral quality and value. China’s dominance in copper refining and magnet production represents a major vulnerability for global supply chains, prompting advanced economies such as the European Union to launch initiatives aimed at securing alternative sources and accelerating the development of domestic capabilities.
During and in the aftermath of 9/11, Nassim Taleb—a Lebanese-born former options trader and quantitative analyst—published Fooled by Randomness. He later refined and formalized the idea in his 2007 book The Black Swan, drawing on the metaphor of the rare black swan, an anomaly among typically white birds.
Taleb defined a Black Swan as an event that meets three criteria: first, it is an extreme outlier, often without historical precedent; second, it carries an immediate and profound impact; and third, it becomes explainable only in hindsight, after the event has occurred.
Forty years ago tomorrow, on the morning of Tuesday, January 28, 1986, tens of millions of Americans watched live as the Space Shuttle Challenger lifted off—only to explode 73 seconds into flight, killing all seven crew members, including the widely admired teacher-astronaut Christa McAuliffe.
The tragedy met all of Nassim Taleb’s criteria for a Black Swan event. First, it was unprecedented, marking the first fatal in-flight disaster involving a US spacecraft. Second, its impact was immediate: President Ronald Reagan postponed his State of the Union address scheduled for that evening. Third, the cause was only fully understood after the fact, when physicist Richard Feynman explained during televised hearings that the disaster resulted from O-ring failure in unusually cold conditions.
One response that did not occur—then or in most Black Swan events—was a meaningful stock market selloff. Markets were largely indifferent. The S&P 500 rose on the day of the explosion and continued higher, gaining 2.6% for the week and 16.8% over the remainder of 1986. The Dow Jones Industrial Average also advanced, rising 1.2% on the day, 2.7% for the week, and 22.6% for the year.
Another Black Swan touched Great Britain exactly fifty years earlier, when global stock markets closed on January 28, 1936, to mark the funeral of King George V. He was succeeded by Edward VIII, whose relationship with an American divorcée triggered a constitutional crisis that lasted much of the year. The turmoil ended with Edward’s abdication in favor of his younger brother, who became King George VI and later passed the crown to his daughter, Elizabeth II—the longest-reigning and arguably most popular British monarch—suggesting the succession ultimately resolved smoothly.
Despite the political uncertainty, 1936 proved to be a strong year for markets during an otherwise bleak Depression-era decade, with the Dow Jones Industrial Average rising 25%.
Across the past century, several other major Black Swan events have reshaped history, including the outbreak of World War I following the assassination in Sarajevo on June 28, 1914; Japan’s attack on Pearl Harbor on December 7, 1941; the assassination of President John F. Kennedy on November 22, 1963; and the September 11, 2001 attacks.
History also shows a striking pattern in which US presidents elected in seven consecutive election years, spaced 20 years apart, died in office: William Henry Harrison (1840), Abraham Lincoln (1860), James Garfield (1880), William McKinley (1900), Warren Harding (1920), Franklin Roosevelt (1940), and John F. Kennedy (1960). One might argue that this grim sequence made the outcome seem almost “predictable.” The streak ended two decades later, when Ronald Reagan survived an assassination attempt in March 1981, with John Hinckley’s bullet narrowly missing his heart.
Following the survival of Reagan—and Pope John Paul II six weeks later—three major Black Swan events marked the late 1980s. The first was the 1986 Challenger explosion, followed by the 1987 Black Monday market crash, which shocked investors far more than the general public. The decade closed with the fall of the Berlin Wall in 1989, a swan-like event, even though many had anticipated the eventual collapse of Gorbachev’s Soviet Union.
The stock market shrugs off most Black Swan events
The stock market posted an unexpected rally in the week and year following President Kennedy’s assassination and rebounded swiftly after the September 11, 2001 attacks. These Black Swan events appeared to have little lasting effect on Wall Street, as traders largely focused on other—primarily financial—developments and trends.
Markets also tended to rise during many 20th-century wars, most of which began with surprise attacks. The abrupt onset of World Wars I and II, the unexpected outbreak of the Korean War, and the August 1964 Gulf of Tonkin escalation of the Vietnam War all triggered initial sell-offs that were followed by strong market recoveries.
The accompanying diagram illustrates the market’s detailed reaction after the attack on Pearl Harbor in late 1941 and following the North Korean invasion in June 1950. These two episodes were separated by a period of post-war, largely “Swan-less,” malaise in the late 1940s.
In the two most recent Black Swan episodes, markets followed a familiar pattern. First, the abrupt escalation of the COVID-19 crisis in March 2020 triggered a stunning 35% market collapse in just 35 days, which was then followed by one of the strongest recoveries on record later that year. Second, markets sold off sharply after President Trump and Interior Secretary Lutnick unveiled sweeping high-tariff measures on “Liberation Day” in April 2025, yet the S&P 500 has since rebounded and is now up roughly 40% from those lows.
Most of the Dow’s top five annual gains over its 130-year history followed major Black Swan events.
By definition, the next Black Swan event is unknowable, but the market’s response may not be. With or without a short-term correction, prices are likely to be higher a year later.