- Bitcoin trades just under $68,000 on Monday, marking a decline of more than 6% compared to last week.
- Ethereum has broken below a key support level, raising the risk of a deeper pullback.
- XRP continues its downward trend, recording seven straight bearish candles.
Bitcoin (BTC), Ethereum (ETH), and Ripple (XRP) remain under pressure on Monday after posting weekly losses of over 6%, 5%, and 4%, respectively. BTC has fallen below the $68,000 mark, while ETH and XRP are trading beneath key support levels. The three leading cryptocurrencies are beginning to show signs of weakness following these breakdowns, suggesting the potential for a deeper correction in the days ahead.
Bitcoin shows early signs of bearish momentum
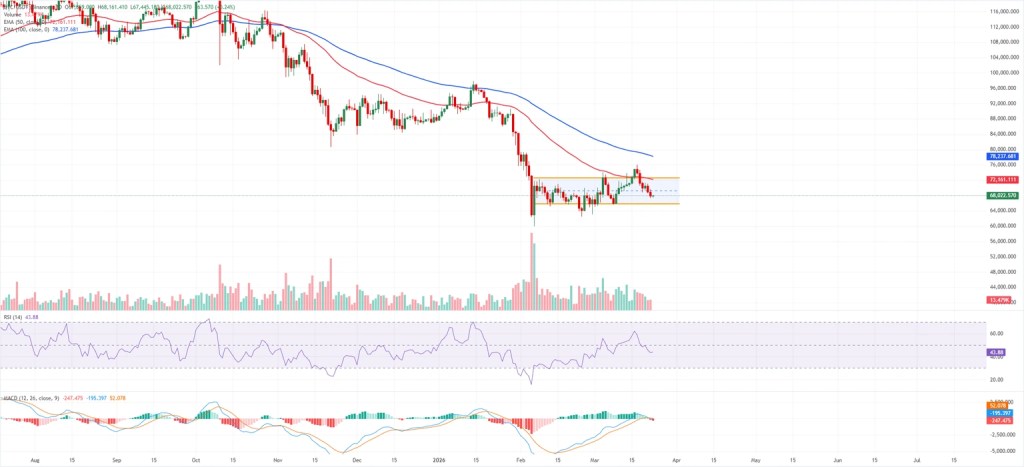
Bitcoin is trading around $68,000 on Monday, with short-term sentiment tilting slightly bearish. The price continues to stay below the upper boundary of its channel near $72,600 while finding support around $65,900, indicating that sellers remain active during rallies within the current downward structure. Additionally, daily closes are still well below the 50-day and 100-day Exponential Moving Averages (EMAs), which lie between $72,000 and $78,000, reinforcing the view that the market is undergoing a corrective phase within a broader range.
Momentum has weakened, with the Relative Strength Index (RSI) on the daily chart dropping toward the mid-40s, while the Moving Average Convergence Divergence (MACD) remains below its signal line and continues drifting toward the zero level—both signaling fading bullish strength after the rejection above $72,000.
On the upside, immediate resistance is seen near the recent swing high around $69,000, followed by the channel ceiling just below $72,600. This area is further reinforced by the 50-day Exponential Moving Average, creating a strong supply zone. A daily close above this confluence would be required to neutralize the current bearish bias and pave the way for a move toward $73,500 and higher.
To the downside, key support lies near the channel base around $65,900. A breakdown below this level could open the door to $64,000 and then $62,500, where previous demand zones and the lower boundary of the recent range may draw in buyers.
Ethereum deepens its pullback after failing to hold key support
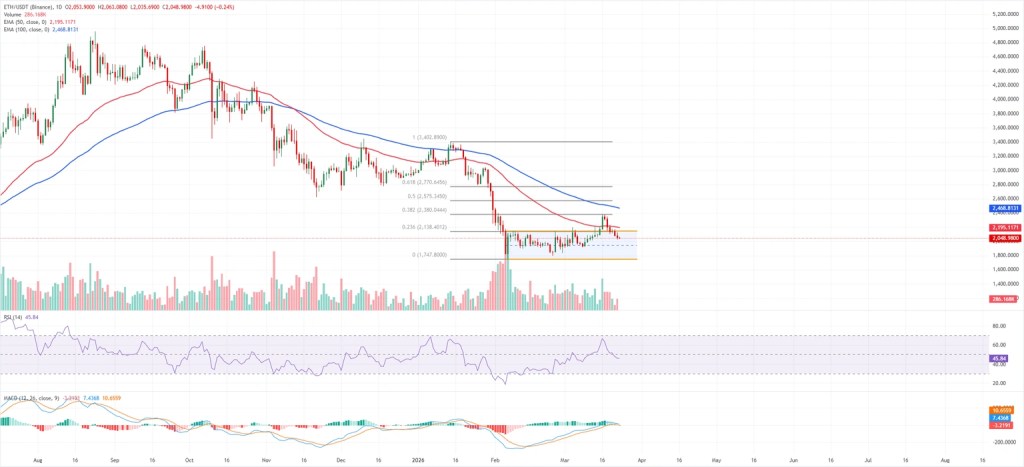
Ethereum is trading around $2,048 on Monday, with the short-term outlook remaining mildly bearish as price stays below the channel ceiling near $2,148. The asset continues to trade well under the 50-day and 100-day EMAs, positioned around $2,200 and $2,470, highlighting persistent downside pressure after the recent rebound failed to hold above $2,100.
Momentum indicators point to further weakness. The Relative Strength Index (RSI) on the daily chart has eased to around 45, reflecting fading bullish strength, while the Moving Average Convergence Divergence (MACD) has crossed below its signal line and turned negative, signaling increasing selling pressure.
On the upside, initial resistance is located near the channel top around $2,148, reinforced by the 23.6% Fibonacci retracement of the move from $1,747.80 to $3,402.89 at $2,138. A decisive daily close above this zone could open the path toward the 38.2% retracement at $2,380, which aligns with the 50-day EMA and would help weaken the current bearish structure.
On the downside, immediate support is seen at the $2,000 level, followed by the channel base and a key horizontal floor near $1,747. A break below this region would likely accelerate the broader decline, paving the way for a deeper move within the prevailing downtrend.
XRP records seven straight bearish sessions
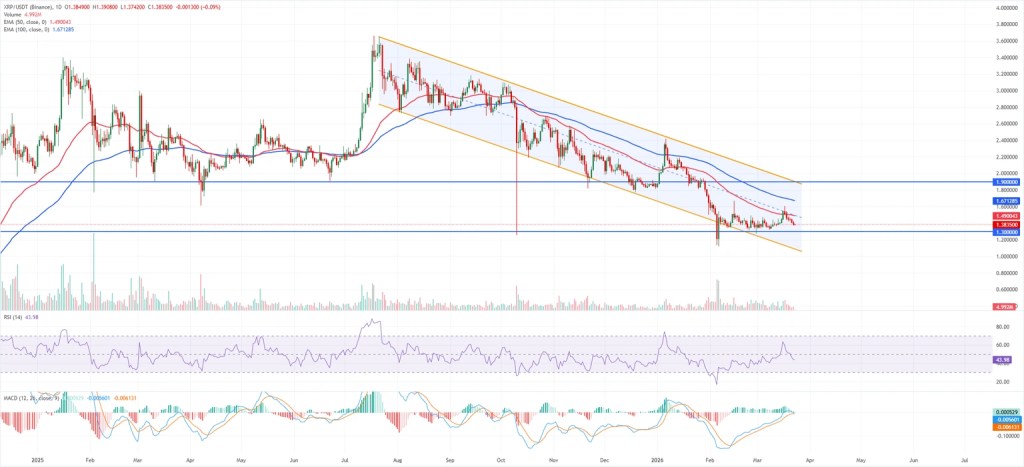
XRP is trading below $1.39 as of Monday, continuing to move within a descending parallel channel that originated from the $2.83 peak. The price remains closer to the lower boundary near $1.09 than the upper limit around $1.90, keeping the broader outlook firmly bearish. Daily closes also sit well beneath the 50-day and 100-day EMAs, positioned between $1.49 and $1.67, reinforcing persistent downside pressure as rebounds struggle to test these dynamic resistance levels.
Momentum indicators reflect weakening strength. The Relative Strength Index (RSI) has slipped to around 43, staying below the midpoint and signaling subdued bullish momentum after the recent attempt to rise toward $1.54. Meanwhile, the Moving Average Convergence Divergence (MACD) is trending toward the zero line, with the MACD line converging toward its signal line and a shrinking positive histogram—both suggesting fading upside momentum within the broader downtrend.
On the downside, initial support is located near $1.30, a prior horizontal level that acts as the last meaningful cushion before the channel floor around $1.09. A break below this area could trigger a deeper decline within the prevailing bearish structure.
To the upside, immediate resistance appears near the recent swing high around $1.45, followed by the psychological $1.50 level, where selling pressure aligns with the descending 50-day EMA. A daily close above this zone would be necessary to target the channel’s upper boundary near $1.90, which also coincides with a key long-term resistance level and would be critical in reversing the medium-term bearish bias.
Sources: Manish Chhetri

Leave a comment