Mid-tier and junior gold mining companies have largely completed reporting what has turned out to be the strongest quarter the industry has ever seen. These smaller producers—often considered the sector’s sweet spot for upside—once again broke numerous records and clearly outperformed the large major miners. In the latest quarter, mid-tier companies posted exceptional figures across the board, including revenue, net earnings, profit per ounce, operating cash flow, and cash reserves. Remarkably, early indicators suggest the current quarter could deliver even stronger results.
The main benchmark tracking mid-tier gold miners is the VanEck Junior Gold Miners ETF (GDXJ). With about $10.6 billion in assets under management as of midweek, it remains the second-largest gold-mining ETF after its counterpart, the VanEck Gold Miners ETF (GDX). While GDX is dominated by the largest mining companies, there is considerable overlap between the two funds. Despite its name, GDXJ today functions primarily as a mid-tier gold miner ETF, with true junior miners representing only a smaller share of the portfolio.
Gold mining companies are typically categorized by annual production levels measured in ounces. Junior miners generally produce less than 300,000 ounces per year, mid-tier producers generate between 300,000 and 1 million ounces, major miners exceed 1 million ounces, and the largest “super-major” companies produce more than 2 million ounces annually. On a quarterly basis, these thresholds translate to roughly under 75,000 ounces for juniors, 75,000–250,000 for mid-tiers, more than 250,000 for majors, and over 500,000 for super-majors. Among the 25 largest holdings of GDXJ, only four actually qualify as true juniors today.
In the referenced analysis table, quarterly production figures are highlighted in blue. Junior miners are defined not only by producing under 75,000 ounces per quarter but also by generating more than half of their revenue from gold production itself. This classification excludes streaming and royalty companies—firms that provide upfront capital for mine development in exchange for future production—as well as primary silver miners that produce gold as a byproduct. Even so, mid-tier miners often present more attractive investment opportunities than juniors.
The mid-tier companies dominating GDXJ offer a compelling combination of diversified production, strong growth potential, and relatively smaller market capitalizations, which create room for outsized gains. Compared with junior miners, they generally carry less operational risk, yet they tend to deliver greater upside during gold rallies than the large majors.
For many years, these mid-tier miners were largely overlooked by investors, but attention toward the group has grown recently. In 2025, leading up to gold’s mid-October peak, GDXJ surged an impressive 161.3% year-to-date. However, the sector experienced a sharp correction early in the fourth quarter as gold prices briefly retreated, sending GDXJ down 21.6% within just a few weeks. Once gold rebounded, the ETF quickly recovered, climbing another 38.9% by late December.
Interestingly, unlike GDX, GDXJ’s share price did not approach its historical highs during the quarter. The ETF originally peaked at $146.20 back in December 2010 and did not finally surpass that level until late January 2026, when gold reached an extremely overbought condition. The average price of GDXJ during Q4 2025 was about $103.33—still well below the $127.84 average recorded in Q4 2010. Even the strong rally earlier in the quarter did not push valuations to historic extremes.
At one point in early October, GDXJ traded 69.5% above its 200-day moving average, an unusually stretched level. However, this was still below the even more extreme 84.2% deviation reached in mid-2016. Over the course of gold’s massive 139.1% bull market from October 2023 to October 2025, GDXJ rose about 262.3%. That equates to only about 1.9 times leverage relative to gold’s gains, which is far below the historical pattern where smaller miners often amplify gold’s performance by three to four times.
Following a rapid correction, gold’s bull market resumed and continued climbing into late January 2026, ultimately reaching a total gain of roughly 196.4%. During that period, GDXJ increased about 387.9%, representing only around 2.0 times leverage to the metal. In other words, despite strong absolute returns, smaller gold miners have still underperformed relative to gold itself. This suggests that their share prices could still rise substantially as more investors begin to recognize the sector’s strong fundamentals.
For 39 consecutive quarters, the analyst behind this research has examined the operational and financial results of the 25 largest companies within GDXJ. These firms—mostly mid-tier producers—now account for roughly 69% of the ETF’s total weighting. While reviewing quarterly reports requires extensive effort, it provides valuable insight into the underlying fundamentals of smaller gold miners and helps cut through the often misleading market sentiment surrounding the sector.
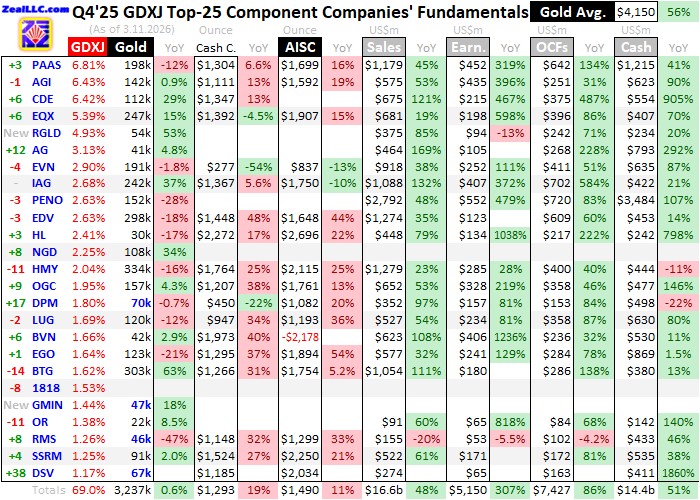
The accompanying table summarizes key operational and financial metrics for the top 25 GDXJ holdings in Q4 2025. The stock symbols listed are not all U.S. listings and are preceded by their ranking changes within the ETF over the past year. These shifts largely reflect changes in market capitalization, highlighting which companies have outperformed or lagged since Q4 2024. Each company’s current weighting within GDXJ is also provided.
The table then details each miner’s gold production during Q4 2025, measured in ounces, along with year-over-year changes compared with Q4 2024. Production remains the lifeblood of the mining industry, and investors typically place the greatest emphasis on companies that can consistently grow output. Cost metrics follow, including cash costs and all-in sustaining costs per ounce, both of which provide insight into the profitability of each operation.
Additional financial data—such as quarterly revenue, net income, operating cash flow, and total cash holdings—comes directly from regulatory filings. Some data points may appear blank if companies had not yet reported those figures at the time of analysis. Year-over-year comparisons are also excluded in cases where they would be misleading, such as when figures shift from negative to positive or vice versa.
With gold’s average quarterly price soaring 56% year-over-year to a record $4,150 in Q4, the results for smaller gold miners were bound to be exceptional. Indeed, the industry delivered the strongest performance ever recorded. And if that were not impressive enough, preliminary data suggests the current quarter is shaping up to be even stronger. Mid-tier and junior miners clearly deserve far greater attention from investors than they have received so far.
Last week, a similar study was conducted on the Q4 results of the 25 largest gold miners within the VanEck Gold Miners ETF (GDX). These results serve as an important benchmark when comparing the performance of the 25 largest mid-tier miners in the VanEck Junior Gold Miners ETF (GDXJ). Over many quarters and years, smaller gold miners have consistently delivered stronger fundamental performance than their larger counterparts. Given that mid-tier companies outperform majors across most key metrics, there is little strategic rationale for prioritizing investment in major miners. In theory, GDXJ should attract significantly more capital than GDX.
However, as of midweek, GDXJ’s total assets were only about one-third the size of GDX. As more investors and traders examine the sector closely and recognize the superior operational and market performance of smaller gold miners, this imbalance may gradually shift. Mid-tier miners deserve stronger capital inflows than the majors, which could push their share prices higher at a faster pace. The Q4 comparison between GDXJ and GDX once again reinforced this argument.
During the fourth quarter, the top 25 GDXJ miners collectively produced approximately 3.237 million ounces of gold, representing a modest 0.6% increase year-over-year. While this growth was slightly below the global mined-gold output increase of 1.1% reported by the World Gold Council, it still significantly outperformed the production trend among the GDX top 25 majors. Those large miners experienced a steep 12% year-over-year decline in output. After adjusting for a structural change in the ETF composition, the majors’ production decline was closer to 5.6%, but this still lagged mid-tier performance.
Fundamentally, major and mid-tier gold miners operate under different dynamics. Large mining companies often struggle with declining production because of depletion at their massive operating scale. Mid-tier companies, by contrast, usually operate smaller portfolios of mines—often between one and four. This means that expansions or new projects can have a meaningful impact on their overall production levels. As a result, mid-tier companies are generally better positioned to offset depletion and maintain steady production growth.
Production growth is critical in the gold mining industry because it generates the cash flow needed to expand existing operations, develop new mines, or acquire producing assets. These investments ultimately support higher stock valuations. Interestingly, mid-tier miners frequently maintain lower mining costs than large producers, despite the supposed economies of scale enjoyed by major companies. Lower costs relative to output translate into higher profitability, which in turn can drive stronger share-price appreciation.
Another factor supporting mid-tier stock performance is their smaller market capitalization. The average market cap of the 25 largest GDX companies stood at roughly $38.8 billion last week—around 2.8 times higher than the average $13.9 billion market cap of the top 25 GDXJ miners. The five largest holdings in GDX averaged $98.3 billion each, compared with $20.3 billion for GDXJ’s top five. Companies with smaller market capitalizations typically require less capital inflow to drive significant stock-price movement, giving them greater upside potential.
Analyzing fourth-quarter results can be challenging because many mining companies delay reporting until their year-end annual reports are finalized. Some firms within the leading gold-miner ETFs do not release their Q4 results until mid-to-late March. One such company is Harmony Gold Mining Company from South Africa, which only reported its results this week. Harmony is notable because it appears among the top 25 holdings in both GDX and GDXJ.
Because Harmony is a large major producer, its results are important for comparison. Its late reporting meant it was excluded from the earlier GDX analysis but has now been incorporated into updated comparisons. Including Harmony slightly changes the previously reported GDX figures. Given its large size, the company arguably should not have been included in the GDXJ portfolio in the first place.
In general, unit mining costs tend to decline as production volumes increase. This is because many operational expenses for gold mines are fixed during the planning and construction phases, when processing plant capacities are determined. Infrastructure, equipment, and labor requirements remain relatively stable regardless of short-term production fluctuations.
The primary factor influencing quarterly production is the grade of the ore processed by the mining facilities. Ore grades can vary significantly even within the same deposit. Higher-grade ore produces more gold per ton, spreading fixed operating costs over more ounces and lowering per-unit costs. However, in addition to these fixed costs, gold mining also involves significant variable costs—many of which have been affected by the high inflation seen in recent years.
Cash costs remain the traditional metric for measuring mining expenses, covering the direct cash expenditures required to produce an ounce of gold. However, this measure does not include the capital investments required for exploration or mine construction. For that reason, cash costs should be viewed mainly as a minimum survival threshold, indicating the lowest gold price needed for mines to remain operational.
In Q4 2025, the average cash cost among the top 25 GDXJ miners surged 19.1% year-over-year to a record $1,293 per ounce. By comparison, the GDX top 25 majors experienced a smaller increase, with cash costs rising 7% to $1,238. One of the main drivers behind these increases was higher royalty payments, which rise alongside gold prices because they are typically calculated as a percentage of production value.
For example, Lundin Gold reported a 33.6% year-over-year increase in cash costs to $947 per ounce, partly due to higher royalty obligations and employee profit-sharing tied to record gold prices. Meanwhile, OceanaGold saw royalty payments across its operations increase sixfold in absolute terms compared with the same quarter the previous year.
A more comprehensive cost metric is the all-in sustaining cost (AISC), introduced by the World Gold Council in 2013. AISCs include cash costs along with sustaining capital expenditures and other operational expenses required to maintain current production levels. As such, they provide a clearer picture of true profitability.
Cash costs typically represent the largest portion of AISCs. In Q4 2025, they accounted for nearly seven-eighths of the average AISC among the top 25 GDXJ miners. As a result, rising royalty expenses pushed AISCs higher as well. During the quarter, the group’s average AISC rose 10.7% year-over-year to a record $1,490 per ounce. Even so, this still compared favorably with the GDX majors, whose AISCs climbed 16% to $1,687.
However, these averages were distorted by an extreme outlier. Peru’s Compañía de Minas Buenaventura reported a remarkable negative AISC of $2,178 per ounce. This unusual result stems from the company’s polymetallic production profile. While it reports results in gold-equivalent terms, its operations primarily produce other metals such as silver, copper, zinc, and lead. Gold accounted for only about 28% of its revenue in the quarter.
Because the company treats other metals as byproducts that offset gold-production costs, its gold AISCs can appear extremely low or even negative. Such anomalies have occurred repeatedly over the past nine quarters. Although Buenaventura was historically a top-25 holding in both GDX and GDXJ, it has recently fallen to 27th place in GDX as other companies have outperformed.
For consistency, all reported figures—including outliers—are included in the long-term dataset used in this research. Without Buenaventura’s unusual figures, the average AISC for the GDXJ top 25 would have been $1,719 per ounce in Q4, representing a much larger 27.7% year-over-year increase.
Other factors also influenced the cost averages. For instance, Hecla Mining reported exceptionally high AISCs of $2,696 per ounce, while New Gold did not release Q4 results due to its pending acquisition by Coeur Mining. In the previous quarter, New Gold had reported relatively low AISCs of around $966.
After decades of studying the gold-mining sector, the analyst considers “implied unit earnings” to be the most useful metric for evaluating the collective performance of mid-tier miners. This measure subtracts the average AISC from the average quarterly gold price, providing a clearer indicator of profitability than accounting earnings, which can be distorted by non-cash items.
In Q4 2025, the average gold price reached a record $4,150. Subtracting the $1,490 AISC yields implied profits of approximately $2,660 per ounce. This represents an extraordinary 102.4% increase year-over-year and the highest profitability ever recorded for either GDXJ or GDX miners.
This milestone extends a remarkable trend. Over the previous ten quarters, the GDXJ top 25 recorded year-over-year implied earnings growth of 106%, 133%, 63%, 63%, 71%, 95%, 91%, 79%, 82%, and 102%. Few sectors in global equity markets have experienced such sustained profit growth. With such performance, mid-tier gold miners arguably deserve to be among the most sought-after sectors for investors.
The trend may continue. With more than three-quarters of Q1 2026 completed, gold has averaged roughly $4,931 so far. If this level holds, it would represent another extraordinary year-over-year increase of about 72%. This rise would likely continue to outpace cost inflation among mid-tier miners.
Based on guidance, the average 2026 AISC for the GDXJ top 25 is projected to reach about $1,857 per ounce. Excluding unusually high estimates—such as the $3,075 forecast from Hecla Mining—the average falls closer to $1,776. Using a conservative estimate of $1,850, implied profits in Q1 2026 could approach another record near $3,080 per ounce, representing roughly 107% year-over-year growth.
Gold stocks also benefit from seasonal patterns. Historically, gold experiences three major rallies during the year—autumn, winter, and spring. The winter rally tends to be the strongest for gold itself, while the spring rally—from mid-March through early June—often delivers the strongest outperformance for gold-mining stocks. That seasonal window coincides with the release of Q1 earnings, which could further boost investor enthusiasm.
Sometimes accounting results differ from implied profitability due to non-cash adjustments. However, that was not the case in Q4 2025. The top 25 GDXJ miners reported total revenue of $16.6 billion, up 48.1% year-over-year and marking a new industry record. Net earnings surged even more dramatically, jumping 307% to a record $5.15 billion.
After adjusting for unusual items such as asset impairments or valuation changes, total earnings remained almost unchanged at $5.16 billion—still representing a massive 252% increase compared with Q4 2024.
Operating cash flow also surged, rising 86.3% year-over-year to a record $7.43 billion. This influx of cash boosted the combined cash reserves of the GDXJ top 25 to another all-time high of $14.4 billion, up 50.8% from the previous year.
While net profits influence valuations, operating cash flow and cash reserves directly support future production growth. Companies with strong balance sheets are better positioned to expand existing mines, build new operations, or acquire producing assets. These investments could accelerate production growth among mid-tier miners in the coming years.
The main risk to this bullish outlook is gold itself. Gold-mining stocks typically amplify movements in the metal by three to four times. When gold becomes extremely overbought, corrections can be sharp. Earlier this year, gold reached one of its most extreme overbought conditions since the early 1980s before experiencing a brief correction.
Although prices have since stabilized at elevated levels, historical precedent suggests that a significant pullback could still occur. If gold were to decline sharply, mining stocks would likely fall even more dramatically despite their strong fundamentals. Such declines, however, could present attractive buying opportunities.
In summary, mid-tier and junior gold miners have just reported the strongest quarter in the history of the industry. Record gold prices fueled unprecedented revenues, profits, cash flows, and balance-sheet strength. This marks the tenth consecutive quarter of extraordinary earnings growth for the sector.
With gold prices still trending toward another record quarter, the next round of results may be even stronger. These improving fundamentals could attract additional investment capital into mid-tier miners, driving further stock gains—unless a sharp gold correction occurs first, in which case mining stocks would likely magnify the downside.
Sources: Adam Hamilton

Leave a comment