Key Takeaways
Heightened geopolitical tensions triggered a sharp 7–8% rally in WTI and Brent crude at the start of March. A confirmed technical breakout, along with a rising 200-day moving average, indicates the broader uptrend remains intact despite near-term resistance levels. Energy equities continue to outperform the wider market as volatility intensifies across commodities.
After Venezuela, attention has now shifted to Iran. Weekend strikes led by the U.S. and Israel on the oil-producing nation sent crude prices surging to open March. WTI climbed 7% to $72, while Brent advanced 8% to $79 per barrel.
Notably, the Brent–WTI spread widened beyond $7 — up from roughly $3 during last year’s more stable geopolitical environment — underscoring growing geopolitical risk.
Oil’s Rally Isn’t Exactly a Surprise
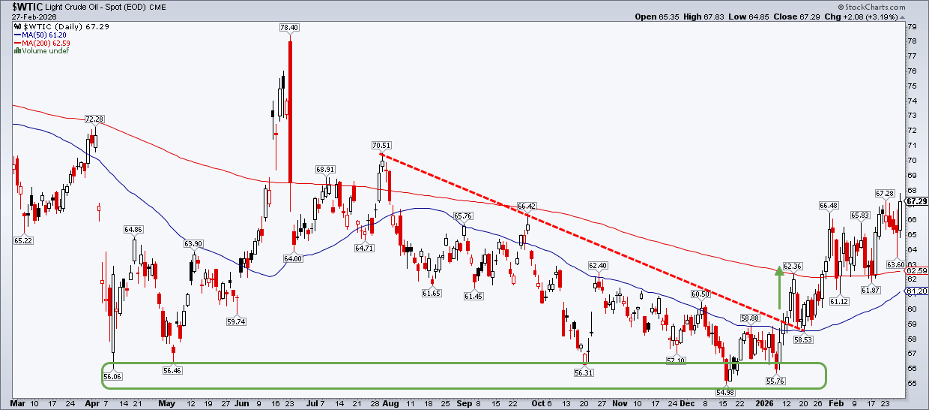
Crude’s advance didn’t begin overnight. WTI carved out a bottom in mid-December just below $55, marking a multi-year low as President Trump pushed for lower domestic energy prices. A decisive move above the 50-day moving average in January — followed by a breakout above the 200-day average weeks later — signaled that bulls were taking control. Now, $WTIC is trading at its strongest level since the U.S. struck key Iranian nuclear facilities in June 2025.
The pressing question now is: Where does oil head next?
Let the Charts Do the Talking
As always, it helps to swap the macro lens for a technical one. Earlier this year, crude broke out of a downtrend formation — a clear signal to consider gaining exposure, whether through an oil ETF like the United States Oil Fund or by overweighting energy stocks.
At the time, the mid-$50 range was emerging as a critical support zone. Even amid bearish rhetoric from the White House and persistent talk of a supply glut, WTI continued grinding higher.
Near-Term Selling Pressure?
Taking a broader view, crude may now be running into resistance following a powerful 30% surge in less than three months. The rolling front-month contract spiked into the mid-$70s on Sunday night before easing back toward the low $70s — establishing a fresh battleground for traders.
Adding to the tension, the CBOE Oil Volatility Index has jumped sharply, signaling that a decisive breakout — or breakdown — could unfold quickly. Technically, WTI has also tagged a descending resistance line drawn from the Q3 2023 peak, doing so after one of its strongest single-day advances in the past five years.
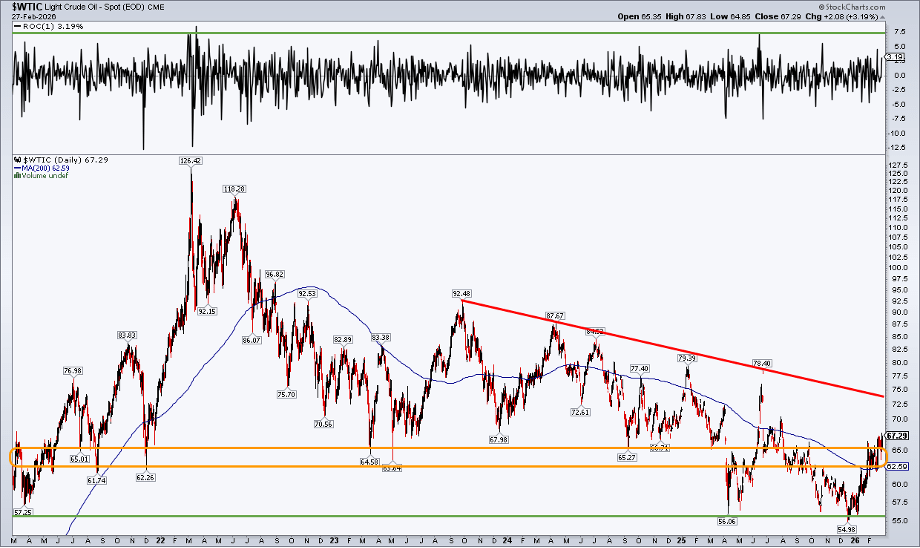
Also note the upward slope of the 200-day moving average — a sign that bulls remain in control of the broader trend. While the current advance lacks the explosive momentum seen five years ago, when Brent surged to $135, there are still constructive elements supporting the bullish case. With the 200-day average gradually climbing and seasonally favorable calendar trends ahead, oil bulls have several tailwinds working in their favor.
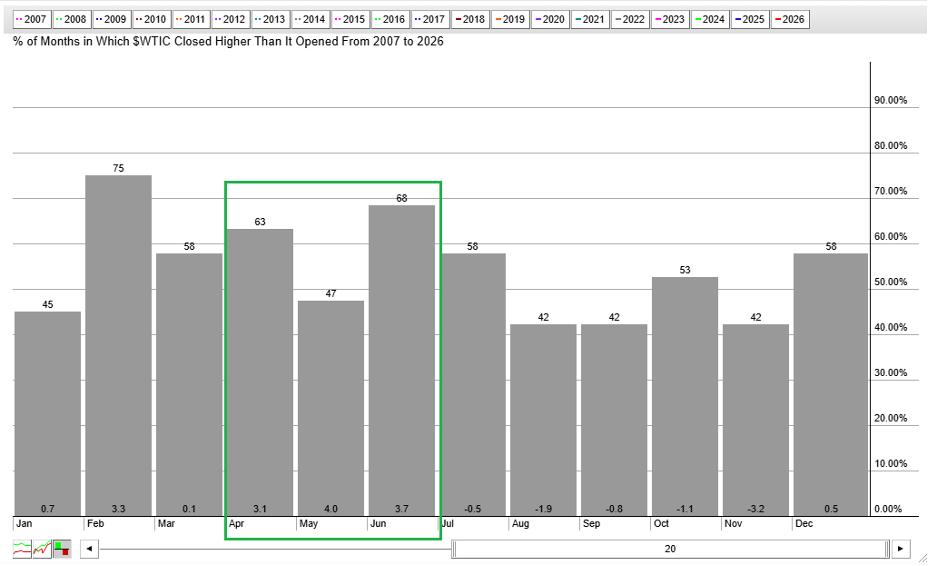
Muted March, Lively April–June?
StockCharts’ seasonality data shows that while March has delivered mixed results over the past 20 years, the second quarter has produced consistently strong returns. In fact, the April-to-June period stands out as the best-performing three-month stretch of the year.
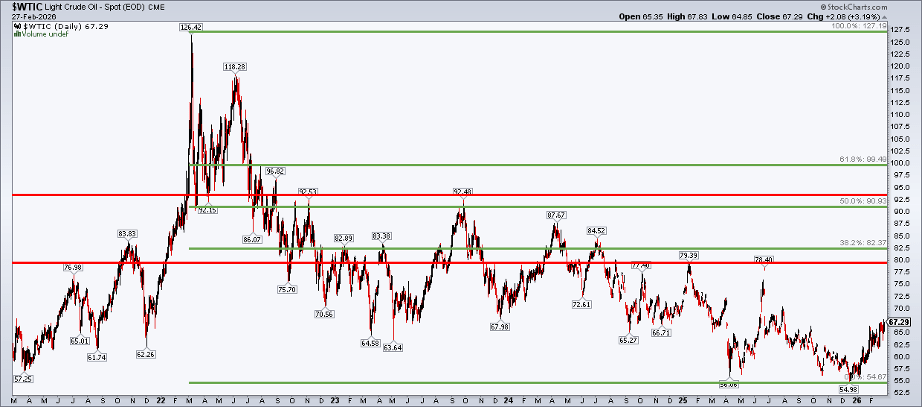
On the chart below, a push through the low $70s would suggest the next upside target lies in the $77–$80 area, where prices peaked between Q3 2024 and last June. Beyond that, a move toward $92–$93 is not out of the question.
For Fibonacci watchers, the 38.2% retracement of the March 2022 high to the December 2025 low comes into focus slightly above $82. Meanwhile, the 61.8% retracement level sits just shy of the $100 mark.
XOM & XLE Flash Clear Bullish Signals
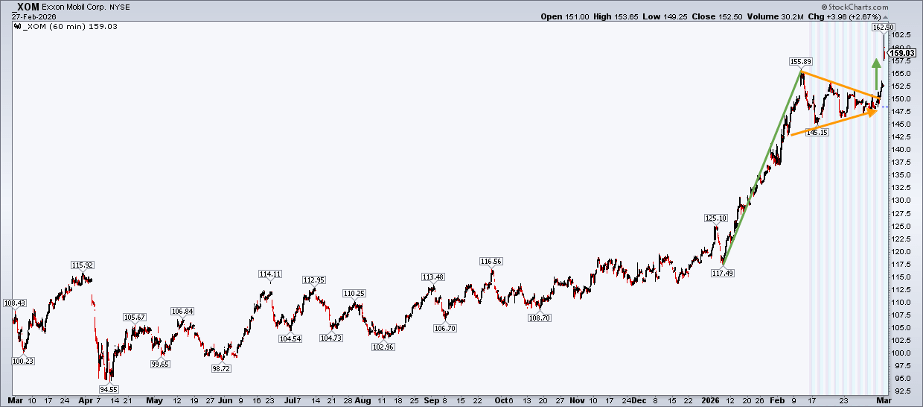
Another way to capture both relative strength and absolute momentum in the energy complex is through energy equities. My preferred name there is Exxon Mobil (NYSE: XOM). Back in December, I highlighted $155 as an achievable target based on developing chart formations. The stock reached that level swiftly, peaking near $157 before retracing to around $145. Ahead of the weekend’s geopolitical flare-up, a daily bull flag appeared to be resolving in favor of the bulls.
Although not flawless, the “Extended Hours” feature on StockCharts SharpCharts helps assess more detailed after-hours and pre-market price action. That broader view shows how a pattern of lower highs and higher lows paved the way for a breakout within a larger uptrend. On Monday, XOM gapped sharply from $152.50 to $160.
A fresh measured-move target of $188 is now in play, derived from the January–February advance projected from the $150 consolidation breakout. That said, a price gap remains just above $150, and it could be revisited if West Texas Intermediate stalls near the previously mentioned downtrend resistance.
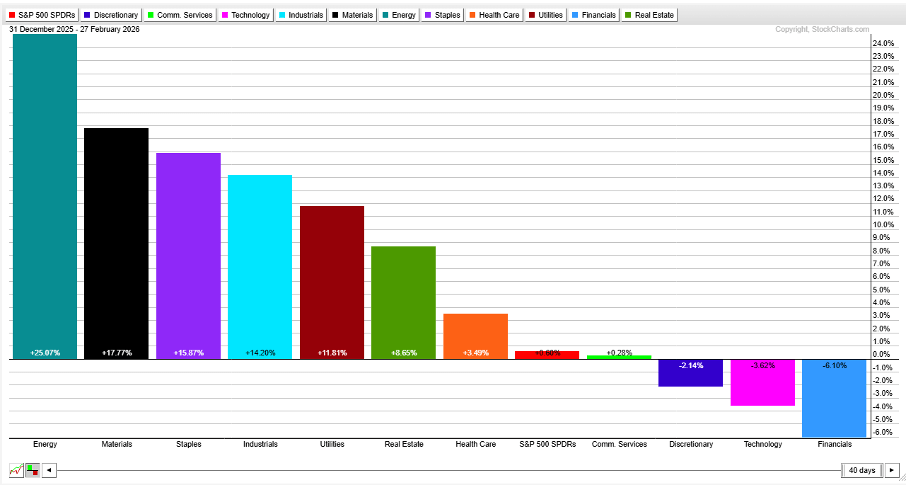
More broadly, Energy has emerged as the clear leader among the 11 S&P 500 sectors, outperforming by a wide margin. The group was up 24.4% year-to-date through February.
The Energy Select Sector SPDR Fund surged 25% in the first two months of the year, marking its strongest consecutive two-month performance since October–November 2022, when it rebounded sharply off the bear market lows.
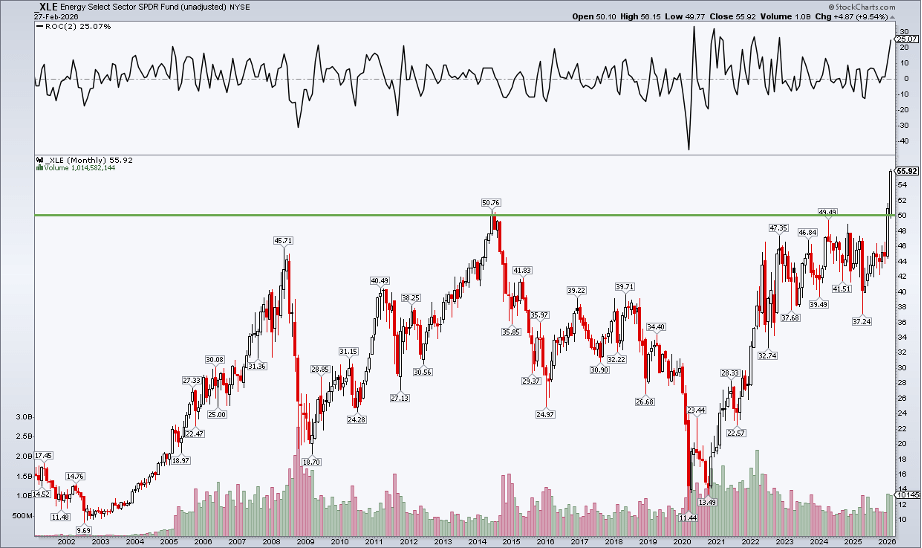
Like its largest holding, Exxon Mobil, the bulls seem firmly in control of the Energy Select Sector SPDR Fund. The monthly chart suggests that once the $50–$51 resistance zone was cleared, momentum accelerated decisively. A long-term objective in the low $90s appears achievable, measured by the magnitude of the 2014–2020 decline, the rebound to $50, and the early-2026 breakout to fresh highs.
Depending on how March plays out, XLE could be on track for its strongest quarterly gain ever.
The Bottom Line
Traders were fixated on futures screens at 6 p.m. ET Sunday, as Brent Crude surged 13% on the open and West Texas Intermediate briefly climbed toward $75. Early profit-taking tempered the initial spike, yet volatility across the energy complex remains elevated. While U.S. crude is running into near-term resistance, longer-term charts continue to show constructive strength in energy stocks.
Sources: Mike Zaccardi

Leave a comment