It’s difficult to get too excited about today’s CPI report. Because the data entirely predates the Iran war, it does not capture the recent surge in energy prices that could make next month’s inflation reading far more dramatic. Normally, this might be considered the last relatively “clean” inflation print before those effects appear. However, the data is not truly clean either, as lingering distortions from earlier shutdowns are still influencing the figures.
Those lingering effects may become more visible in April’s report, when rent data could show a temporary spike. This is expected because the October owners’ equivalent rent (OER) sample—assumed to have contained zero increases—will drop out of the calculation, potentially lifting the shelter component for one month. By that time, inflation data will also begin to reflect the impact of the Iran conflict. As a result, the next couple of months could bring more volatile inflation readings.
For February, expectations were roughly +0.26% for headline inflation and +0.24% for core inflation. That pace implies an annual rate close to 3%—still above the Federal Reserve’s target but not dramatically so. However, inflation had already been showing signs of firming even before the geopolitical tensions in the Middle East intensified, raising questions about how markets and policymakers will interpret the latest data.
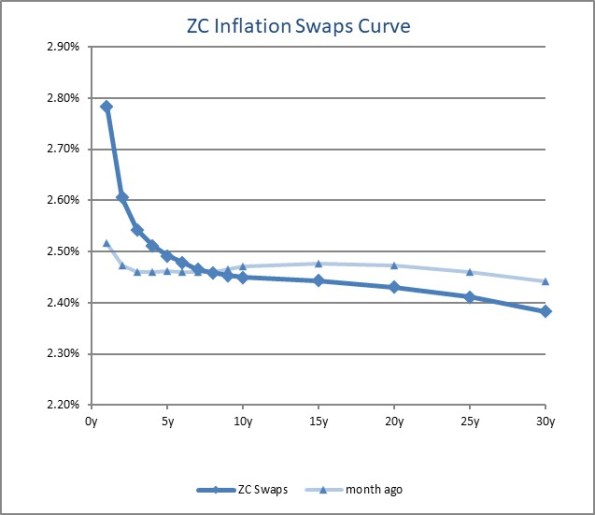
The U.S. CPI swaps curve already appears to be factoring in the effects of the conflict. Unsurprisingly, it is inverted, reflecting expectations of higher inflation in the near term due to energy prices. What is more unusual is that longer-term inflation expectations remain lower. While that might initially seem odd, it also serves as a useful reminder that markets may expect the energy shock to be temporary rather than a lasting source of inflation pressure.
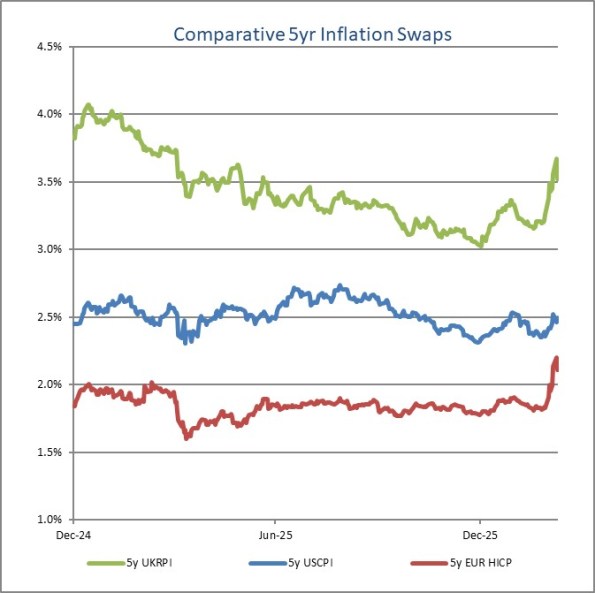
Another interesting point can be seen in the chart of five-year inflation swaps across several regions. Despite the sharp swings in energy prices, U.S. five-year CPI swaps have moved relatively little compared with other markets. This is partly because the U.S. economy is generally less sensitive to oil price fluctuations than many other countries. In addition, the U.S. dollar has often moved in the same direction as oil prices, which can soften the direct pass-through of energy costs into domestic inflation.
Even so, the move still appears notable. Given that this is a five-year tenor, it is somewhat surprising to see such a reaction when most of the current volatility stems from spot energy prices rather than longer-term inflation pressures.
With those preliminaries in mind, the actual data is worth examining. Forecasts proved fairly accurate, with headline CPI rising 0.267%, while core CPI increased 0.216%, both broadly in line with expectations.
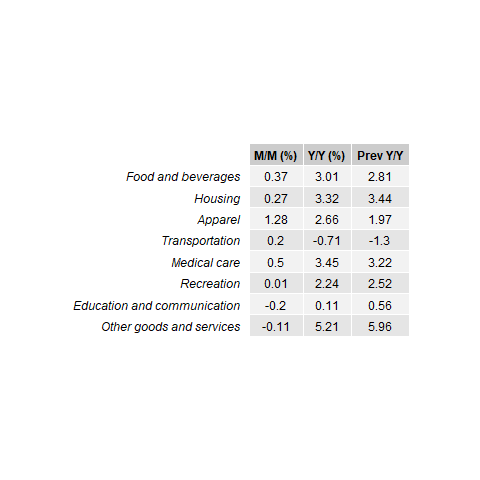
The spike in apparel prices is somewhat unusual, although such jumps do occur occasionally and the category represents a relatively small share of the overall CPI basket. The increase in medical care costs—driven largely by hospital services—was somewhat concerning. On the other hand, shelter inflation came in softer, which helped offset some of the upward pressure from other components.
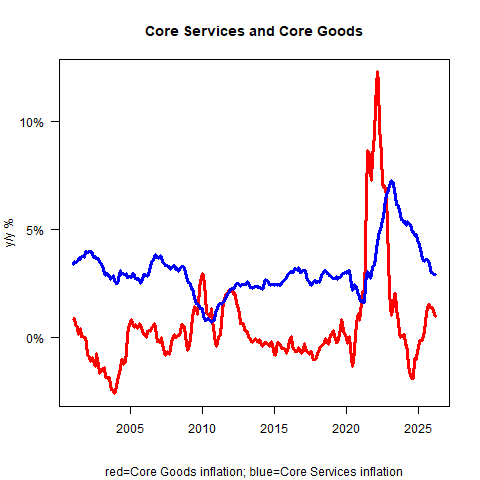
Both core services and core goods inflation eased on a year-over-year basis. Core goods inflation is now running at about +1% y/y. While a continued downward turn had been widely expected, the key question is where it ultimately stabilizes—around +0.5% or -0.5%. My view is that it is more likely to settle near +0.5%. Even so, the latest trend is encouraging news for the broader inflation outlook.
The main surprise in the report came from primary rents. While Owners’ Equivalent Rent (OER) rose 0.22% month-on-month, roughly in line with the previous month and continuing to trend lower on a year-over-year basis, Rent of Primary Residence increased by only 0.13% month-on-month.
This softer reading was notable, although the year-over-year trend in OER may shift in the coming months as the October sample—when increases were effectively assumed to be zero—drops out of the calculation.
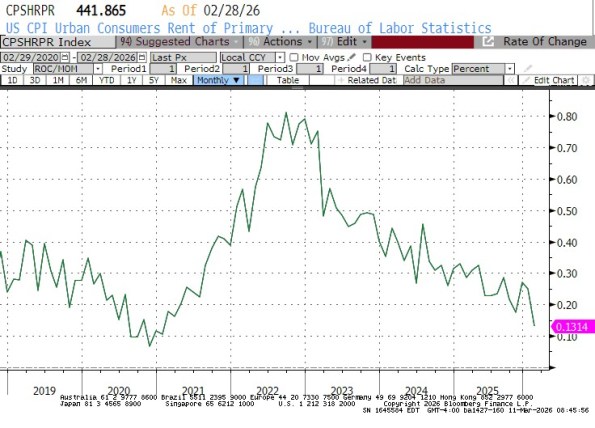
The broader trend in rents is clearly moving lower, but the sharp drop is still surprising—especially given the ongoing cost pressures faced by landlords. It is possible that the decline will partially reverse next month. One likely explanation could be compositional shifts in the data. For example, rents may be softening in large cities as reverse immigration flows ease pressure on housing supply, while outmigration from places like New York City could also be influencing the figures. A deeper breakdown of the data would be needed to confirm these effects.
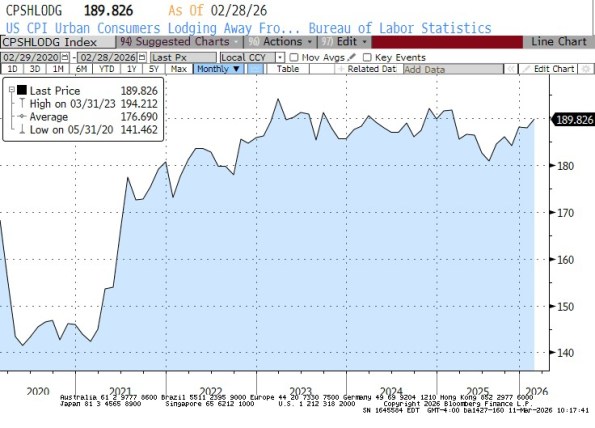
Meanwhile, the Lodging Away from Home category rose 1%. This component has been recovering after a dip last year, although hotel prices remain below the post-pandemic surge that followed COVID-19, when pent-up travel demand pushed rates sharply higher. Given the ongoing recovery in travel demand, there is a reasonable chance that hotel prices could reach new highs in 2026.
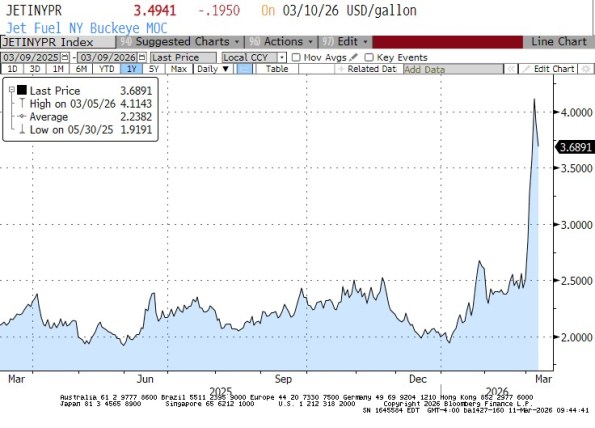
Airfares also increased, rising 1.4% month-on-month. This is worth watching closely. As energy prices climb, airlines often pass higher fuel costs on to passengers. While February’s data does not yet reflect the latest surge in energy prices, persistently high jet fuel costs could push airfares higher in the coming months.
If that happens, it may show up as stronger core inflation, even though the underlying driver would primarily be energy-related rather than a broader rise in service-sector prices.
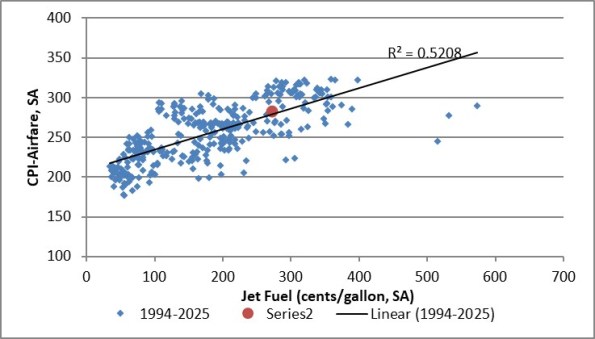
The red dot reflects the end-of-February reading. Since then, jet fuel prices have been highly volatile. They are currently around $3.49, after briefly reaching $4.11 just a few days ago. Such swings in fuel costs typically feed through to airline pricing with a short lag, meaning the impact is likely to appear in next month’s airfare data.
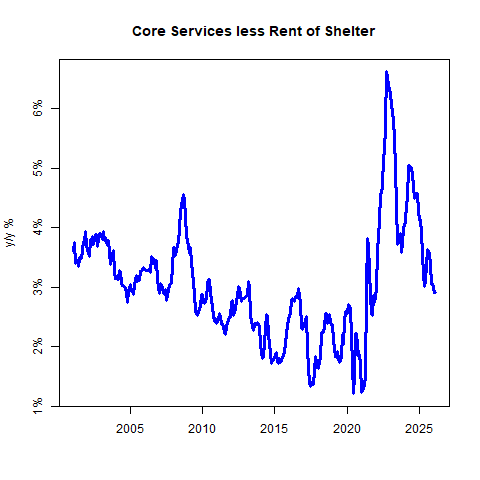
Turning to “supercore” inflation—core services excluding shelter—**the pace eased compared with the previous month. Last month, supercore rose 0.59% month-on-month, while this month it increased a more moderate 0.35% m/m.
On a year-over-year basis, core services excluding rents currently stand at 2.94%. However, that figure is likely to jump next month due to base effects. The comparison will drop the unusually weak reading from last March, when several travel-related categories posted sharp declines: airfares fell 5.27%, lodging away from home dropped 3.54%, and car and truck rentals declined 2.66%.
As those unusually weak numbers roll out of the calculation, the year-over-year supercore measure will likely rise—even if the month-to-month readings remain relatively modest. And given recent developments in travel and energy costs, those monthly figures may not stay soft for long.
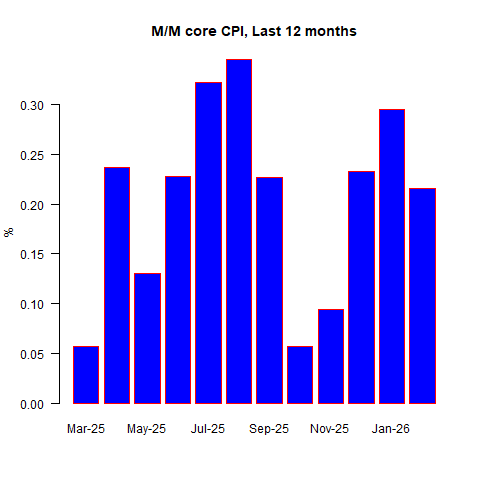
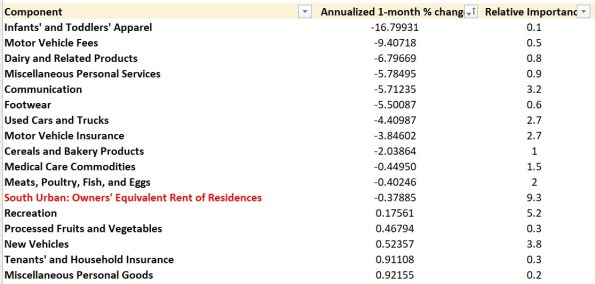
The overall distribution of price changes this month is also notable. Several categories recorded increases of less than 1% on an annualized month-to-month basis, although most of them were only slightly below that threshold.
It is also worth noting that the figures shown in red reflect adjustments based on my own estimate of seasonal patterns, rather than the methodology used by the Federal Reserve Bank of Cleveland.
There were also many categories in the upper tail of the distribution, although the upper tail appears longer than the lower one. Of course, Median CPI—a measure published by the Federal Reserve Bank of Cleveland—doesn’t depend on how long those tails are. That is precisely the point of using a median measure.
While I’m not fully confident in my estimate this month, I expect the median reading to come in relatively soft, likely below 0.2%.
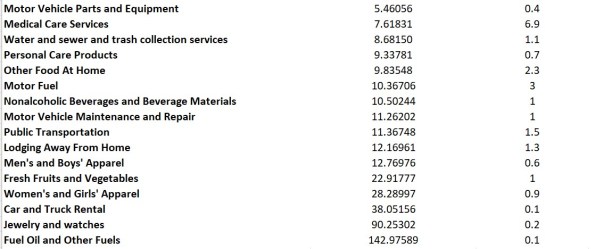
Typically, median CPI tends to run comfortably above the mean CPI because for many years inflation has existed in a disinflationary regime, where price-change distributions were skewed to the downside—meaning the tails were longer on the negative side. In such environments, the median usually sits above the mean. This month, however, that pattern may not hold. During inflationary cycles, the distribution often flips, with longer tails on the upside, causing the mean to exceed the median. That said, one month of data is not enough to draw firm conclusions.
Regarding monetary policy, the February CPI figures may not carry much weight given the developments in March. Markets appear to be misinterpreting the recent energy price spike, treating it as an inflationary impulse that complicates the Federal Reserve’s policy path amid soft employment data. In reality, energy-driven increases in CPI are not typically the kind of inflation central banks try to suppress through tighter policy. Energy prices tend to be mean-reverting and are often anti-growth, meaning they slow economic activity.
Earlier observations about the CPI swaps curve—which is inverted and shows lower longer-term inflation expectations than a month ago—likely reflect markets beginning to price in a possible recession. While recessions themselves are not inherently disinflationary, markets often treat them that way.
If the Fed were to tighten policy in response to an energy-driven spike in inflation, it could worsen an economic slowdown. That dynamic contributed to several policy mistakes during the 1970s inflation crisis, something modern policymakers are well aware of. As a result, an energy shock combined with weak employment data is more likely to push the Fed toward easing rather than tightening.
In that sense, the current situation would not qualify as classic stagflation if core inflation continues to moderate. It may resemble “stag”—sluggish growth—but a higher headline CPI driven by energy does not necessarily signal persistent inflation if core and median measures remain contained.
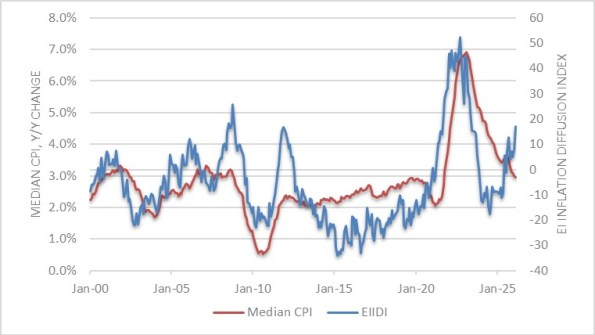
That said, there are reasons for caution. Core and median inflation may not remain subdued indefinitely. There are already signs they could move back toward the mid-to-high 3% range, and indicators such as the Enduring Investments Inflation Diffusion Index are trending higher, suggesting broader price pressures could gradually re-emerge.
(That said, the Federal Reserve does not necessarily share this view. We may eventually find ourselves discussing stagflation in a more literal sense, but many observers could still be misled by spikes in headline inflation.)
Another key implication is that the February data will likely have limited influence on policy decisions. Given the events that unfolded in March, the CPI figures for February are already somewhat outdated. Since the report came in largely in line with expectations, markets are unlikely to dwell on it for long.
In short, February’s inflation print will probably be forgotten quickly. Attention will soon shift to the next few releases, which are likely to reflect the impact of the recent energy shock. Those upcoming numbers could be far more dramatic—and not necessarily in a reassuring way.
Sources: Michael Ashton

Leave a comment