Silver remains under pressure as escalating US-Iran tensions drive oil prices higher, stoking inflation concerns and reinforcing expectations of further Fed tightening.
Overnight US military strikes on Iran led Tehran to declare the ceasefire void, raising the risk of significant disruptions to global energy supply routes.
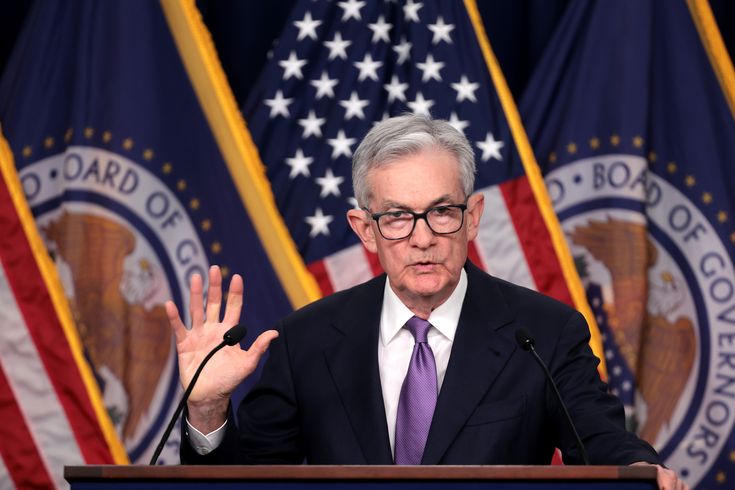
Cleveland Fed President Beth Hammack reiterated on Friday that inflationary pressures continue to persist.
Silver prices (XAG/USD) extended their advance for a second straight session, trading near $56.80 per troy ounce during Monday’s Asian session. Despite the recent rebound, the precious metal may encounter headwinds as escalating tensions between the United States and Iran continue to push crude oil prices higher, reviving inflation concerns and strengthening expectations that the Federal Reserve could tighten monetary policy further.
The US has carried out a ninth consecutive night of strikes against Iranian-linked targets. In response, Tehran announced that the ceasefire arrangement between the two countries is effectively over, raising concerns about potential disruptions to key energy transit routes across the Middle East.
Regional tensions intensified further after Iran launched a new barrage of ballistic missiles and one-way attack drones targeting locations in Bahrain, Jordan, Kuwait, and Iraq, triggering air raid warnings across parts of the Gulf. At the same time, the US military confirmed the death of another service member, bringing the total to three casualties within two days.
The conflict has increasingly affected civilian infrastructure, with reports of damage to bridges, utility networks, and port facilities. Adding to concerns over energy security, Kuwait Petroleum Corp. stated that one of its oil installations was struck by an Iranian attack over the weekend.
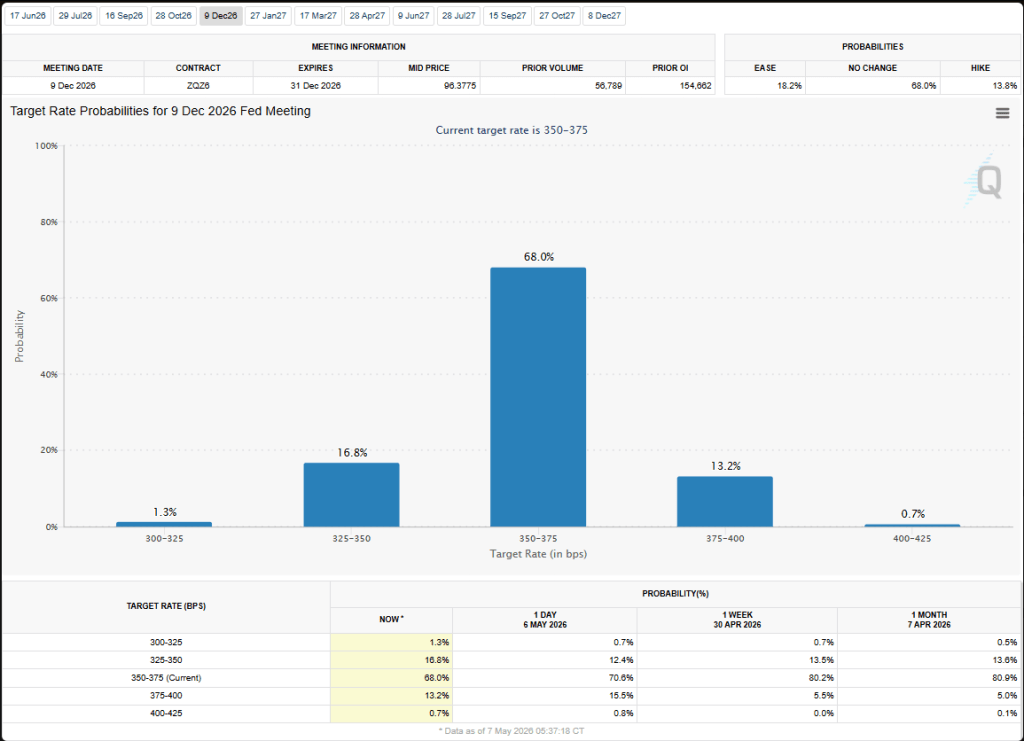
Although investors largely expect the Federal Reserve to leave interest rates unchanged at its next policy meeting, market expectations for tighter monetary policy have increased. According to CME FedWatch data, traders are now pricing in a 61.4% chance of a rate hike in September, reflecting growing concerns that higher energy prices could reignite inflationary pressures.
Hammack highlights widespread inflation risks, supporting a hawkish Fed outlook
Cleveland Fed President Beth Hammack delivered a notably hawkish message, earning a 7.2/10 FXS SpeechTracker score, comfortably above the historical average of 6.6/10. Her remarks reflected growing concern that inflationary pressures remain entrenched across the economy. By stressing calls from businesses for stronger measures to contain rising prices and noting that many households continue to struggle financially despite solid economic growth and resilient consumer spending, Hammack underscored the disconnect between healthy economic activity and increasing cost-of-living challenges.
She also pointed to several sources of inflation pressure, including elevated energy costs, supply-chain constraints, rising insurance expenses, and growing demand linked to AI infrastructure and data-center investments. By identifying persistent inflation as the primary risk facing policymakers, Hammack’s comments reinforced expectations that the Federal Reserve may maintain a restrictive policy stance for longer, providing underlying support for the US Dollar.
Meanwhile, the FXS Fed Sentiment Index climbed 2.06 points to 128.64, signaling that overall Fed communication remains firmly tilted toward tightening and well above the neutral threshold of 100. Combined with Hammack’s above-average hawkish score, the increase suggests that policymakers continue to prioritize inflation control over concerns about economic growth, a backdrop that generally favors the Dollar against lower-yielding currencies.
Silver prices declined as escalating tensions in the Middle East drove oil prices higher, fueling inflation concerns and reinforcing expectations that the Federal Reserve will keep interest rates elevated for longer.
According to the CME FedWatch Tool, markets now assign a 51% probability to a Fed rate hike in September, compared with a 23% chance that policymakers leave rates unchanged.
Meanwhile, U.S. President Donald Trump reinstated a blockade targeting Iranian vessels and introduced a 20% transit fee on non-Iranian ships using the Strait of Hormuz under U.S. protection.
Silver prices (XAG/USD) extended their decline for a third straight session, trading near $57.60 per troy ounce during Tuesday’s Asian session. The non-yielding precious metal remained under pressure as intensifying tensions in the Middle East pushed crude oil prices higher, raising concerns that stronger energy-driven inflation could keep the Federal Reserve on a restrictive policy path for longer.
Rate expectations have turned increasingly hawkish. According to the CME FedWatch Tool, traders now see a 51% chance of a Fed rate increase in September, while the probability of policymakers leaving rates unchanged has dropped to 23%.
Geopolitical risks escalated after US President Donald Trump reinstated a naval blockade targeting Iranian vessels and ships linked to Iran passing through the Strait of Hormuz. He also announced a 20% transit fee on all other commercial cargo vessels using the strategic shipping route.
Investors are now focused on two key US events scheduled for Tuesday. The June Consumer Price Index (CPI) report is expected to show headline inflation falling 0.1% month-over-month, while core CPI is forecast to remain firm with a 0.3% monthly increase, highlighting persistent underlying price pressures.
Attention will also turn to Federal Reserve Chair Kevin Warsh, who is set to testify before Congress. Market participants will closely scrutinize his remarks for clues on whether Fed officials share the market’s increasingly hawkish outlook and are prepared to keep monetary policy tighter for longer.
U.S. benchmark crude oil prices dropped below $70 per barrel on Wednesday, hitting their lowest point since the conflict with Iran erupted on Feb. 28. The decline is expected to reduce pressure on headline inflation in the months ahead. However, the key issue now is whether the bond market will also adjust by pricing in lower inflation expectations, as uncertainty surrounding the Federal Reserve’s interest-rate path remains unresolved.
Oil prices were pressured by a preliminary agreement aimed at ending the conflict with Iran, while shipping activity through the Strait of Hormuz has started to recover gradually. Even so, energy transport volumes are still significantly below levels seen before the war. “What shippers are looking for is consistency over days and weeks,” said Matthew Wright, a freight analyst at Kpler, a firm specializing in global shipping analysis.
The oil market is currently reflecting expectations of continued progress toward stability and a gradual recovery in global energy exports over the coming weeks and months. “Traders are pricing in a return to normality,” said Francis Osborne, head of oil analysis at Argus Media, a firm that monitors global oil prices. “They are not taking into account the risks further down the road, which still remain very real.”
Despite ongoing uncertainty surrounding the Middle East, U.S. Treasury yields have started to retreat, though the decline has been uneven across maturities. The 30-year Treasury yield — typically the most sensitive to inflation expectations — dropped sharply yesterday to 4.84%, its lowest level in several months. Meanwhile, the benchmark 10-year yield also moved lower, reversing much of the increase seen over the past month.
One key exception is the policy-sensitive 2-year Treasury yield. Although it edged lower yesterday, it remained near 4.16%, close to the recent high reached only days earlier. This suggests that investors are not yet fully convinced that inflation pressures have disappeared or that further Federal Reserve rate hikes are off the table.
Torsten Slok argues that lower oil prices could ultimately become inflationary, writing:
“The narrative in markets is changing from ‘lower oil prices mean lower inflation’ to ‘lower oil prices mean more demand in an already overheating economy, which means higher inflation.’ Driven by the strong April CPI, hot May non-farm payrolls, and a hawkish Fed, the market narrative now suggests that the reopening of the Strait of Hormuz will further overheat the economy, forcing the Fed to raise interest rates soon.”
Whether Slok’s view proves correct will take time to assess, as geopolitical tensions and broader macroeconomic uncertainty continue to cloud the outlook. In the near term, however, inflation pressures are still expected to ease somewhat.
The Federal Reserve Bank of Cleveland’s inflation nowcast points to a modest slowdown in year-over-year CPI after several months of elevated readings. Meanwhile, Core CPI — which has remained relatively stable throughout the conflict, rising only slightly — is projected to increase 2.9% in the latest monthly update compared with a year earlier.
Fed funds futures markets are now assigning higher odds of near-term tightening, pricing in a 34% probability of a 25-basis-point rate hike at the next FOMC meeting on July 29, with expectations rising to around 67% in favor of further tightening by September.
Morningstar expects any near-term inflation persistence to gradually fade over time. The firm notes: “We expect inflation to fall in the coming years. Receding energy prices will be reflected in a negative impulse to inflation in 2027. The tariff impact should also cease going forward. Moreover, wage growth has slowed considerably, which should help push services inflation back to normal. Housing inflation also continues to trend down.”
Still, while the longer-term outlook points toward easing inflationary pressure, that horizon remains distant. In the immediate term, markets are taking comfort in signs of cooling prices, though uncertainty around the Federal Reserve’s policy path suggests that current stability may not last.
The United States Dollar Index remains supported as expectations for a Federal Reserve rate hike continue to build. Markets are now pricing in a 63.4% chance of a rate increase in September, according to the CME Group FedWatch tool. Meanwhile, US PCE inflation accelerated to 4.1% in May amid oil supply concerns linked to tensions in the Middle East, reinforcing expectations that the Fed could keep tightening policy.
The US Dollar Index (DXY), which tracks the performance of the US Dollar (USD) against a basket of six major currencies, recovers some of its previous session losses and trades near 101.50 during Friday’s Asian session. Investors now await the release of the Michigan Consumer Sentiment Index later in the day for fresh market direction.
The Greenback remains supported by increasing expectations that the Federal Reserve (Fed) could raise interest rates again. According to the CME FedWatch tool, markets are currently pricing in a 63.4% chance of a rate hike at the Fed’s September 15–16 meeting.
The hawkish outlook follows stronger inflation data, with the headline Personal Consumption Expenditures (PCE) Price Index rising to 4.1% year-over-year in May from 3.3% previously. The jump marks the first time in three years that headline PCE inflation has moved above the 4.0% threshold, largely driven by higher energy prices linked to tensions in the Middle East, keeping the possibility of additional Fed tightening alive.
Meanwhile, the core PCE Price Index, the Fed’s preferred measure of underlying inflation, climbed to 3.4% annually from 3.3% in April, marking the strongest core inflation reading since October 2023.
BMO Chief US Economist Scott Anderson stated that elevated PCE inflation is likely to keep the Fed cautious, with further rate hikes remaining a possibility. He added that persistent service-sector inflation may not ease quickly even if energy prices decline, suggesting continued policy debates between Fed hawks and doves.
Kevin Warsh was officially sworn in today as the 17th Chairman of the FOMC, but persuading policymakers to support interest-rate cuts may prove challenging. The US labor market continues to show resilience — and may even be gaining momentum — while inflation remains above the Federal Reserve’s 2% objective.
Against that backdrop, the US Dollar Index could benefit from expectations of higher US interest rates. If the index breaks above near-term resistance around 99.50, it may quickly rally toward the psychologically important 100.00 level.
In relatively subdued trading ahead of the holiday weekend, Warsh formally succeeded Jerome Powell as the Fed’s new leader. As the preferred candidate of Donald Trump, Warsh is likely to face political pressure to lower borrowing costs. However, current economic conditions make a convincing argument for rate cuts difficult. The unemployment rate remains low, and the latest National Federation of Independent Business Small Business Optimism survey indicates the labor market could be strengthening further rather than slowing.
At the same time, inflation — the other pillar of the Federal Reserve’s dual mandate — is clearly moving in the wrong direction. No matter which inflation gauge is used, price growth remains above the Fed’s 2% target. Moreover, the ongoing conflict involving Iran is likely to add further upward pressure on prices in the months ahead, even if the Strait of Hormuz were to reopen immediately.
Against this backdrop, traders have begun pricing in the possibility of at least one interest-rate hike over the next year. According to the CME Group FedWatch tool, markets are currently assigning a 20% probability that the Federal Reserve could deliver two or more 25-basis-point rate increases by the end of next April.
Although Kevin Warsh is expected to be more cautious about raising interest rates than the average FOMC policymaker — largely due to the political circumstances surrounding his appointment — the broader policy outlook has become increasingly hawkish in recent months.
For now, the Federal Reserve is still expected to keep rates within the current 3.50%–3.75% range throughout the summer unless economic conditions shift unexpectedly. However, if inflation and labor-market data continue to remain strong, even the most dovish members of the committee may eventually have little choice but to support tighter monetary policy.
US Dollar Technical Outlook: DXY 4-Hour Chart
Turning our attention to the charts, higher US interest rates would be expected to support the world’s reserve currency, all else equal. The US Dollar Index (DXY) has been lagging the rally in 2-year Treasury yields (a proxy for near-term FOMC interest rate expectations) since the start of the month, hinting at the potential for a “catch-up” trade to the topside as we head toward June.
From a technical perspective, the US Dollar Index has carved out a sideways range between about 99.00 and 99.50 over the past week and a half, with a symmetrical triangle pattern forming within that zone over the course of this week. The rangebound trade has allowed the world’s reserve currency to correct its overbought condition through time, rather than an outright price correction, a bullish development that hints at another leg higher if 99.50 is eclipsed.
In that scenario, a quick rally toward the psychologically-significant 100.00 level would be the higher-probability development to watch, whereas a bearish breakdown below 99.00 would invalidate the bullish setup and point to a deeper retracement toward 98.50 next.
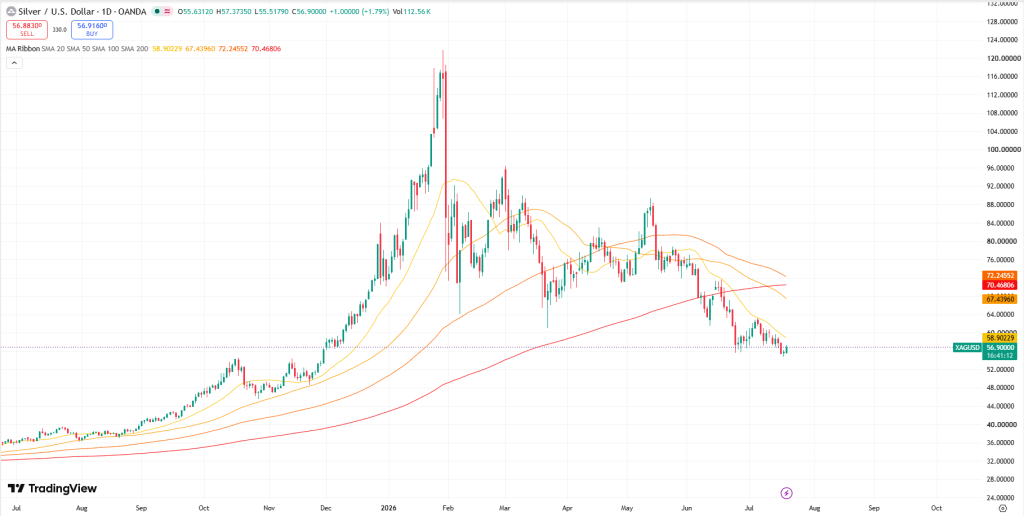
Silver surged above $85 this week after two separate single-session rallies of more than 6% — first on May 7 amid optimism surrounding Iran peace developments, and again on May 11 ahead of the anticipated Trump-Xi summit. The compression in the gold-silver ratio to 55.46, while gold itself remained relatively stable, makes the driver of the rally clear: markets were repricing industrial demand rather than reacting to fear. Around 60% of silver consumption comes from industrial use, much of it tied to supply chains dependent on US-China trade. Investors bid silver higher in anticipation that an extension of trade détente between Washington and Beijing would benefit industries with heavy silver demand.
Beneath the headline rally, however, a more important structural shift emerged on April 29 — one that could have greater implications for silver over the coming year than any individual price spike.
In the April 15 report, it was noted that March’s 3.3% CPI reading reinforced the stagflationary conditions this newsletter has been monitoring. April’s CPI, released on May 12, climbed further to 3.8% — the highest since May 2023 — confirming that the previous month’s inflation surge was not an isolated event. The Federal Reserve is now confronting a difficult combination of persistent inflation and a weakening labor market, and the events of April 29 highlighted how sharply divided policymakers have become over the appropriate response.
The Fed’s Deepest Division in 34 Years — and Why It Matters for Silver
On April 29, the Federal Open Market Committee voted 8-4 to keep interest rates unchanged at 3.50%–3.75%. The breakdown of votes was revealing: three governors argued rates should rise further, while one believed rates should already be cut. During what may be his final press conference as Fed Chair, Jerome Powell described policy as being “at the high end of neutral or perhaps mildly restrictive.” The statement reflected uncertainty rather than conviction — a central bank divided not only on policy direction, but on the broader outlook for the economy itself.
That same day, the Senate Banking Committee advanced Kevin Warsh’s nomination to replace Powell in a narrow 13-11 party-line vote, marking the first fully partisan committee vote for a Fed Chair nomination in modern history. Powell also announced he would remain on the Board of Governors after stepping down as Chair, positioning himself as a potential counterbalance to his successor. The combination of a fractured committee, a politicized leadership transition, and an outgoing Chair staying on the Board has little historical precedent.
A Federal Reserve unable to cut rates without risking higher inflation — yet unable to raise them without damaging growth — is effectively trapped. Historically, periods of monetary paralysis combined with political uncertainty at the central bank have often created favorable conditions for silver outperformance. The historical pattern is compelling enough to warrant close attention.
Three Periods of Fed Paralysis — and Three Major Silver Bull Runs
From 1978 through January 1980, the Federal Reserve repeatedly swung between tightening policy to combat inflation and easing to avoid recession, ultimately failing to fully address either problem. During that period, silver surged from $6.08 to $49.45 — a gain of more than 700% that cannot be explained solely by the Hunt Brothers’ speculative activity. Inflation exceeded 11% in 1974 and climbed above 14% by 1980, according to Federal Reserve data. The key dynamic, as documented by Fed historians, was that policymakers could not raise interest rates aggressively enough to contain inflation without severely damaging employment. Each delay further weakened confidence in the US dollar and pushed capital toward hard assets such as silver.
A similar pattern emerged between 2008 and 2011. The Fed maintained near-zero interest rates while inflation expectations increased and real yields fell into negative territory. Silver climbed from roughly $8.50 at the depths of the financial crisis to nearly $50 by April 2011, marking a gain of around 480%. Although the context differed — this time the Fed was attempting to stimulate a post-crisis economy rather than contain inflation — the underlying mechanism remained the same: a central bank unable to respond decisively contributed to dollar weakness and stronger silver prices.
The 2020–2022 period offered another example. Massive fiscal stimulus collided with a Federal Reserve that reacted slowly to accelerating inflation pressures. Silver rallied from approximately $12 in March 2020 to above $29 by August, more than doubling within five months. The Fed’s delayed tightening response allowed what was initially viewed as temporary inflation to become more persistent, while silver reflected both growing monetary instability and rising industrial demand.
Across all three episodes, the decisive factor was not simply the level of interest rates, but the Fed’s inability to commit firmly in either direction. During the stagflationary 1970s alone, silver gained roughly 1,546% over the decade as inflation averaged 7.4% annually and policymakers consistently lagged behind price pressures.
Today’s environment has not yet reached the extremes of 1979, but the structural similarities are increasingly difficult to ignore. Inflation remains elevated at 3.8%, wage growth has softened to 0.2% monthly, the US fiscal deficit has expanded to $2.065 trillion, and the Fed’s institutional independence is now openly being challenged.
The market reaction on May 8 underscored this shift. Despite a jobs report that exceeded expectations by 85%, the US dollar weakened rather than strengthened. Normally, stronger economic data supports a currency by attracting capital inflows. When a currency declines on positive economic news, markets may be signaling concern that the broader monetary framework is deteriorating faster than headline employment data suggests.
What This Could Mean for Silver
Even after climbing to $85, silver remains roughly 30% below its all-time high of $121.67 reached on January 29. While prices have risen sharply, the underlying structural backdrop remains largely intact. Metals Focus and the Silver Institute forecast a sixth consecutive annual silver market deficit of 46.3 million ounces. Meanwhile, COMEX registered inventories stand at 79.88 million ounces, with the coverage ratio holding at 13.4% — below the 15% stress threshold for a seventh straight month. The World Silver Survey 2026 also projects global silver supply to decline 2% in 2026 even as industrial demand remains above 650 million ounces annually.
The outcome of the Trump-Xi summit remains uncertain, and geopolitical tensions involving Iran are unresolved. After a nearly 13% rally in just two weeks, a short-term correction from the $85 level would not be unusual. Markets rarely move in straight lines.
However, the broader Federal Reserve dynamic described above appears less like a temporary trading catalyst and more like a structural shift in the monetary system — one that has historically created highly supportive conditions for silver. The April 29 FOMC split vote and the partisan confirmation battle surrounding Kevin Warsh did not immediately trigger a silver rally. Instead, they may have altered the long-term framework through which future market movements will be interpreted.
Nonfarm Payrolls are forecast to increase by 62K in April, while the Unemployment Rate is expected to remain unchanged at 4.3%. The USD could face elevated volatility ahead of the weekend.
The United States Bureau of Labor Statistics is set to release the April Nonfarm Payrolls (NFP) report on Friday at 12:30 GMT, with markets closely watching the data for clues on the Federal Reserve’s interest-rate path later this year.
Economists expect the US economy to add 62K jobs in April, a sharp slowdown from March’s stronger-than-expected 178K gain. The Unemployment Rate is forecast to remain steady at 4.3%, while annual wage growth, measured by Average Hourly Earnings, is seen accelerating to 3.8% from 3.5%.
Analysts at TD Securities expect signs of stabilization in the labor market after several volatile months. They forecast payroll growth of around 80K, driven mainly by hiring in healthcare and leisure & hospitality, while government employment may decline slightly. They also expect monthly wage growth to stay modest at 0.2%.
Additional labor indicators released earlier this week painted a mixed picture. ADP reported that private-sector employment rose by 109K in April, improving from March’s revised 61K increase. Meanwhile, the Employment Index in the Institute for Supply Management Services PMI climbed to 48 from 45.2, signaling that service-sector hiring is still contracting, though at a slower pace.
What impact will the US March Nonfarm Payrolls have on EUR/USD?
EUR/USD is likely to remain highly sensitive to the upcoming US Nonfarm Payrolls (NFP) report, as investors reassess the outlook for the Federal Reserve and the broader direction of the US Dollar.
Despite the Fed’s relatively hawkish April meeting, the USD has struggled to gain traction amid improving global risk sentiment and easing geopolitical tensions in the Middle East. Comments from Fed Chair Jerome Powell reinforced a data-dependent approach, while Austan Goolsbee acknowledged that labor market conditions have softened, even if they remain broadly stable.
Markets currently expect the Fed to keep rates unchanged through the end of 2026, though traders still see some probability of either a rate hike or cut depending on incoming data. A weak NFP reading — particularly below 30K alongside a higher Unemployment Rate — could strengthen expectations for rate cuts later this year. In that scenario, the USD may weaken further, allowing EUR/USD to extend gains.
On the other hand, a stronger-than-expected payrolls figure could reduce expectations for monetary easing and help the USD stabilize. This would likely cap EUR/USD upside, although a sustained dollar rally may remain limited if risk appetite stays strong heading into the weekend.
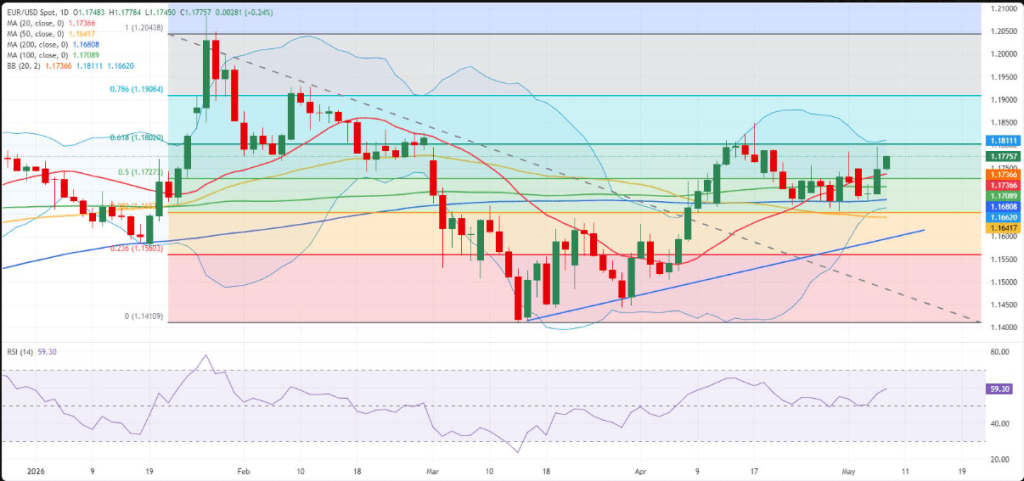
From a technical perspective, FXStreet analyst Eren Sengezer notes that EUR/USD maintains a bullish near-term bias. The pair continues to trade above its 100-day and 200-day Simple Moving Averages, while the Relative Strength Index trends toward bullish territory.
Key resistance is seen around 1.1800–1.1810, followed by 1.1900–1.1910 and the psychological 1.2000 level. On the downside, major support stands in the 1.1710–1.1680 zone, with further downside targets at 1.1650 and 1.1560 if selling pressure intensifies.
For years, a dependable macro strategy was to buy dips when economic data weakened. Softer labor figures implied a more accommodative Fed, leading to lower discount rates and, in turn, higher equity valuations. That chain is now being tested.
The key issue this Wednesday isn’t whether the data are weak—they clearly are. The real question is whether markets can continue to interpret soft data as a trigger for policy easing when inflation signals remain stubborn.
A Familiar Macro Play—and Why It May Be Breaking Down
For much of the past three years, equity markets leaned on a simple framework: weaker growth would trigger easier monetary policy, and that easing would offset the damage from slowing activity. Soft payrolls boosted expectations of rate cuts, often lifting stocks. Weak manufacturing data pushed bond yields lower, compressing discount rates and supporting higher valuations—especially in growth equities. The pattern became almost automatic.
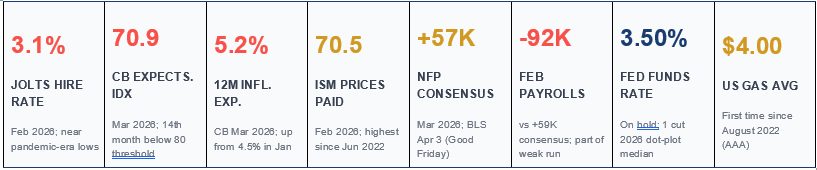
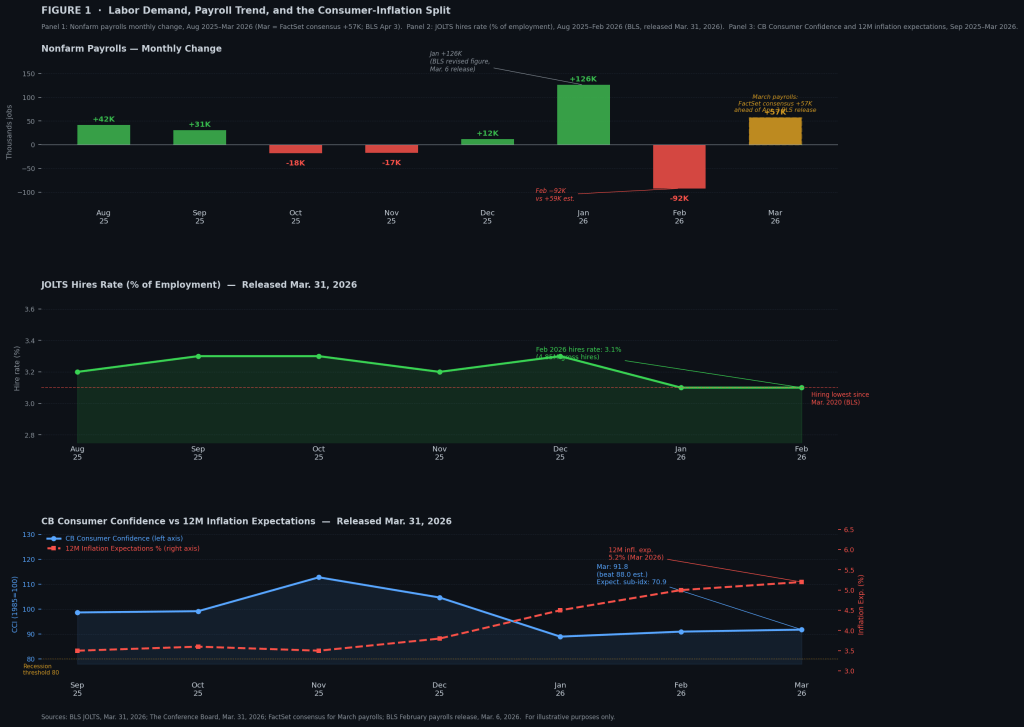
But that playbook only works when slowing growth comes with easing inflation. A disinflationary slowdown gives the Fed room to cut rates. When growth weakens while inflation pressures stay firm, that flexibility disappears. Easing policy into persistent price pressure risks unanchoring inflation expectations, which could later require more aggressive tightening. Today’s data point to exactly that mismatch: labor conditions are deteriorating, while inflation-sensitive indicators remain elevated. The JOLTS hires rate for February dropped to 3.1%, near pandemic-era lows, with hiring at its weakest since March 2020. Meanwhile, the Conference Board’s 12-month consumer inflation expectations rose to 5.2% in March, up from 4.5% in January. In other words, hiring is slowing sharply even as households expect higher inflation ahead.
Jerome Powell addressed this dilemma directly in remarks at Harvard on Monday. He highlighted the downside risks to the labor market, which argue for lower rates, alongside upside risks to inflation, which argue against easing. The Fed can afford to sit with that tension and wait for clearer trends—but markets typically cannot; they adjust immediately to incoming data. If Wednesday’s ISM Prices Paid index stays elevated following February’s 70.5 reading—the highest since mid-2022—it would reinforce what the mixed signals already suggest: this is not the kind of slowdown the old “buy-the-dip” reflex was designed for.
What the Hiring Data Is Already Signaling
The labor market’s weakening is showing up more clearly in the JOLTS hires rate than in headline payroll numbers. This metric tracks gross hiring as a share of total employment, and at 3.1% in February, it has dropped to levels last seen during the pandemic slowdown. While layoffs remain relatively low—and initial jobless claims around 213,000 suggest companies aren’t aggressively cutting staff—the real shift is in reduced hiring activity. The labor market is losing momentum on both sides: workers are less willing to quit, and employers are less willing to hire. Both trends point to softening demand.
The quit rate has stayed at or below 2.0% for eight straight months through February, with total quits falling to 2.97 million—the lowest since August 2020. When workers stop leaving jobs, it reflects declining confidence in finding better opportunities. This kind of stagnation tends to push unemployment higher धीरे through attrition rather than layoffs, making the deterioration less visible in monthly payroll reports. February’s payroll decline of 92,000 followed a series of inconsistent and often weak readings, including multiple recent negative months. Even January’s gain was driven by narrow sector strength rather than broad-based hiring. For March, the FactSet consensus sits at +57,000, but much of that expected increase may simply reflect the return of workers temporarily excluded in February due to a healthcare strike—hardly a sign of genuine improvement.
The ADP private payroll report, scheduled for release Wednesday morning, will offer an early look at March hiring trends. While ADP emphasizes that its data is independent and not a forecast of official figures, its February reading of +63,000 diverged significantly from the government’s count. At this point, the exact number matters less than the direction: whether hiring picked up meaningfully in March, or whether the slowdown seen in JOLTS extended into the new data.
Technical Snapshot
JOLTS – February 2026 (released Mar 31) Job openings declined to 6.9 million from 7.2 million in January. Hiring totaled 4.85 million, with the hires rate at 3.1%—near pandemic-era lows and the weakest since March 2020. Quits fell to 2.97 million, marking an eighth straight month at or below 2.0%.
Conference Board Consumer Confidence – March 2026 The headline index came in at 91.8, above the 88.0 consensus. The Present Situation component rose 4.6 points to 123.3, while Expectations slipped 1.7 points to 70.9—its 14th consecutive month below the 80 threshold often associated with recession risk. One-year inflation expectations climbed to 5.2%, up from 4.5% in January.
ISM Manufacturing PMI – February (latest actual) The headline PMI registered 52.4. The Prices Paid component surged to 70.5, the highest since June 2022. The March reading is due Wednesday, April 1 at 10:00 AM ET, marking the first release since the late-February escalation.
ADP Private Payrolls – March (Apr 1, 8:15 AM ET) Still pending. February showed a gain of 63,000, though this diverged sharply from the BLS estimate (roughly -50,000 in private payrolls). ADP emphasizes that its figures are independent and not a direct forecast of official data.
Nonfarm Payrolls – March (Apr 3, 8:30 AM ET) Consensus stands at +57,000, according to FactSet. U.S. equity markets (NYSE, Nasdaq) will be closed for Good Friday, with SIFMA recommending a full bond market closure. The next regular equity session is Monday, April 6.
10-Year U.S. Treasury Yield Currently at 4.41%, hovering near an eight-month high and up 44 basis points from 3.97% before the late-February escalation.
U.S. National Average Gasoline Price (AAA, Mar 31) $4.00 per gallon, reaching that level for the first time since August 2022.
How the Data Panels Frame the Argument
The three panels together lay out the core evidence. The first highlights a choppy payroll trend with several negative prints, and even if March meets expectations, hiring remains subdued. The second shows that the drop in the hires rate is not just monthly noise but a structural shift—hovering near pandemic-era lows while separations stay relatively stable, meaning the weakness is concentrated in reduced hiring. The third panel captures the real tension: consumer confidence from the The Conference Board came in stronger than expected at 91.8, yet the Expectations index sits at 70.9, below the recession signal threshold for 14 straight months. At the same time, 12-month inflation expectations climbed to 5.2%. Households are both pessimistic about growth and anticipating higher inflation—a mix that limits the Fed’s flexibility. Cutting rates risks reinforcing inflation expectations, while holding steady risks deepening the slowdown.
ISM Prices Paid: The Deciding Variable
While early attention will likely focus on the ADP payroll release, the more critical variable is the inflation signal from ISM. The Prices Paid index surged to 70.5 in February, its highest since mid-2022, reflecting rising input costs across commodities and tariffs. March will be the first reading to fully capture conditions after the late-February conflict, including the energy shock.
With oil prices elevated and gasoline back above $4 per gallon, this release becomes the first real test of how deeply cost pressures are feeding into the production chain. If Prices Paid remains high—or climbs further—while hiring data weakens, it creates the exact setup that challenges the old market playbook. Soft labor data alone would typically support expectations of easing, but persistent cost pressures make that response less likely without accepting inflation risk.
That divergence matters. The traditional “bad data is good news” logic only works when both growth and inflation move in the same direction. If hiring weakens while inflation signals stay firm, that relationship breaks down.
A Shift in Market Interpretation?
The issue isn’t that one week of data changes the macro outlook—it’s that the framework markets use to interpret data may no longer hold. The familiar reflex—weak data leads to rate-cut expectations, which lifts equities—was built in an environment where the Fed had room to ease because inflation was falling alongside growth. When those two forces diverge, that reflex starts to fail.
Jerome Powell emphasized this balance in recent remarks, noting that policy operates with long and variable lags and that the Fed does not respond mechanically to every short-term shock. That approach preserves institutional credibility. Markets, however, operate differently—they price probabilities in real time. The risk isn’t simply weak data; it’s weak data paired with stubborn inflation, which removes the usual policy backstop.
What Comes Next: CPI as the Decisive Test
The next major checkpoint is the March CPI release on April 10. February’s data largely preceded the late-February shock, while March will begin to reflect its impact—especially through energy prices. If CPI confirms what current indicators suggest—a cooling labor market alongside rising inflation expectations—it would strengthen the case that the old interpretation mechanism is no longer reliable.
Wednesday’s data won’t settle the question. But it will be the first structured test of whether markets can still treat weak data as bullish in an environment where inflation refuses to cooperate.
Middle East tensions likely to delay Fed rate cuts
The conflict in the Middle East is expected to increase price pressures, while at the same time posing risks to U.S. economic growth and employment prospects. As a result, the situation is more likely to delay potential Federal Reserve rate cuts rather than eliminate them entirely. This differs from the situation in 2022, when a combination of demand and supply shocks sharply accelerated inflation and forced the central bank to raise interest rates.
Rising inflation limits the Fed’s flexibility
Recent developments in the Middle East have significantly altered expectations for monetary policy at the Federal Reserve. Financial markets had previously anticipated two 25-basis-point rate cuts this year, but pricing has now shifted to reflect barely one cut.
Investors are also overwhelmingly expecting the Federal Open Market Committee to leave interest rates unchanged at its meeting on March 18, a view we also support.
Military activity in Iran and heightened risks to shipping through the Strait of Hormuz have driven a sharp rise in energy prices. Although the United States imports relatively little crude oil from the Persian Gulf and remains self-sufficient in natural gas, global oil pricing means domestic consumers still feel the impact.
Retail gasoline prices in the U.S. have already climbed above $3.60 per gallon, with the national average potentially approaching $4.25 per gallon in the near term. Higher fuel costs are expected to raise transportation and distribution expenses, while airline ticket prices could also increase.
If the disruption persists, price pressures may extend into other sectors such as fertilizers, food products, and plastics. As a result, inflation could rise toward 3.5% by the summer, remaining well above the Fed’s 2% target.
Growth and employment outlook uncertain
The implications for economic growth and employment remain less certain. February’s ISM business surveys suggested activity levels consistent with roughly 3% GDP growth. However, the labor market data paints a less optimistic picture.
The February employment report showed the economy lost 92,000 jobs, while the unemployment rate rose to 4.4%. This suggests the Fed may have been premature in removing its earlier assessment that “downside risks to employment rose in recent months” from the January FOMC statement.
Increasing geopolitical and economic uncertainty is unlikely to support stronger job creation and may dampen economic activity outside the U.S. energy sector.
Fed expected to signal a delay in rate cuts
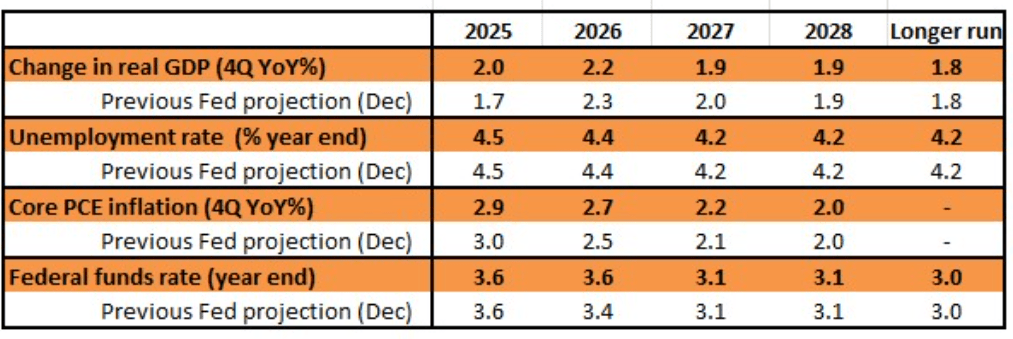
Against this backdrop, attention will turn to the updated economic projections from the Federal Reserve. In its December outlook, the Fed had anticipated one interest-rate cut in 2026, followed by an additional 25-basis-point reduction in 2027.
However, the ongoing conflict and the uncertainty surrounding its duration and severity make the outlook highly unpredictable. As a result, policymakers are likely to have limited confidence in their forecasts.
At the press conference, Fed Chair Jerome Powell is expected to emphasize the difficulty of setting monetary policy amid such geopolitical and economic uncertainty.
Even so, the Fed may modestly downgrade its growth projections, raise its inflation forecasts, and ultimately push back the previously expected 2026 rate cut to 2027.
Risks still tilted toward lower interest rates
We have been projecting two interest-rate cuts in September and December, although—like financial markets—we acknowledge the possibility that these reductions could be pushed into next year. While the Federal Reserve operates under a dual mandate of maintaining price stability and promoting maximum employment, safeguarding its credibility on inflation remains crucial. Cutting rates becomes difficult to justify when inflation is already above target and appears to be moving further away from it.
In early 2022, the Fed initially argued that inflation would prove temporary because it was largely driven by supply disruptions, suggesting there was no immediate need to raise rates. However, strong job creation, rapid wage growth, pent-up consumer demand following pandemic lockdowns, and stimulus payments fueled a surge in spending. Inflation subsequently accelerated far more than expected.
As a result, the central bank was forced to respond aggressively, lifting interest rates by 525 basis points between March 2022 and July 2023 in an effort to regain control over rising prices.
Currently, the U.S. labour market appears significantly weaker, with both job creation and real household disposable income showing little growth over the past six months. At the same time, consumer confidence has been weighed down by concerns over tariffs and job security, reducing the likelihood of a strong demand surge that could push inflation higher. This environment suggests that inflationary pressures may indeed prove temporary this time.
Instead, the current energy shock may ultimately dampen demand, which would help ease core inflation over time. A correction in equity markets could amplify this demand destruction further. For this reason, we continue to expect a downward bias in Federal Reserve policy rates over the next 12–18 months.
Although tax refunds this year are expected to be relatively large—averaging around $4,000 compared with $3,200 last year—a much stronger fiscal stimulus would likely be required to generate enough demand to entrench inflation. Measures such as widespread stimulus checks would probably be necessary to produce sustained price pressures that might force the Fed to raise interest rates again.
However, such a scenario could unsettle bond markets due to concerns about rising government debt and renewed inflation risks. This, in turn, could trigger fears of 1970s-style inflation dynamics, a period marked by persistent inflation and financial market volatility. For now, we view that outcome as relatively unlikely.
Should the Fed Address the Persistent Stickiness in the Effective Funds Rate?
Since the Federal Reserve resumed purchasing Treasury bills in mid-December 2025, it has accumulated about US$165 billion in T-bill holdings. Overall, the Fed’s total securities portfolio—including bills—has increased by US$130 billion, bringing the balance sheet to roughly US$6.26 trillion. At the same time, bank reserves have risen by around US$180 billion to slightly above US$3 trillion, partly supported by a moderate drawdown in the Treasury’s cash balance.
Despite this US$130 billion expansion of the balance sheet, the Fed may find it frustrating that the effective federal funds rate has not declined, even marginally. Historically, the effective rate traded roughly 8 basis points above the policy floor, but it climbed to about 14 basis points in September and October 2025—one of the factors that prompted the renewed T-bill purchase program.
The underlying issue emerged when bank reserves slipped below US$3 trillion, causing conditions in the repo market to tighten noticeably. That tightening, from a relative-value perspective, helped push the effective funds rate higher. While the broader policy narrative has been dominated by rate cuts, the real concern is the effective funds rate drifting upward within the 25-basis-point target range.
For now, the effective funds rate remains stuck at 3.64%, just 1 basis point below the interest rate on reserve balances (3.65%). Moving up to 3.65% would be difficult because eligible counterparties can choose between holding reserves or lending in the federal funds market, though the rate should not exceed that level. Whether the Fed will address this issue publicly remains uncertain, although it arguably warrants attention from reporters, given that efficient market functioning is particularly important in the current environment.
Looking more broadly at interest rates—especially the outlook for bonds—the Fed is facing signals of higher nominal yields, rising real yields, and widening inflation breakevens. This mix does little to support further rate cuts. In fact, each element points toward the logic of maintaining current policy settings. For the time being, the market is likely to see more of the same, with 10-year Treasury yields potentially moving into the 4.3%–4.5% range before real yields eventually begin to decline again.
Fed Caution Should Continue to Support the Dollar
Like the rest of the world, the United States has seen a hawkish re-pricing of short-term interest rate expectations as the Middle East energy shock reduces the likelihood of near-term monetary easing. Although the shift in US rates has been smaller than in many other regions, it has done little to weaken the dollar. At the moment, the macro impact of rising energy prices is the dominant force shaping currency markets, while traditional drivers such as rate differentials have temporarily taken a back seat.
This suggests that even a mildly hawkish Federal Open Market Committee meeting on Wednesday—where the Fed could push the projected 25-basis-point rate cut from 2026 to 2027—may not provoke a dramatic reaction in the dollar. Still, if policymakers emphasize the inflation risks posed by higher energy prices while the US labor market remains resilient, it would likely provide modest support for the currency. In fact, the market’s reassessment of the Fed’s policy path has amplified the energy shock confronting Europe, Asia, and many emerging economies, undermining earlier expectations of a gradual dollar decline this year.
As long as energy prices remain elevated—or climb further—it will be difficult for the dollar to surrender the gains it has made this month. One potential source of increased dollar supply could come from official intervention, particularly if Japan steps in to curb USD/JPY should the pair rise beyond 160. A coordinated intervention by the United States and Japan to sell dollars would be unexpected and could trigger a broader correction in the currency. However, unless energy prices retreat meaningfully, any intervention would likely serve only to limit volatility rather than reverse the dollar’s broader strength.
The U.S. dollar strengthened on Friday and remained on course for a solid two-week winning streak, supported by its status as a preferred safe-haven asset amid the ongoing conflict involving Iran.
By 15:46 ET (19:46 GMT), the U.S. Dollar Index, which measures the greenback against a basket of six major currencies, rose 0.7% to 100.36 and was set for a weekly gain of around 1.4%. Meanwhile, EUR/USD fell 0.8% to 1.1423 and GBP/USD dropped 0.9% to 1.3228. USD/JPY edged 0.2% higher to 159.65.
Analysts at ING noted that the dollar has climbed to fresh monthly highs as markets struggle to see a clear resolution to the escalating Middle East crisis.
The joint U.S.–Israeli military campaign against Iran has now lasted more than a week and shows little sign of easing. President Donald Trump stated that Washington is “totally destroying” Iran’s military and economic capacity.
However, Tehran has signaled it will continue resisting. Iran’s new Supreme Leader, Mojtaba Khamenei, emphasized that the strategic Strait of Hormuz — a crucial shipping lane responsible for roughly one-fifth of global oil supply — will remain closed.
The possibility of a prolonged shutdown of the strait has triggered significant volatility in global oil markets. Brent crude prices surged to nearly $120 per barrel earlier in the week before briefly dropping below $90. On Friday, Brent futures were trading above $100 per barrel.
Because much of the oil and gas transported through the Strait of Hormuz is used to produce key goods such as fertilizers and plastics, rising energy prices could intensify inflationary pressures worldwide.
These inflation risks could lead central banks, including the Federal Reserve, to reconsider plans for near-term interest rate cuts. Higher interest rates typically attract foreign capital, which could further strengthen the U.S. dollar.
PCE inflation data in focus
Investors are also closely watching U.S. inflation data due on Friday, when the personal consumption expenditures (PCE) price index for January will be released.
The core PCE index — which excludes volatile categories like food and energy — is expected to rise 3.1% year-on-year, slightly above the 3.0% reading in December. This indicator is closely followed by financial markets because it is one of the Federal Reserve’s preferred gauges when setting monetary policy.
According to ING analysts, the core PCE index has been drifting further away from the Fed’s 2% target since reaching a low of 2.6% last summer.
They suggested that this trend may limit the Fed’s ability to lower interest rates this year and that policymakers will likely address the issue during next Wednesday’s Federal Open Market Committee (FOMC) meeting.
Interestingly, recent PCE data has shown stronger inflation than the Consumer Price Index (CPI) reported by the Labor Department. This difference largely reflects variations in weighting methods, particularly for housing and healthcare costs, as well as differences in coverage and consumer substitution patterns. Lower weighting for cooling shelter costs and higher exposure to rising medical expenses have kept PCE inflation relatively elevated compared with CPI.
In contrast, February’s CPI data released on Wednesday showed relatively moderate inflation of 2.4% year-on-year.
However, these figures mostly reflect a period before the Iran conflict escalated in late February with a wave of U.S. and Israeli airstrikes. Since then, the inflation outlook has become more uncertain.
Major central bank decisions ahead
Next week will be a crucial period for global monetary policy watchers, as several major central banks — including the Federal Reserve, the European Central Bank (ECB), and the Bank of England — are set to announce interest rate decisions.
Investors will pay close attention to how policymakers address the economic implications of the Iran conflict.
According to JPMorgan economist Michael Feroli, markets widely expect the Fed to leave its benchmark interest rate unchanged at a target range of 3.5%–3.75%.
However, the Middle East conflict may complicate the outlook. Feroli said the Fed’s post-meeting statement is likely to mention the crisis as an additional source of uncertainty affecting both employment and inflation objectives.
The ECB is also expected to keep rates unchanged, although policymakers are likely to comment on the severe oil and gas shock Europe is experiencing due to the conflict.
JPMorgan economists Bruce Kasman and Nora Szentivanyi noted that central banks often face difficult policy choices during periods of volatile energy prices. Energy costs frequently fluctuate by around 25% annually, pushing up energy inflation while making it difficult to determine whether changes stem from supply disruptions or shifts in demand.
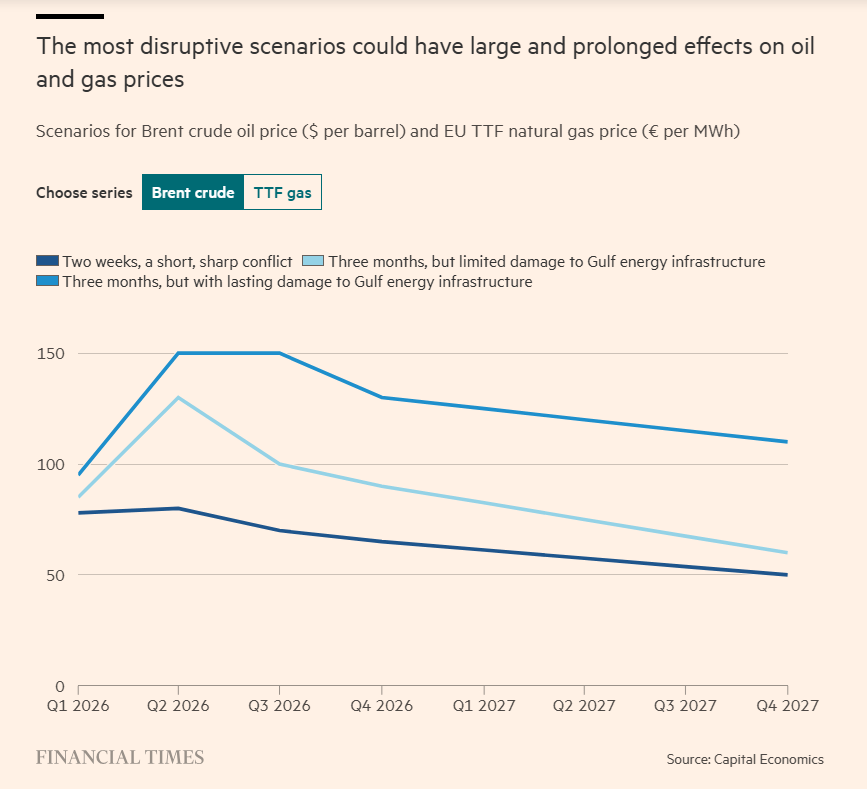
While oil prices are expected to remain elevated, a prolonged closure of the Strait of Hormuz could drive prices well beyond current market expectations. A sustained rise to $125 per barrel or higher would likely increase inflation while simultaneously weakening economic growth.
They warned that such a scenario could trigger different policy responses from major central banks. The Federal Reserve typically prioritizes mitigating recession risks and could adopt a more dovish stance if oil shocks intensify. In contrast, the ECB has historically been more sensitive to rising inflation and could tighten monetary policy if oil prices climb significantly.
Before the attack began on Feb. 28, lingering inflation concerns had already made the Federal Reserve cautious about continuing the interest rate cuts introduced last year. While several indicators of price pressure had eased compared with earlier highs, policymakers were reluctant to declare victory over inflation, which had peaked at 9.0% year over year in the Consumer Price Index in June 2022.
Since then, inflation has fallen sharply and stabilized around the mid-2% range, slightly above the Fed’s 2% target. However, the cautious optimism that accompanied this disinflation may quickly fade because of the war.
The main concern is that surging energy prices could reignite inflation and force the central bank to keep monetary policy tighter for longer. With oil, gasoline, and natural gas prices rising sharply, it remains unclear how persistent the shock will be—or how the Fed should respond. This uncertainty creates a policy gray area that may take time to resolve. The longer the conflict lasts, the more uncertain the outlook for monetary policy becomes.
Two key questions dominate the discussion: When will the war end, and what economic consequences will follow? For now, the answers remain highly speculative. Much of the analysis focuses on the recovery of oil exports through the Strait of Hormuz, which remains largely closed due to the conflict and normally handles about one-fifth of the world’s seaborne oil exports.
The basic calculation is straightforward: the longer shipments remain disrupted, the greater the hit to global supply, which could sustain upward pressure on energy prices. According to estimates from Capital Economics, cited by the Financial Times, prolonged export disruptions would likely extend the period of elevated oil prices and complicate the inflation outlook.
The challenge for the Federal Reserve is determining which scenario is most likely and calibrating monetary policy accordingly. With no clear end to the war in sight, the near-term outlook for energy prices—and their implications for inflation and economic growth—remains highly uncertain.
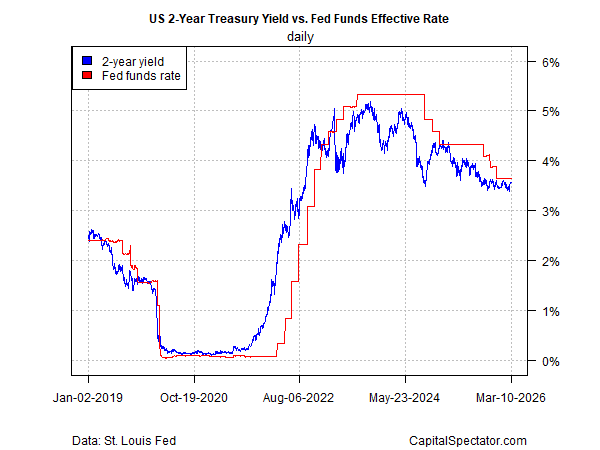
Financial markets are also struggling to assess the range of possible outcomes and are largely adopting a wait-and-see stance. One signal of this caution can be seen in the U.S. 2‑Year Treasury Yield, which is widely viewed as a proxy for expectations about Fed policy. In recent days, the yield has hovered close to the Effective Federal Funds Rate, suggesting investors broadly expect the central bank to keep interest rates steady in the near term.
Fed funds futures point to a similar outlook, indicating that markets expect the Federal Reserve to keep interest rates unchanged over the next three policy meetings. Current pricing suggests the first potential rate cut could come in July or September, although those expectations remain tentative given the high level of uncertainty surrounding the war’s impact on growth and inflation.
“The Fed always has a problem in deciding how to respond to a supply shock,” said Alan Detmeister, a former Fed economist now at UBS. “On the one hand, the inflationary effects argue for raising interest rates. On the other, weaker output and rising unemployment point toward lowering rates. It’s not clear-cut, which often leads the Fed to wait and see which side of its dual mandate—inflation or employment—requires the most support.”
Ultimately, even if a ceasefire eventually stabilizes the region, the economic aftershocks could persist. As a result, the Fed’s policy outlook is likely to remain uncertain for some time, with policymakers needing clearer signals on how the conflict will shape inflation and economic growth.
It’s difficult to get too excited about today’s CPI report. Because the data entirely predates the Iran war, it does not capture the recent surge in energy prices that could make next month’s inflation reading far more dramatic. Normally, this might be considered the last relatively “clean” inflation print before those effects appear. However, the data is not truly clean either, as lingering distortions from earlier shutdowns are still influencing the figures.
Those lingering effects may become more visible in April’s report, when rent data could show a temporary spike. This is expected because the October owners’ equivalent rent (OER) sample—assumed to have contained zero increases—will drop out of the calculation, potentially lifting the shelter component for one month. By that time, inflation data will also begin to reflect the impact of the Iran conflict. As a result, the next couple of months could bring more volatile inflation readings.
For February, expectations were roughly +0.26% for headline inflation and +0.24% for core inflation. That pace implies an annual rate close to 3%—still above the Federal Reserve’s target but not dramatically so. However, inflation had already been showing signs of firming even before the geopolitical tensions in the Middle East intensified, raising questions about how markets and policymakers will interpret the latest data.
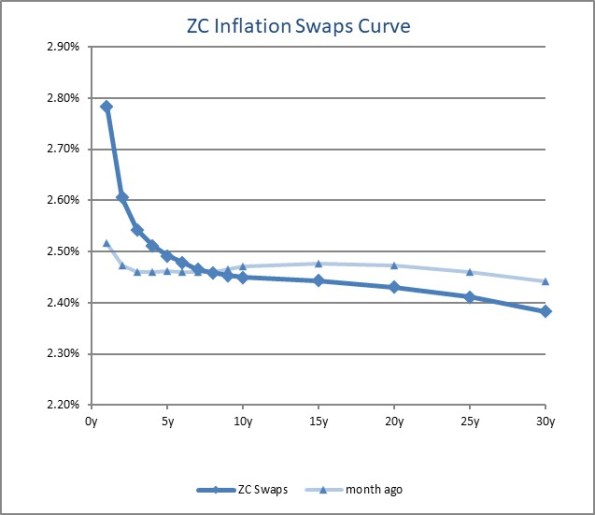
The U.S. CPI swaps curve already appears to be factoring in the effects of the conflict. Unsurprisingly, it is inverted, reflecting expectations of higher inflation in the near term due to energy prices. What is more unusual is that longer-term inflation expectations remain lower. While that might initially seem odd, it also serves as a useful reminder that markets may expect the energy shock to be temporary rather than a lasting source of inflation pressure.
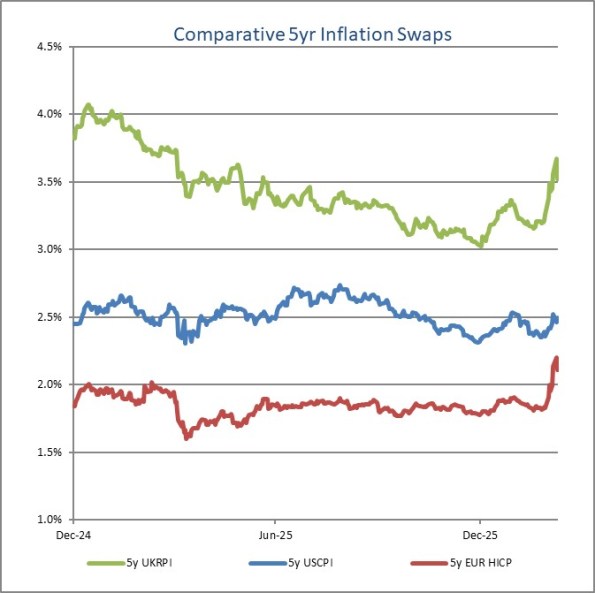
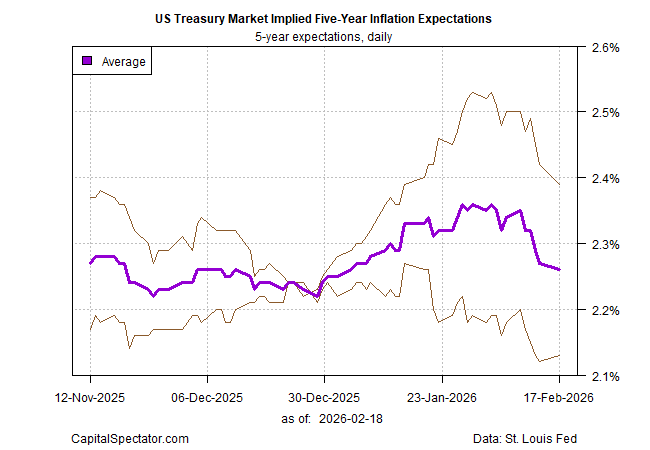
Another interesting point can be seen in the chart of five-year inflation swaps across several regions. Despite the sharp swings in energy prices, U.S. five-year CPI swaps have moved relatively little compared with other markets. This is partly because the U.S. economy is generally less sensitive to oil price fluctuations than many other countries. In addition, the U.S. dollar has often moved in the same direction as oil prices, which can soften the direct pass-through of energy costs into domestic inflation.
Even so, the move still appears notable. Given that this is a five-year tenor, it is somewhat surprising to see such a reaction when most of the current volatility stems from spot energy prices rather than longer-term inflation pressures.
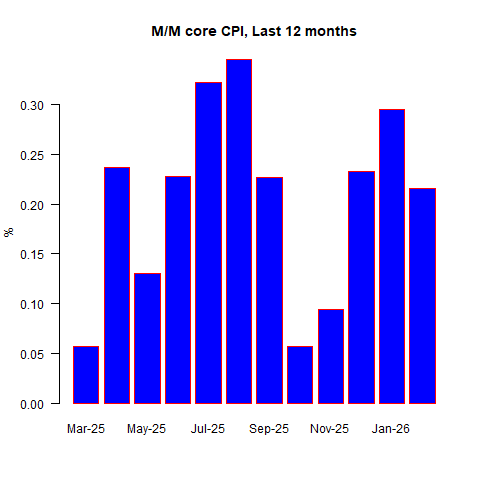
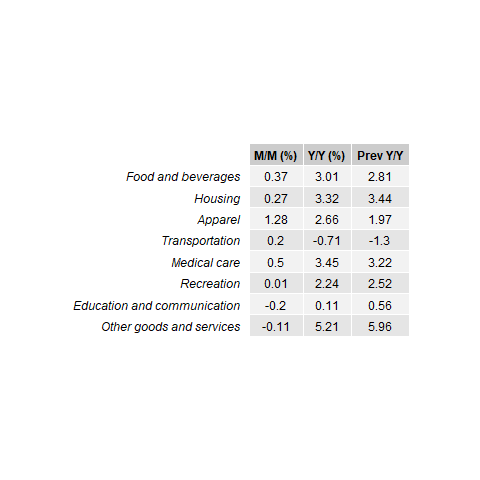
With those preliminaries in mind, the actual data is worth examining. Forecasts proved fairly accurate, with headline CPI rising 0.267%, while core CPI increased 0.216%, both broadly in line with expectations.
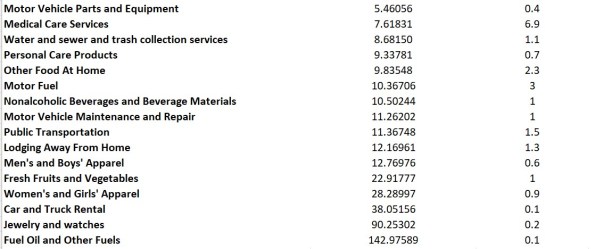
The spike in apparel prices is somewhat unusual, although such jumps do occur occasionally and the category represents a relatively small share of the overall CPI basket. The increase in medical care costs—driven largely by hospital services—was somewhat concerning. On the other hand, shelter inflation came in softer, which helped offset some of the upward pressure from other components.
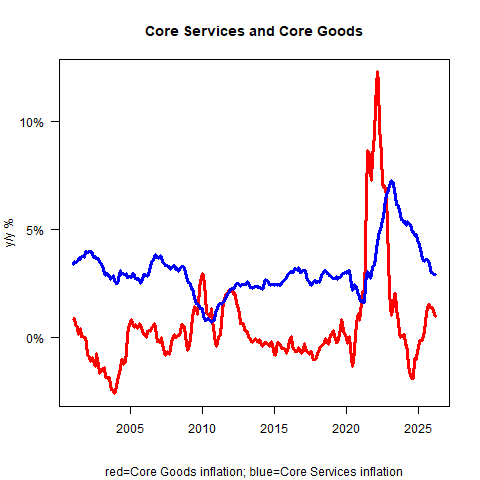
Both core services and core goods inflation eased on a year-over-year basis. Core goods inflation is now running at about +1% y/y. While a continued downward turn had been widely expected, the key question is where it ultimately stabilizes—around +0.5% or -0.5%. My view is that it is more likely to settle near +0.5%. Even so, the latest trend is encouraging news for the broader inflation outlook.
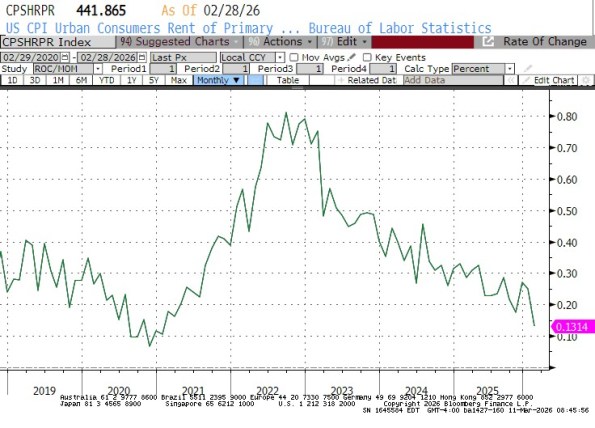
The main surprise in the report came from primary rents. While Owners’ Equivalent Rent (OER) rose 0.22% month-on-month, roughly in line with the previous month and continuing to trend lower on a year-over-year basis, Rent of Primary Residence increased by only 0.13% month-on-month.
This softer reading was notable, although the year-over-year trend in OER may shift in the coming months as the October sample—when increases were effectively assumed to be zero—drops out of the calculation.
The broader trend in rents is clearly moving lower, but the sharp drop is still surprising—especially given the ongoing cost pressures faced by landlords. It is possible that the decline will partially reverse next month. One likely explanation could be compositional shifts in the data. For example, rents may be softening in large cities as reverse immigration flows ease pressure on housing supply, while outmigration from places like New York City could also be influencing the figures. A deeper breakdown of the data would be needed to confirm these effects.
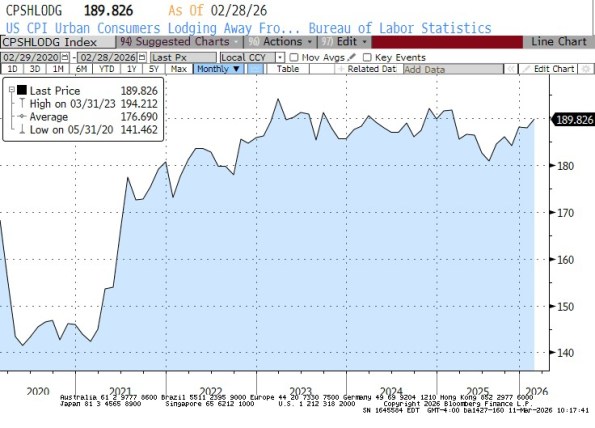
Meanwhile, the Lodging Away from Home category rose 1%. This component has been recovering after a dip last year, although hotel prices remain below the post-pandemic surge that followed COVID-19, when pent-up travel demand pushed rates sharply higher. Given the ongoing recovery in travel demand, there is a reasonable chance that hotel prices could reach new highs in 2026.
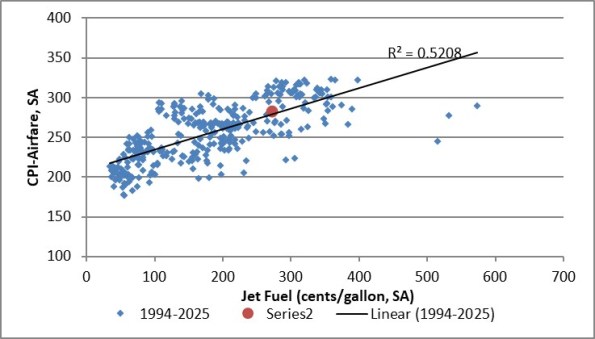
Airfares also increased, rising 1.4% month-on-month. This is worth watching closely. As energy prices climb, airlines often pass higher fuel costs on to passengers. While February’s data does not yet reflect the latest surge in energy prices, persistently high jet fuel costs could push airfares higher in the coming months.
If that happens, it may show up as stronger core inflation, even though the underlying driver would primarily be energy-related rather than a broader rise in service-sector prices.
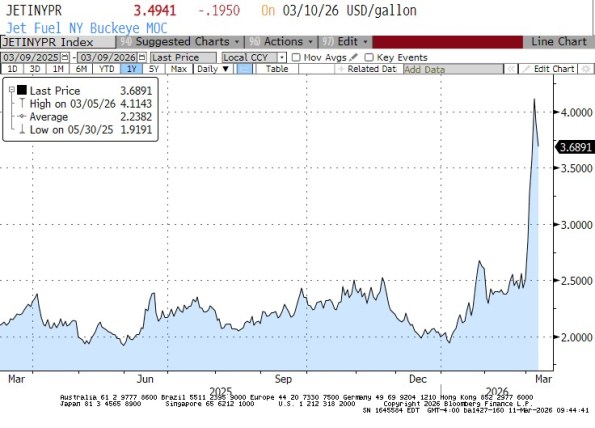
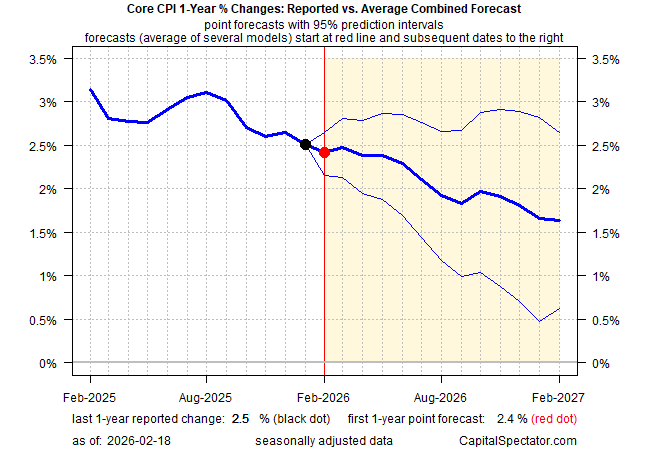
The red dot reflects the end-of-February reading. Since then, jet fuel prices have been highly volatile. They are currently around $3.49, after briefly reaching $4.11 just a few days ago. Such swings in fuel costs typically feed through to airline pricing with a short lag, meaning the impact is likely to appear in next month’s airfare data.
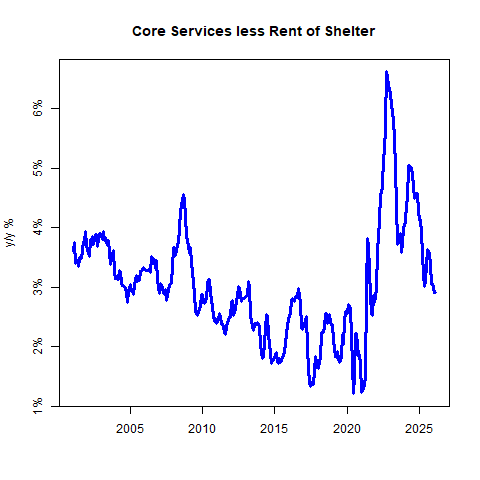
Turning to “supercore” inflation—core services excluding shelter—**the pace eased compared with the previous month. Last month, supercore rose 0.59% month-on-month, while this month it increased a more moderate 0.35% m/m.
On a year-over-year basis, core services excluding rents currently stand at 2.94%. However, that figure is likely to jump next month due to base effects. The comparison will drop the unusually weak reading from last March, when several travel-related categories posted sharp declines: airfares fell 5.27%, lodging away from home dropped 3.54%, and car and truck rentals declined 2.66%.
As those unusually weak numbers roll out of the calculation, the year-over-year supercore measure will likely rise—even if the month-to-month readings remain relatively modest. And given recent developments in travel and energy costs, those monthly figures may not stay soft for long.
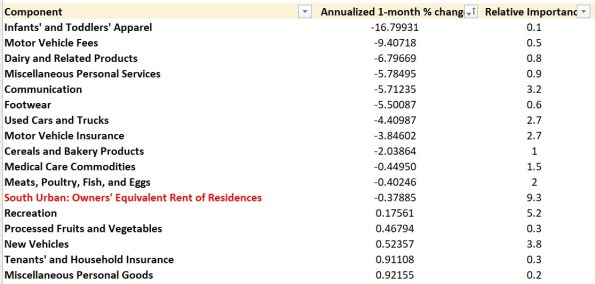
The overall distribution of price changes this month is also notable. Several categories recorded increases of less than 1% on an annualized month-to-month basis, although most of them were only slightly below that threshold.
It is also worth noting that the figures shown in red reflect adjustments based on my own estimate of seasonal patterns, rather than the methodology used by the Federal Reserve Bank of Cleveland.
There were also many categories in the upper tail of the distribution, although the upper tail appears longer than the lower one. Of course, Median CPI—a measure published by the Federal Reserve Bank of Cleveland—doesn’t depend on how long those tails are. That is precisely the point of using a median measure.
While I’m not fully confident in my estimate this month, I expect the median reading to come in relatively soft, likely below 0.2%.
Typically, median CPI tends to run comfortably above the mean CPI because for many years inflation has existed in a disinflationary regime, where price-change distributions were skewed to the downside—meaning the tails were longer on the negative side. In such environments, the median usually sits above the mean. This month, however, that pattern may not hold. During inflationary cycles, the distribution often flips, with longer tails on the upside, causing the mean to exceed the median. That said, one month of data is not enough to draw firm conclusions.
Regarding monetary policy, the February CPI figures may not carry much weight given the developments in March. Markets appear to be misinterpreting the recent energy price spike, treating it as an inflationary impulse that complicates the Federal Reserve’s policy path amid soft employment data. In reality, energy-driven increases in CPI are not typically the kind of inflation central banks try to suppress through tighter policy. Energy prices tend to be mean-reverting and are often anti-growth, meaning they slow economic activity.
Earlier observations about the CPI swaps curve—which is inverted and shows lower longer-term inflation expectations than a month ago—likely reflect markets beginning to price in a possible recession. While recessions themselves are not inherently disinflationary, markets often treat them that way.
If the Fed were to tighten policy in response to an energy-driven spike in inflation, it could worsen an economic slowdown. That dynamic contributed to several policy mistakes during the 1970s inflation crisis, something modern policymakers are well aware of. As a result, an energy shock combined with weak employment data is more likely to push the Fed toward easing rather than tightening.
In that sense, the current situation would not qualify as classic stagflation if core inflation continues to moderate. It may resemble “stag”—sluggish growth—but a higher headline CPI driven by energy does not necessarily signal persistent inflation if core and median measures remain contained.
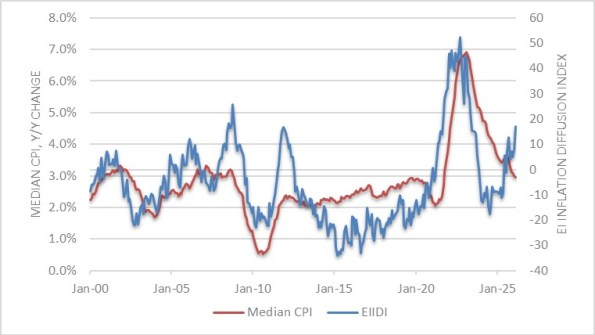
That said, there are reasons for caution. Core and median inflation may not remain subdued indefinitely. There are already signs they could move back toward the mid-to-high 3% range, and indicators such as the Enduring Investments Inflation Diffusion Index are trending higher, suggesting broader price pressures could gradually re-emerge.
(That said, the Federal Reserve does not necessarily share this view. We may eventually find ourselves discussing stagflation in a more literal sense, but many observers could still be misled by spikes in headline inflation.)
Another key implication is that the February data will likely have limited influence on policy decisions. Given the events that unfolded in March, the CPI figures for February are already somewhat outdated. Since the report came in largely in line with expectations, markets are unlikely to dwell on it for long.
In short, February’s inflation print will probably be forgotten quickly. Attention will soon shift to the next few releases, which are likely to reflect the impact of the recent energy shock. Those upcoming numbers could be far more dramatic—and not necessarily in a reassuring way.
Inflation came in cooler than anticipated in January, though markets still largely expect the Federal Reserve to hold its benchmark rate steady until June. However, the bond market appears ready to test that timeline, increasingly factoring in the possibility of a rate cut arriving sooner.
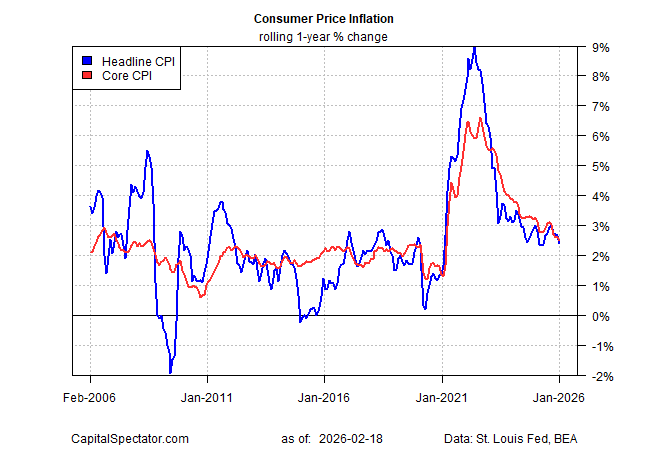
According to government data released Friday, the Consumer Price Index (CPI) rose 2.4% year over year in January, down from 2.7% in December and marking the lowest reading in eight months. Core CPI—which excludes volatile food and energy prices and is considered a clearer gauge of underlying inflation—also eased to 2.5% annually, its slowest pace since 2021.
While the slowdown in headline inflation is a welcome development, a deeper dive into the data suggests it may be premature to relax concerns about where prices are headed next. Persistent increases in tariff-sensitive goods remain one pressure point. Food prices are another, climbing 2.9% year over year—elevated by historical standards.
Energy costs rose even more sharply, and both homeowners’ and renters’ insurance premiums continued to increase. Moreover, inflation is still running above the Federal Reserve’s 2% target, reinforcing the likelihood that policymakers will proceed carefully.
Although it’s too soon to claim inflation has been fully tamed, the broader trend of moderating price growth strengthens the argument that the worst may be behind us. The Capital Spectator’s ensemble forecast has long projected continued disinflation in core CPI, a view that has so far aligned reasonably well with actual data. The model still anticipates further easing, with core CPI’s 12-month rate expected to edge down to around 2.4% in the upcoming February report.
Fed funds futures continue to indicate that the first rate cut won’t arrive until the June meeting. In contrast, the Treasury market appears to be probing the possibility of an earlier move. The policy-sensitive 2-year Treasury yield has fallen to about 3.45%—near its lowest level since 2022—and now sits below the Federal Reserve’s current target range of 3.50% to 3.75%, signaling that bond investors may be anticipating a faster shift in policy.
In short, Treasury market sentiment is tilting toward the idea that a rate cut could come sooner than previously anticipated. Other market-based indicators are reinforcing that view by assigning higher odds to continued disinflation.
The average of two Treasury-derived inflation gauges now projects five-year inflation in the low 2% range—the mildest reading in a month and not far from the Federal Reserve’s 2% objective. The surge in inflation expectations seen in January has since unwound, signaling that investors have grown less worried about upside inflation risks in recent weeks.
Markets are not infallible, but it would likely require a meaningful upside surprise in the economic data—pointing to renewed inflationary pressure—to overturn the prevailing disinflation narrative. For now, investors show little appetite for betting on a reflationary turn.
The US Federal Reserve experienced an eventful week. On Monday, it contacted New York–based banks to assess their USD/JPY exposure, sparking speculation that Washington could be coordinating with Japan to address the Japanese Yen’s weakness. This development prompted a sharp sell-off in the US Dollar early in the week.
The Fed’s midweek policy meeting resulted in no change to the federal funds rate, which was kept within the 3.50%–3.75% range, in line with expectations. During his press conference, Chair Jerome Powell avoided questions related to politics, his tenure, and the subpoena. However, he pointed to improving economic momentum and reduced risks to both inflation and the labor market.
The US Dollar Index (DXY) has since rebounded toward the 96.90 level, recovering most of its weekly losses after President Donald Trump nominated former Fed Governor Kevin Warsh as the next Fed Chair on Friday. The nomination now awaits Senate approval. Looking ahead, the US is set to release several key data points next week, including the ISM Manufacturing PMI for January, MBA mortgage applications, Challenger job cuts, and weekly initial jobless claims.
EUR/USD is hovering around the 1.1880 area after the US Dollar rebounded and recovered nearly all of its weekly losses. In the coming week, Hamburg Commercial Bank (HCOB) will release Manufacturing, Services, and Composite PMIs for both Germany and the Eurozone. Additional Eurozone data include the ECB Bank Lending Survey and December Producer Price Index (PPI), while Germany will publish December Factory Orders and Industrial Production figures.
GBP/USD is trading near 1.3600 ahead of the Bank of England’s monetary policy announcement on Thursday. Governor Andrew Bailey’s subsequent press conference is expected to shed further light on the central bank’s outlook for interest rates. UK data releases include the final January S&P Global PMIs and the Halifax House Price Index.
USD/JPY is holding close to the 154.50 level, paring earlier gains after Tokyo CPI data indicated easing inflation in January. Headline inflation slowed to 1.5% year-over-year from 2% in December, while core measures eased to 2%, undershooting forecasts. The softer inflation profile reduces pressure on the Bank of Japan to tighten policy.
USD/CAD is trading around 1.3580, with the Canadian Dollar maintaining a slight edge against the greenback despite data showing economic stagnation in November. Monthly GDP was flat following a 0.3% contraction in the prior month and fell short of expectations for modest growth. Upcoming Canadian releases include January S&P Global PMIs and the Ivey PMI.
Gold is trading near the $4,880 area after surrendering all weekly gains. Prices retreated from a record high of $5,598 as profit-taking emerged and the US Dollar strengthened sharply.
Looking ahead: Emerging views on the economic outlook
Scheduled central bank speakers for the week:
Monday, February 2: – Bank of England’s Breeden – Federal Reserve’s Bostic
Tuesday, February 3: – Federal Reserve’s Barkin
Wednesday, February 4: – Federal Reserve’s Cook
Thursday, February 5: – Bank of England Governor Andrew Bailey – Federal Reserve’s Bostic – Bank of Canada Governor Tiff Macklem
Friday, February 6: – European Central Bank’s Cipollone – European Central Bank’s Kocher – Bank of England’s Pill – Federal Reserve’s Jefferson
Central bank meetings and upcoming data set to influence monetary policy decisions
Key economic data and policy events for the week:
Monday, February 2: – Germany’s December Retail Sales – US ISM Manufacturing PMI
Tuesday, February 3: – Reserve Bank of Australia monetary policy decision – US December JOLTS job openings
Wednesday, February 4: – Eurozone January Harmonized Index of Consumer Prices (HICP) – US January ADP employment report
Thursday, February 5: – Australia’s December trade balance – Eurozone December retail sales – Bank of England monetary policy decision – European Central Bank monetary policy decision
Friday, February 6: – Canada’s January employment change – US January nonfarm payrolls – US February Michigan consumer sentiment
Last week, we kicked off a broad review of the key macro forces shaping the stock market, focusing on the health of the economy and earnings expectations. The takeaway was clear: the economy appears to be in solid shape, and consensus forecasts for earnings growth this year are not just positive, but notably strong.
Admittedly, there has been no shortage of headlines and market volatility since then. It would be reasonable to dive into geopolitical developments, market breadth, or the current state of the AI trade. However, at least for now, none of these factors have altered the market’s primary trend. With that in mind, it makes sense to continue our top-down assessment of the major macro drivers.
Having already examined the economy and earnings, the remaining areas to address are inflation, Federal Reserve policy and interest rates, and market valuations. Let’s turn to those next.
What Is Inflation?
The Federal Reserve defines inflation as a sustained rise in the prices of goods and services over time, reflecting a general increase in the overall price level across the economy. Similarly, Investopedia and standard economics textbooks describe inflation as a gradual erosion of purchasing power, manifested through a broad-based increase in the prices of goods and services over time. The International Monetary Fund frames inflation as the pace at which prices rise over a given period, indicating how much more costly a representative basket of goods and services has become.
Or, as I was taught in my very first economics class many years ago, inflation can be summed up as “too much money chasing too few goods.”
In Focus
There is little doubt that inflation has dominated the attention of the Federal Reserve, policymakers, consumers, and financial markets for several years. Unless one has been completely disconnected from events, it is well known that inflation surged in the aftermath of the COVID crisis, driven by trillions of dollars in government stimulus flowing into household bank accounts and severe disruptions across global supply chains.
This surge fueled fears that the United States was heading back toward the inflationary turmoil of the 1970s—a period the Fed ultimately subdued, but only at significant cost to the economy. With the Consumer Price Index approaching double-digit territory in early 2022, such concerns were understandable.
As the pandemic faded and supply chains normalized, inflationary pressures also began to ease. By early 2024, CPI readings had fallen back near pre-pandemic levels, when face coverings were not yet a cultural norm. The key question now is whether the inflation spike has been fully brought under control.
While corporate pricing strategies and consumer behavior—both central drivers of inflation—are inherently difficult to forecast, it remains possible to analyze the components of the CPI and examine the historical forces that have shaped inflation trends.
A Framework for Understanding Inflation
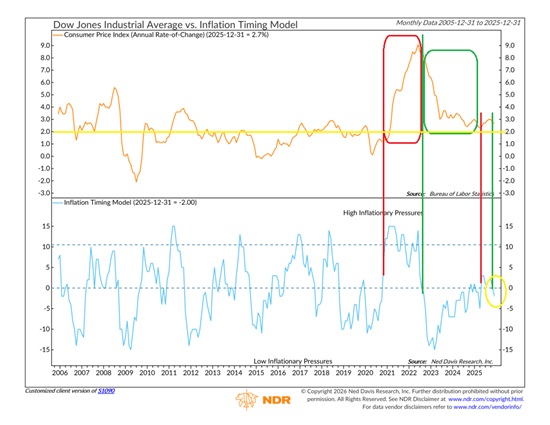
Unsurprisingly, the team at Ned Davis Research Group has already taken this step. In short, there is indeed a model that addresses this—shown below.
The upper chart shows the Consumer Price Index, which represents the inflation rate, while the lower chart displays NDR’s Inflation Timing Model. Reading the model is fairly intuitive. When the blue line rises above zero, it signals that inflation pressures are likely increasing. Historically, readings above 10 have coincided with periods when inflation was significantly above normal levels.
The red box highlights the CPI period from late 2020 through early 2022. During that phase, the model effectively flagged the acceleration in inflation and warned that conditions were set to deteriorate. The model also performed well in the opposite direction in the fall of 2022. While widespread concern about inflation persisted, the model correctly indicated that inflation was poised to ease—and it did.
That downtrend continued until late 2024 or early 2025, when the model briefly suggested inflation was no longer moving in the right direction. However, the signal proved temporary, as the model dropped back below the zero line by the end of 2025. Encouragingly, recent data has validated the model’s current reading, with price pressures generally moderating and the inflation rate falling back below 3%.
Is 3% Becoming the New Inflation Norm?
Inflation skeptics are quick to push back against my relatively calm view, pointing out that inflation remains well above the Federal Reserve’s stated 2% target. From that perspective, they argue the Fed is unlikely to turn accommodative anytime soon. While this logic is understandable, it overlooks two important points: first, the Fed operates under a dual mandate, and second, its preferred inflation gauge—core PCE—differs from the inflation measures most often highlighted in the media.
Crucially, inflation is not the Fed’s sole concern. Maintaining a healthy labor market is equally central to its mission. As a result, the Federal Open Market Committee must carefully balance inflation pressures against broader economic conditions.
This helps explain why the Fed has been cutting interest rates even as inflation remains above target. The labor market has shown signs of weakening, prompting policymakers to act. Equity bulls have welcomed these moves, mindful of the long-standing adage that it rarely pays to fight the Fed. With rates coming down, investors have largely aligned with the bullish camp.
That said, it’s important to recognize that the Fed is not engaged in an aggressive stimulus campaign. Chair Jerome Powell and his colleagues are not attempting to jump-start the economy. Instead, they are seeking to bring interest rates back toward a more neutral, “normal” level—one that balances inflation with labor market stability.
In this context, the prevailing view is that the Fed is willing to tolerate inflation running somewhat above its 2% target while it works to shore up employment conditions. From that standpoint, an inflation rate around 3% may be acceptable—for the time being.
In Summary
The encouraging takeaway is that history suggests a modest amount of inflation can actually be beneficial—supporting stock prices, home values, and corporate earnings. From that perspective, inflation does not appear to be a headwind for equities at present. While this may not be a classic “don’t fight the Fed” environment, the central bank is also not acting as an adversary. As a result, my view is that investors can remain on the bullish path—for now.
The Australian dollar moved higher after stronger-than-expected employment data reinforced expectations of a tighter policy stance from the Reserve Bank of Australia. Seasonally adjusted employment in Australia increased by 65.2K in December, while the unemployment rate declined to 4.1%. Meanwhile, the U.S. dollar firmed after Bloomberg reported that President Trump would pause tariffs on European countries opposing his push over Greenland.
The Australian dollar strengthened against the U.S. dollar on Thursday after seasonally adjusted employment data from Australia reinforced expectations of a tighter monetary policy stance by the Reserve Bank of Australia. Data from the Australian Bureau of Statistics showed employment rose by 65.2K in December, reversing a revised loss of 28.7K jobs in November and well above the market forecast of a 30K increase. Meanwhile, the unemployment rate fell to 4.1% from 4.3%, beating expectations of 4.4%.
Sean Crick, head of labour statistics at the ABS, noted that a rise in employment among people aged 15–24 helped lift overall employment levels and contributed to the drop in the unemployment rate. Meanwhile, the International Monetary Fund has called on the RBA to proceed cautiously, pointing out that inflation has remained above the Bank’s 2%–3% target range for an extended period, despite headline CPI easing faster than expected in November.
U.S. dollar rises as Trump eases tariff threats against Europe
The U.S. Dollar Index (DXY), which tracks the greenback against six major currencies, was steady after posting modest gains in the previous session, trading around 98.80 at the time of writing. The dollar found support after Bloomberg reported on Wednesday that President Donald Trump said he would step back from imposing tariffs on goods from European countries opposing his bid to take control of Greenland. Earlier, Trump had insisted there was “no going back” on his ambitions for Greenland and had threatened to impose new 10% tariffs on eight European Union nations.
Trump also stated that the United States and NATO had “established the framework of a future deal on Greenland,” though he provided no details, leaving the scope and substance of the proposed agreement unclear.
U.S. labor market data has pushed expectations for further Federal Reserve rate cuts back to June, with Fed officials signaling little urgency to ease policy until there is clearer evidence that inflation is moving sustainably toward the 2% target. Morgan Stanley analysts revised their 2026 outlook, now projecting one rate cut in June and another in September, compared with their earlier expectations for cuts in January and April.
In Asia, the People’s Bank of China announced on Tuesday that it would keep its Loan Prime Rates unchanged, with the one-year and five-year LPRs remaining at 3.00% and 3.50%, respectively. Developments in China remain important for the Australian dollar, given the close trade relationship between the two economies.
China’s industrial production grew 5.2% year-on-year in December, accelerating from 4.8% in November, supported by resilient export-led manufacturing. However, retail sales increased just 0.9% year-on-year, falling short of expectations of 1.2% and slowing from November’s 1.3%.
In Australia, the TD-MI Inflation Gauge rose to 3.5% year-on-year in December from 3.2%, while monthly inflation jumped 1.0%, the fastest pace since December 2023 and a sharp acceleration from 0.3% in the previous two months.
RBA policymakers acknowledged that inflation has eased significantly from its 2022 peak, but recent data points to renewed upward pressure. Headline CPI slowed to 3.4% year-on-year in November, the lowest level since August, yet remains above the RBA’s 2–3% target range. Trimmed mean CPI edged down to 3.2% from 3.3% in October.
The RBA assessed that inflation risks have modestly tilted to the upside, while downside risks—particularly from global factors—have eased. Policymakers expect only one additional rate cut this year, with underlying inflation projected to stay above 3% in the near term before easing toward around 2.6% by 2027.
Australian dollar tests the 0.6800 level near the top of its ascending channel
AUD/USD was trading near 0.6790 on Thursday. Daily chart signals show the pair continuing to climb within an ascending channel, reflecting a sustained bullish bias. The nine-day exponential moving average remains above the 50-day EMA, with prices holding above both indicators, reinforcing the positive momentum and keeping upside pressure intact. Meanwhile, the 14-day Relative Strength Index stands at 69.93, close to overbought territory, suggesting momentum is becoming stretched.
The pair is currently challenging immediate resistance at the psychological 0.6800 level, followed by the upper boundary of the ascending channel near 0.6810. A decisive break above the channel could open the door to 0.6942, marking the highest level since February 2023.
On the downside, initial support is seen at the nine-day EMA around 0.6732. A move below this short-term support would undermine bullish momentum, bringing the lower boundary of the ascending channel near 0.6680 into focus, ahead of the 50-day EMA at 0.6656.
Jerome Powell’s eight-year leadership at the Federal Reserve is ending amid significant challenges for the U.S. central bank and divided opinions among policymakers about the right approach to monetary policy. So, what might Powell’s last moves as Chair look like in this environment?
The labor market is still slightly weaker than full employment. Private sector job growth has stalled recently, and although the unemployment rate dropped a bit in December, it remains above what most economists consider the long-term natural rate.
On the inflation front, recent data are more promising. Core CPI inflation fell to 2.6% year-over-year in December from 3.1% in August. Some temporary shutdown effects may be lowering this figure by about 0.1 percentage points, and the Fed’s preferred inflation gauge, the PCE deflator, likely hasn’t improved as much. However, the overall trend for core inflation entering 2026 is clearly downward.
Given this, the Federal Open Market Committee (FOMC) likely has room to continue guiding the federal funds rate toward a neutral level in the near term. The forecast remains two quarter-point rate cuts in March and June, with the rate then holding steady at 3.00%-3.25%.
However, the opportunity for further rate reductions is narrowing. Fiscal stimulus from the recent One Big Beautiful Bill Act is expected to start boosting the economy by spring or summer. Additionally, tariff risks seem to be declining, which could also spur faster growth later in the year. The recent 75 basis points of rate cuts over the past three months will likely provide some support as well.
If labor market and inflation indicators show signs of overheating in the coming months, Powell and the FOMC might opt to pause policy adjustments and leave things steady for the next Chair. This successor could face skepticism from a committee under pressure from the Trump administration. The expectation of stronger economic growth in spring and summer further supports holding rates steady.
For now, the current forecast stands, but there is growing risk that rate cuts may be delayed or reduced compared to the baseline prediction.
WASHINGTON — On January 12, former Federal Reserve chairpersons strongly condemned the ongoing U.S. criminal investigation into current Fed Chair Jerome Powell, describing it as an “unprecedented attempt” to undermine the central bank’s independence.
Two Republican senators also criticized the Trump administration and questioned the Justice Department’s credibility in pursuing charges against Powell, whom President Trump has long aimed to replace amid his push for lower interest rates.
On January 11, Powell disclosed that the Federal Reserve had received grand jury subpoenas and faced threats of a criminal indictment related to his Senate testimony from June.
The controversy centers on a $2.5 billion (S$3.2 billion) renovation project for the Federal Reserve’s headquarters. In 2025, President Donald Trump suggested he might dismiss Chair Jerome Powell due to cost overruns related to the historic building’s refurbishment.
On January 12, former Fed Chairs Ben Bernanke, Alan Greenspan, and Janet Yellen, along with other ex-economic leaders, publicly criticized the Department of Justice’s investigation.
In a joint statement, they condemned the probe as “an unprecedented attempt to use prosecutorial attacks” aimed at undermining the Fed’s independence.
The statement added, “This is typical of how monetary policy is conducted in emerging markets with fragile institutions, often resulting in severe inflation and broader economic dysfunction.”
“Such practices are unacceptable in the United States.”
In an unusual statement on January 11, Mr. Powell criticized the administration, calling the building renovation and his congressional testimony mere “pretexts.” “The possibility of criminal charges stems from the Federal Reserve’s commitment to set interest rates based on its best judgment of the public’s interest, rather than aligning with the president’s preferences,” Powell stated.
He pledged to perform his duties “without political fear or favor.”
Separately, New York Fed President John Williams noted that historically, political interference in monetary policy often results in “unfortunate” consequences such as inflation.
Stocks Reach New All-Time Highs
Despite concerns triggered by the investigation, U.S. stock indices closed at record highs.
Bernard Yaros, lead U.S. economist at Oxford Economics, noted, “The fact that market-based inflation expectations have stayed steady suggests that investors are largely dismissing the probe as having little or no effect on the Fed’s independence.”
The Federal Reserve operates independently with a dual mandate to maintain price stability and low unemployment. Its primary tool is adjusting the benchmark interest rate, which influences U.S. Treasury yields and borrowing costs.
President Trump has frequently criticized Powell, labeling him a “numbskull” and “moron” for the Fed’s policy choices and not cutting rates more aggressively.
On January 12, White House spokeswoman Karoline Leavitt told Fox News that Powell “has proven he’s not very good at his job.” Regarding whether Powell is a criminal, she added, “That’s a question the Department of Justice will have to answer.”
Republicans Push Back Against Investigation
The Justice Department’s investigation has faced backlash from across the political spectrum.
On January 11, Republican Senator Thom Tillis, a member of the Senate Banking Committee, pledged to block the confirmation of any Federal Reserve nominee—including the next Fed chair—until the legal issue is “fully resolved.”
He stated, “The independence and credibility of the Department of Justice are now at stake.”
Another Republican senator, Lisa Murkowski of Alaska, backed Thom Tillis’ stance, describing the investigation as “nothing more than an attempt at coercion.”
Earlier, Senate Majority Leader Chuck Schumer, a leading Democrat, criticized the probe as an assault on the Federal Reserve’s independence.
David Wessel, a senior fellow at the Brookings Institution, warned of serious risks if the Fed were to come under President Trump’s influence.
Politicians might be tempted to keep interest rates low to stimulate the economy before elections, while an independent Fed is expected to set policy focused on controlling inflation and maximizing employment.
Wessel told AFP that if Trump succeeds in swaying the Fed, the U.S. could face higher inflation and reduced willingness from global investors to finance the Treasury.
Powell was originally nominated as Fed chair by Trump during his first term. His chairmanship ends in May, but he may remain on the Fed board until 2028. In 2025, Trump also attempted to remove Fed Governor Lisa Cook over allegations of mortgage fraud.
The Australian Dollar ended its three-day slide on Monday.
ANZ reported a 0.5% decline in job advertisements for December, following a revised 1.5% drop in the previous month.
Meanwhile, the US Dollar weakened after federal prosecutors launched a criminal investigation into Federal Reserve Chair Jerome Powell.
The Australian Dollar (AUD) gained ground against the US Dollar (USD) on Monday, reversing a three-day losing streak. The AUD/USD pair rose as the Greenback weakened, partly due to growing concerns about the Federal Reserve.
Federal prosecutors have launched a criminal investigation into Fed Chair Jerome Powell, focusing on the central bank’s renovation of its Washington headquarters and allegations that Powell may have misled Congress about the project’s details, according to a New York Times report on Sunday.
ANZ Job Advertisements fell by 0.5% in December, following a revised 1.5% decline in November. Meanwhile, household spending rose 1.0% month-on-month in November 2025, slowing from a revised 1.4% increase in October, reflecting consumer caution amid high interest rates and ongoing inflation.
Australia’s mixed Consumer Price Index (CPI) report for November has left the Reserve Bank of Australia’s (RBA) policy direction uncertain. However, RBA Deputy Governor Andrew Hauser stated that the inflation data largely met expectations and indicated that interest rate cuts are unlikely in the near term. Attention now turns to the quarterly CPI report due later this month for clearer insight into the RBA’s upcoming policy decisions.
US Dollar Slides Amid Federal Reserve Uncertainty
The US Dollar Index (DXY), which tracks the Dollar against six major currencies, is weakening and trading near 98.90 amid expectations of a dovish Federal Reserve. Slower-than-anticipated US job growth in December suggests the Fed may keep interest rates steady at its upcoming January meeting.
US Nonfarm Payrolls increased by 50,000 in December, below November’s revised 56,000 and the expected 60,000. Meanwhile, the unemployment rate fell to 4.4% from 4.6%, and average hourly earnings rose to 3.8% year-over-year from 3.6%.
CME Group’s FedWatch tool shows about a 95% chance that the Fed will hold rates steady on January 27–28. Richmond Fed President Tom Barkin welcomed the unemployment drop, describing job growth as modest but steady. He noted hiring remains limited outside healthcare and AI sectors and expressed uncertainty about whether the labor market will see more hiring or layoffs going forward.
US Treasury Secretary Scott Bessent told CNBC on Thursday that the Federal Reserve should continue cutting interest rates, emphasizing that lower rates are the “only ingredient missing” for stronger economic growth and urging the Fed not to delay.
The US Department of Labor reported that Initial Jobless Claims rose slightly to 208,000 for the week ending January 3, just below expectations of 210,000 but above the previous week’s revised 200,000. Continuing claims increased to 1.914 million from 1.858 million, signaling a gradual rise in those receiving unemployment benefits.
The Institute for Supply Management (ISM) revealed that the US Services PMI climbed to 54.4 in December from 52.6 in November, surpassing expectations of 52.3.
ADP data showed a gain of 41,000 jobs in December, improving from a revised 29,000 job loss in November, though slightly below the expected 47,000. Meanwhile, JOLTS job openings dropped to 7.146 million in November from a revised 7.449 million in October, missing forecasts of 7.6 million.
China’s Consumer Price Index (CPI) increased by 0.8% year-over-year in December, up from 0.7% in November but slightly below the 0.9% forecast. On a monthly basis, CPI rose 0.2%, reversing November’s 0.1% decline. Meanwhile, China’s Producer Price Index (PPI) fell 1.9% year-over-year in December, improving from a 2.2% drop the previous month and slightly beating expectations of a 2.0% decline.
Australia’s trade surplus narrowed to 2.936 billion AUD in November, down from a revised 4.353 billion AUD in October. Exports declined 2.9% month-on-month in November, following a revised 2.8% increase the previous month. Imports edged up 0.2% in November, slowing from a revised 2.4% gain in October.
AUD rebounds, testing upper boundary of rising channel around 0.6700
On Monday, AUD/USD trades near 0.6700 as the pair attempts a rebound toward an ascending channel, indicating a renewed bullish outlook. The 14-day RSI at 58.33 remains above the neutral midpoint, supporting upward momentum.
A sustained move back into the channel would reinforce the bullish trend, potentially pushing the pair toward 0.6766—the highest level since October 2024. Further upside could target the channel’s upper resistance near 0.6860.
Immediate support is found at the nine-day EMA around 0.6700, followed by the 50-day EMA at 0.6631. A break below these levels could open the path to 0.6414, the lowest point since June 2025.
Ankur Banerjee provides a preview of the day ahead in European and global markets. Investors remain focused on the escalating conflict between U.S. President Donald Trump and Federal Reserve Chair Jerome Powell, who is pushing back against attempts to exert political control over the Fed and its interest rate decisions.
Meanwhile, growing turmoil in Iran—where over 500 people have reportedly been killed, according to human rights groups—adds to the geopolitical uncertainties shaping market sentiment at the start of 2026, supporting demand for safe-haven assets.
Markets opened Monday with shocking news that the Trump administration had threatened to indict Powell over his Congressional testimony last summer concerning a Fed building renovation. Powell described this as a “pretext” aimed at increasing political influence over monetary policy.
“This issue centers on whether the Fed can continue setting interest rates based on data and economic realities, or if monetary policy will instead be shaped by political pressure and intimidation,” Powell stated.
The initial market reaction saw the dollar weaken and stock futures decline, although the impact on interest rate policy remains unclear. Gold prices surged past $4,600 per ounce as investors sought refuge.
Despite the unsettling news, market responses were measured, with no signs of panic selling as investors await further clarity on the Fed’s independence and the future path of interest rates.
WASHINGTON, DC – DECEMBER 13: U.S. Federal Reserve Board Chairman Jerome Powell speaks during a news conference at the headquarters of the Federal Reserve on December 13, 2023 in Washington, DC. The Federal Reserve announced today that interest rates will remain unchanged. (Photo by Win McNamee/Getty Images)
Markets may now generally anticipate that the Federal Reserve will yield to Trump’s influence and ease interest rates freely once a new Fed chair takes over after Powell’s term ends in May. Futures pricing currently reflects expectations of two rate cuts this year.
With Japanese markets closed on Monday, no cash trading occurred in Treasuries during Asian hours. Attention will shift to the Treasury market when London trading begins.
Key events that could impact markets on Monday include: Germany’s November current account balance and the euro zone Sentix investor confidence index for January.
The ISM service index suggests potential positive revisions for fourth-quarter GDP growth. On Wednesday, the Institute for Supply Management (ISM) reported that its non-manufacturing service sector index increased to 54.4 in December from 52.6 in November, marking the third consecutive month of expansion and the fastest pace of growth in over a year.
The new orders sub-index rose sharply to 57.9 from 52.9, while business activity climbed to 56 from 54.5. Additionally, new export orders improved to 54.2, up from 48.7 in November. Out of 16 surveyed service industries, 11 showed expansion in December.
Conversely, the ISM manufacturing index fell to 47.9 in December from 48.2 the prior month, continuing its contractionary trend for the tenth straight month (a reading below 50 indicates contraction). Only 2 of 17 manufacturing industries—Electrical Equipment, Appliances & Components, and Computer & Electronic Products—reported growth, likely supported by strong data center demand.
ADP’s December report showed private payrolls increasing by 41,000, missing economists’ expectation of 48,000. This follows a loss of 29,000 private jobs in November, meaning just 12,000 private jobs were created over the last two months. Manufacturing shed 5,000 jobs in December, while education and health services added 39,000, and leisure and hospitality gained 24,000 jobs. Regionally, the West lost 61,000 private sector jobs, while the South led with a gain of 54,000.
Residential investment acted as a 5.1% drag on GDP growth during the second and third quarters. Strengthening GDP going forward will depend largely on stabilizing the residential real estate market, which remains sluggish due to high mortgage rates, rising insurance costs, and an oversupply in several key areas. According to the Intercontinental Exchange, prices for U.S. condominiums dropped 1.9% in September and October, with high homeowners association (HOA) fees and insurance expenses cited as major factors. In nine major metropolitan regions, over 25% of condominiums have fallen below their original sale prices. While multiple Federal Reserve rate cuts could help support home prices, the current weakness is fueling deflationary concerns that the Fed needs to address.
If deflation emerges from (1) weak housing and rental prices, (2) low crude oil prices, and (3) deflation imported from China and other struggling global economies, the Fed may need to implement rapid interest rate cuts totaling around 100 basis points. With President Trump expected to nominate a new Fed Chair soon, current Chair Jerome Powell is likely to become a lame duck. Minutes from the December Federal Open Market Committee (FOMC) meeting indicated at least one more 0.25% rate cut is probable, but any further deflationary signals could prompt the Fed to enact much larger reductions in key rates in the coming months.
President Trump is expected to nominate a new Federal Reserve Chair in January who will likely reverse the Fed’s current restrictive policies and adopt a more pro-business stance. Should Kevin Hassett, the current Chair of the Council of Economic Advisors, be appointed, the Fed would gain a strong economic advocate, a development that many find promising and exciting.