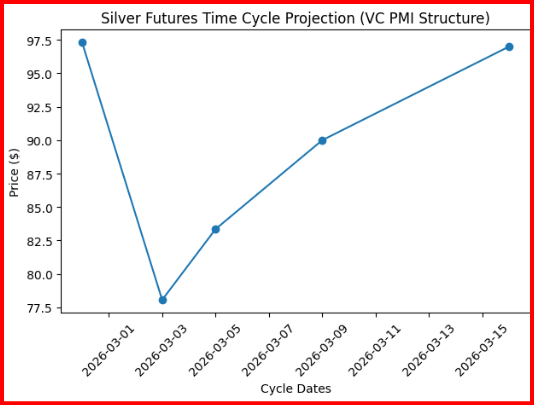
Time-cycle analysis suggests the market is approaching an important reversal window between March 6 and March 9, followed by a secondary expansion phase from March 13 to March 16. Historically, silver tends to produce strong directional moves when periods of volatility compression align with these harmonic time cycles.
The recent consolidation within the $81–$85 range indicates the market is absorbing liquidity after the sharp volatility spike seen earlier in the week. If prices remain supported above the $81–$83 zone, the next major resistance cluster is expected between $90 and $97, an area that aligns with previous structural highs as well as the VC PMI Weekly Sell 1 level. A decisive break above this region could ignite a fresh volatility expansion, potentially resembling past major rallies in silver.
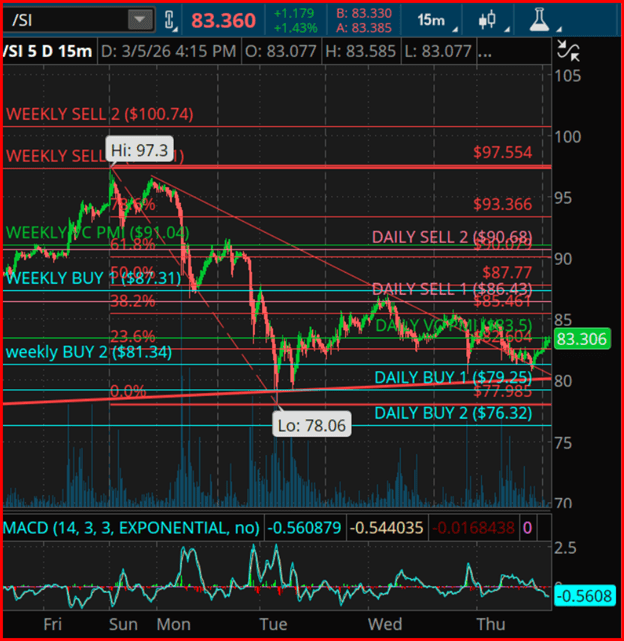
Silver futures are trading around $83.35, stabilizing after an intense bout of volatility that drove prices down from a $97.30 high to $78.06 in just two trading sessions. This roughly $19 price swing over a short period represents a classic volatility expansion phase, which historically tends to be followed by strong directional moves once the market completes its mean-reversion process.
According to the VC PMI framework, the Daily Mean is positioned near $83.50, a level the market is currently attempting to reclaim. A sustained close above this point could trigger bullish momentum, with upside targets at the Daily Sell 1 level around $86.43 and the Weekly Buy 1 level near $87.31.
From a structural perspective, the drop from $97.30 appears to have completed a corrective harmonic retracement pattern, testing several key Fibonacci levels including the 61.8%, 50%, and 38.2% retracements shown on the chart. Ultimately, prices found support slightly below the Weekly Buy 2 level near $81.34, reinforcing the 95% probability mean-reversion zone identified by the VC PMI model when price deviates significantly from its statistical mean.
The time-cycle analysis indicates that silver is nearing a crucial short-term reversal window between March 6 and March 9, followed by another notable cycle expansion phase from March 13 to March 16. These cycles are derived from harmonic timing patterns that often coincide with liquidity shifts in futures markets. When such timing windows align with prices trading close to VC PMI support zones, the likelihood of a directional reversal tends to increase significantly.
Using W.D. Gann’s Square-of-9 geometry, the recent high at $97.30 marks a significant harmonic pivot within the current market cycle. The subsequent pullback toward the $78–$81 region aligns closely with a rotational angle on the Square-of-9 grid, suggesting that the market may have completed a geometric correction before attempting to resume upward momentum.
Key harmonic resistance levels derived from the Square-of-9 now cluster around $90, $93, and $97, which closely correspond with the VC PMI Sell 1 and Sell 2 resistance zones.
If prices continue to hold above the $81–$83 support area, silver could enter a new expansion phase targeting the $90–$97 region during the next cycle window. Historically, volatility expansion phases in precious metals often precede strong upside moves, and the tightening price structure within the current consolidation suggests that a breakout may develop as the market approaches mid-March.
Sources: Patrick MontesDeOca

Leave a comment