Key Takeaways
- The benchmark 10-year Treasury yield is testing critical support, with downside pressure beginning to build.
- Equities and bond yields are sliding in tandem — an unusual combination that may reflect deteriorating macro-risk conditions.
- A strengthening US dollar alongside declining yields could point to a broader defensive rotation across markets.
Last week, attention was drawn to the danger zone in the CBOE Volatility Index. Historically, when Wall Street’s “fear gauge” climbs into the mid-20s, equity markets have tended to experience heightened turbulence.
Now, focus shifts to the benchmark 10-year US Treasury yield. Recently, declining yields have supported the S&P 500 — particularly small- and mid-cap shares — since the so-called Liberation Day and the development of the expansive One Big Beautiful Bill Act (OBBBA). Additional fiscal stimulus or tax relief may still be forthcoming, as suggested by Donald Trump during Tuesday night’s State of the Union address.
Importantly, the surge in yields last April and May was not confined to the United States. Global bond markets reached multi-decade highs, pulling US Treasuries higher in tandem. Despite narratives around “selling America,” the primary US bond bear market unfolded between August 2020 and October 2023, when the 10-year yield climbed sharply from 0.504% to 4.997%. The past two and a half years have largely represented a consolidation phase rather than a fresh structural breakout.
The key question now: is that consolidation nearing resolution — and if so, in which direction?
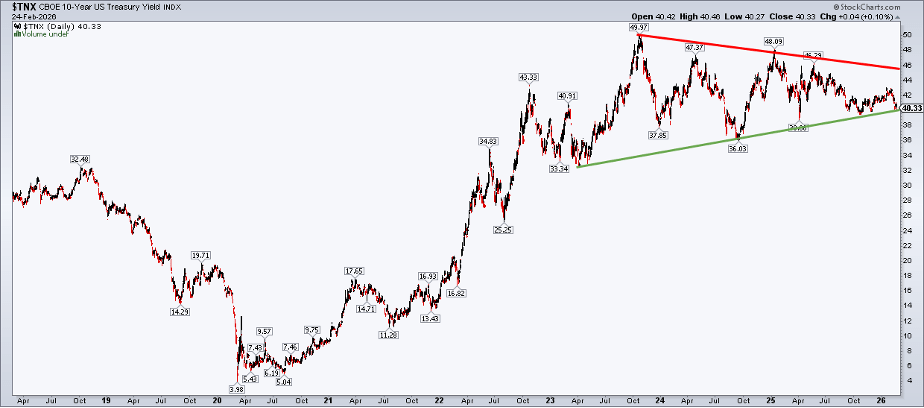
10-Year Treasury Yield: A historic tightening pattern after the major bond bear market. Chart courtesy of StockCharts.com.
Treasuries Under the Spotlight
The chart below suggests that the 10-year Treasury yield could be slipping beneath a critical support level. A brief upside breakout in January quickly reversed as sellers stepped in, and now the benchmark rate is hovering near the 3% mark. It’s worth reminding traders that diagonal trendlines can be unreliable, while horizontal support and resistance levels tend to carry more weight. Additionally, log-scale charts are generally better suited for evaluating wide swings in price or yield.
With those caveats noted, what is the chart signaling? Trading below both the 50-day and 200-day moving averages, the primary trend favors Treasury price bulls (and lower yields). Meanwhile, the RSI has eased back toward the 30 level after failing to reach 70 during the fourth-quarter rate advance. The green upward-sloping support line is now pivotal — a decisive break beneath it, along with a drop below the late-2025 low of 3.947%, could push the 10-year yield down into the low 3% range.
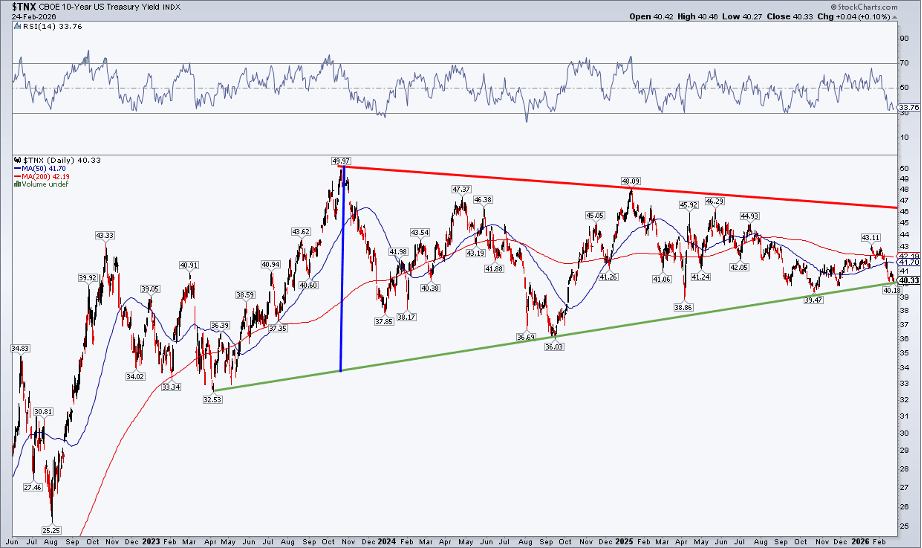
10-Year Treasury Yield: Multi-Year Consolidation With Key Support at Risk (Log Scale). Chart courtesy of StockCharts.com.
In isolation, increasing exposure to Treasuries would be logical if yields break down and bond prices attract strong demand. But stepping back with an intermarket perspective, the bigger question becomes: what would that move signal for the broader financial markets?
A Potential Shift in the Stock–Bond Dynamic?
For stocks, a move toward 3–4% intermediate-term rates would likely coincide with softer economic conditions — perhaps a weak jobs report, sharply cooling CPI or PCE inflation, a downturn in sentiment indicators such as the ISM Manufacturing survey, or another disappointing Retail Sales release.
That said, with the fourth-quarter earnings season mostly wrapped up — including NVIDIA’s (NASDAQ: NVDA) results released Wednesday — it would probably take truly bleak off-season earnings updates or a wave of negative preannouncements to significantly rattle equities.
Another potential driver of a renewed bond bull market could be the ever-intensifying AI theme. In a “sell first, ask questions later” climate, fresh cautionary analyses or existential-impact discussions around artificial intelligence could further unsettle investors and sustain demand for safe-haven assets.
When Trading Ranges Start to Break Down
Regardless of the underlying catalyst, it’s evident that stocks and bonds are no longer moving in sync the way they did last spring and summer. The S&P 500 — like the 10-year Treasury yield — has been edging lower in recent weeks. We’re now nearly a month past the SPDR S&P 500 ETF Trust (SPY) intraday record of $697.84. Although much attention has focused on the tight trading range since late November, one could argue that a rounded-top formation is beginning to take shape.
A glance at the RSI momentum oscillator reinforces this view. Momentum has been trending lower since July. Much like a ball tossed into the air slows before changing direction, RSI often decelerates ahead of a price reversal. The unfolding narrative could be this: bond yields break down first — and equities eventually follow.
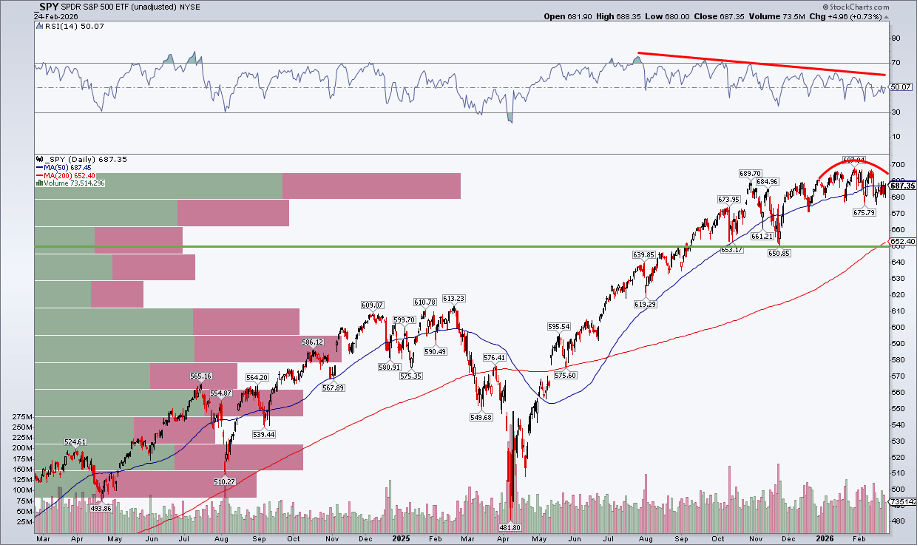
SPY: Emerging Rounded-Top Pattern, RSI Deteriorating, 200-Day Moving Average Around $650. Chart courtesy of StockCharts.com.
Don’t Overlook the Dollar
Largely flying under the radar is the US Dollar Index (USD). The greenback carved out a low near 95.55 around the same time U.S. large-cap equities peaked. Since then, the 98 level has surfaced as a potential breakout zone.
A setup featuring falling Treasury yields, declining stocks, and a strengthening dollar would reflect a classic risk-off macro environment. Based on a measured-move projection, the USD could target the 100 area — just shy of the zone where the dollar encountered resistance from May through November 2025.
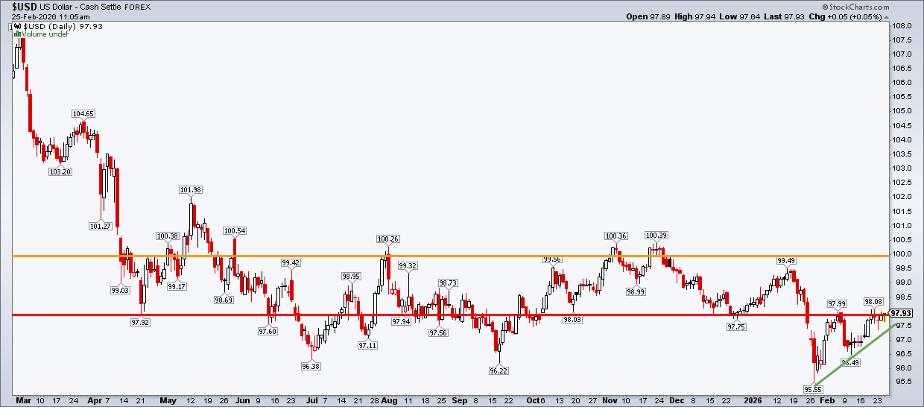
US Dollar Index: Short-Term Ascending Triangle Pattern Points Toward 100. Chart courtesy of StockCharts.com.
The Bottom Line
Is this a doomsday forecast? Not at all. Market corrections are a normal part of the cycle. On average, the S&P 500 experiences an intra-year drawdown of about 14.2%, yet it has still finished higher in 35 of the past 46 years.
Rather than sounding alarms, this is simply a cross-asset check-in as we head into a month that has historically delivered heightened volatility. I tend to think of March as October’s little brother — price swings can become exaggerated. And with the CBOE Volatility Index still hovering around 20, disciplined risk management deserves to remain front and center.
Sources: Mike Zac

Leave a comment