The February 26–March 3 cycle represents a projected volatility expansion window. If price maintains support above the weekly mean and regains upside momentum, the next bullish targets come in at $98, $105, and potentially $120. However, a breakdown below the $85.39 daily Buy-2 level would postpone the expansion phase and shift the market back into a deeper accumulation range between $81.85 and $79.71.
Silver futures are currently trading within a structured VC PMI mean-reversion model, signalling a transition from distribution into a fresh decision phase as price oscillates around both the daily and weekly averages. Within the VC PMI framework, the mean represents equilibrium — the point where supply and demand balance. Moves toward Buy-1/Buy-2 or Sell-1/Sell-2 define statistically extreme zones, carrying a 90%–95% probability of reverting back toward the mean.
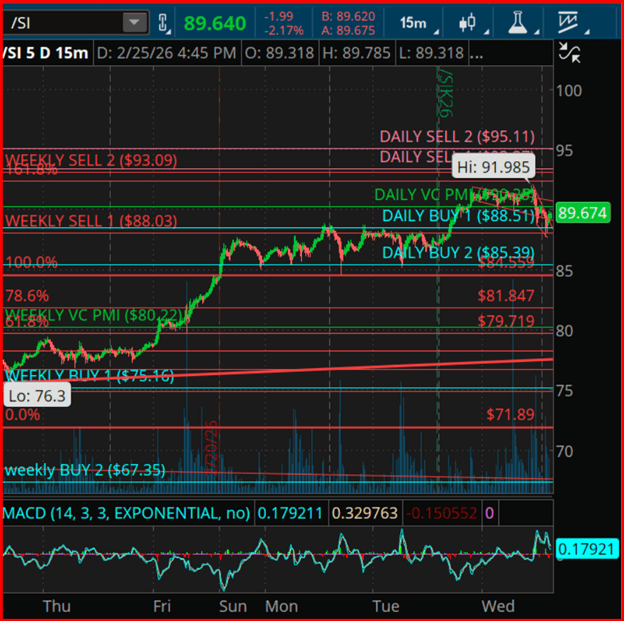
Around the $89 area, silver has pulled back from upper resistance and is now rotating toward the daily mean in the $89–$90 zone. The weekly Sell-1 level at $88.03 and Sell-2 at $93.09 frame the upper distribution band. A decisive close above $93.09 would confirm a bullish breakout into the next fractal structure, flipping resistance into support and opening harmonic upside projections toward $98–$105 based on Square of 9 geometric expansion.
On the downside, failure to sustain trade above the weekly mean near $80.22 would keep silver locked in a broader consolidation pattern. In that scenario, Buy-1 at $75.16 and Buy-2 at $67.35 define longer-term accumulation levels.
Time-cycle analysis highlights February 26 to March 3 as a pivotal rotational window — a period when corrective phases often conclude and directional momentum emerges. This timing aligns with the current consolidation around the mean, increasing the probability of volatility expansion into early March. A secondary cycle window between March 8 and 12 historically signals either continuation or reversal, depending on whether price holds above or below the mean established during the initial cycle.
These cyclical harmonics are derived from recurring liquidity patterns and repetitive market behavior rather than macro fundamentals, underscoring the quantitative foundation of the VC PMI framework.
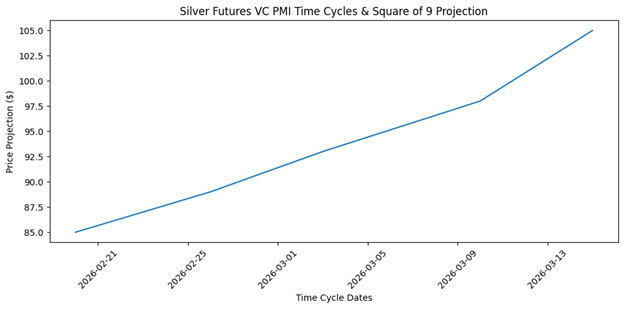
Square of 9 geometry reinforces the current technical framework, highlighting harmonic resistance around $93 and $100 as key angular levels projected from prior lows and rotational pivot points. On the downside, support harmonics cluster near $85, $81.85, and $79.71, creating a geometric staircase of demand zones where the probability of institutional accumulation increases. When time and price harmonics converge, markets tend to generate accelerated directional moves — particularly if price pushes above the Sell-2 extreme or breaks below the Buy-2 threshold.
By integrating VC PMI, cyclical timing analysis, and Square of 9 geometry, this methodology offers a structured, rules-based trading approach. The emphasis remains on statistical probability, market structure, and disciplined execution rather than emotional decision-making.
Sources: Patrick MontesDeOca

Leave a comment