A few months ago, a government shutdown led to a missed CPI release because the Bureau of Labor Statistics (BLS) lacked sufficient data to calculate the October 2025 figure. The bigger issue, however, was methodological: when compiling the November index, the BLS was effectively required to assume that prices in several major categories—especially rents—were unchanged in October. This created an artificial drop in year-over-year inflation.
While some of that distortion has already begun to reverse, a more significant rebound is expected in a few months when the Owners’ Equivalent Rent (OER) survey rotation triggers a sharp offsetting increase—precisely six months after the initial dip. Until that adjustment plays out, inflation data will remain hard to interpret, and the annual comparisons will understate true price pressures. So claims that the latest report shows the smallest yearly increase in core inflation since 2021, suggesting the Federal Reserve is near its target, are misleading.
In reality, core year-over-year inflation is roughly 0.25%–0.3% higher than reported. Markets for CPI fixings already anticipate headline inflation rising to about 2.82% in four months—not because of energy prices, but due to this statistical catch-up.
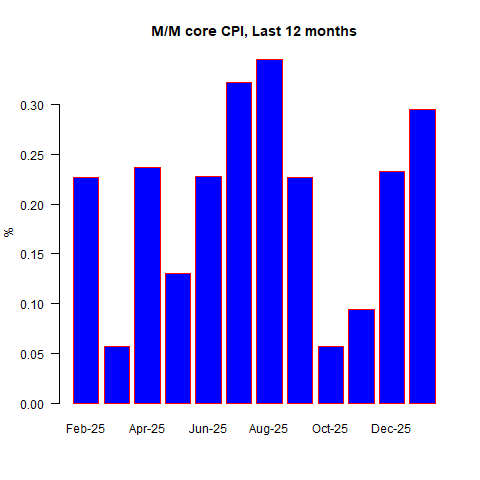
January is typically a challenging month for inflation data anyway, as businesses often offer discounts in December before implementing annual price hikes in January. Because these adjustments are irregular, they are difficult to seasonally adjust, making January surprises common. This time, consensus forecasts called for a 0.27% month-over-month rise in headline CPI and 0.31% in core, with some estimates—such as from Barclays—as high as 0.39% for core. Much of the speculation centered on whether remaining tariff-related price increases would be passed through at the start of the year. Ultimately, they were not. The actual figures came in at +0.17% for headline and +0.30% for core.
The weaker headline reading was largely due to gasoline pricing dynamics. Although gas prices increased over the course of January, the monthly average was still lower than December’s average, because prices had fallen sharply in December. Since the BLS calculates CPI based on average monthly prices rather than end-of-month levels, this produced a softer headline figure.
Core inflation, meanwhile, appeared close to target at first glance: the 2.5% year-over-year rate is the lowest since March 2021. Yet the 0.30% monthly increase was the third-highest in the past year and translates to an annualized pace of 3.6%. That hardly signals a smooth return to 2% inflation—raising questions about whether it is truly “mission accomplished” for the Fed.
Core inflation was also somewhat flattered by a sharp 1.84% month-over-month decline in used car prices. In reality, used car prices did rise in January, but by less than the typical seasonal pattern, which translated into a sizable seasonally adjusted drop and created a noticeable drag on the core figure. (That said, it’s important not to dismiss components simply because they don’t align with the broader narrative.) Overall, core goods inflation slowed to 1.1% year over year from 1.4%, while core services edged down to 2.9% from 3.0%.
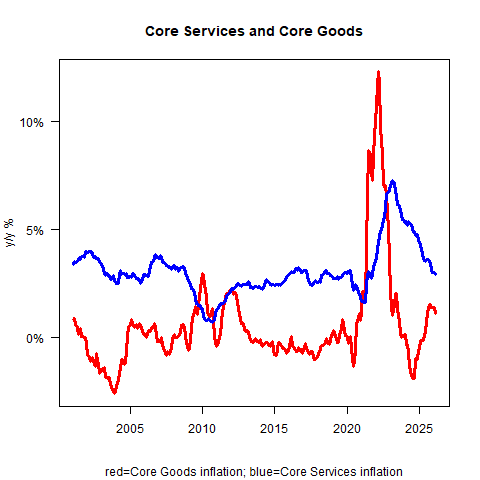
Although core goods inflation declined more than expected due to the sharp move in used cars, some moderation isn’t surprising. The real issue isn’t whether core goods will reaccelerate to 3–4%, but whether it remains in positive territory or slips back into the persistent deflation that characterized the sector for many years. That distinction matters, even if core goods make up only about 20% of the CPI basket. Until recently, the narrative centered on tariffs; going forward, it may shift toward onshoring. The decades-long trend of goods deflation—driven by offshoring production to low-wage countries—may not reassert itself if manufacturing activity continues to migrate back. That’s the broader theme to monitor, though it’s not the main takeaway from January 2026’s data.
On autos specifically, new car prices posted a modest increase. It’s worth considering how changes in sales composition might evolve now that electric vehicles are no longer being actively promoted by the executive branch. Traditional gasoline-powered cars tend to be cheaper upfront, so if buyers shift back toward them—absent tax incentives for EVs—the average transaction price could decline. However, it’s unclear how significantly overall sales patterns will change, or how production strategies will adjust now that automakers may feel less pressure to meet EV quotas. It’s also uncertain how granular the Bureau of Labor Statistics survey is in accounting for shifts in fleet composition. If there is any measurable impact on CPI, it would likely be slightly negative—and probably modest in size.
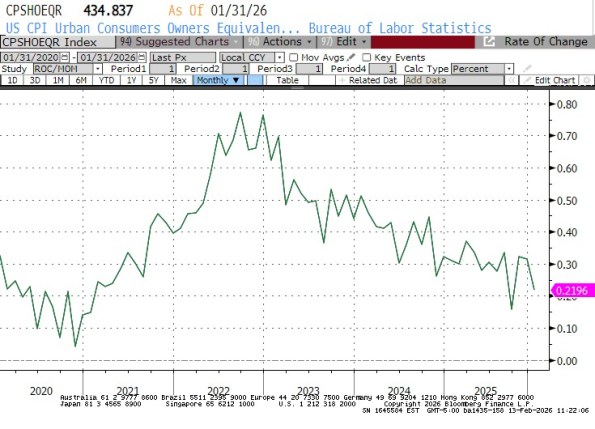
As for rents, Owners’ Equivalent Rent (OER) rose 0.22% month over month, down from 0.31% previously, while Rent of Primary Residence increased 0.25%, slightly below last month’s 0.27%. The month-to-month trend in OER shows a clear deceleration—though notably, it omits the artificial zero recorded in October due to the earlier data disruption.
While the slowdown is evident, my model suggests the pace should now be stabilizing around this level rather than continuing to decline sharply. In other words, rents are cooling, but likely nearing a plateau. That isn’t the defining story of January 2026—but it may well become one of the central inflation themes for the rest of 2026.
Medicinal drug prices slipped 0.15% month over month. Some observers had anticipated a much larger decline, partly due to efforts by the Trump Administration to push manufacturers to align U.S. drug prices more closely with those abroad. So far, however, no clear downward trend is evident. A potentially more consequential development is the Trump RX initiative, aimed at increasing pricing transparency and reducing the role of intermediaries in the highly opaque pharmaceutical distribution chain—long dominated by three major wholesalers and three large pharmacy benefit managers.
If successful, it could meaningfully reduce out-of-pocket drug costs for consumers. That said, when medications are paid for by insurers rather than directly by households, the impact does not show up straightforwardly in the CPI, appearing only indirectly—an accounting nuance that complicates interpretation. In short, consumer drug prices may decline, but the timing and visibility of that effect in CPI data remain uncertain.
The most encouraging element of the report was the continued slowdown in core services excluding rents—often referred to as “supercore” inflation—which eased further even as airfares jumped 6.5% on the month.
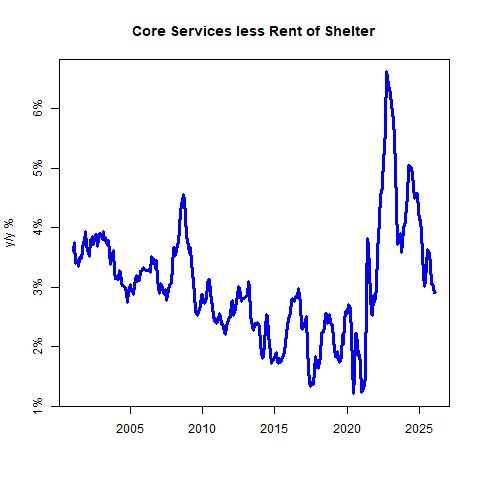
Gotcha. The apparent improvement in “supercore” inflation is another illusion created by the missing October data, which flatters the year-over-year comparison. On a month-over-month basis, core services ex-rents actually surged 0.59% (seasonally adjusted)—the largest increase in a year.
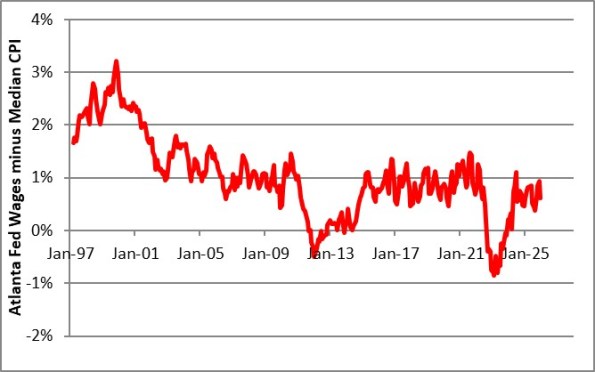
Even so, the broader trend may still be one of gradual cooling, particularly as median wage growth continues to decelerate. Admittedly, that data is also somewhat noisy at the moment. Still, the gap between median wage growth and median inflation remains around 1%, suggesting real income growth is positive, even if inflation progress is bumpier than headline figures imply.
There are tentative signs that wage growth’s downward drift may be stabilizing. If so, that would naturally limit how quickly supercore inflation can cool. At the same time, brewing cost pressures in insurance markets are likely to surface over the next six months. Still, none of that defines January 2026.
The real story this month is that inflation data remain clouded by the government-shutdown gap. The missing October observations continue to flatter year-over-year comparisons, overstating the degree of progress. That statistical quirk makes it easier for the Administration to claim victory, even though underlying inflation does not appear to be cleanly converging back to target.
Assuming the Federal Reserve recognizes these distortions, the policy outlook seems relatively straightforward. Core inflation—abstracting from the shutdown gap—appears to be running near 3.5%, labor market data have surprised to the upside, and the current Fed leadership has shown little inclination to accommodate political pressure. Under those conditions, there is scant reason to expect a near-term adjustment in overnight rates; if anything, the argument for tightening may be stronger than for easing.
To be fair, rents continue to decelerate even after adjusting for the October distortion, though my model suggests that slowdown is unlikely to persist much further. Even if it does, a return to outright housing deflation seems improbable. Moderation in supercore inflation is encouraging, but probably insufficient to deliver the degree of cooling the Fed would require. Core goods inflation also looks to have peaked; the open question is whether it settles into low positive territory or slips back into deflation.
Taken together, my modeling suggests that median inflation around 3.5% (excluding the shutdown effect) may represent something close to a new equilibrium. It’s not unreasonable to see constructive signals in the recent data, but neither do they justify expectations of imminent easing. If disinflation trends persist and leadership dynamics shift—potentially with someone like Kevin Warsh assuming the chair—the door to rate cuts later in the year could open.
But that is not January 2026’s story.
Sources: Michael Ashton

Leave a comment