- Pump.fun slid 11% on Wednesday from its 50-day EMA and now risks breaking below the 20-day EMA
- Story has fallen more than 6% in the past 24 hours and is closing in on the $2 psychological floor
- Pudgy Penguins is retesting the 50-day EMA as buying strength weakens following Wednesday’s 9% pullback
Pump.fun (PUMP), Story (IP), and Pudgy Penguins (PENGU) have come under strong selling pressure in the past 24 hours. PUMP and IP were unable to break above their 50-day Exponential Moving Average (EMA), triggering Wednesday’s retreat, while PENGU currently sits on its 50-day EMA. Overall, technical indicators continue to point to a bearish setup given the ongoing downward trend.
Weakening Bullish Momentum Puts Pump.fun at Risk of Further Downside
Pump.fun trades above the 20-day EMA at $0.002248 at press time on Thursday, following an 11% drop from the 50-day EMA at $0.002624 on the previous day, breaking the eight-day streak of uptrend.
If the meme-coin launchpad token slips below $0.0002248, losses could deepen toward the $0.002000 psychological level, with further downside targeting the S1 Pivot at $0.001262.
Daily-chart indicators show fading buyer strength: the RSI has eased to 51 and is drifting toward the midpoint, while the MACD has flattened, with shrinking green histograms pointing to weakening bullish momentum.
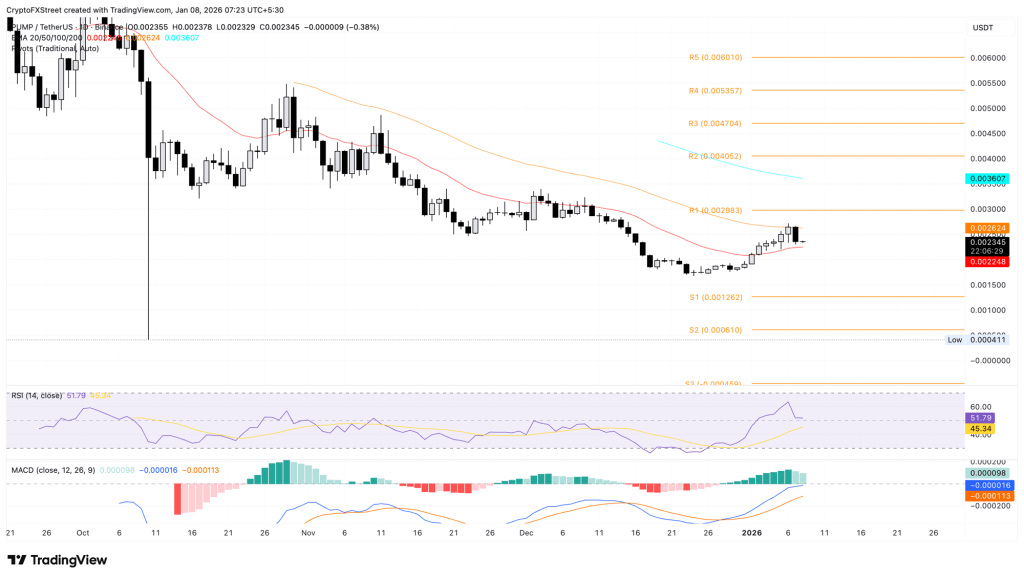
PUMP/USDT daily price chart.
If PUMP rallies back above the 50-day EMA at $0.002624, the next upside target would be the R1 Pivot Point at $0.002983.
Story hits the crucial crossroads at $2.00
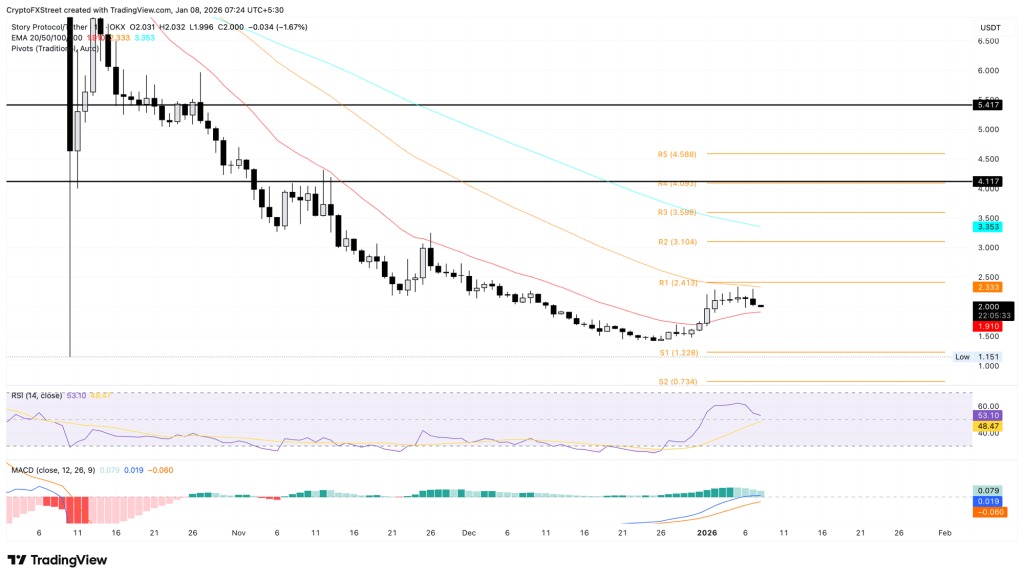
Story trades around $2.00 at the time of writing on Thursday, marking its third consecutive bearish day. The meme coin is down 2%, extending the 4% decline from the previous day and risking the 20-day EMA at $1.91.
If IP falls below $1.91, it could further decline to the S1 Pivot Point at $1.22.
Similar to PUMP, the technical indicators on the daily chart point to declining buying pressure in Story. The RSI is at 53, slipping closer to the halfway line while the MACD approaches the signal line risking a crossover which would indicate renewed bearish momentum.
PENGU/USDT daily price chart.
To reinstate an upward trend, IP should exceed the 50-day EMA at $2.33, potentially targeting the R1 Pivot Point at $2.41.
Pudgy Penguins Faces a Potential Breakdown Below the 50-Day EMA
Pudgy Penguins is currently trading above the 50-day EMA at $0.01179 after Wednesday’s 9% pullback. At press time, PENGU is hovering near $0.01200, just below the R1 Pivot Point at $0.01193.
A drop beneath this zone could push the token toward immediate support at the 20-day EMA of $0.01091, near the key $0.01000 psychological level.
Like PUMP and IP, PENGU’s daily chart signals weakening demand, with technical indicators pointing to fading buying strength.
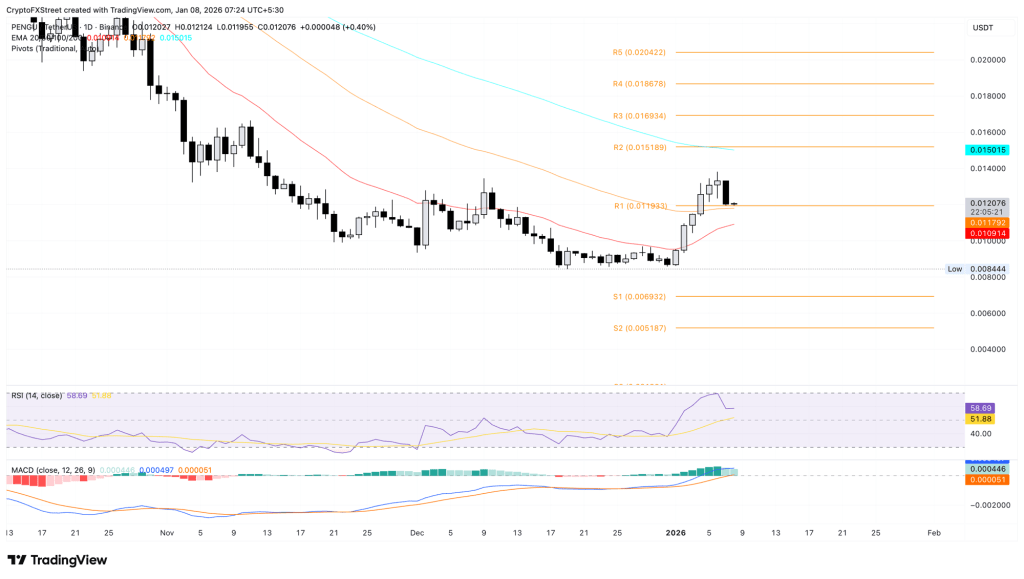
PENGU/USDT daily price chart.
On the upside, a recovery in PENGU could push the price toward the R1 Pivot Point at $0.01518.
Sources: Fxstreet

Leave a comment