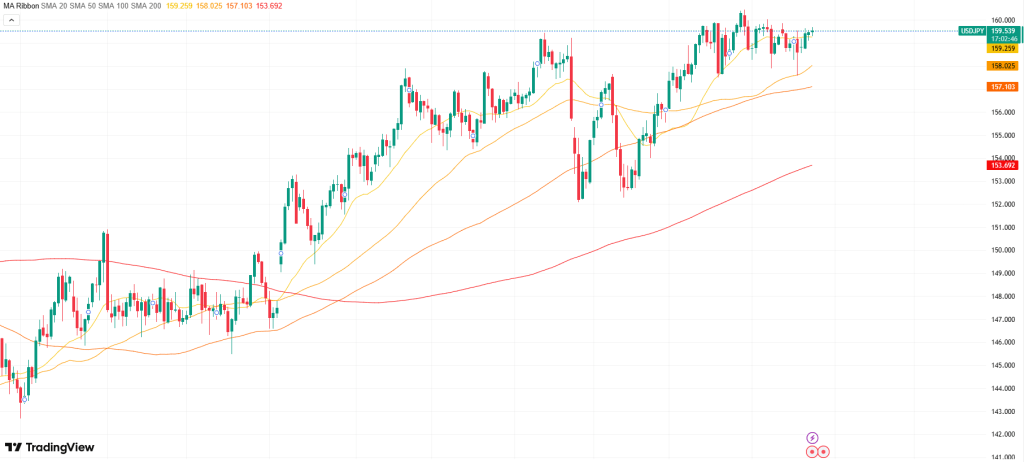
USD/JPY advances to its highest level in nearly two weeks during Thursday’s Asian session, supported by a mix of favorable factors. The Japanese Yen remains under pressure due to economic concerns linked to shipping disruptions in the Strait of Hormuz and expectations that the Bank of Japan may delay further rate hikes. At the same time, tensions between the United States and Iran over the key waterway continue to support the safe-haven US Dollar despite an extended ceasefire, providing an additional boost to the pair. Still, concerns about possible intervention limit further gains.
Technical analysis
The USD/JPY pair holds firm below the 23.6% Fibonacci retracement of the recent rally from last week’s swing low near 157.60, finding support at the 100-period EMA on the 1-hour chart. However, the Moving Average Convergence Divergence (MACD) has dipped slightly into negative territory, while the Relative Strength Index (RSI) around 48 points to neutral-to-mildly weak momentum.
Overall, momentum signals suggest that bullish strength is easing, though not enough to break the immediate intraday support near the 23.6% Fibonacci level at 159.15, which is reinforced by the 100-period EMA around 159.07. A deeper decline could bring the 38.2% retracement at 158.85 into focus, followed by additional Fibonacci support levels at 158.60, 158.36, and 158.01. If selling pressure intensifies further, the 157.57 swing low could emerge as a more significant downside support.
Fundamental Analysis
A short-term extension of the ceasefire between the United States and Iran triggers some selling pressure on the US Dollar (USD), weighing on USD/JPY. However, persistent economic concerns tied to the standoff in the Strait of Hormuz—where shipping disruptions and blockades continue despite the truce—help keep the Japanese Yen (JPY) under pressure and limit the pair’s downside.
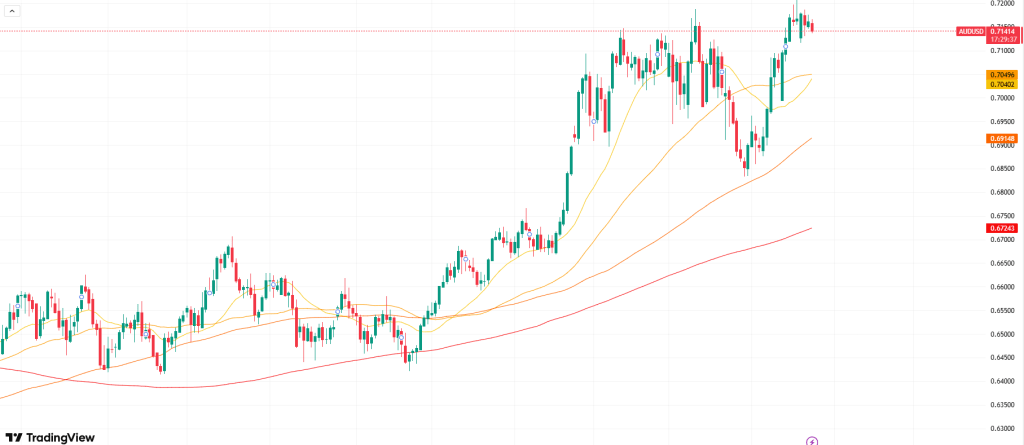
AUD/USD advances to around 0.7155 in early Asian trading on Thursday. President Trump noted there is “no set timeline” for the Iran conflict, while Australia’s preliminary PMIs returned to expansion territory in April.
The AUD/USD pair strengthens to around 0.7155 in early Thursday Asian trading, supported by improved risk sentiment after US President Donald Trump extended the Iran ceasefire. The move has eased concerns over a renewed conflict that previously drove energy prices higher, lending support to the Australian Dollar against the US Dollar. Investors now await the preliminary S&P Global PMI data due later in the day.
Trump stated that the ceasefire extension comes at Pakistan’s request as Washington looks for a unified proposal from Iran, helping calm market tensions. However, risks persist as Iran maintains control over the Strait of Hormuz and continues hostile actions in the region. Iranian parliament speaker and chief negotiator Mohammad Bagher Ghalibaf warned that reopening the key shipping route would be “impossible” amid what he described as ongoing violations of the ceasefire by the US and Israel.
Lingering geopolitical tensions in the Middle East could still support the safe-haven US Dollar and limit further upside in the pair.
On the data front, Australia’s preliminary S&P Global PMIs showed a return to expansion in April. The Manufacturing PMI rose to 51.0 from 49.8, the Services PMI improved to 50.3 from 46.3, and the Composite PMI climbed to 50.1 from 46.6, indicating a modest recovery in business activity.
WTI extends its rally for a third consecutive session, climbing to its highest level in nearly two weeks.
Persistent risks around the Strait of Hormuz offset the impact of the extended US-Iran ceasefire, lending support to oil prices.
Overall, the underlying fundamentals remain supportive of the bullish outlook, suggesting further upside potential.
WTI crude briefly surged to the $95.80–$95.85 region during the Asian session—its highest level in about a week and a half—before losing momentum and pulling back toward the lower end of the daily range. It currently trades just above $92.00, still holding modest gains of around 0.30% on the day.
Although the US-Iran ceasefire has been temporarily extended, markets remain doubtful about any lasting easing of tensions given the lack of meaningful progress in negotiations. Ongoing clashes around the Strait of Hormuz continue to raise concerns about potential supply disruptions, keeping a geopolitical risk premium embedded in oil prices and supporting a third consecutive day of gains.
Further underpinning the market, US President Donald Trump confirmed that the naval blockade of Iranian ports will remain in place. At the same time, Iran’s Tasnim news agency reported that Revolutionary Guard naval forces seized two vessels and that multiple container ships came under fire in the Strait. Coupled with an unexpected drop in US crude inventories, these developments add to the bullish tone.
That said, the latest upward spike was partly driven by unverified reports of an attack on Tehran, and the rally quickly lost steam once no concrete news followed. This calls for some caution among bullish traders, even though the broader fundamental backdrop still points to a bias for further upside in crude prices.
USD/CAD finds it difficult to build on the gains recorded over the past two days amid conflicting signals.
Tensions around Hormuz lend support to the safe-haven US dollar, while higher oil prices continue to bolster the Canadian dollar.
At the same time, differing policy outlooks between the Fed and the BoC are also limiting further upside in the pair.
USD/CAD eases slightly from a three-day high reached during Thursday’s Asian session but struggles to gain clear direction amid mixed fundamentals. While a temporary extension of the US-Iran ceasefire offers some relief, tensions surrounding the Strait of Hormuz continue to support the safe-haven US dollar. At the same time, higher crude oil prices lend strength to the Canadian dollar, limiting further upside in the pair.
US President Donald Trump announced on Tuesday an indefinite extension of the ceasefire with Iran just hours before its expiry, while reaffirming that the US Navy blockade of Iranian ports would remain in place. Iran, however, has made the lifting of the blockade a strict condition for resuming negotiations. Adding to tensions, Iran’s Revolutionary Guard reported firing on three vessels and seizing two in the Strait of Hormuz. These developments keep geopolitical risks elevated, helping the US dollar hold onto recent gains and offering support to USD/CAD.
Despite this, the dollar lacks strong bullish momentum as expectations for a hawkish Federal Reserve stance continue to fade, with markets increasingly pricing in a rate cut by year-end. In contrast, expectations are building for a possible rate hike by the Bank of Canada in April. Meanwhile, ongoing US-Iran tensions are pushing oil prices higher for a third consecutive day, benefiting the commodity-linked Canadian dollar and capping USD/CAD gains. This backdrop suggests caution, with traders likely waiting for stronger confirmation before calling a near-term bottom.
Looking ahead, attention turns to upcoming US data, including weekly jobless claims and flash PMI readings due later in the North American session. These releases could influence US dollar demand, while oil price movements and geopolitical developments remain key drivers, likely sustaining volatility and shaping trading opportunities for the pair.
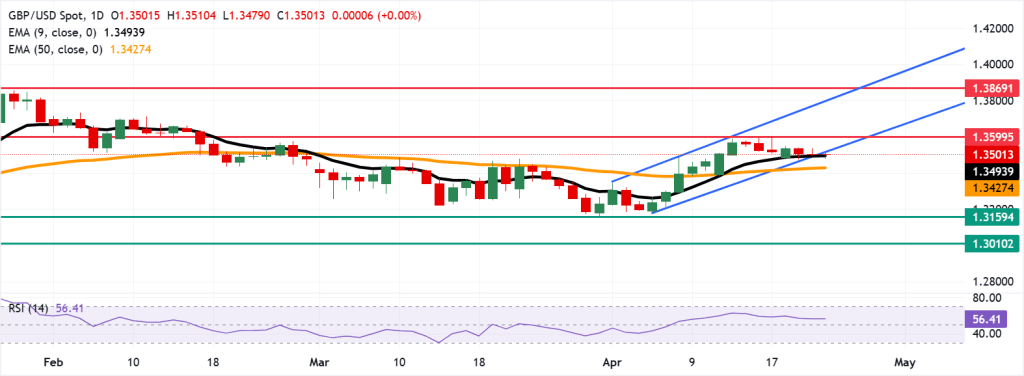
GBP/USD could recover toward its two-month peak at 1.3599.
The 14-day RSI, hovering around 56, signals bullish momentum while remaining below overbought territory.
Nearby support is seen at the nine-day EMA, currently at 1.3493.
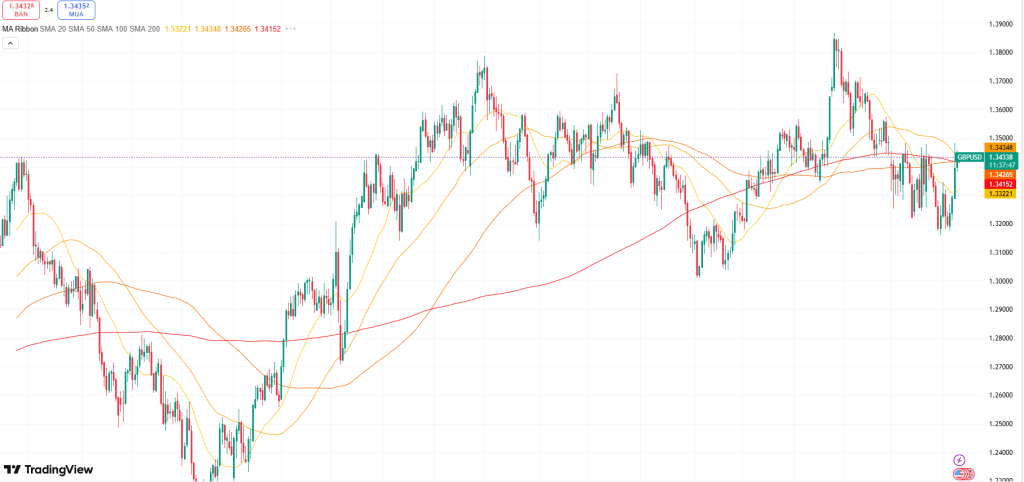
GBP/USD has edged lower for a third straight session, hovering around 1.3500 in Thursday’s Asian trading. Daily chart signals point to a possible bearish turn as the pair slips below its ascending channel.
Even so, the broader tone remains cautiously bullish. The pair is still holding just above the nine-period EMA and well above the 50-period EMA, suggesting underlying buying interest. Meanwhile, the 14-day RSI near 56 reflects healthy momentum without entering overbought territory, leaving scope for further gains on pullbacks.
If price re-enters the ascending channel, it could retest the two-month high at 1.3599 (April 17). A continued move higher may target the channel’s upper boundary near 1.3810, with a breakout potentially opening the door toward 1.3869, the highest level since September 2021.
On the downside, immediate support is seen at the nine-day EMA around 1.3493, followed by the 50-day EMA at 1.3427. A decisive break below these levels could shift momentum, exposing the March 31 low of 1.3159 and then 1.3010, the weakest level since April 2025.
Heightened geopolitical risks are weighing on gold’s short-term outlook.
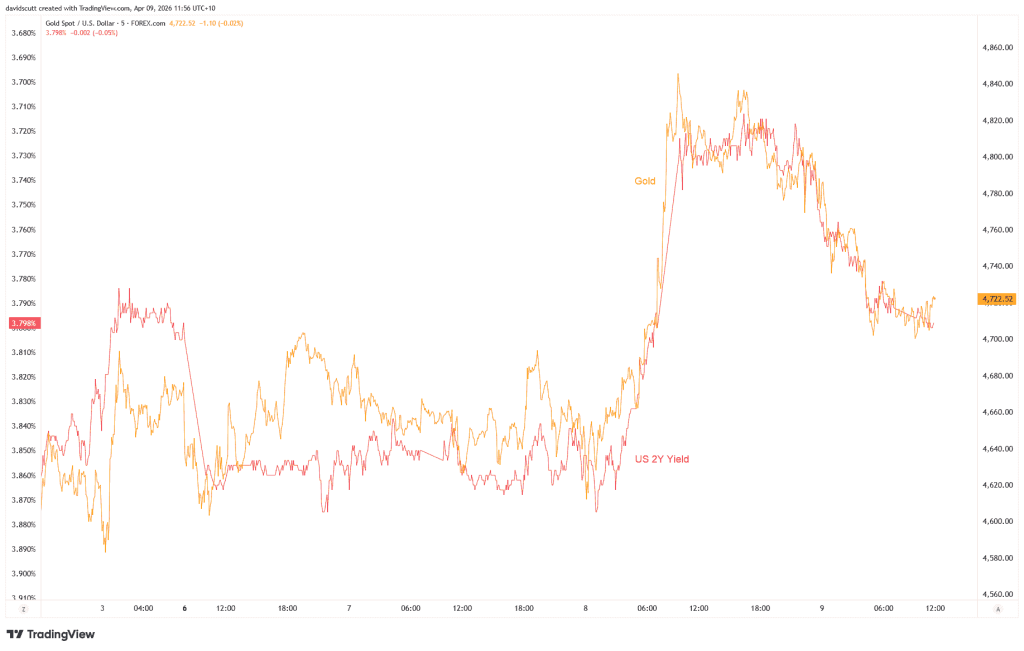
Movements in oil, bond yields, and the US dollar continue to drive price action.
However, a decisive break above resistance could reignite bullish momentum.
Gold started the week under pressure, opening with a gap lower before gradually recovering toward Friday’s close. Recent developments in the Middle East have slightly shifted the near-term outlook, with risks now leaning modestly to the downside. The main concern is clear: a sharper increase in oil prices could strengthen the US dollar and lift bond yields—both factors that typically act as headwinds for gold.
So far, the rise in oil has been relatively moderate, with Brent crude up about 5% and trading near $95 per barrel. Even so, the broader environment remains fragile. The US seizure of an Iranian-flagged vessel near the Strait of Hormuz has drawn strong warnings from Tehran, including threats of retaliation and the potential for further disruption to already strained negotiations. With a two-week ceasefire set to expire on Wednesday and little tangible progress achieved, uncertainty continues to weigh on the situation. Iran has also reversed its brief reopening of the strait, accusing the US of failing to uphold its commitments while maintaining pressure on Iranian ports.
Before diving deeper into the macro drivers, let’s first take a look at gold’s chart…
Gold Technical Analysis
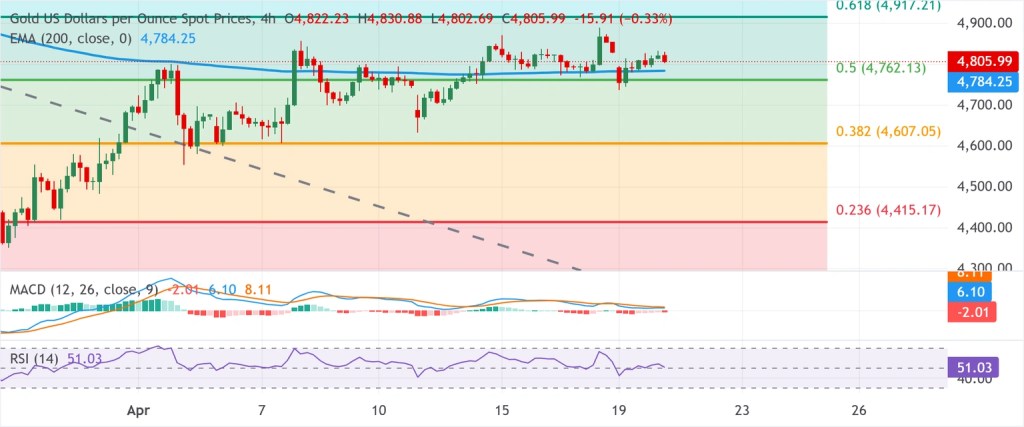
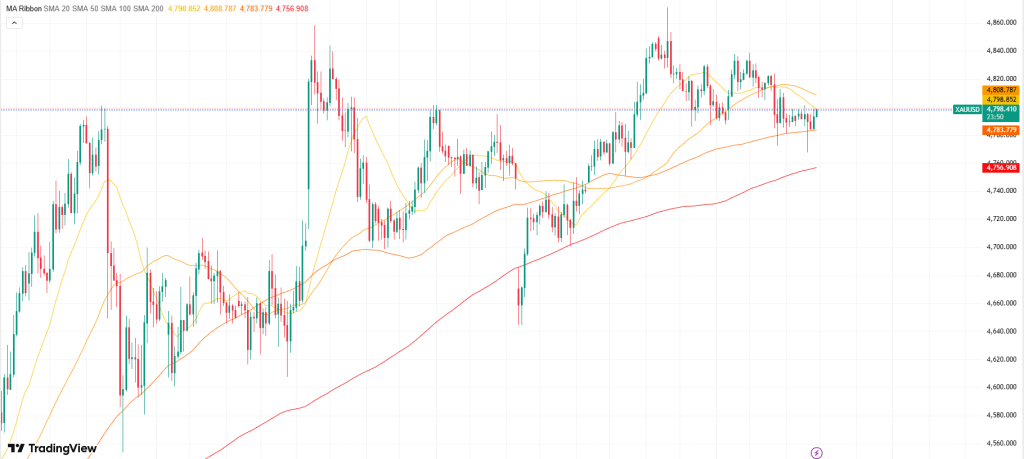
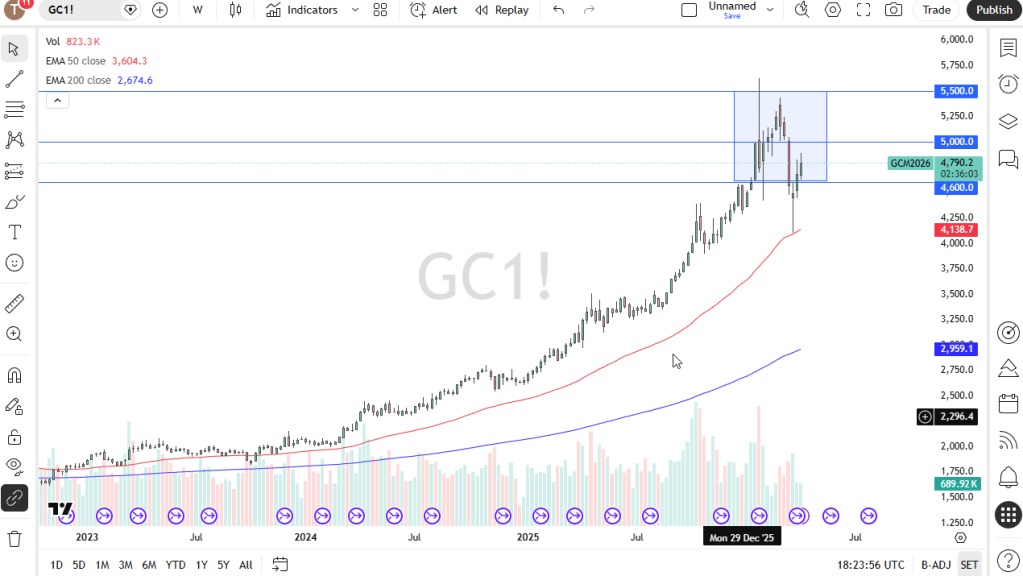
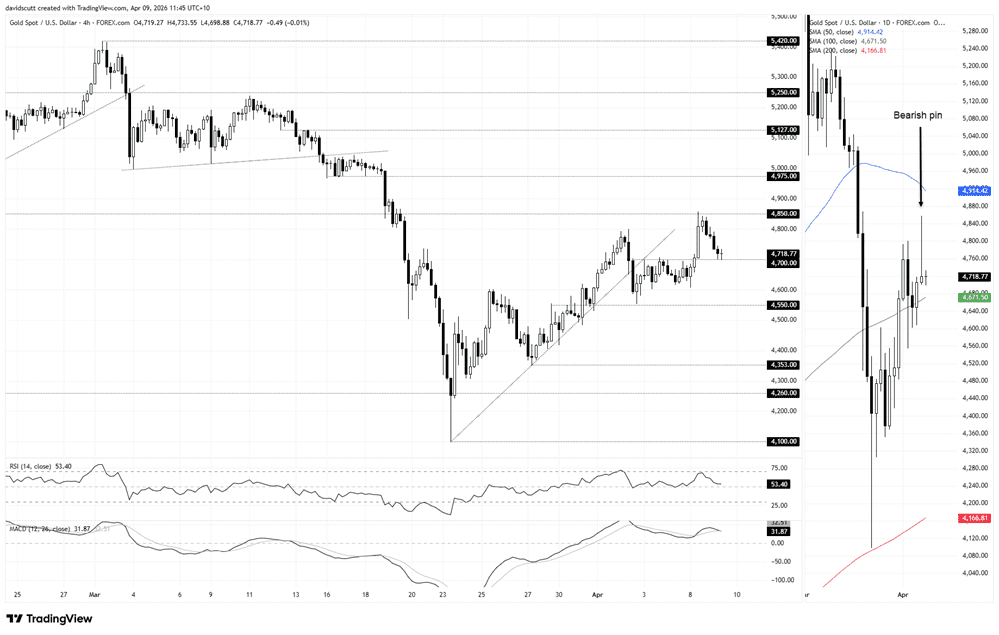
As the chart illustrates, gold is currently testing a key resistance zone in the $4,800–$4,850 range. This area is significant, as it combines multiple technical factors: previous support and resistance levels, the underside of a broken upward trendline, and the 61.8% Fibonacci retracement level.
Since early April, prices have repeatedly tested this resistance zone without achieving a clear breakout. However, the lack of strong selling pressure is telling. When resistance is tested multiple times without a significant pullback, it often signals underlying strength—raising the probability of an eventual upside break, though confirmation is still needed.
A daily close above $4,850 would serve as that confirmation, indicating a bullish reversal and paving the way for further upside. In that case, the next focus would be the $5,000 level, which aligns with the 78.6% Fibonacci retracement and also stands out as a key psychological milestone.
On the downside, initial support is seen near $4,750, followed by $4,600 and then $4,500. The most critical level, however, is $4,400. This zone has demonstrated its significance before—acting as support in early February and quickly being reclaimed after a brief breakdown in late March.
As long as $4,400 holds, the broader bullish structure remains intact, even if short-term conditions appear somewhat uncertain.
Can Gold Still Find Its Footing?
Despite increasingly heated rhetoric, there are still tentative signs that diplomacy hasn’t been fully abandoned. Donald Trump has struck a cautiously optimistic tone about the prospects for a deal, even while warning that military action targeting Iranian civilian infrastructure remains an option if talks break down.
On the other side, Iran continues to stand firm. The removal of restrictions around the Strait of Hormuz remains a key precondition for meaningful engagement, while officials emphasize that major sticking points—especially around nuclear issues—are still unresolved. Even so, financial markets have so far absorbed these developments without major disruption.
Behind the scenes, quieter diplomatic efforts appear to be ongoing. Asim Munir has reportedly engaged with Trump, underscoring that the Hormuz situation remains a central obstacle. There are indications that this view has been acknowledged, though it’s unclear whether it will lead to concrete progress.
If negotiations resume and produce a breakthrough, improved risk sentiment could support gold and potentially drive it toward the $5,000 level. If not, investors should be prepared for a more volatile and uneven trajectory ahead.
A Waiting Game for Now
For the time being, gold’s outlook remains finely poised. Much depends on the direction of bond yields and the US dollar—both of which are closely linked to inflation expectations and, importantly, movements in oil prices. In that context, ongoing developments in the Middle East continue to be the primary catalyst.
For now, a patient approach appears to be the most sensible course.
The conflict with Iran appears to be moving toward some kind of negotiated outcome, though the timing and specifics remain unclear. As the war drags on—and as the Iranian regime endures—the likelihood of a decisive US victory, understood as Tehran’s full capitulation, seems to diminish. This suggests a prolonged, uneven phase of de-escalation, with ongoing disruptions to the global economy likely in the meantime.
From this perspective, Iran is unlikely to win militarily. The US, on the other hand, has the capability to secure a decisive victory, but achieving unconditional surrender would almost certainly require a large-scale ground invasion—an option that appears improbable given the political costs, as seen in Afghanistan, Iraq, and Vietnam.
While the US can continue to intensify air and missile strikes, the impact of such tactics may be waning after weeks of sustained bombardment by US and Israeli forces. Expanding attacks on Iran’s infrastructure could inflict significant economic damage, but it remains uncertain whether this would compel the regime to fully concede, especially as it views the conflict as existential.
Given these dynamics, the most likely outcome is a gradual shift toward negotiations shaped by realities on the ground. The timing and structure of any agreement will depend on internal pressures—such as resource constraints and public sentiment—which create different breaking points for each side.
For the US, key concerns include maintaining its global credibility and influence in the Middle East, as well as managing economic repercussions. The closure of the Strait of Hormuz has already driven energy prices sharply higher, highlighting Iran’s ability to disrupt a critical global supply route and the limited options available to the US to fully counter such actions.
A critical vulnerability for Iran is the risk of economic exhaustion. While Tehran may be able to disrupt energy flows from the Gulf, the US has the capacity to tighten restrictions on Iran’s own oil exports—its primary source of income.
Ultimately, the situation may hinge on which side yields first.
China could emerge as a key, if understated, influence. As the largest buyer of Iranian oil—accounting for over 80% of its exports in 2025, and roughly 13–14% of China’s seaborne crude imports, according to Kpler—Beijing holds significant economic leverage. At the same time, China maintains extensive trade ties with the US, despite ongoing tariffs, giving it strong incentives to balance relations with both sides.
This dual positioning suggests China could quietly shape the path toward negotiations. One important dynamic to watch is whether Beijing uses its leverage to keep Iran engaged in talks, even as it continues to support Tehran’s capacity to withstand US pressure.
For the US, the key issue is when mounting political and economic pressures might convince President Trump that negotiation is the most viable option. Another open question is how far Washington is prepared to go in further weakening Iran’s economy. While escalation may be tempting, it comes with clear trade-offs. A renewed military push would likely keep energy exports constrained, sustaining higher inflation and dampening economic growth both domestically and globally.
In the end, neither side may achieve the outcome it seeks—only a compromise that both can ultimately accept.
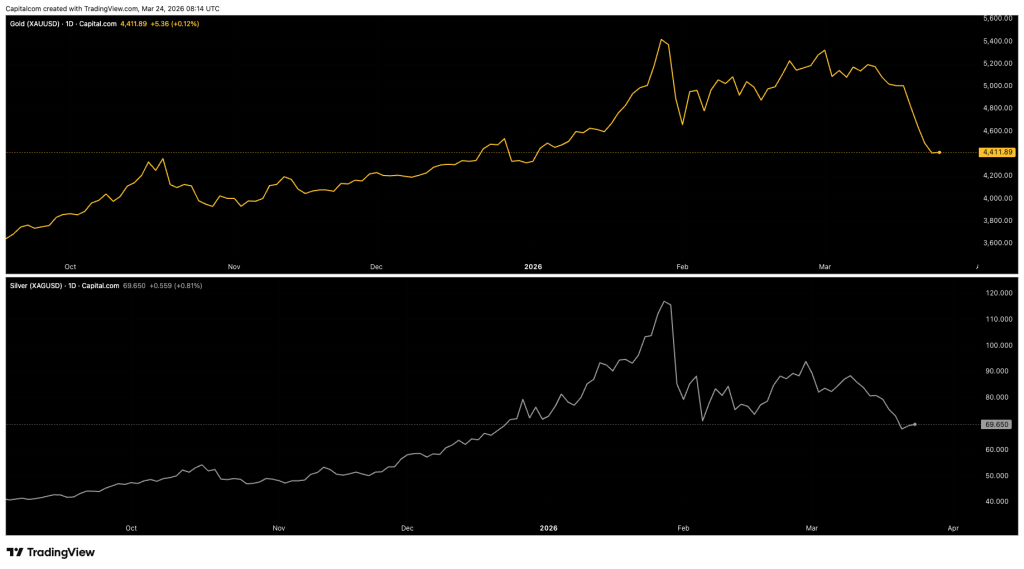
The latest decline in gold and silver has taken investors by surprise again, but for reasons quite different from the late-February correction. While that earlier drop was largely the result of positioning and technical factors, the current weakness is unfolding amid escalating geopolitical tensions and tighter financial conditions. Despite these differences, both episodes underscore how sensitive precious metals are to changes in interest rates, the US dollar, and overall liquidity. Here are five key takeaways shaping the current market move:
Macro Forces Are Now in Control
Unlike the February selloff, which stemmed mainly from position unwinding, this decline is being driven by broader macro dynamics. Rising tensions between the US and Iran have pushed oil prices higher, lifting inflation expectations and prompting markets to reassess the outlook for interest rates. As yields climb and the dollar strengthens, gold faces pressure as a non-yielding, dollar-priced asset. This marks a fundamentally driven shift rather than a technical correction.
The Dollar Is Overtaking Gold’s Safe-Haven Role
Although geopolitical risks typically support gold, the US dollar has emerged as the preferred safe haven this time. Instead of flowing into gold, capital is rotating into dollar-denominated assets as financial conditions tighten. This has created an unusual scenario where risk aversion rises even as gold prices fall, with the dollar absorbing most of the defensive demand.
Real Yields Remain the Critical Channel
Real yields have played a central role in both downturns. In February, a mild adjustment in rate-cut expectations weighed on gold. Now, higher energy prices are pushing up inflation expectations while reducing the likelihood of near-term rate cuts, keeping real yields elevated. This continues to exert downward pressure on precious metals.
Silver Is Amplifying Market Moves
Silver’s steeper drop highlights its higher volatility and dual identity as both a precious and industrial metal. Previously impacted by speculative positioning, it is now also facing concerns about slowing global growth as rising energy costs threaten demand. This combination makes silver more vulnerable and prone to larger swings than gold.
Stability Hinges on Multiple Uncertain Factors
The outlook for gold and silver remains unclear. While February’s stabilization depended on positioning resetting, the current trajectory will be shaped by a more complex mix of factors: the persistence of the energy shock, the Federal Reserve’s response, and the direction of the US dollar. A de-escalation in geopolitical tensions could spark a quick rebound, but if inflation stays elevated and delays rate cuts, precious metals may continue to face headwinds in the near term.
Daily Charts for Gold and Silver
Historical performance does not guarantee future outcomes.
Trading gold and silver CFDs
Whether you’re looking to go long, short, or adjust your portfolio exposure, choosing a reliable broker is essential. Ideally, this means a platform that provides round-the-clock customer support and dedicated account assistance, ensuring smooth trade execution whenever required.
Gold prices climbed during Asian trading on Wednesday, rebounding from a one-week low after the U.S. extended its ceasefire with Iran indefinitely, though uncertainty around future peace negotiations persisted.
The precious metal had come under pressure in the previous session after Federal Reserve Chair nominee Kevin Warsh indicated he had not assured President Donald Trump of any interest rate cuts if confirmed.
Spot gold gained 0.9% to $4,763.66 per ounce, while gold futures advanced 1.3% to $4,782.21/oz as of 02:45 ET (06:45 GMT). Prices continued to trade within the $4,700–$4,900 range observed over the past two weeks.
Other precious metals also posted gains, with spot silver rising 2.4% to $78.5335/oz and spot platinum increasing 2.3% to $2,087.15/oz.
On Tuesday, Donald Trump announced an indefinite extension of the ceasefire with Iran, opening the door for further negotiations between Washington and Tehran.
Despite the extension offering some near-term relief, the outlook for future peace talks remains unclear. Expected discussions between the U.S. and Iran, which were slated for Tuesday, collapsed at the last minute.
Trump also stated that a naval blockade against Iran would stay in place, prompting backlash from Iranian officials, who described the move as an “act of war.”
Gold has faced difficulties since the conflict began, as safe-haven demand has been outweighed by concerns over the war’s potential to drive inflation.
Since the outbreak of the conflict in late February, the metal has traded more like a risk-sensitive asset, often moving in line with equities as market sentiment shifts with developments in the situation.
Warsh signals no pledge on rate cuts, hints at major Fed policy changes
Precious metals came under pressure on Tuesday as the U.S. dollar strengthened, supported by market reaction to testimony from Kevin Warsh.
Warsh stressed the importance of the Federal Reserve’s independence from political influence, while also pointing to the possibility of a significant policy overhaul at the central bank if he is confirmed as chair.
A former Fed governor, Warsh is viewed as less dovish than markets had anticipated. His nomination in late January had already sparked sharp declines in gold and other precious metals.
Although his confirmation appears likely, the timeline remains uncertain. Several Republican leaders have opposed moving forward with Warsh’s appointment until the Trump administration ends its ongoing probe into current Fed Chair Jerome Powell.
As a result, Powell is expected to remain in his role beyond the scheduled end of his term on May 15, particularly if Congress delays Warsh’s confirmation.
Bitcoin climbed above $78,000 on Wednesday, supported by President Donald Trump’s extension of the Iran ceasefire and stronger institutional buying, lifting overall market sentiment.
The leading cryptocurrency was last up 2.7% at $78,018.4 around 02:49 ET (06:49 GMT), after touching a 24-hour high of $78,430.4. It was also on track for a third consecutive day of gains.
Trump announces an extension of the ceasefire with Iran
U.S. President Donald Trump announced an open-ended extension of the Iran ceasefire, noting the decision was partly influenced by requests from Pakistani officials seeking additional time for peace talks in Islamabad.
The extension remains unilateral, however, leaving uncertainty over whether Tehran will formally agree.
While the ceasefire is in place, tensions persist. The U.S. continues its naval blockade of Iranian ports, and disruptions in the Strait of Hormuz have yet to fully subside.
Even so, markets viewed the move as a sign of near-term de-escalation. Oil prices declined, and the U.S. dollar weakened after recent gains.
Analysts note that Bitcoin is increasingly behaving as both a risk asset and a hedge against geopolitical tensions, attracting inflows as investors balance easing risks with ongoing uncertainty.
Strategy snapped up roughly $2.5 billion worth of Bitcoin last week, marking one of its largest purchases to date.
Strategy snapped up $2.5 billion in Bitcoin last week, reinforcing market momentum amid a fresh wave of institutional demand.
The firm, Strategy Inc (NASDAQ:MSTR), revealed it purchased 34,164 BTC in the week ending April 19 at an average price of roughly $74,395 per coin. This brings its total holdings to around 815,000 bitcoins, acquired at a cumulative cost of approximately $61.6 billion—marking one of the largest buys in its history.
To finance the acquisition, Strategy leaned heavily on capital markets, raising about $2.18 billion through the sale of high-yield preferred shares and another $366 million via common stock issuance. These preferred instruments, offering yields near 11.5%, have become a central funding mechanism, enabling the company to expand its Bitcoin position while aiming to minimize shareholder dilution.
In the broader crypto market, most altcoins also moved higher on Wednesday, though gains remained modest. Ethereum, the second-largest cryptocurrency, climbed 3.2% to $2,391.53, while XRP added 1.3% to $1.46. Solana, Cardano, and Polygon each rose around 2.5%, and Dogecoin gained 2.3% among meme tokens.
Sterling and the euro inched slightly higher on Wednesday, as markets found reassurance in Fed Chair nominee Kevin Warsh’s Senate testimony. His remarks helped ease concerns about the Federal Reserve’s independence without significantly altering expectations for interest rates.
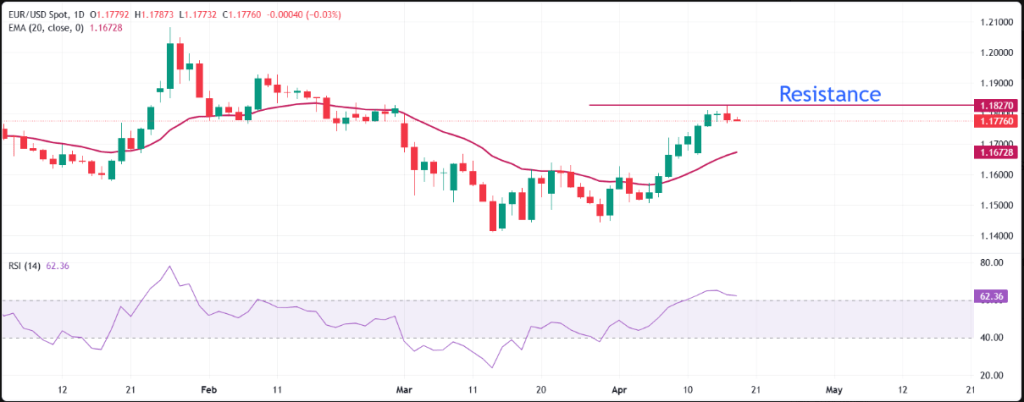
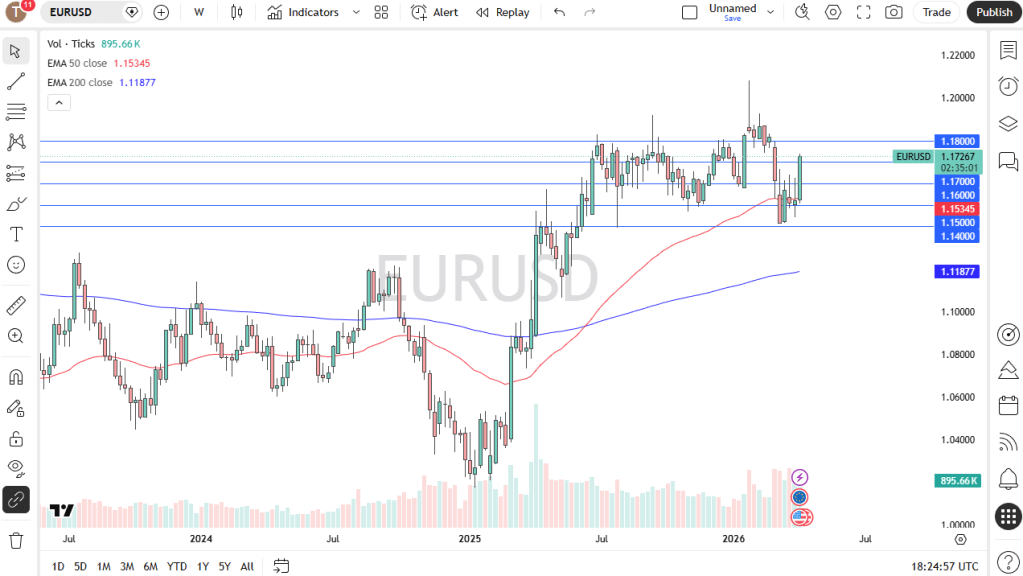
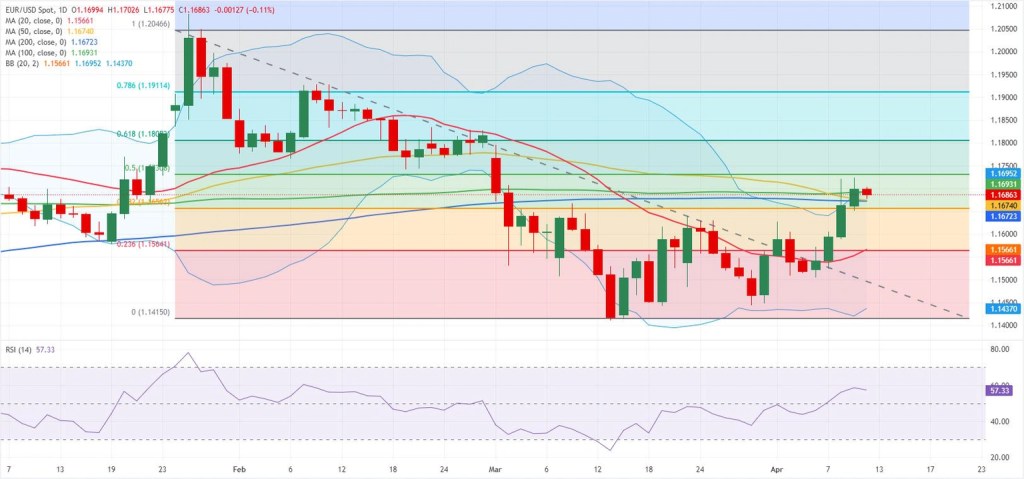
By 03:55 ET (07:55 GMT), GBP/USD had risen 0.16% to 1.3525, moving within a daily range of 1.3498–1.3535. Meanwhile, EUR/USD climbed 0.09% to 1.1754, staying comfortably within its session band of 1.1734–1.1763.
Appearing before the Senate on Tuesday, Warsh avoided outlining specific policy moves but strongly defended the Fed’s autonomy. Analysts noted that this was enough to prevent a Treasury-driven surge in the dollar. As a result, the greenback remained largely rangebound, with the DXY struggling to break back above 99 despite steady equity performance. The S&P 500 has advanced about 3% since the beginning of the US-Iran conflict, reducing a key support factor for a stronger dollar recovery.
According to ING, the dollar’s upside remains limited by resilient equities, as European markets have not weakened enough to push EUR/USD significantly lower. The firm expects the pair to consolidate around 1.172–1.177 in the absence of meaningful diplomatic developments, with buyers likely to emerge on dips near 1.167–1.170.
For sterling, the latest UK inflation figures brought no major surprises. Higher energy prices lifted headline CPI, while core services inflation stayed broadly unchanged, reinforcing expectations that the Bank of England will keep rates on hold next week. ING continues to anticipate that the BoE will maintain its current stance through year-end, with inflation peaking around 3.5–4%—not high enough to prompt policy tightening.
Political uncertainty still weighs on the pound, as markets monitor Prime Minister Keir Starmer’s domestic position ahead of the 7 May local elections, where Labour is expected to underperform.
Meanwhile, the broader geopolitical situation remains unsettled. President Trump announced a last-minute ceasefire extension, but tensions in the Strait of Hormuz persist, with the US blockade ongoing and new reports of an incident involving a UK container ship. Going forward, both currency pairs are likely to be driven by developments related to the conflict, oil price movements, and further signals from Fed officials.
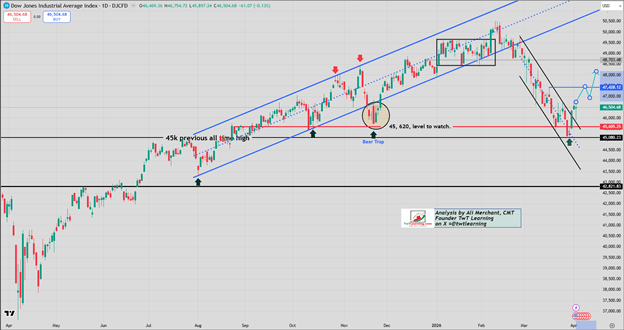
Dow Jones futures climb as sentiment improves on Iran’s plan to hold a second round of US talks ahead of the ceasefire deadline.
Wall Street ended Monday on a softer note as renewed US–Iran tensions intensified over the weekend.
Trump signaled he is unlikely to extend the truce with Tehran if no agreement is reached.
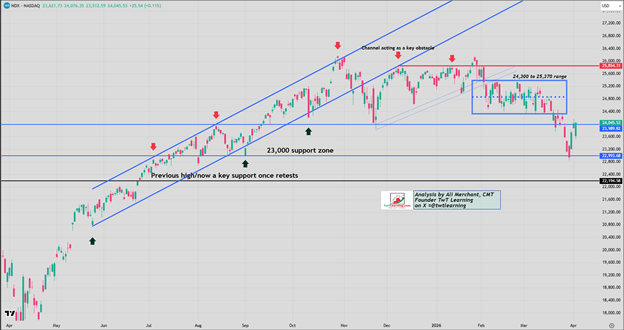
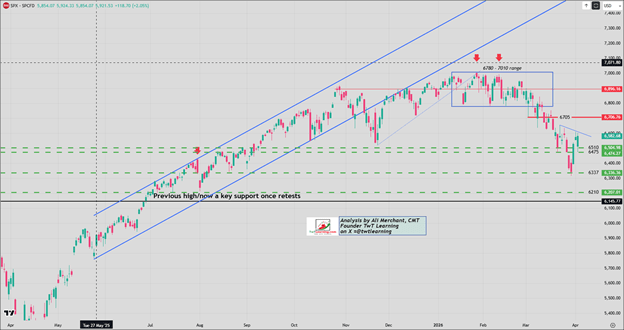
Dow Jones futures rise 0.14% to above 49,700, while S&P 500 and Nasdaq 100 futures also edge higher by 0.13% and 0.27% to around 7,160 and 26,820, respectively, during Tuesday’s European session ahead of the US market open.
US equity futures move higher as sentiment improves, driven by reports that Iran will send a delegation to Islamabad for a second round of talks with the US before the truce deadline. President Donald Trump said Vice President JD Vance is expected to travel to Pakistan to resume negotiations, “either Tuesday night or Wednesday morning,” according to Bloomberg.
In Monday’s regular session, Wall Street ended slightly lower. The Dow Jones slipped 0.01%, while the S&P 500 and Nasdaq 100 declined 0.24% and 0.26%, retreating from record highs amid renewed US–Iran tensions over the weekend. Tech stocks led the pullback, with Broadcom and Meta dropping more than 2%, and Microsoft, Nvidia, and Alphabet falling over 1%.
Trump also indicated he is unlikely to extend the truce with Tehran if no deal is reached before its expiration this week, adding that the Strait of Hormuz will remain blocked until an agreement is secured. The situation has pushed oil prices higher and increased inflation concerns, reducing expectations for near-term Federal Reserve rate cuts.
Gold comes under renewed selling pressure in the Asian session, though losses appear contained.
Persistent inflation concerns keep U.S. bond yields elevated, supporting the dollar and pressuring the metal.
However, growing expectations of Federal Reserve rate cuts may limit further dollar strength and help support the non-yielding gold.
Gold (XAU/USD) remains under pressure and trades below the $4,800 level in the early European session on Tuesday, though it stays above the one-week low touched a day earlier. Market participants remain doubtful about a potential US–Iran deal as tensions persist around the Strait of Hormuz. The US Navy’s seizure of an Iranian-flagged cargo vessel in the Gulf of Oman, followed by Iran’s renewed closure of the key shipping route, has supported crude oil prices. This, in turn, has reignited inflation concerns, boosted the US dollar, and weighed on gold.
That said, stronger gains in the dollar appear limited as expectations for further rate hikes by the Federal Reserve continue to fade. According to the CME Group’s FedWatch Tool, markets are now pricing in roughly a 45–50% chance of a rate cut by year-end, which could cap USD strength and provide underlying support for non-yielding gold. Meanwhile, traders are likely to remain cautious amid uncertainty over whether US–Iran peace talks will materialize, making it wise to wait for clear follow-through selling before expecting deeper losses in XAU/USD.
US President Donald Trump stated that American negotiators will travel to Pakistan for another round of discussions with Iran in an effort to extend a fragile ceasefire set to expire on Wednesday. However, Iranian officials remain reluctant to engage in talks under current conditions, citing the ongoing US blockade. Parliament Speaker Mohammad Bagher Ghalibaf emphasized that Iran will not negotiate under pressure, while Foreign Minister Abbas Araghchi pointed to continued US ceasefire violations as a key obstacle to diplomacy. Despite this, reports indicate that an Iranian delegation may still head to Islamabad for negotiations.
Going forward, markets will stay highly sensitive to developments in the US–Iran situation, which could drive volatility across asset classes. In addition, traders will look to testimony from Fed Chairman-designate Kevin Warsh for further direction. Given the mixed fundamental backdrop, caution remains warranted before taking strong directional positions in gold.
Gold (XAU/USD) – 4-hour timeframe chart
The bullish outlook for gold remains intact as long as price stays above the 200-period EMA and the 50% Fibonacci retracement, a zone that now acts as a confluence support after previously serving as resistance.
The metal continues to show a constructive short-term tone, holding above the 200 EMA at $4,784.25. Just below, the 50% retracement of the March decline at $4,762.13 reinforces this support area, suggesting underlying buying interest. However, momentum indicators are relatively neutral rather than strongly trending—RSI is hovering around 51, while MACD remains slightly in negative territory—indicating that although bulls are still in control structurally, upside momentum is not particularly strong at the moment.
In terms of levels, immediate support lies at the 200 EMA ($4,784.25), followed by the 50% retracement at $4,762.13. A decisive break below this zone could open the door to deeper Fibonacci support levels at $4,607.05 and $4,415.17, with the broader downside target near $4,105.01. On the upside, resistance begins at the 61.8% retracement level at $4,917.21, with further barriers at $5,138.01 (78.6%) and the cycle high around $5,419.25, where rejection could potentially limit further gains in the current bullish phase.
Oil prices dropped by more than $1 on Tuesday, giving back the previous session’s gains, as expectations grew that U.S.–Iran peace talks this week could ease tensions and allow more crude supply from the Middle East.
Brent crude fell $1.04 (1.1%) to $94.44 per barrel by 0600 GMT. U.S. West Texas Intermediate (WTI) for May declined $1.66 (1.9%) to $87.95, with the contract expiring Tuesday, while the more active June contract slipped $1.24 (1.4%) to $86.18.
This pullback followed a sharp rally on Monday, when Brent jumped 5.6% and WTI surged 6.9% after Iran closed the Strait of Hormuz again and the U.S. seized an Iranian cargo vessel as part of its blockade.
Despite ongoing risks, market sentiment is being driven by optimism that negotiations could extend the current ceasefire or even produce a broader agreement, though disruptions to supply remain a concern.
ING analysts noted that while prices spiked after the Strait of Hormuz closure, trading patterns still reflect confidence in diplomatic progress, warning that markets may be underestimating the scale of supply disruptions.
Iran is considering joining peace talks in Pakistan, according to a senior official, as Islamabad works to mediate and end the U.S. blockade. However, the blockade continues to complicate Tehran’s participation, especially with the current two-week ceasefire nearing its expiry.
Citi analysts expect a memorandum of understanding or a ceasefire extension this week, potentially leading to a wider deal, but caution that prolonged disruptions remain possible if negotiations fail.
Uncertainty persists, as Iranian officials emphasized no final decision has been made. Foreign Minister Abbas Araqchi cited ongoing U.S. ceasefire violations as a barrier, while Parliament Speaker Mohammad Baqer Qalibaf reiterated that Iran will not negotiate under pressure.
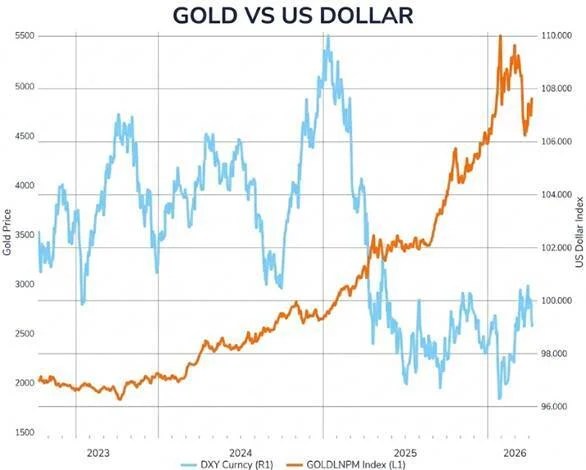
Meanwhile, shipping through the Strait of Hormuz—responsible for roughly 20% of global oil flows—remained constrained. Citi estimates that if disruptions last another month, losses could reach 1.3 billion barrels, pushing prices toward $110 per barrel in Q2 2026.
Kuwait has declared force majeure on oil exports due to the blockade, while higher prices have already reduced global demand by about 3%, according to Societe Generale. The bank warned that risks skew toward greater losses the longer supply disruptions persist, with full normalization unlikely before late 2026.
One by one, quietly and without public notice, central banks around the world are repatriating their gold reserves. From New Delhi to Belgrade, Frankfurt to Paris, institutions are arriving at similar conclusions independently. The trust that once supported the postwar reserve architecture is beginning to show visible cracks.
Introduction
The last time France withdrew its gold from American custody was in 1965. Under Charles de Gaulle, who viewed the Bretton Woods system as granting the United States an “exorbitant privilege,” France dispatched a warship to New York to exchange dollars for gold—directly challenging US monetary supremacy.
Six years later, President Richard Nixon ended the dollar’s convertibility into gold, effectively dismantling the Bretton Woods gold standard. Six decades on, France has again quietly reduced its gold holdings stored at the New York Federal Reserve. This time, instead of geopolitical confrontation, the move is executed through discreet financial transfers, driven by a €12.8 billion arbitrage opportunity.
Despite the change in method, the underlying motivation appears familiar: persistent skepticism toward dollar-centric financial systems and a renewed emphasis on monetary sovereignty. While history does not repeat exactly, developments in gold markets often echo earlier patterns with notable precision.
The Silent Return
For much of the postwar period, the physical location of gold reserves was rarely questioned. Many central banks—particularly in Europe and the developing world—kept their gold in custodial vaults such as the Federal Reserve Bank of New York and the Bank of England, assuming these locations were neutral, liquid, and politically secure. That long-standing assumption is now weakening.
Recent data supports this shift. The World Gold Council’s Central Bank Gold Reserves Survey 2025, based on responses from 73 institutions, shows that 59% of central banks now store at least part of their gold domestically, up from 41% in 2024 and 50% in 2020. Since 1972, approximately 6,900 tonnes of gold have been repatriated to national vaults.
This marks an 18-percentage-point increase in just five years, with most of the change occurring in the past year alone. The same survey also found that 95% of central banks expect global gold reserves to rise further over the next 12 months, indicating a broadly shared expectation of continued accumulation among monetary authorities.
The driver behind this shift is increasingly evident. The 2022 freezing of around $300 billion in Russian foreign currency reserves sent a powerful message: assets held abroad may not remain fully under the owner’s control in times of geopolitical stress. An updated 2025 Invesco survey of central banks shows that the share storing gold domestically has increased by 18 percentage points since that episode—suggesting a striking alignment between the event and changing reserve behavior.
Gold has traditionally been regarded as the ultimate safe-haven asset, but recent developments revealed a less discussed vulnerability: what was once framed as market risk has increasingly become jurisdictional and counterparty risk. In other words, even physical reserves held in trusted foreign vaults depend on political continuity and legal access—risks that were previously underappreciated.
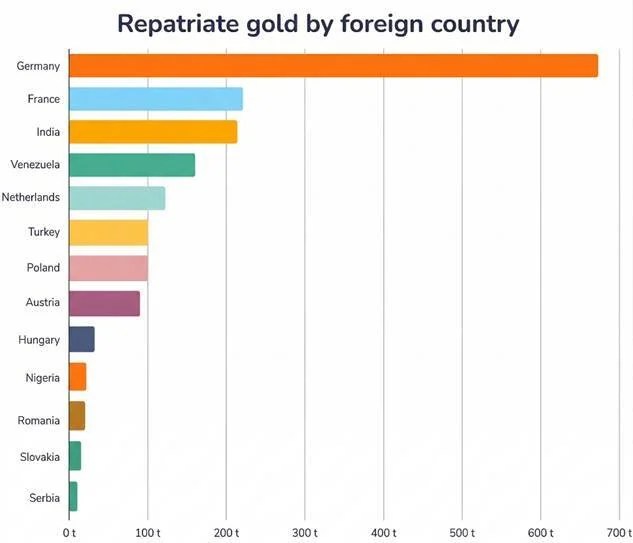
The reaction has been broad-based and measured in substantial volumes. Bloomberg reports that India has repatriated roughly 280 tonnes of gold over the past four years, including a notable transfer from the Bank of England in 2024. In July 2025, it was also reported that Serbia brought back its entire gold holdings—worth about $6 billion—into domestic storage, deliberately avoiding reliance on established international custodial centers.
Other countries, including Poland, Turkey, and Nigeria, have followed similar paths. While much of this movement has been led by emerging markets, the trend is gradually extending into parts of Western Europe as well, pointing to a broader structural rethinking of where ultimate financial security resides.
The pace of accumulation further strengthens this trend. According to World Gold Council data, central banks purchased more than 1,000 tonnes of gold annually in 2022, 2023, and 2024—an unprecedented sustained buying cycle in modern history. Although this pace eased to 863 tonnes in 2025, it still remained exceptionally high by historical standards.
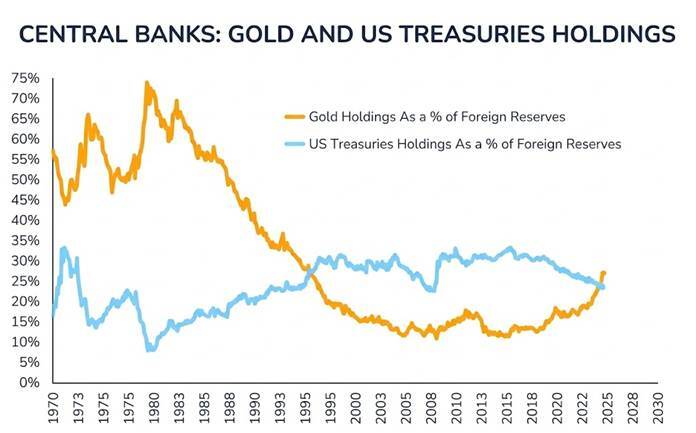
By early 2026, total gold held by central banks worldwide was estimated at around $4 trillion, overtaking, for the first time, the roughly $3.9 trillion in US Treasury securities held by the same institutions. According to the World Gold Council and Visual Capitalist, this shift reflects a meaningful rebalancing of global reserve preferences, with potential long-term implications for the international monetary system.
France’s Banque de France offers a particularly illustrative case. Between July 2025 and January 2026, it carried out a discreet program involving 129 tonnes of gold stored at the New York Federal Reserve—about 5% of its total 2,437-tonne holdings—executed through 26 separate transactions. However, this was not a straightforward physical repatriation.
Instead of transporting older bars across the Atlantic, the central bank sold legacy-format gold in New York and replaced it with modern London Good Delivery bars held in Paris. The result was effectively a swap in form rather than a logistical relocation.
As reported by La Tribune, the financial outcome was striking: a combined €12.8 billion gain—€11 billion in 2025 and €1.8 billion in 2026—achieved without physically moving the metal. While often described in the press as repatriation, the operation was more accurately a form of quality arbitrage that incidentally increased domestic holdings.
The End of the American Vault Illusion
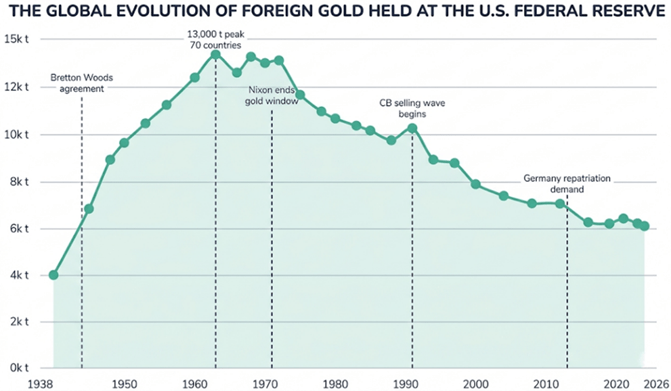
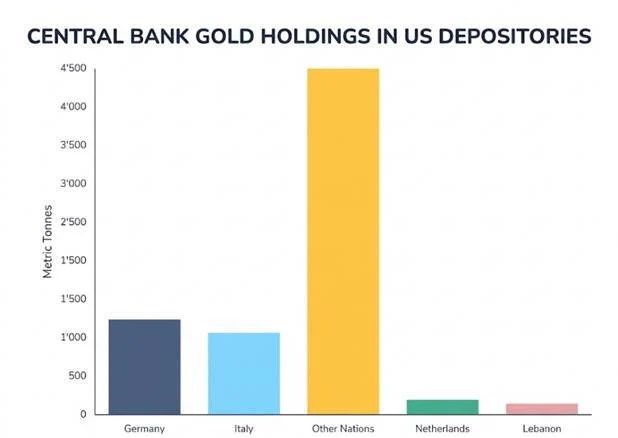
Germany’s case underscores the strategic significance of this shift more clearly than France’s quieter financial maneuvers. The Bundesbank continues to hold 1,236 tonnes of gold at the Federal Reserve Bank of New York—around 36.6% of its total 3,378-tonne reserves—and this remains the largest single foreign gold position stored at the NY Fed.
Between 2013 and 2017, Germany conducted the largest gold repatriation operation in modern history, withdrawing 674 tonnes from both New York and Paris. This process was framed at the time as a technical modernization of reserve management rather than a strategic pivot.
For context, the New York Federal Reserve currently stores roughly 6,331 tonnes of foreign sovereign gold. Germany alone accounts for nearly one-fifth of all foreign-held gold in its vaults in lower Manhattan, highlighting how concentrated global trust once was in a single custodial hub.
From 2013 to 2021, Germany repatriated about 300 tonnes from New York and 283 tonnes from Paris, completing what was widely regarded as a normalization of storage practices. The remaining 1,236 tonnes were, at the time, still considered securely and appropriately held abroad.
What has changed since then is not necessarily the security of the vault itself, but the perception of what “secure custody” means in a more fragmented geopolitical environment.
This ruling is increasingly subject to political debate. In January 2026, former senior Bundesbank official Emanuel Mönch warned that, amid heightened geopolitical uncertainty, concentrating large volumes of gold in the United States poses risks. He argued that the Bundesbank should consider further repatriation as a way to enhance strategic autonomy. His position echoes a widening political consensus in Germany, spanning parties from the AfD to figures within the Greens and FDP.
Despite this, the Bundesbank has not changed its official policy. It continues to regard New York as a safe and dependable storage hub, and no additional repatriation initiative is currently planned. Nevertheless, the divergence between institutional continuity and mounting political pressure is becoming more pronounced.
At a deeper level, the issue is structural. For many years, the rationale for keeping gold in New York rested on three foundations: liquidity, given the ability to quickly trade or mobilize gold in the world’s largest market; network advantages, driven by the scale and efficiency of the LBMA and New York Federal Reserve gold markets; and political confidence, based on the assumption that US custody would not be used as a geopolitical lever.
Each of these pillars has since been weakened to some extent. The 2022 sanctions episode demonstrated that the US and its allies are willing to deploy financial infrastructure as an instrument of geopolitical pressure. A more transactional approach in US foreign policy has further reinforced such concerns. At the same time, improvements in European gold markets and LBMA access have reduced the liquidity advantages of storing reserves in New York, making domestic storage increasingly viable without significant market disadvantage.
The Overlooked Gold Catalyst Markets Still Haven’t Factored In
Investment banks are largely aligned on a continued rise in gold prices, though their forecasts differ, reflecting varying views on how quickly central bank behavior is shifting.
Goldman Sachs has lifted its 2026–2027 outlook to $4,000–$5,400, pointing to sustained demand from emerging-market central banks. J.P. Morgan Private Bank is even more bullish, projecting $6,000–$6,300, attributing the upside to accelerating diversification away from the US dollar. UBS takes a more moderate stance at around $4,200, but similarly highlights a global trend of reducing dollar exposure.
Taken together, the wide forecast range of roughly $3,100 to $6,300 is less a sign of disagreement about direction and more about uncertainty over timing—particularly the speed of gold repatriation and reserve reallocation. The common thread across all projections is a shared conviction in a longer-term bullish trend, driven by evolving central bank strategies. Early 2026 pricing behavior already appears to be reinforcing this growing institutional confidence in gold.
Gold repatriation does not change the total global supply; it simply reallocates where and how gold is held and accessed. For example, when the Banque de France substituted New York-held ingots with London Good Delivery bars in Paris, global central bank reserves remained unchanged, with only a shift in classification and location. The London Bullion Market Association (LBMA), which clears roughly $30 billion in gold transactions daily, operates on the assumption that institutional gold is readily accessible regardless of storage location.
As the pool of immediately available gold tightens, borrowing costs tend to increase, price spreads widen, and physical gold can trade at a premium to paper claims. This reflects a scarcity of deliverable metal that is not captured in conventional supply-flow data and is often underrepresented in market models—highlighting that distribution can matter as much as total stock.
If Germany were to pursue a similar repatriation of its 1,236 tonnes held at the New York Fed, the effects on the physical market would be more pronounced. Such a move would require sourcing, refining to current delivery standards, and physically transporting the gold, generating real demand pressure within the LBMA system, even though global central bank holdings would remain unchanged.
This scenario is not currently priced in by markets. While the German repatriation debate remains largely political and the Bundesbank has given no indication of imminent action, the underlying drivers that prompted France’s earlier decision—bar standard considerations, proximity to European counterparties, and a geopolitical preference for domestic custody—are similarly relevant to Germany.
Understanding the De-Dollarisation Trend
Gold repatriation is frequently framed as a symbolic geopolitical gesture, but its implications are more tangible. When central banks repatriate gold, they also reduce their dependence on the dollar-based financial system, including its clearing mechanisms, custodial arrangements, and settlement infrastructure. Each tonne of gold brought back reduces exposure to dollar-linked channels and potential sanctions risk.
This shift is already becoming measurable. By early 2026, the value of gold held by central banks exceeded their holdings of US Treasuries—approximately $4 trillion compared with $3.9 trillion. This signals a gradual but persistent move away from the US dollar’s role as the dominant reserve asset. Unlike traditional currency diversification, this transition is difficult to capture fully in official statistics, yet it is ongoing, accelerating, and still not fully reflected in market pricing.
Historically, gold prices have tended to decline when the US dollar strengthens and real interest rates rise. However, this relationship has weakened since 2022, as central banks have emerged as significant buyers driven more by geopolitical considerations than by traditional market indicators such as yields or currency movements. This introduces a form of demand that is relatively insensitive to price.
Consequently, conventional gold valuation models are becoming less reliable and often understate price levels. This shift also helps explain why institutions such as Goldman Sachs, J.P. Morgan, and UBS are projecting significantly higher gold prices than would have been considered plausible prior to 2022. In effect, the pricing dynamics of gold have evolved, while many existing models have yet to fully adjust.
Conclusion
The structural argument for gold repatriation is compelling, but it is not without inconsistencies. Recent conflicts in the Middle East have added further complexity, at times pressuring both gold and the US dollar simultaneously and disrupting traditional market correlations. Central banks also do not act as a single coordinated group—some are accumulating gold, others are repatriating it, while some are still selling under financial or policy constraints.
Although data from the World Gold Council, analyst price targets, and observable repatriation flows support the broader trend, the pace is uneven and motivations vary significantly across institutions. Gold continues to function as a form of monetary insurance, but its behavior and underlying drivers are more nuanced and less linear than the prevailing narrative often implies.
Markets are increasingly betting that the conflict with Iran has come to an end. Yet even if that assumption holds, the economic repercussions are likely to persist for months—if not years.
While global attention tends to center on the immediate spectacle of war—airstrikes, blockades, and sanctions—the most disruptive consequences often emerge more slowly. In the Persian Gulf, the true impact is delayed, carried across the world through disrupted shipping routes and declining exports of oil, natural gas, and key agricultural inputs. Because of these lags, the global economy is only beginning to absorb the shock from reduced supply.
As Comfort Ero of the International Crisis Group observes, wars expose the fragile systems that quietly sustain everyday life. Strategic chokepoints like the Strait of Hormuz—normally overlooked—suddenly become critical when they falter.
Oil shipments from the Gulf typically take between 30 and 45 days to reach major markets. That delay means supply disruptions don’t show up immediately. Instead, countries draw down existing inventories while incoming supply gradually shrinks. By the time shortages become visible, the disruption has already been building for weeks.
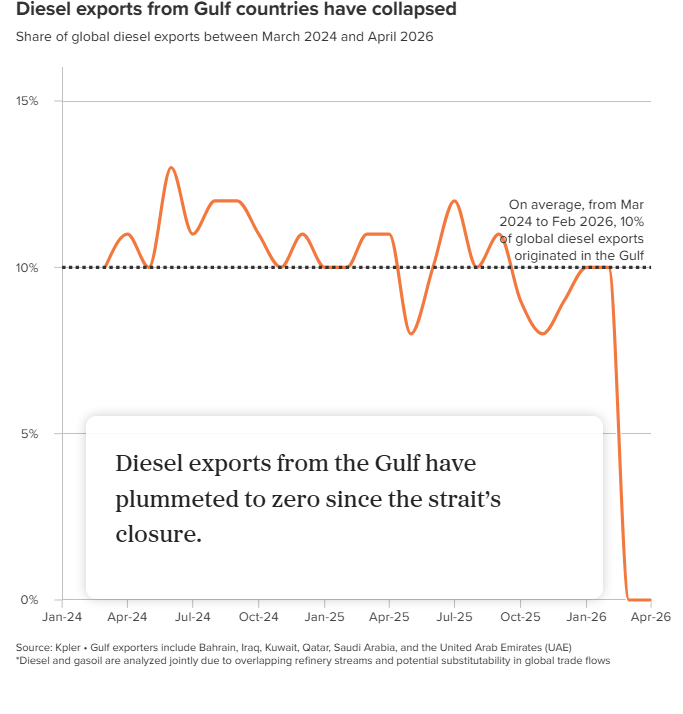
Recent data underscores this dynamic. OPEC output plunged by 27% in March, signaling the first wave of global supply strain. Even under a sustained ceasefire, a rapid recovery appears unlikely. Industry leaders estimate it could take months for production in the region to return to normal levels.
At the same time, the easing of military tensions may create a false sense of stability. Beneath the surface, the economic damage continues to accumulate. Supply chain pressures are only now intensifying. Companies are beginning to feel the strain—illustrated by manufacturers halting orders due to shortages tied to disruptions in the energy supply chain.
The agricultural sector offers another clear example. With planting season nearing its end, rising fertilizer and fuel costs are forcing farmers to make difficult choices: cut back production or absorb significant financial losses. Many are already reporting deteriorating financial conditions.
Although limited shipping activity has resumed through the Strait of Hormuz, it remains uncertain how quickly normal export levels can be restored. Even if the passage reopens soon, the broader damage—to infrastructure, refining capacity, and logistics networks—will take far longer to repair, ensuring that the war’s economic aftershocks continue well into the future.
Oil isn’t the only export under threat. The Persian Gulf also supplies large volumes of natural gas liquids, ammonia, urea, and other petrochemical inputs that are vital to global fertilizer production. Prolonged disruptions to these flows could ripple through agricultural supply chains worldwide.
Even a short delay in shipments can trigger cascading effects—tightening fertilizer supplies, reducing crop yields, and driving up food prices months down the line.
In this sense, the war’s impact on oil and fertilizer inputs resembles a slow-building shockwave. For now, the global economy is cushioned by existing inventories and shipments made before the conflict. But as those buffers wear thin, declining exports from the Gulf are likely to place increasing strain on energy markets, food production, and overall economic stability.
The most significant consequences are not in the past—they are only starting to surface.
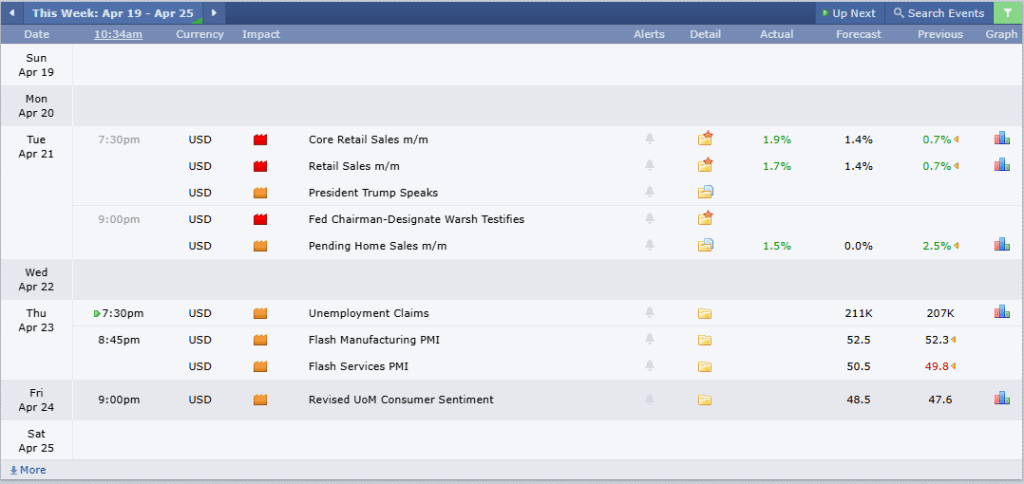
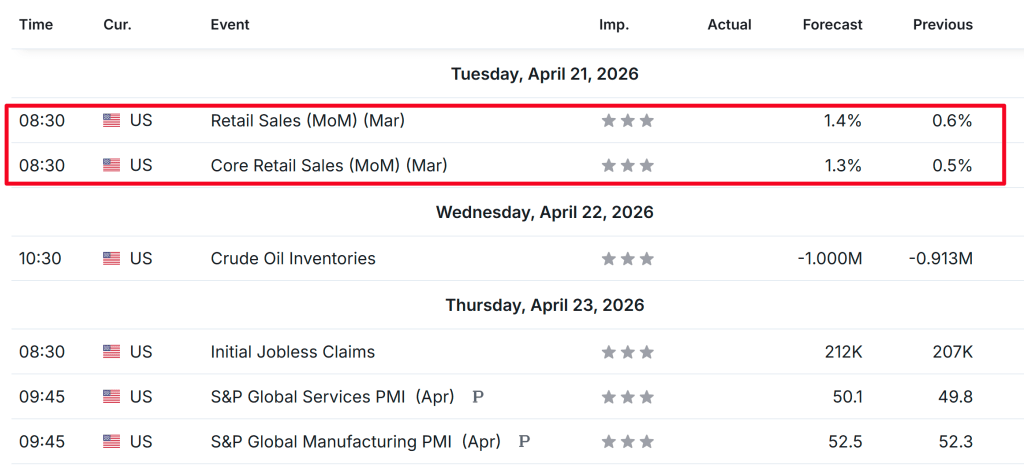
Geopolitical tensions involving Iran, fresh U.S. retail sales figures, and a surge in Q1 earnings reports are set to drive market sentiment in the coming week.
Tesla stands out as a potential buy, supported by improving turnaround momentum and closely watched forward guidance that could reshape investor expectations.
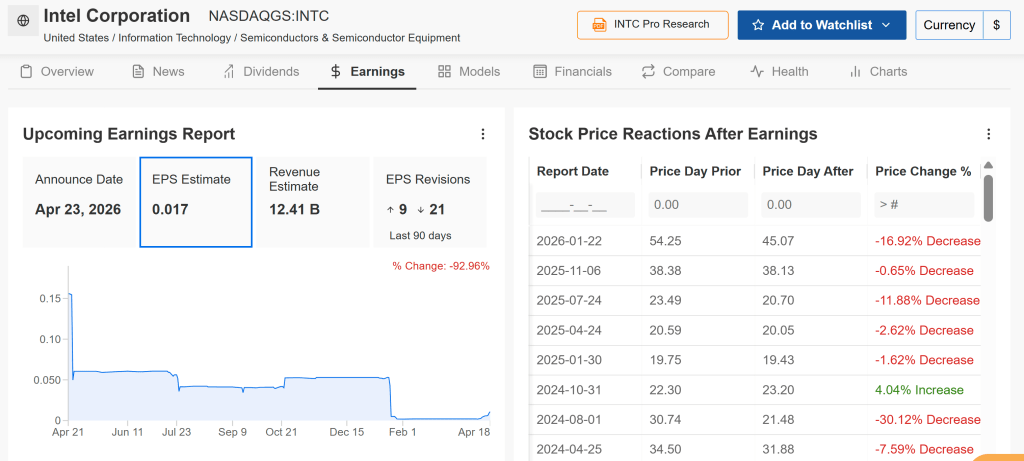
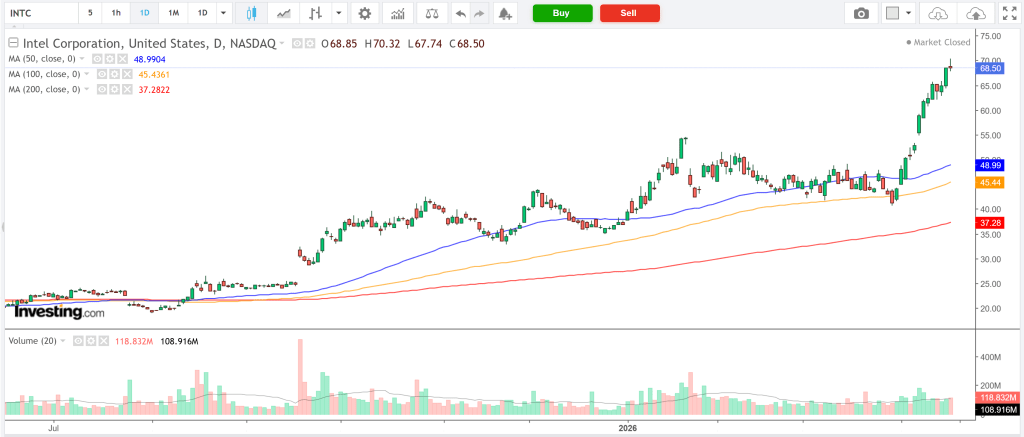
In contrast, Intel appears vulnerable after a strong recent rally, with downside risks emerging from stretched valuations and potential profit-taking.
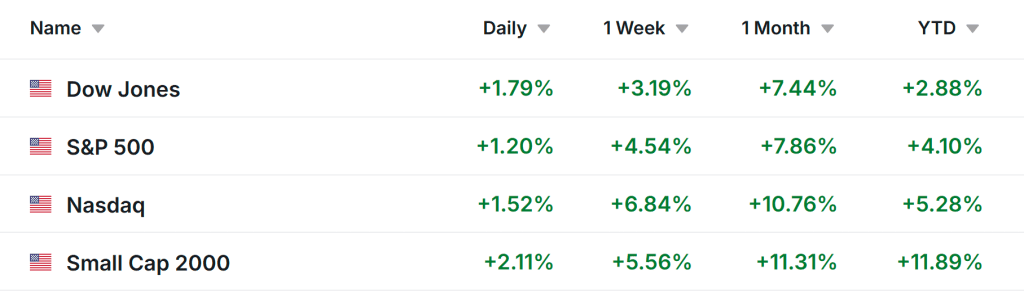
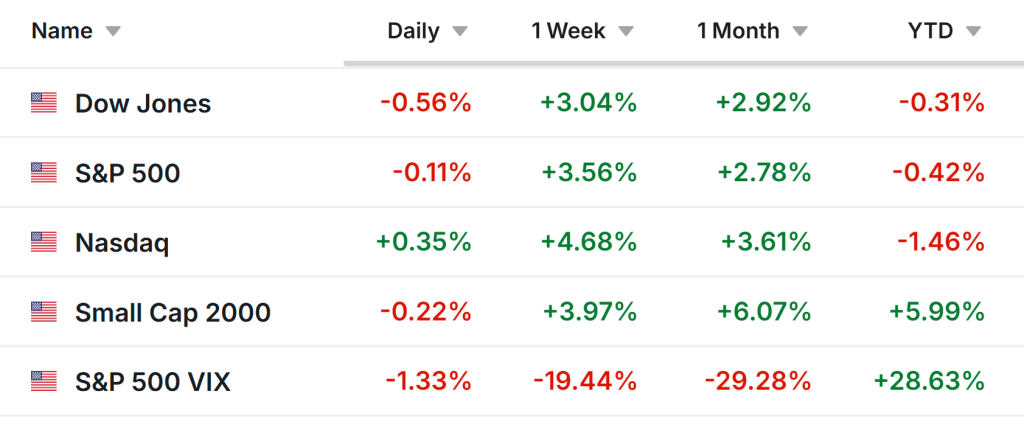
U.S. equities surged on Friday after investors welcomed Iran’s move to reopen the Strait of Hormuz. The S&P 500 and Nasdaq Composite each notched their third consecutive record close, while the blue-chip Dow Jones Industrial Average posted its strongest finish since late February.
For the week, the S&P 500 climbed 4.5%, the Dow Jones Industrial Average advanced 3.2%, the tech-heavy Nasdaq Composite surged 6.8%, and the small-cap Russell 2000 gained 5.6%.
Looking ahead, market focus will once again center on developments in the Middle East and movements in oil prices, after Iran stated on Saturday that the Strait of Hormuz is now “under strict control” by its forces—marking a sharp shift from Friday’s stance.
Potential direct talks between the U.S. and Iran may take place in Pakistan on Monday, although Tehran indicated that no official date has been confirmed. Meanwhile, the current two-week ceasefire is set to expire on Wednesday.
On the economic front, attention will also turn to U.S. data releases, including retail sales, initial jobless claims, and consumer sentiment, in what is expected to be a relatively quiet week for macroeconomic indicators.
The Senate Banking Committee is set to hold a confirmation hearing on Tuesday for Kevin Warsh regarding his nomination as Federal Reserve chair.
At the same time, earnings season is moving into full swing, with several major companies scheduled to report results in the week ahead, including Tesla, Intel, IBM, Boeing, GE Aerospace, UnitedHealth, AT&T, American Express, and United Airlines.
Regardless of how the broader market unfolds, the focus below highlights one stock that appears poised to attract buying interest and another that could face renewed downside pressure. Note that this outlook is strictly short-term, covering the trading week from Monday, April 20 through Friday, April 24.
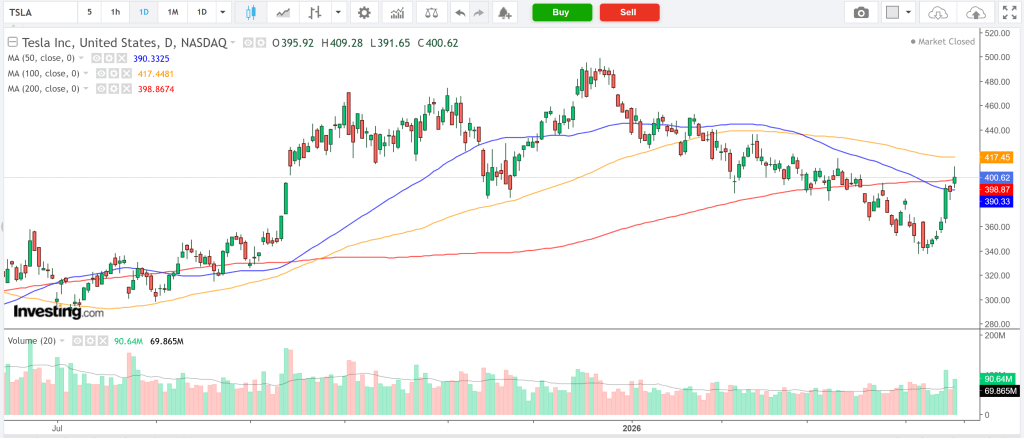
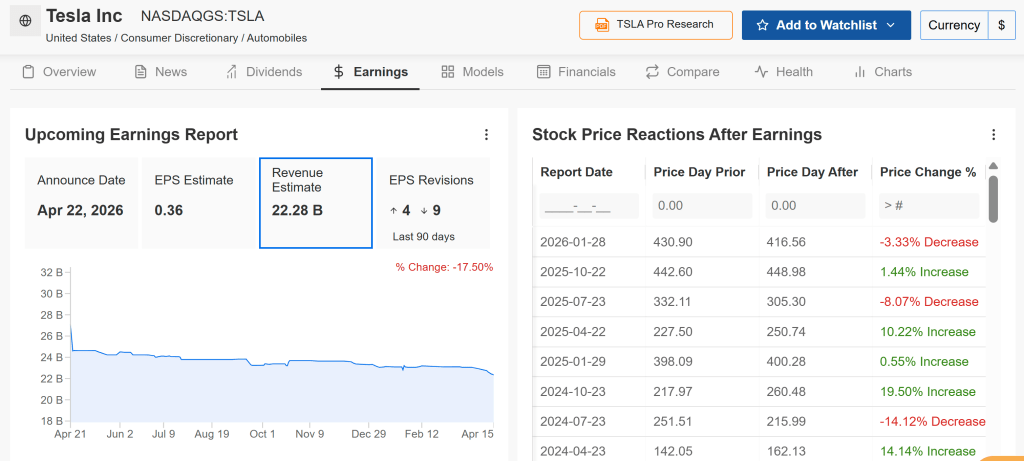
Stock to watch for buying: Tesla
Tesla heads into its Q1 2026 earnings with strong momentum. After breaking a prolonged losing streak, the stock posted its best weekly gain since last May and is now trading close to the $400 level ahead of the announcement.
Options markets are pricing in a move of around 6% following the earnings release—significant, though not unusual for Tesla. If results meet or exceed expectations, accompanied by positive forward guidance and convincing updates on long-term autonomy and product development, the stock could see an even larger upside move as investor sentiment shifts.
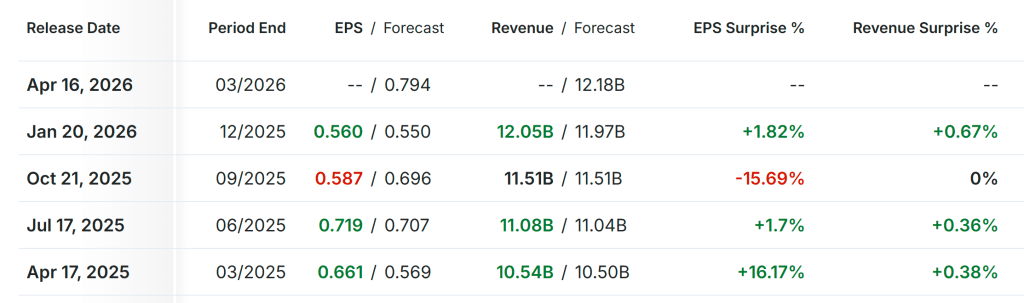
Wall Street forecasts adjusted earnings of $0.36 per share, marking an approximate 33% year-over-year increase from a weaker Q1 2025. Revenue is expected to rise 15% to $22.28 billion.
However, the spotlight will be on guidance and strategic commentary from CEO Elon Musk. Investors will closely watch developments in key areas such as the robotaxi initiative, Cybercab production plans, and the rollout timeline for Full Self-Driving technology.
Markets are also paying attention to any updates related to a potential SpaceX IPO and how it might connect to Tesla’s broader ecosystem. Positive signals on this front could further boost bullish sentiment.
As Tesla continues to be valued more as an AI and robotics company rather than purely an EV manufacturer, strong earnings or encouraging autonomy-related updates could drive additional upside.
Trade Setup:
Entry: ~$401
Target: $436 (+8.7%)
Stop-loss: $387 (-3.5%)
Stock to consider selling: Intel
Intel is heading into a more difficult earnings setup, making it a potential sell or avoid candidate this week. The company is scheduled to report Q1 results on Thursday at 4:00 PM ET, with options markets implying a sizable post-earnings move of around ±9%.
Wall Street expects adjusted earnings per share of roughly $0.02, representing a steep 87% decline compared to the same period last year. Revenue is projected to slip 2% to about $12.4 billion, pressured by ongoing softness in the PC market and continued losses in its foundry segment.
Looking forward, Intel is likely to guide revenue in the $11.7–$12.7 billion range. Despite its widely discussed turnaround strategy, tangible progress remains limited. The foundry business continues to burn cash while facing intense competition from TSMC and Samsung. Meanwhile, its GPU and AI accelerator products have yet to gain meaningful traction in the market.
Although INTC shares have surged about 85% year-to-date in 2026, this strong rally leaves the stock exposed to profit-taking, especially if earnings or guidance disappoint.
From a technical perspective, the RSI stands at an elevated 79.05, signaling overbought conditions. Additionally, declining volume during recent price increases suggests weakening buying momentum as the stock nears resistance in the $70.33–$72.33 range (upper Bollinger Band).
Given the likelihood of underwhelming results and cautious guidance, Intel may present a classic “sell-the-news” scenario. Investors could consider trimming positions ahead of the earnings release.
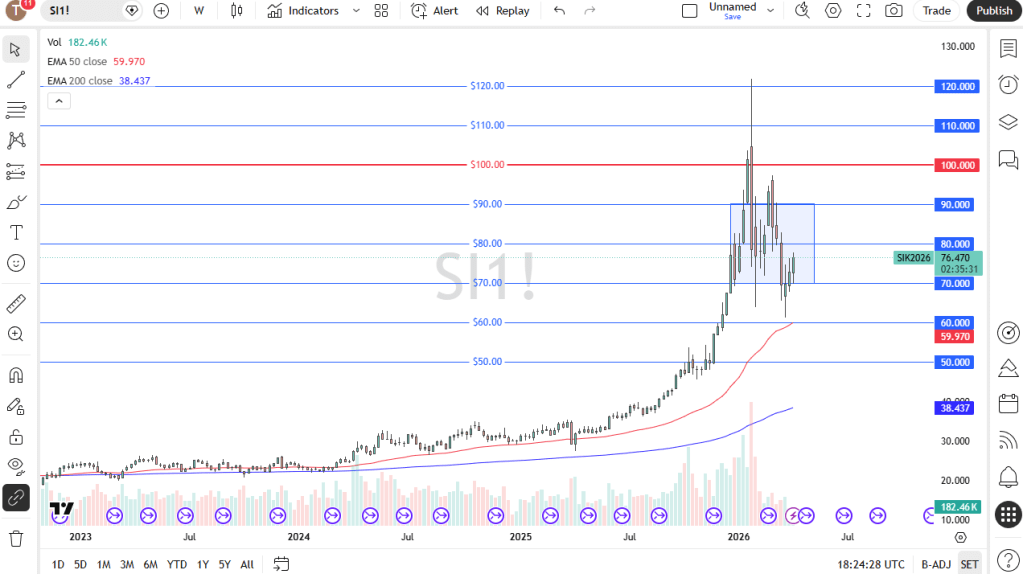
Silver remained under pressure as rising oil prices—driven by renewed tensions in the Strait of Hormuz—intensified inflation concerns. Meanwhile, Iran accused the U.S. of violating the ceasefire after firing on a commercial vessel and warned of imminent retaliation, while also reversing plans to reopen the strait after Washington refused to lift its blockade on Iranian ports.
Silver (XAG/USD) trimmed losses to trade near $80.50 per ounce in Asian hours, but remained under pressure as a surge in oil prices—driven by renewed Strait of Hormuz tensions—heightened inflation risks and expectations of further rate hikes.
The situation escalated after Iran accused the U.S. of breaching a ceasefire by attacking a commercial vessel, while Washington confirmed seizing an Iranian ship. Tehran also отказed to resume negotiations, reversed its brief plan to reopen the strait after the U.S. maintained its port blockade, and warned of retaliation as geopolitical tensions intensified.
Oil
WTI crude climbed to around $86.70 in early Asian trading, supported by the renewed closure of the Strait of Hormuz, which heightened supply concerns, while Iran warned of imminent retaliation following a U.S. naval seizure.
WTI crude traded near $86.70 in early Asian hours on Monday, supported by escalating U.S.–Iran tensions in the Strait of Hormuz that raised fears of supply disruptions. Iran accused the U.S. of breaching a ceasefire after attacking a commercial vessel and warned of retaliation, while also rejecting new peace talks despite Washington’s push for further negotiations.
Meanwhile, traders are awaiting Tuesday’s API inventory report, with a larger draw likely to support prices and a build potentially weighing on the market.
Bitcoin, the largest cryptocurrency by market value, fell 2.02% to trade at 75,064.2 as of 5:46 ET (10:46 GMT), declining after Iran shut the Strait of Hormuz, which triggered a broader risk-off mood across global markets.
Often described as “digital gold,” the asset has struggled to retain its safe-haven status amid the uncertainty, contributing to a wider crypto sell-off as investors move to reevaluate their portfolio exposure.
Geopolitical pressures and institutional flows
Bitcoin’s recent drop is closely tied to escalating tensions in the Middle East. With the renewed closure of the Strait of Hormuz and rising concerns about a broader regional conflict, global markets have turned cautious, prompting investors to shift capital away from riskier, more volatile assets.
Even so, institutional activity tells a more layered story. Bitcoin ETFs have recently attracted $663.91 million in inflows, lifting total net assets in the segment beyond the $100 billion mark.
At the same time, Ether ETFs recorded $127.49 million in inflows, extending their streak to seven consecutive days and pointing to steady growth in institutional demand.
Wider fund participation also remains visible, as XRP saw $13.74 million in inflows while Solana drew $13.04 million, highlighting continued interest across a range of crypto ETF products.
Industry developments deepen the downturn
Beyond the immediate geopolitical shock, underlying structural challenges within the digital asset space have further weighed on investor sentiment.
Recent reports indicate continued regulatory uncertainty surrounding decentralized finance (DeFi) protocols, dampening enthusiasm across ecosystems like Ethereum and Solana. This lack of clarity has created a feedback loop of caution, indirectly pressuring Bitcoin as investors adopt a more defensive, wait-and-see approach.
The cautious mood is reinforced by thin market conditions. Data shows a noticeable decline in stablecoin liquidity across major centralized exchanges, reducing depth in order books. In such an environment, price swings tend to be more pronounced, leaving Bitcoin increasingly exposed to sharp drops and forced liquidations during periods of heightened stress.
Adding to the pressure, persistent inflation concerns and evolving interest rate expectations continue to weigh on risk assets. With yields on safer instruments remaining relatively high, the opportunity cost of holding non-yielding assets like Bitcoin increases, discouraging the kind of aggressive accumulation that previously supported its upward momentum.
Crypto prices today: altcoins decline after Strait closure
Altcoins also moved lower following Iran’s announcement, mirroring the broader market downturn triggered by renewed geopolitical tensions.
Ethereum, the second-largest cryptocurrency, dropped 2.89% to $2,307.42, while XRP, ranked third, fell 2.12% to $1.4198.
Meanwhile, Solana and Cardano recorded steeper losses of 3.40% and 3.54%, respectively.
Among meme coins, Dogecoin slid 3.40%, reflecting widespread weakness across the altcoin segment.
The U.S. dollar climbed to a one-week high against major currencies on Monday, as renewed tensions between the U.S. and Iran and fading hopes for a Middle East peace agreement pushed investors toward safe-haven assets.
Washington said it had seized an Iranian cargo vessel attempting to breach its blockade, while Tehran vowed retaliation, raising fears that hostilities could flare up again. Iran also announced it would not join a second round of talks the U.S. had aimed to begin before a two-week ceasefire expires on Tuesday.
According to Charu Chanana, chief investment strategist at Saxo, the weekend escalation has brought geopolitical risk back into focus just as markets had begun to price in a potential peace dividend. She added that rising oil prices are not only an energy concern but also have broader implications for economic growth and interest rates.
The euro slipped 0.14% to $1.1746, while the British pound dropped 0.29% to $1.3479. The Australian dollar, often seen as a risk-sensitive currency, declined 0.3% to $0.7145 in early trading.
The U.S. dollar index, which tracks the currency against six major peers, stood at 98.38, near a one-week high and recovering some recent losses. Despite this rebound, the index remains down 1.5% for April, as improving risk sentiment earlier in the month had weighed on the dollar. In contrast, it surged 2.3% in March amid strong safe-haven demand following the outbreak of war.
Barclays analysts noted that investor sentiment still favors the dollar, suggesting there may be room for further downside if Middle East tensions ease. They added that any short-term market volatility could present opportunities to rebuild short dollar positions, though uncertainty remains high.
Now in its eighth week, the conflict has triggered one of the most severe disruptions to global energy supply, driving oil prices sharply higher due to the effective closure of the Strait of Hormuz, a key route for roughly 20% of global oil shipments.
The U.S. has continued its blockade of Iranian ports, while Iran has alternated between lifting and reimposing restrictions on shipping through the strategic waterway. This uncertainty pushed oil prices higher on Monday, with Brent crude rising 7% to $96.8 per barrel and U.S. West Texas Intermediate gaining over 8% to $90.74.
Nick Twidale, chief market strategist at ATFX Global in Sydney, said the Strait of Hormuz remains the central concern, and hopes for renewed negotiations before the ceasefire ends now appear unlikely. He expects risk assets to face further downward pressure in the near term.
Elsewhere, the New Zealand dollar edged down slightly to $0.5876, while the Japanese yen weakened to 159.06 per dollar, approaching the key 160 level that could prompt intervention by authorities.
Attention is also turning to the Bank of Japan’s upcoming meeting later this month. Governor Kazuo Ueda has avoided firmly signaling an April rate hike due to uncertainty from the conflict but hinted at a more hawkish stance following last week’s IMF meetings, leaving open the possibility of policy tightening by June.
In cryptocurrency markets, bitcoin fell 0.56% to $74,229.65, while ether declined 0.2% to $2,276.04.
Gold continues to trade in a narrow range below the $4,800 mark early Friday, failing for a third straight day to hold above that level. Market participants remain cautious as they await clearer direction from upcoming US–Iran peace talks, while the metal still looks set for a fourth consecutive weekly gain.
Fundamental Overview
With the two-week US–Iran ceasefire set to expire on April 22, uncertainty around both the timing and outcome of the next round of negotiations continues to unsettle investors, keeping Gold prices fluctuating within a familiar range.
Upside momentum in Gold remains limited, pressured by the recent rebound in Oil prices amid ongoing concerns about supply disruptions tied to the US naval blockade of the Strait of Hormuz. Higher Oil prices have revived inflation fears, reinforcing expectations that major central banks—including the US Federal Reserve (Fed)—may maintain a tighter monetary policy stance.
Late Thursday, the US Central Command (CENTCOM) stated that the USS Abraham Lincoln is operating in the Arabian Sea as part of a large-scale enforcement of the blockade on Iranian ports, involving more than a dozen ships, over 100 aircraft, and around 10,000 personnel, with no reported violations so far.
Meanwhile, a modest rebound in the US Dollar from near six-week lows is adding further pressure on USD-denominated Gold.
That said, downside risks for the precious metal appear limited. A newly announced 10-day ceasefire between Israel and Lebanon has lifted hopes for a near-term de-escalation in the Middle East, reducing safe-haven demand for the US Dollar and offering some support to Gold.
Heading into the weekend, Gold remains directionless and highly sensitive to developments on the Middle East front. Thin end-of-week flows could also amplify price swings, especially amid lingering uncertainty over US–Iran negotiations and the durability of the Israel–Lebanon truce.
From a technical perspective, the daily chart setup adds another layer of intrigue, keeping traders focused on both geopolitical headlines and key chart signals for the next move.
XAU/USD Technical Overview
On the daily chart, XAU/USD is trading around $4,789.50, with price action confined between key support levels and overhead resistance. The metal remains supported above the 21-day and 100-day SMAs, near $4,646 and $4,715 respectively, but continues to struggle below the 50-day SMA at $4,897 and a descending trendline resistance around $4,792. The Relative Strength Index (14), hovering near 51, points to neutral momentum with a slight bullish tilt, indicating consolidation rather than a clear breakout as price lingers just beneath trend resistance.
At the same time, bearish signals persist in the background. A Bear Cross between the 21-day and 100-day SMAs confirmed on April 13, along with a similar crossover seen on March 25, continues to weigh on bullish prospects.
Looking higher, immediate resistance is seen at the descending trendline near $4,792. A decisive daily close above this level could pave the way toward the 50-day SMA at $4,897 as the next upside target. On the downside, initial support lies at the 100-day SMA around $4,715, followed by a broader ascending trendline zone in the mid-$4,500s, which reinforces demand ahead of the 21-day SMA near $4,646. Only a sustained break below these support layers would expose the longer-term 200-day SMA near $4,215.
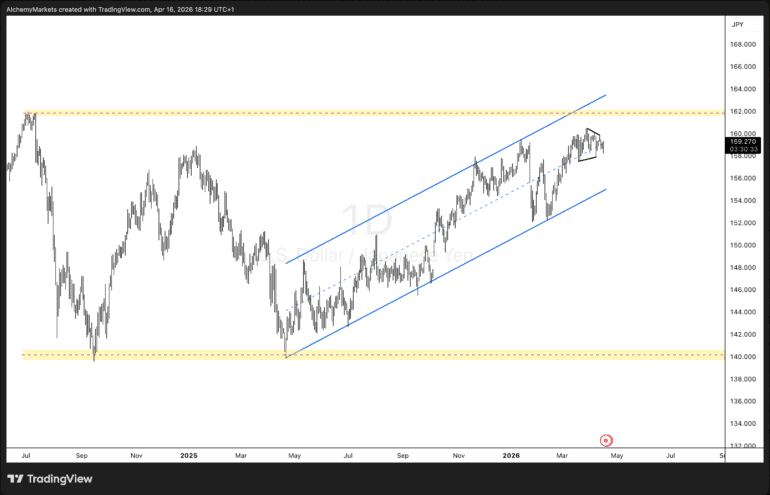
USD/JPY remains confined within a well-defined ascending channel on the higher timeframe, preserving a strong bullish structure. The pair continues to post higher highs and higher lows, indicating that buyers are still firmly in control.
Attention now shifts to the 162.00 level, a key resistance zone that has previously limited upward moves. As price approaches this area once again, the setup points toward a possible breakout.
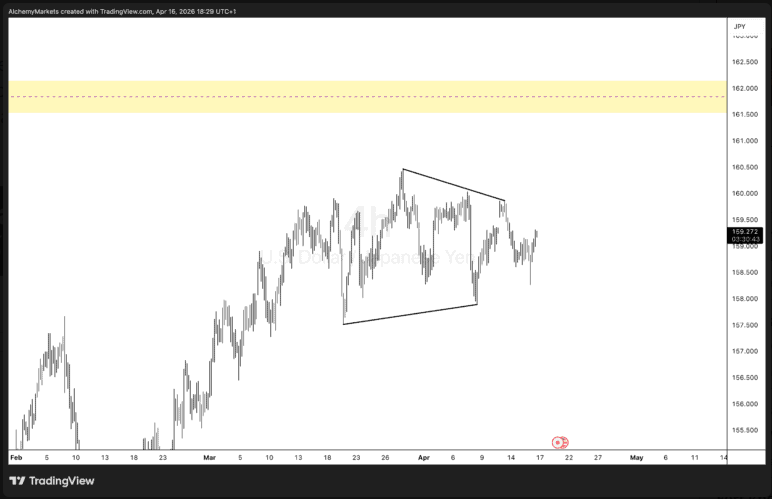
On the lower timeframe, price action is forming a tight triangle pattern, reflecting short-term consolidation and indecision. Such formations often precede a surge in volatility.
Given the prevailing uptrend, the bias favors an upside break. A decisive move above the triangle resistance could spark fresh momentum, paving the way toward the 162.00 barrier.
Key takeaway:
USD/JPY is consolidating within a triangle while maintaining a broader uptrend. A breakout to the upside would likely target 162.00, while in the meantime, price may remain compressed—but not indefinitely.
Easing tensions in the Middle East have weakened the dollar.
Meanwhile, the Bank of England is guiding rate expectations, keeping the prospect of two hikes intact.
Over the past two weeks, the US dollar has slid to its weakest level since early March, erasing nearly all the gains recorded at the onset of the Middle East conflict. With talks involving Iran expected to resume soon, and Donald Trump maintaining that the war will end shortly without the need for a ceasefire extension, geopolitical support for the greenback has faded. Alongside record highs in US equity indices, this shift has helped sustain the EUR/USD rally, as macroeconomic factors regain prominence.
At the same time, investor focus has turned toward corporate earnings and Congressional discussions over Kevin Warsh’s potential appointment as Fed Chair. Despite Trump’s assurances, a leadership change at the Fed could coincide with rising inflation driven by higher oil prices, potentially necessitating tighter monetary policy. The key question remains whether Warsh would align with the president’s stance or uphold the Fed’s independence.
Some investors are drawing comparisons to the 1970s, when an oil-driven inflation shock prompted a Fed Chair aligned with the White House to loosen policy. That decision fueled even higher inflation and entrenched expectations, leading to a sharp decline in the US dollar. Only after a change in leadership and aggressive rate hikes—despite a recession—did the dollar begin a sustained recovery from mid-1980 onward.
Potential currency interventions may also weigh on the dollar. Japan’s Finance Minister, Satsuko Katayama, has long advocated selling USD/JPY, and her rhetoric has intensified following talks with Scott Bessent. This hints that the US may be open to coordinated action in the FX market, reminiscent of the 1985 interventions that triggered a prolonged decline in the dollar.
Meanwhile, other European currencies are advancing alongside the euro. The British pound has climbed back to pre-war levels, supported in part by the Bank of England’s hawkish tone. Megan Green has backed market expectations of two rate hikes in 2026, while Andrew Bailey suggested earlier projections of four hikes were excessive.
The US Dollar Index trades sideways near 98.25 during Friday’s Asian session.
Donald Trump signals optimism over a potential peace agreement with Iran.
Meanwhile, markets anticipate that interest rates will remain unchanged throughout the year.
The US Dollar Index (DXY), which tracks the US Dollar against a basket of six major currencies, is hovering around 98.25 during Friday’s Asian session. The index remains largely unchanged as uncertainty persists over the Israel–Lebanon ceasefire. Investors are also looking ahead to potential US–Iran talks this weekend for clearer direction.
A 10-day ceasefire between Lebanon and Israel came into force on Thursday, but tensions in the region remain elevated, supporting demand for safe-haven assets like the US Dollar. On Friday, the Lebanese army accused Israel of breaching the truce, citing sporadic shelling in several southern villages.
At the same time, optimism surrounding a US–Iran ceasefire could limit further gains in the Dollar. A temporary two-week agreement is currently in place and is set to expire next week. US President Donald Trump indicated that the next round of discussions between Washington and Tehran could happen over the weekend.
According to Sim Moh Siong, FX strategist at OCBC, markets are currently consolidating after pricing in earlier optimism about a ceasefire extension. He noted that a new catalyst will be needed to drive clearer directional moves, as the Dollar’s trajectory is no longer one-sided.
Meanwhile, traders are closely monitoring how Federal Reserve officials will respond to inflation risks stemming from the conflict. Fed funds futures suggest that markets still expect the central bank to keep interest rates unchanged this year, Reuters reported.
Gold stays under pressure but lacks strong follow-through selling amid mixed signals. The US dollar finds support from ongoing Hormuz-related risks, acting as a headwind for the metal. However, optimism over Iran diplomacy and easing expectations for Fed rate hikes help cap the dollar, providing some support to bullion.
Gold (XAU/USD) trims its earlier losses from the Asian session, rebounding from the $4,768–$4,767 area—a three-day low—but struggles to build momentum and stays below the $4,800 level amid mixed signals. While diplomatic efforts to resolve the Middle East conflict are intensifying, lingering tensions between the US and Iran, particularly due to the ongoing US naval blockade of Iranian ports, continue to support the US Dollar’s safe-haven appeal and weigh on the metal.
At the same time, a 10-day ceasefire between Israel and Lebanon has raised hopes for a broader US-Iran agreement. US President Donald Trump struck an upbeat tone, suggesting Iran is close to a deal, and reports indicate both sides have agreed in principle to resume talks, though details remain undecided. These developments support a more positive market mood, which, alongside reduced expectations of further Federal Reserve rate hikes, limits the USD’s rebound from recent lows and helps cushion Gold’s downside.
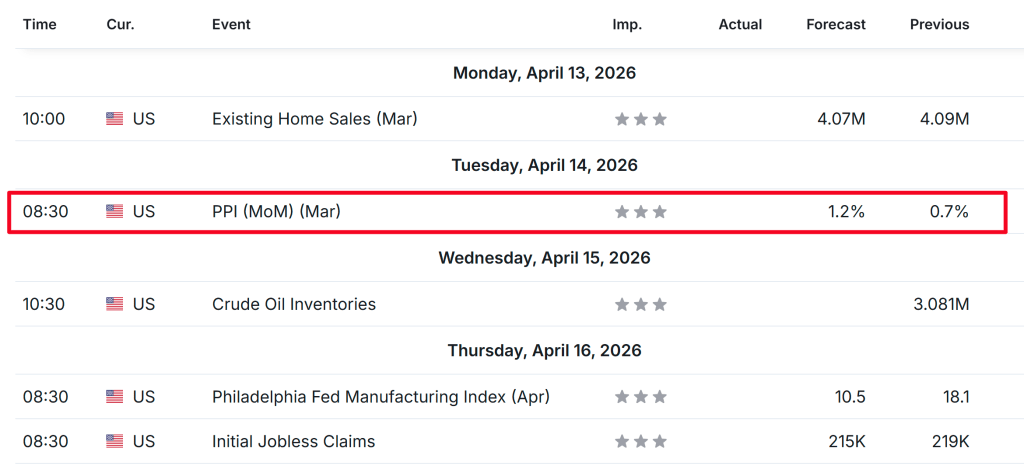
Earlier in the week, US Producer Price Index (PPI) data eased concerns about inflation stemming from rising energy costs linked to the conflict. Additionally, expectations of easing geopolitical tensions have kept Crude Oil prices subdued, softening hawkish Fed expectations. Markets are now pricing in about a 30% chance of a Fed rate cut by year-end, restraining USD strength and providing support for non-yielding assets like Gold. As such, traders may prefer to wait for stronger selling pressure before anticipating a deeper pullback from the recent one-month high.
Looking ahead, the absence of key US economic data on Friday leaves the USD influenced by speeches from FOMC members. However, attention will remain focused on potential US-Iran talks over the weekend, with headlines likely to drive volatility and create trading opportunities in Gold. Despite recent fluctuations, XAU/USD is still on track for modest gains for a third consecutive week.
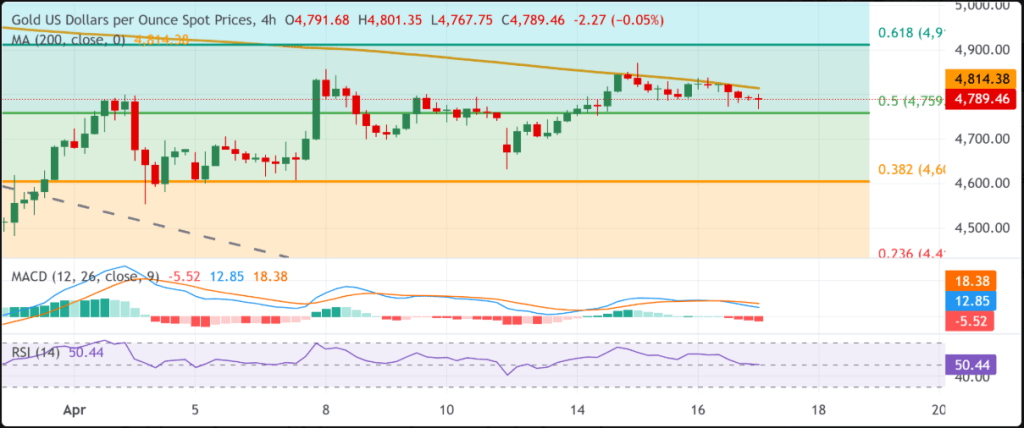
Gold H4 chart
From a technical standpoint, the failure to break above the 200-period SMA on the 4-hour chart overnight signals a note of caution for bullish traders. Although prices pulled back afterward, the decline found support ahead of the 50% retracement of the March drop, suggesting that traders may prefer to wait for a decisive move below the $4,765 support area before anticipating deeper losses.
Momentum indicators offer a mixed picture. The RSI is hovering around the neutral 50 level, while the MACD remains below the zero line in negative territory, indicating that sellers still hold a near-term edge. For sentiment to improve, price would need to reclaim the 200-period SMA near $4,814, followed by a stronger resistance at the 61.8% Fibonacci retracement around $4,912. A sustained breakout above these levels could shift the outlook more positively and pave the way toward $5,130 and $5,409.
On the downside, immediate support lies near the 50% retracement at $4,759. A break below this level could lead to further declines toward $4,606 and then $4,416, where buyers may step in more aggressively to defend the broader uptrend.
EUR/USD is consolidating after approaching the 1.1825 level, as markets pause for fresh catalysts.
Optimism around renewed US–Iran negotiations is keeping the pair supported, with reports suggesting Iran may be willing to make concessions on uranium enrichment—reducing safe-haven demand for the US dollar.
At the same time, ECB policymaker François Villeroy has signaled that a rate hike at the April 30 meeting is unlikely, reinforcing expectations that the central bank will wait for more data before tightening policy.
EUR/USD is trading quietly around 1.1777 in Friday’s Asian session, moving sideways after a two-week rally that stalled near 1.1825, as investors await clarity on the next round of US–Iran negotiations.
Market sentiment remains cautiously positive, with S&P 500 futures holding steady after a modest gain, while the US Dollar Index edges slightly higher but is still on track for a weekly decline.
Geopolitically, uncertainty persists as no timeline has been set for renewed talks, though President Trump expressed optimism that Iran may abandon its uranium enrichment program and suggested a deal could be close, while warning of possible military action if negotiations fail.
Meanwhile, ECB policymaker François Villeroy de Galhau has dampened expectations of a rate hike at the upcoming April meeting, stating that such discussions are premature, reinforcing a more cautious monetary policy outlook in the Eurozone.
Technical Overview
EUR/USD is moving sideways near 1.1777 during the Asian session, but the short-term outlook remains mildly bullish. The pair continues to trade above its 20-day EMA at 1.1673, preserving the recent upward momentum after bouncing from the mid-1.15 region. Momentum indicators also support this view, with the 14-day RSI around 62, indicating steady buying pressure without entering overbought territory.
On the downside, the 20-day EMA at 1.1673 acts as immediate support. A decisive break below this level could undermine the current rally and trigger a deeper retracement toward the mid-1.15 consolidation zone. However, as long as this support holds, the bullish bias remains intact, with potential for a move above the April 16 peak of 1.1825 and further gains toward the February high near 1.1929.
The United States came close to becoming a net crude exporter last week for the first time since World War II, as exports surged to near-record levels to satisfy demand from Asia and Europe, where buyers were scrambling to replace Middle Eastern supplies disrupted by the Iran conflict. The war involving the U.S., Israel, and Iran caused an unprecedented shock to global energy markets, with threats to shipping through the Strait of Hormuz halting roughly 20% of global oil and gas flows. As a result, refiners in affected regions turned to alternative sources, significantly increasing demand for U.S. crude, though analysts note exports are nearing capacity limits.
Net U.S. crude imports dropped to just 66,000 barrels per day last week—the lowest level since records began in 2001—while exports rose to 5.2 million bpd, a seven-month high. Historically, the U.S. was last a net crude exporter in 1943. Strong export growth reflects how buyers in Europe and Asia are reaching further afield for supply, with price differences offsetting shipping costs. Countries like Greece have recently begun importing U.S. crude for the first time, and major buyers include the Netherlands, Japan, France, Germany, and South Korea. Nearly half of U.S. exports went to Europe, while Asia’s share has grown significantly.
Meanwhile, U.S. imports fell sharply, partly because domestic refineries rely on heavier crude than what the U.S. typically produces. A widening price gap—driven by a surge in Brent crude relative to West Texas Intermediate—has made U.S. oil more attractive overseas while reducing domestic demand for imports. Spot prices for crude deliveries to Europe and Africa have also hit record highs.
Despite strong demand, U.S. export growth is approaching logistical limits. Exports may average around 5.2 million bpd in April, close to the estimated maximum capacity of about 6 million bpd, constrained by pipeline infrastructure and tanker availability. Although releasing medium sour crude from strategic reserves could free up more light crude for export, higher shipping costs and limited tanker supply could dampen further growth. About 80 empty supertankers were reportedly heading to the Gulf of Mexico, likely to load crude in the coming weeks.
Over the past two months, as highlighted in our previous update, Ethereum’s Elliott Wave structure has progressed in line with our long-term outlook, indicating that the broader fourth wave likely concluded earlier this year and that the fifth wave has now begun. Refer to Figure 1 below.
In the near term, following the February low, the Elliott Wave structure points to the formation of a rare leading expanding diagonal as wave one—an uncommon yet bullish pattern that still needs a few more developments before it can be considered complete. Refer to Figure 2 below.
Furthermore, Ethereum has reclaimed its 20-day, 50-day, and 100-day Simple Moving Averages (SMA), while also breaking above the long-standing downtrend line that had limited gains since last October (blue horizontal arrow). This breakout adds confirmation to a strengthening bullish trend and boosts confidence in continued upside momentum.
Key resistance now lies at the upper boundary of the Ichimoku Cloud around $2,395. A decisive move above this level could open the path toward the gray 200% extension at $2,626, as well as the 200-day SMA, currently near $2,910 and declining by roughly $10 per day. At this pace, the 200-day SMA could converge with $2,626 within a month.
On the downside, bulls will want to see price remain above the former downtrend line, as a drop below it would signal a failed breakout. A further decline beneath the critical support at the March 29 low of $1,938 (marked as the red “final warning” level) would invalidate the developing bullish outlook.
Bitcoin pulled back slightly on Tuesday, falling below $75,000 after briefly reaching a one-month high, but remained broadly higher as optimism over potential U.S.-Iran ceasefire talks lifted risk sentiment. A better-than-expected U.S. producer inflation report also supported the positive mood.
As of 17:35 ET (21:35 GMT), the leading cryptocurrency was up 1.2% at $74,127.8, after earlier climbing to $76,043.7 during the session.
Bitcoin climbs as a broader risk-on sentiment lifts markets.
Bitcoin climbed alongside a broader risk-on trend, mirroring a rebound in global markets as equities posted solid gains. S&P 500 rose over 1%, while Nasdaq Composite advanced as investors continued to favor technology stocks amid optimism around artificial intelligence.
Crypto sentiment was further supported by falling oil prices, which dropped below $100 per barrel after recent spikes, encouraging demand for riskier assets.
Markets were also reassured by ongoing diplomatic signals between the United States and Iran, despite a lack of progress in recent talks. Reports suggested both sides are considering another round of direct negotiations to extend a fragile ceasefire. Donald Trump noted that further discussions could take place within days in Pakistan.
Meanwhile, the U.S. blockade of the Strait of Hormuz entered its second day, with United States Central Command reporting that no vessels had passed through in the first 24 hours, as restrictions targeted ships linked to Iranian ports.
U.S. producer prices increased in March, but by less than expected.
U.S. producer prices increased in March, but not as much as expected. Alongside ongoing Middle East tensions, the inflation data gave investors some reassurance after a volatile period.
The producer price index (PPI) rose 0.5% compared to the previous month and 4.0% year-on-year, according to the Bureau of Labor Statistics—both below forecasts of 1.1% and 4.6%. Core PPI, which excludes food and energy, edged up 0.1% month-on-month and 3.8% annually.
The annual headline increase was the highest since February 2023, largely driven by a sharp 8.5% jump in energy prices during the month. This trend mirrored the consumer price index data released earlier, where rising oil prices linked to the Iran conflict lifted overall inflation, while core inflation remained relatively stable.
Deutsche Börse acquires a $200 million stake in the parent company of crypto exchange Kraken.
Deutsche Boerse has invested $200 million in Payward, the parent company of crypto exchange Kraken, by purchasing existing shares. This gives the German exchange operator a 1.5% fully diluted stake in the firm.
The move strengthens a strategic partnership between the two companies first announced in December 2025, which focuses on connecting traditional financial markets with the digital asset space.
According to Deutsche Boerse, the collaboration will cover areas such as trading, custody, settlement, collateral management, and tokenized assets—aiming to provide institutional clients with smoother, more integrated access to both traditional and crypto markets.
Strategy Inc purchases 13,927 BTC using proceeds from preferred stock sales.
Strategy Inc (NASDAQ:MSTR) announced Monday that it purchased 13,927 bitcoins last week for roughly $1 billion, partly financed through the sale of preferred shares, according to a U.S. SEC filing. The company issued about 10.03 million shares of its variable-rate Series A perpetual preferred stock, generating approximately $1 billion in net proceeds. These funds were used to acquire Bitcoin at an average price of around $71,902 per coin. With this latest purchase, Strategy’s total Bitcoin holdings increased to 780,897 BTC, acquired at a combined cost of $59.02 billion.
Crypto prices today: altcoins rally, with Ethereum surging 7%.
Most altcoins trimmed earlier gains on Tuesday.
The second-largest cryptocurrency, Ethereum, rose 2.6% to $2,319.42, while third-ranked XRP gained 0.7% to $1.3604.
Solana turned lower, slipping 0.3%, whereas Cardano edged up 0.4%.
Among meme coins, Dogecoin posted a modest 0.5% increase.
Oil prices declined for a second consecutive day on Wednesday as expectations grew that peace talks between the U.S. and Iran could resume, potentially restoring supply from the Middle East that has been disrupted by the closure of the Strait of Hormuz.
Brent crude slipped 0.55% to $94.27 per barrel after a sharp 4.6% drop in the previous session, while U.S. West Texas Intermediate fell 1.1% to $90.24 following an even steeper 7.9% decline earlier.
Investor sentiment improved after President Donald Trump suggested that negotiations to end the conflict involving the U.S., Israel, and Iran could restart in Pakistan within days. The earlier breakdown in talks had led Washington to impose a blockade on Iranian ports, but renewed diplomatic hopes are raising expectations that oil and fuel flows could eventually resume.
The conflict has effectively shut down the Strait of Hormuz, a crucial route for transporting crude and refined products from the Gulf to global markets, particularly in Asia and Europe. Although a ceasefire has been in place for two weeks, shipping activity remains severely limited, with vessel traffic far below pre-war levels.
On Tuesday, a U.S. warship reportedly prevented two oil tankers from departing Iran, underscoring ongoing disruptions. Analysts at the Schork Group noted that while diplomatic developments hint at easing restrictions, actual conditions on the ground remain unstable, leaving markets focused on the risk of supply disruptions rather than a full recovery.
Further tightening supply concerns, U.S. officials indicated that sanctions waivers on Iranian oil shipments will not be renewed, and a similar waiver for Russian oil has already expired.
Later in the day, attention will turn to U.S. inventory data from the Energy Information Administration. Expectations are for a modest increase in crude stockpiles, alongside declines in gasoline and distillate inventories. Meanwhile, preliminary data from the American Petroleum Institute suggested that crude inventories rose for a third straight week.
The U.S. dollar declined on Tuesday as investors moved away from the safe-haven currency and shifted toward riskier equities, supported by optimism over potential ceasefire progress between the U.S. and Iran, despite the ongoing naval blockade in the Persian Gulf.
Risk sentiment was further strengthened by a much weaker-than-expected U.S. producer inflation report, easing concerns that the Iran-related energy shock could fuel inflation—especially after a recent surge in consumer prices.
By 17:20 ET (21:20 GMT), the U.S. Dollar Index, which measures the greenback against six major currencies, had dropped 0.3% to 98.12.
The Hormuz blockade continued into its second day, even as Donald Trump signaled that potential negotiations could be on the horizon.
The blockade of the Strait of Hormuz entered its second day even as President Donald Trump highlighted the possibility of renewed negotiations.
The U.S. dollar, which had initially strengthened as a safe-haven asset following the outbreak of the Iran conflict in late February, has recently weakened amid growing optimism that tensions could ease.
This optimism increased on Tuesday after Trump told the New York Post that additional talks “could take place within the next two days” in Pakistan. According to earlier reports, the U.S. and Iran have remained in contact and made some progress toward a lasting ceasefire agreement.
Trump also stated that Iranian officials had reached out to the White House expressing interest in striking a deal, while reiterating that Iran would not be allowed to develop nuclear weapons. The U.S. is reportedly insisting that Iran halt uranium enrichment for 20 years, a key step in nuclear weapons development.
At the same time, the U.S. naval blockade of vessels entering and leaving Iranian ports continued into its second day. The U.S. Central Command said the operation involves over 10,000 personnel, more than a dozen warships, and dozens of aircraft to enforce the restrictions.
CENTCOM reported that within the first 24 hours, no ships managed to pass through the blockade, and six commercial vessels complied with U.S. directives to turn back toward ports in the Gulf of Oman.
British maritime authorities also confirmed that access has been limited for ships attempting to enter or exit Iranian ports, as well as in nearby waters including the Persian Gulf, Gulf of Oman, and parts of the Arabian Sea.
Trump noted that the blockade began on Monday after weekend ceasefire negotiations failed to produce immediate results. The move risks further disrupting already reduced oil flows through the Strait of Hormuz, a critical route that carries about one-fifth of the world’s oil supply.
U.S. producer inflation came in weaker than expected.
U.S. producer inflation came in less severe than expected, drawing significant market attention on Tuesday. The March producer price index (PPI) rose 0.5% month-on-month and 4.0% year-on-year, falling short of forecasts of 1.1% and 4.6%. Meanwhile, core PPI increased by 0.1% over the month and 3.8% compared to a year earlier.
Despite the softer-than-expected overall figures, the annual rise in headline PPI marked the largest increase since February 2023, largely driven by a sharp 8.5% monthly surge in energy prices for final demand.
Even so, the weaker headline data helped ease investor concerns.
Guy LeBas, chief fixed income strategist at Janney, noted on X that expectations had been elevated due to fears of rising energy input costs, which were not fully reflected in the data.
He added that although gas prices are clearly higher, these cost increases may take several months to filter through the economy rather than appearing all at once. This gradual pass-through could complicate monetary policy, as it may delay the Federal Reserve’s confidence that inflation pressures are not spreading beyond the energy sector.
The euro and British pound strengthened, while the yen also gained despite weak economic data.
Among major currencies, both the euro (EUR/USD) and the British pound (GBP/USD) moved higher, supported by the softer U.S. dollar. The euro rose 0.2% to $1.1795, while the pound gained 0.4% to $1.3567.
The Japanese yen also strengthened, with USD/JPY slipping 0.3% to 158.80, despite data showing Japan’s industrial production fell 2% month-on-month in February after a 4.3% increase in January.
In other markets, the Australian dollar (AUD/USD) increased 0.3% to $0.7122, even though economic indicators were weak. According to National Australia Bank, business confidence dropped sharply in March following the Iran conflict, while the Westpac–Melbourne Institute survey showed a steep decline in consumer sentiment in April.
Oil prices slipped in early Asian trading on Tuesday as renewed hopes for U.S.–Iran negotiations eased worries about supply disruptions linked to the U.S. blockade of the Strait of Hormuz.
Brent crude dropped $1.86 (1.87%) to $97.50, while WTI fell $2.25 (2.27%) to $96.83. This pullback followed strong gains in the previous session, when prices surged after the U.S. launched a blockade of Iran’s ports.
The U.S. military expanded the blockade beyond the strait into the Gulf of Oman and the Arabian Sea, with early signs of disruption already visible as ships began turning back. In response, Iran warned it could target ports in neighboring Gulf countries after weekend talks in Islamabad failed to produce a resolution.
Despite the breakdown, optimism lingered as both sides signaled a willingness to keep negotiations alive. Analysts noted that even the hint of a potential deal helped cool the rally in oil prices.
Market estimates suggest roughly 10 million barrels per day of supply have already been affected, with the risk of further losses if the blockade continues. Still, analysts argue that tight supply conditions alone may be enough to keep prices elevated.
Meanwhile, NATO allies such as Britain and France declined to support the blockade, instead pushing for the reopening of the key shipping route. U.S. officials indicated prices could peak in the coming weeks if flows resume.
Global institutions, including the IMF, World Bank, and IEA, urged countries to avoid hoarding or restricting exports, warning of a major shock to the energy market. OPEC also trimmed its global demand forecast for the second quarter by 500,000 barrels per day.
Bitcoin continued its upward momentum on Monday, supported by stronger risk sentiment driven by lingering optimism around potential U.S.–Iran negotiations, even after weekend talks failed and a naval blockade in the Strait of Hormuz was initiated.
The leading cryptocurrency climbed 2.6% to $73,196.1 by late U.S. trading hours.
Despite 21 hours of negotiations, U.S. and Iranian officials were unable to secure a deal to reinforce a temporary ceasefire. Meanwhile, former President Donald Trump confirmed that a U.S. naval blockade in the key oil transit route would take effect, signaling a possible escalation in Middle East tensions and raising concerns over global shipping and energy supply disruptions.
Although such disruptions have limited direct impact on cryptocurrencies, they could weigh on global economic growth and dampen investor appetite for riskier assets. Sentiment had already been pressured by a sharp rise in U.S. inflation in March, largely fueled by higher energy costs linked to the conflict.
Separately, Bhutan has reportedly reduced its Bitcoin holdings by around 70% since October 2024, now holding roughly 3,954 BTC valued at $280.6 million, down significantly from its previous peak. The reasons for the sell-off remain unclear.
At the same time, MicroStrategy continued to expand its crypto exposure, purchasing nearly 14,000 BTC last week for about $1 billion. This brings its total holdings to 780,897 BTC, acquired at an average price of $75,577 per coin.
Across the broader crypto market, altcoins posted modest gains. Ether rose 1.8% to $2,253.38, XRP added 0.8%, while Cardano, Solana, and BNB recorded smaller increases.
Asian currencies posted modest gains on Tuesday, while the U.S. dollar weakened as Washington initiated a blockade on Iranian ships in an effort to push Tehran toward a more durable ceasefire agreement.
Investors also turned their attention to upcoming U.S. producer price index (PPI) data for further signals on the interest rate outlook in the world’s largest economy.
The Chinese yuan strengthened despite disappointing March trade data, which showed exports and the overall trade balance falling short of expectations, even as imports surged well beyond forecasts. Meanwhile, the Singapore dollar remained largely unchanged after first-quarter GDP growth came in below estimates, although the country’s central bank slightly tightened its monetary policy.
Market sentiment was somewhat supported by reports that several Asian and Middle Eastern nations were working to facilitate renewed ceasefire negotiations between the U.S. and Iran.
The dollar index and its futures slipped around 0.1% during Asian trading hours, putting the greenback on track for losses in seven of the past eight sessions. Although the dollar had previously gained on safe-haven demand during the escalation of the Iran conflict, it has since pulled back as investors anticipate possible de-escalation.
The U.S. officially began blockading Iranian ports and vessels on Monday. However, President Donald Trump indicated that Tehran had reached out to Washington expressing interest in a ceasefire. Vice President JD Vance also noted signs of progress, despite limited outcomes from recent peace talks held in Pakistan.
Inflation remains a key concern tied to the conflict, particularly after last week’s data showed a sharp rise in U.S. consumer prices for March. Markets are now awaiting the latest PPI figures for further direction.
In China, the yuan gained as data revealed a sharper-than-expected drop in the trade surplus. Export growth slowed, partly due to disruptions caused by the Iran conflict and rising global shipping costs, while imports surged on stronger domestic demand, particularly for semiconductors and server-related equipment from South Korea.
Overall, the data suggested underlying resilience in China’s domestic economy, raising expectations that stronger import activity and price pressures could help boost inflation.
Elsewhere in Asia, currencies generally strengthened. The Singapore dollar held steady after weaker-than-expected economic growth, even as the Monetary Authority of Singapore tightened policy by adjusting the upper range of its exchange rate band.
The Japanese yen also appreciated, with USD/JPY falling 0.3%, after Finance Minister Satsuki Katayama urged caution in commenting on the Bank of Japan’s policies. Meanwhile, the South Korean won edged up 0.1%, and the Australian dollar gained 0.2%.
WTI surges about 8% toward $100 after the U.S. blocks the Strait of Hormuz Strait of Hormuz.
West Texas Intermediate (WTI) – the US crude benchmark – started the week with a bullish gap, rising around 8% as it moves back toward the $100 level.
The rally follows renewed escalation in tensions between the United States and Iran after weekend peace talks lasting 21 hours collapsed.
US President Donald Trump responded by pledging a blockade of Iranian ports and maritime traffic through the Strait of Hormuz.
The US Central Command (CENTCOM) also stated that forces will begin restricting all vessel movement in and out of Iranian ports from Monday at 10:00 AM ET (14:00 GMT).
According to a Wall Street Journal report, Trump and his advisers are also considering limited military strikes on Iran alongside the blockade to increase pressure in stalled negotiations.
Market attention now shifts to further details on the blockade and its potential impact on the already fragile US–Iran ceasefire.
EUR/USD extends its gains as bullish momentum builds, with traders targeting further upside.
EUR/USD has extended its upside momentum, breaking higher after a decisive technical breakout.
The pair began a fresh rally above 1.1650 and moved beyond a key contracting triangle resistance at 1.1610 on the 4-hour chart.
Price action is now trading above 1.1665 as well as both the 100-period (red) and 200-period (green) simple moving averages, confirming a stronger bullish structure. The breakout has already driven the pair toward the 1.1740 area.
If buyers maintain control, the next upside targets are seen at 1.1780, with initial major resistance at 1.1800. A sustained break above this level could open the path toward 1.1840, and a further close above it would expose potential gains toward 1.1920 and even the 1.2000 psychological level.
On the downside, immediate support lies near 1.1685, aligning with the 23.6% Fibonacci retracement of the recent move from 1.1505 to 1.1739. Key support follows at 1.1620 and the 1.1600 region, which also aligns with the 200-SMA. A breakdown below 1.1600 could shift momentum lower toward the 100-SMA, with deeper losses potentially reopening the 1.1500 area.
Iran-related geopolitical tensions, upcoming PPI inflation data, and the kickoff of the first-quarter earnings season will dominate market attention in the coming week.
Netflix appears poised for a possible breakout as it approaches its Q1 earnings release.
Meanwhile, Johnson & Johnson is expected to face pressure, with forecasts pointing to a decline in earnings.
U.S. stocks mostly ended lower on Friday, though the S&P 500 still posted its strongest weekly performance since November, as investors monitored the fragile two-week ceasefire between the U.S. and Iran.
For the week, the benchmark S&P 500 surged 3.6%, the Dow Jones Industrial Average advanced 3%, the tech-heavy Nasdaq Composite climbed 4.7%, and the small-cap Russell 2000 added 4%.
Looking ahead, market focus will again center on Middle East developments and oil prices after weekend peace talks between the U.S. and Iran ended without an agreement. In response, President Donald Trump said on Sunday that the U.S. Navy will start blockading ships entering or leaving the Strait of Hormuz.
Beyond geopolitical tensions, the upcoming week features a relatively light U.S. economic calendar, with key reports including producer price inflation, existing home sales, and initial jobless claims.
At the same time, the first-quarter earnings season gets underway, with major banks like JPMorgan Chase, Bank of America, Citigroup, Wells Fargo, Goldman Sachs, and Morgan Stanley set to report. Beyond the banking sector, companies including Netflix, Johnson & Johnson, PepsiCo, Taiwan Semiconductor, and ASML are also scheduled to release their results next week.
No matter which way the market moves, below I outline one stock that could attract strong buying interest and another that may face additional downside pressure. Keep in mind, this outlook only covers the upcoming week, from Monday, April 13 through Friday, April 17.
Stock to Buy: Netflix
Netflix looks like a strong candidate for upside this week. The streaming leader is set to release its first-quarter earnings after Thursday’s market close, followed by a live management interview. According to the options market, investors are expecting a notable move in NFLX shares after the announcement, with an implied swing of about ±6.9% in either direction.
Netflix is expected to post earnings of $0.79 per share, marking a 19.7% year-over-year increase. Revenue is projected to rise 15.5% to $12.18 billion, driven by solid streaming growth, strategic price hikes, and the rapid scaling of its ad-supported tier.
Investor sentiment has improved after Netflix walked away from acquiring the streaming and studio assets of Warner Bros. Discovery, sidestepping a large, debt-intensive deal. This decision helped maintain balance sheet flexibility and allowed the company to redirect capital toward content creation, share buybacks, and expanding its advertising business.
Looking forward, developments such as Netflix’s push into sports and gaming point to emerging growth opportunities.
After a sharp decline earlier this year—largely triggered by its scrapped attempt to acquire Warner Bros. Discovery’s streaming and studio assets—Netflix stock has staged a recovery as investors shifted their attention back to the company’s fundamental strengths.
The stock is now exhibiting strong upward momentum, having broken out of a double-bottom pattern at $75.21 and climbing to $103.01. It continues to gain traction ahead of Q1 earnings. The MACD remains in bullish territory, while the price is holding comfortably above both the 20-day and 50-day moving averages, indicating a solid uptrend.
In contrast, Johnson & Johnson appears to be heading into a more difficult earnings period, making it a stock to consider avoiding or selling this week. The company is scheduled to report its Q1 results before the market opens on Tuesday at 6:20 AM ET.
Analyst sentiment has turned more cautious ahead of the release, with roughly half of the recent estimate revisions trending downward. Meanwhile, the options market is anticipating a potential post-earnings move of about ±3.8% in JNJ shares.
Analysts expect a slight decline in Q1 earnings per share, with consensus estimates around $2.68—pointing to a low single-digit drop compared to the same period last year. Revenue, however, is projected to remain relatively stable, coming in between $23.4 billion and $23.6 billion, supported by continued strength in the Innovative Medicine and MedTech divisions.
Although the company benefits from a well-diversified portfolio and a solid pipeline—including key treatments like Darzalex—its near-term outlook lacks strong catalysts that could drive a meaningful upside surprise.
Management guidance and commentary are also unlikely to significantly shift the short-term narrative, given ongoing challenges such as the loss of exclusivity for major products like Stelara, along with persistent legal uncertainties.
Johnson & Johnson’s technical outlook has weakened. After reaching a record high of $251.71 in early March, the stock has lost momentum, slipping below both its 20-day and 50-day moving averages, while the SuperTrend indicator has turned bearish.
With a rounding top pattern taking shape, the stock may need to find solid support again before bullish sentiment can return.
Bitcoin (BitfinexUSD) is under pressure this Sunday, falling 1.80% to $71,603.9 at 05:19 EST (10:00 GMT) after high-level U.S.–Iran peace talks in Islamabad ended without a breakthrough, adding fresh geopolitical uncertainty to global markets.
The collapse of the 21-hour negotiations has pushed traditional energy prices higher, while Bitcoin remains relatively resilient, staying above key technical support levels as investors reassess its role as a potential “digital hedge” amid risks of renewed tensions in the Persian Gulf.
Geopolitical stalemate vs. digital scarcity
The departure of Vice President JD Vance from Pakistan without securing a nuclear commitment from Tehran has effectively dashed hopes for an immediate “safe passage” deal for global energy flows.
Historically, spikes in geopolitical tension have often supported Bitcoin, as it operates beyond the reach of maritime chokepoints or sovereign sanctions. Analysts suggest that with the April 8 ceasefire still fragile, the so-called “war premium” is increasingly shifting toward decentralized assets.
“Whether we make a deal or not makes no difference to me,” President Trump said after the talks, signaling a potential pivot toward rearming regional allies.
Despite the diplomatic breakdown, market data indicates that BTC has avoided a panic sell-off, implying that much of the regional risk had already been priced in following the initial strikes in March.
ETF inflows and the “institutional floor”
While macro headlines continue to dominate, Bitcoin’s internal market structure is being reinforced by a strong վերադարձ of institutional demand. Recent exchange data highlights a notable surge in net inflows into spot Bitcoin ETFs.
This trend suggests that large investors are taking advantage of geopolitical uncertainty to build positions. The presence of an “institutional floor” has helped stabilize prices, even as traditional risk assets come under pressure from rising long-term Treasury yields.
At the same time, the crypto market is benefiting from increasing regulatory clarity across Asia. Newly introduced licensing frameworks for digital asset service providers in key financial hubs are enabling fresh capital inflows, helping to offset more cautious sentiment in Western markets.
With diplomatic efforts in Islamabad now stalled, attention for the rest of the quarter is shifting toward how sustained institutional inflows will interact with declining liquid supply on exchanges—potentially setting up a supply squeeze if Middle East tensions continue.
Crypto prices today: altcoins mostly decline
The broader crypto market showed mixed performance, with most altcoins moving lower even as Bitcoin held relatively steady.
The second-largest cryptocurrency, Ether, slipped 1.27% to $2,215.02, while XRP edged down 1.28% to $1.3306.
Among other major tokens, Solana dropped 2.70%, Cardano fell 3.95%, and BNB declined 2.06% to $594.30.
In the memecoin segment, Dogecoin lost 1.84%, while $TRUMP recorded a smaller dip of 0.69%.
U.S. President Donald Trump said Sunday evening that he was unconcerned about whether Iran would return to negotiations after ceasefire talks over the weekend failed to produce an agreement.
He also confirmed that the United States intends to impose a blockade on the Strait of Hormuz starting Monday morning, accusing Iran of failing to honor its commitment to reopen the vital shipping route. Speaking to reporters at Joint Base Andrews, Trump stated that the U.S. would be fine even if Iran chose not to resume talks.
His remarks followed a report indicating that several countries are attempting to restart diplomatic efforts after lengthy discussions in Islamabad ended without a deal. Despite the breakdown, sources suggested that further negotiations could take place within days, while regional governments are working with Washington to extend a fragile two-week ceasefire.
The Islamabad meeting represented the highest-level direct engagement between U.S. and Iranian officials since 1979, with 21 hours of talks concluding without progress. Vice President JD Vance said the U.S. had clearly outlined its conditions, but Iran declined to accept them.
U.S. demands reportedly included ending uranium enrichment entirely, dismantling key nuclear facilities, surrendering enriched materials, reopening the Strait of Hormuz without fees, promoting broader regional stability, and ceasing support for groups such as Hezbollah and the Houthis. Iran, however, proposed limited enrichment or reducing its stockpile, but the two sides failed to reach a compromise.
In response to Trump’s blockade announcement, Iranian Parliament Speaker Mohammad Bagher Qalibaf warned that Iran would not back down under pressure, stating that any confrontation would be met with force.
The U.S. plans to enforce the blockade on all vessels entering or leaving Iranian ports from 10 a.m. ET on April 13, covering areas along the Arabian Gulf and Gulf of Oman. It remains unclear whether U.S. allies will participate. Trump also criticized NATO for its lack of involvement and said Washington is reassessing its relationship with the alliance.
One of the most compelling charts this week is Bitcoin. Despite widespread hesitation and global risk aversion, it has remained relatively resilient instead of breaking down. In addition, Wall Street–based ETFs tied to Bitcoin continue to attract inflows, even as overall market sentiment stays cautious.
That said, this suggests a level of resilience in the Bitcoin market that shouldn’t be overlooked. At some point, the market will need to make a longer-term move, and based on current signals, it appears to be leaning toward a bullish outcome.
This outlook is somewhat logical, considering Bitcoin has already dropped around 50% from its highs. For long-term holders, that kind of correction often signals a potential buying opportunity. While I’m not strongly bullish on Bitcoin overall, the technical picture indicates that a move above $76,000 could quickly become significant.
NASDAQ 100
The Nasdaq 100 moved higher over the week, largely driven by the ceasefire announcement, which boosted overall risk appetite. By the end of the week, the index was hovering around the 25,000 level. However, with key talks taking place in Pakistan over the weekend, market sentiment could shift quickly as early as Monday. For this reason, I remain optimistic about equities—but only with a strong sense of caution.
USD/MXN
The US dollar declined sharply against the Mexican peso over the week as risk appetite returned. It’s also important to note the significant interest rate gap between the two economies, which encourages traders to short this pair, as holding Mexican pesos allows them to earn daily carry.
It now appears that the pair is on the verge of breaking down toward the 17 peso level. However, that level may not matter much at this stage due to the upcoming meeting in Pakistan over the weekend. If the outcome is negative, the US dollar is likely to strengthen; if not, the current downward trend should continue.
DAX
Germany’s DAX ended the week in positive territory, although it closed on a weak note on Friday. This likely reflects caution ahead of the weekend meeting, as Germany remains highly sensitive to energy supply risks—particularly LNG from Qatar and crude shipments through the Strait of Hormuz. Any disruption there could create significant challenges for its industrial sector. As a result, many traders appear to be locking in profits and reducing exposure ahead of potentially impactful developments from the talks in Pakistan.
USD/CAD
The US dollar has declined against the Canadian dollar and is now hovering around both the 50-week EMA and the 200-day EMA, making a pause at this level quite reasonable. As with other markets, Monday’s open will likely be influenced by developments in Islamabad. Overall, this appears to be a market attempting to establish support before potentially moving higher. The 1.3750 level stands out as a key area to watch for a possible bounce if the pair continues to pull back, while the 1.40 level remains a significant resistance to the upside.
EUR/USD
The euro posted a solid rally over the week, largely supported by improving risk appetite. It has now climbed above the 1.17 level for the first time in about five weeks. If this momentum holds, the next target to watch would be the 1.18 level.
The 1.18 level represents a major resistance zone. However, if the talks between Iran and the United States produce positive outcomes, it could trigger a broad relief rally—potentially pushing this market higher along with others.
Silver
Silver has been volatile but clearly positive over the week as it continues to search for a bottom. The market is likely to remain choppy, and while a larger move will eventually take shape, it may not be the ideal time to take on significant positions.
Interest rates will remain a key driver here, so it’s important to watch the US 10-year yield closely. Generally, a move above 4.30% tends to be negative for this market—though it’s not a definitive rule, just one of several influencing factors. Additionally, developments coming out of Islamabad and the ongoing talks are likely to have a significant impact on interest rate expectations, which will in turn affect price action here.
Gold
The gold market has also moved higher, but this seems to have caught many traders off guard, as the main driver has been interest rates rather than geopolitical fear. Many people are puzzled by gold’s weakness during times of conflict, but the explanation lies in the bond market—yields are now significantly higher than before, prompting portfolio managers to shift allocations toward interest-bearing assets instead of gold.
I remain bullish on gold over the longer term, but I also recognize that a renewed spike in yields—possibly triggered by disappointing outcomes from the talks in Islamabad—could push the market down toward the $4,600 level. On the upside, the $5,000 mark stands out as the first major resistance zone.
GBP/USD slipped slightly after four consecutive sessions of gains, remaining under pressure below the 1.3450 level during Friday’s European trading hours. The pair weakened as the US Dollar held steady amid cautious market sentiment, driven by concerns ahead of the US-Iran peace negotiations. Investors are now focused on the US Consumer Price Index report scheduled for release later in the North American session.
Technical Outlook for GBP/USD
The short-term outlook for GBP/USD has shifted slightly bullish, with the pair maintaining its position just above the 38.2% Fibonacci retracement of the January–March decline. Price action is currently challenging the downward-sloping 200-day Simple Moving Average around 1.3415 from below, indicating early signs of buying interest near this key long-term level. Momentum indicators are also improving, as the MACD line has crossed above its signal line and is moving back toward the zero line, while the RSI at 55 reflects moderate bullish momentum without overbought pressure.
On the upside, immediate resistance is seen at the 50% retracement level of 1.3505. A daily close above this level would reinforce the bullish bias and pave the way toward the 61.8% Fibonacci retracement at 1.3588. On the downside, initial support lies at the 38.2% retracement near 1.3422, closely aligned with the 200-day SMA at 1.3415; a break below this zone would expose the next support at the 23.6% retracement around 1.3319. Overall, as long as GBP/USD remains above the 1.3415–1.3422 support area, the near-term bias continues to favor further recovery toward the mid-1.3500 region.
Fundamental Analysis Summary
Market sentiment remains fragile and risk-averse as geopolitical tensions persist. Israel continues military operations against Hezbollah, although Prime Minister Benjamin Netanyahu indicated that direct negotiations with Lebanon are expected to begin soon. At the same time, US President Donald Trump stated that American forces will remain stationed near Iran until full compliance with the agreement is achieved.
On the diplomatic front, US Vice President JD Vance, along with senior envoys Steve Witkoff and Jared Kushner, is scheduled to hold talks in Pakistan this weekend regarding a potential long-term arrangement with Iran. Meanwhile, Iranian Foreign Ministry spokesperson Esmaeil Baghaei said that any negotiations to end the conflict depend on US adherence to its ceasefire obligations. He further argued that these commitments include a ceasefire in Lebanon, a condition the US and Israel dispute.
Separately, Bank of England Governor Andrew Bailey warned that the Iran conflict could trigger risks reminiscent of the 2008 financial crisis, pointing to potential contagion from stress in the largely opaque $3 trillion private credit market. He cautioned that such vulnerabilities could spill over into already fragile global markets strained by energy shocks and rising debt pressures, according to The Telegraph.
EUR/USD climbed to 1.1667 on Thursday, while the US dollar recovered part of its previous losses as market sentiment stayed cautious amid a fragile US–Iran truce.
Tensions in the Strait of Hormuz remain elevated, with Iranian media reporting continued restrictions on tanker passage following renewed strikes in the region. Iranian officials have also accused the opposing side of breaching several ceasefire terms.
The dollar had fallen sharply in the prior session after news of a two-week truce, which triggered a decline in oil prices and briefly eased inflation concerns.
Additional pressure came from the Federal Reserve’s latest meeting minutes. Some policymakers signaled openness to rate hikes to curb inflation, although most still expect policy easing to follow later.
Looking ahead, investors are focusing on key US macroeconomic data, including consumer spending figures, the PCE price index, and the upcoming CPI report, all of which are likely to shape expectations for the Fed’s next policy moves and near-term market direction.
EUR/USD Technical Analysis
On the H4 timeframe of EUR/USD, price action is consolidating around the 1.1683 level. A corrective downside move is anticipated, with 1.1606 seen as the initial target, followed by a potential rebound back toward 1.1683. From a technical perspective, this outlook is supported by the MACD, where the signal line remains above the zero line but is trending decisively downward, indicating sustained bearish momentum and the likelihood that the downward pressure may continue in the near term.
On the H1 timeframe, EUR/USD is developing the structure for a potential next downside move toward the 1.1616 area. Once this level is reached, a rebound toward 1.1666 is anticipated, followed by a subsequent decline toward 1.1494. From a technical standpoint, this outlook is supported by the Stochastic oscillator, as its signal line remains below the 50 level and continues to slope downward toward 20, indicating sustained bearish pressure.
Summary
EUR/USD remains supported, although the US dollar has recovered some losses as tensions in the US-Iran truce begin to resurface. Ongoing reports of restricted tanker traffic through the Strait of Hormuz and claims of ceasefire violations have brought renewed caution to the markets. The latest Fed minutes showed a split committee, with some policymakers considering rate hikes while others favor future easing, further adding to policy uncertainty. Ahead of upcoming US inflation and consumer data releases, the pair’s short-term outlook remains unclear. From a technical perspective, a near-term decline looks more likely, while the broader trend will largely depend on whether the fragile truce holds or geopolitical risks escalate again.
The U.S. Consumer Price Index (CPI) is forecast to increase by 3.3% year-on-year in March, driven sharply higher by rising energy prices. Core CPI inflation is also expected to tick up slightly to 2.7% annually. Meanwhile, the EUR/USD technical outlook remains mildly bullish in the near term.
The U.S. Bureau of Labor Statistics (BLS) is scheduled to release March Consumer Price Index (CPI) data on Friday.
The report is widely expected to show an uptick in inflation, largely driven by the surge in crude oil prices following increased tensions after a joint U.S.–Israel strike on Iran.
The monthly CPI is projected to increase by 0.9%, up from a 0.3% rise in March, while the annual rate is expected to climb to 3.3%—its highest level since May 2024—from 2.4% in February. Core CPI, which excludes food and energy, is forecast to rise 0.3% on the month and 2.7% year-on-year.
Since the outbreak of conflict in the Middle East on February 28, West Texas Intermediate (WTI) crude has surged roughly 40%, even after easing following a recent two-week ceasefire announcement between the U.S. and Iran. In March alone, WTI jumped nearly 50%, rising from around $67 per barrel to close near $100.
According to TD Securities analysts, the spike in crude prices is expected to be the main driver behind the sharp 0.9% monthly CPI increase, pushing the annual reading up by nearly one percentage point to 3.3%, marking a two-year high. They also noted that core inflation is likely to remain relatively contained at 0.27% month-on-month, though goods prices may continue to rise due to tariff pass-through, with “supercore” inflation staying firm around 0.3%.
CPI data
The next CPI report is expected to be heavily influenced by recent volatility in oil prices, meaning the March inflation print will likely show a noticeable jump in headline CPI—something that markets have already largely anticipated.
Even if annual inflation rises to around 3.3% as forecast, investors may treat it as a temporary spike rather than a lasting inflation trend, assuming oil prices retreat if geopolitical tensions ease and a durable truce in the Middle East helps stabilize supply routes such as the Strait of Hormuz.
However, uncertainty around the durability of any ceasefire—and political conditions tied to control of key shipping lanes—adds risk to the outlook. This makes it harder to assume a sustained decline in oil prices, and therefore keeps inflation expectations sensitive to geopolitical developments rather than the CPI data alone.
On the policy side, the Federal Reserve’s recent meeting minutes suggest policymakers are becoming more cautious about cutting interest rates. Many are concerned that inflation could remain stickier than expected, especially if higher energy prices begin to feed into broader price pressures.
Still, some analysts, such as those at BBH, argue that if underlying (core) inflation stays contained, the Fed may be able to “look through” the temporary oil-driven inflation spike and avoid tightening further, even amid a mixed U.S. labor market.
What impact might the US Consumer Price Index (CPI) report have on EUR/USD?
Currently, markets are pricing in about a 75% probability that the Federal Reserve will keep its policy rate unchanged at 3.5%–3.75% by the end of the year, a sharp increase from just 17% on March 9, according to the CME FedWatch Tool.
A stronger-than-expected March CPI reading may have limited impact on reshaping expectations for the Federal Reserve’s interest rate path. However, if high inflation data coincides with renewed escalation in Middle East tensions and rising concerns that shipping activity in the Strait of Hormuz will not return to normal levels soon, markets could start pricing in a higher likelihood of a Fed response to persistent inflation pressures. In that case, the US dollar could strengthen, pushing EUR/USD lower.
On the other hand, the dollar may stay under pressure—and EUR/USD could extend its recovery—if oil prices keep declining steadily, even if the CPI report comes in hot.
Overall, March inflation data alone is unlikely to trigger a major market reaction, with investors remaining more focused on the US–Iran geopolitical situation and its implications for energy prices.
From a technical perspective, Eren Sengezer, FXStreet European Session Lead Analyst, notes that EUR/USD’s short-term outlook remains tilted to the upside. The RSI on the daily chart has moved above 50 for the first time since the US–Iran conflict began, and the pair has broken above a two-month descending trendline.
Key resistance levels are seen at 1.1730 (Fibonacci 50% retracement of the February–April move), followed by 1.1800 (61.8%) and 1.1900 (78.6%). On the downside, initial support lies at 1.1650 (38.2%). If that level breaks, sellers may target 1.1560 (23.6%) and then the psychological 1.1500 level.
Bitcoin advanced on Friday as crypto markets turned cautiously optimistic ahead of potential U.S.–Iran ceasefire talks, while expectations surrounding key inflation data kept sentiment restrained.
The world’s largest cryptocurrency gained 1.6% to $72,159.1 by 02:05 ET (06:05 GMT) and was on track for a 7.3% weekly rise, supported by improving risk appetite.
Bitcoin also drew support from hopes of more favorable U.S. crypto regulation, although progress on the CLARITY Act still appeared uncertain.
Ceasefire talks between the U.S. and Iran remained in sharp focus amid mixed and conflicting signals.
The discussions, reportedly scheduled to take place in Pakistan in the coming days, follow a conditional ceasefire agreement reached earlier this week. However, tensions quickly resurfaced as Iran accused the U.S. and Israel of violating the deal and called for Lebanon to be included in any broader peace framework.
Iranian state media also denied reports that its delegates had already arrived in Pakistan, saying negotiations would remain on hold until clearer assurances regarding Lebanon were provided.
Meanwhile, Iran’s continued restriction of shipping through the Strait of Hormuz drew criticism from U.S. President Donald Trump. Tehran has also floated the idea of imposing tolls on passage through the waterway, a proposal Washington has rejected.
The two sides remain deeply divided, with Iran resisting U.S. demands to halt its nuclear program and surrender uranium stockpiles. The ongoing uncertainty over the conflict and its economic implications has weighed on risk assets in recent weeks, though crypto markets have shown relative resilience compared to other sectors.
Crypto prices today: Altcoins gain as markets await CPI data
Broader cryptocurrency prices edged higher on Friday, mirroring Bitcoin’s gains, although upside was capped by caution ahead of key U.S. consumer price index (CPI) inflation data due later in the day.
Headline CPI inflation is expected to have accelerated in March, partly driven by rising global oil and gas prices amid the Iran conflict. Stronger inflation would reduce the Federal Reserve’s incentive to cut interest rates, a development typically negative for speculative assets.
Among major tokens, Ethereum (Ether), the world’s second-largest cryptocurrency, rose 0.1% to $2,184.32, while XRP gained 0.6% to $1.3411.
Meanwhile, Solana, Cardano, and BNB traded in a narrow range, alongside memecoins such as Dogecoin and $TRUMP, which also showed little movement.
Oil prices rose on Friday amid renewed concerns over supply disruptions from Saudi Arabia and continued minimal tanker movement through the strategically vital Strait of Hormuz.
Despite the gains, crude was still on track for a weekly decline as market fears eased slightly following a fragile two-week ceasefire between the United States and Iran. At the same time, Israel indicated a possible diplomatic shift, expressing readiness to start direct negotiations with Lebanon soon.
Brent crude increased by $0.96, or 1%, to $96.88 per barrel at 0604 GMT, while West Texas Intermediate (WTI) gained $0.78, or 0.80%, reaching $98.65 per barrel.
Both benchmarks are down roughly 11% so far this week, marking their steepest weekly drop since June 2025, when earlier Israeli-U.S. strikes on Iran were paused.
According to Saudi Arabia’s state news agency SPA, citing the Ministry of Energy, attacks on key energy infrastructure have reduced the kingdom’s oil output capacity by about 600,000 barrels per day and cut throughput on the East-West Pipeline by approximately 700,000 barrels per day.
Analysts at ANZ noted that these developments have intensified concerns about further supply disruptions.
Shipping activity through the Strait of Hormuz remained below 10% of normal levels on Thursday, despite the ceasefire, as Iran asserted control by instructing vessels to stay within its territorial waters.
Although Iran and the U.S. agreed to a two-week ceasefire mediated by Pakistan, clashes reportedly continued afterward.
Experts suggest Pakistan may attempt to broker a longer-term agreement, but its ability to enforce the reopening of the waterway remains limited.
A Tehran official also told Reuters that Iran is seeking to impose transit fees on ships passing through the Strait under any peace arrangement, an idea opposed by Western governments and the U.N. shipping agency.
The conflict, which began on February 28 following U.S. and Israeli airstrikes on Iran, has effectively disrupted one of the world’s most important energy corridors.
Energy consultant John Paisie of Stratas Advisors warned that Brent crude could surge to $190 per barrel if current shipping constraints persist, though prices would be more contained if flows improve, albeit still above pre-war levels.
Mukesh Sahdev, CEO of XAnalysts, emphasized that the critical issue is not whether the Strait of Hormuz reopens, but how quickly normal oil flows can resume.
Meanwhile, JPMorgan estimated that around 50 energy infrastructure sites across the Gulf have been damaged by drone and missile attacks since the conflict began, with approximately 2.4 million barrels per day of refining capacity taken offline.
Currency markets were relatively calm on Thursday, though traders remained cautious, closely watching whether the ceasefire between the U.S. and Iran would last. The announcement of the truce the previous day had already caused the dollar to fall sharply.
However, the situation remained uncertain. Israel continued its attacks in Lebanon, while Iran had yet to reopen the Strait of Hormuz, a key route for global energy supplies, leading to severe disruptions.
Iranian officials were expected to travel to Pakistan for initial peace negotiations, but Tehran stated that no agreement would be possible as long as Israel’s strikes continued.
U.S. President Donald Trump emphasized that American military forces would remain deployed in and around Iran until the country fully adhered to any agreement.
This ongoing uncertainty kept currency markets tense. The euro rose slightly to $1.1683 after gaining earlier but pulling back from a one-month high. Similarly, the British pound increased modestly to $1.342, though it also retreated from earlier highs.
In contrast, the Japanese yen weakened, with the dollar rising against it after briefly falling the previous day.
Analysts noted that the ceasefire remained fragile, especially with the Strait of Hormuz still closed, though movements in the dollar were relatively limited. Continued plans for peace talks in Pakistan helped prevent larger market reversals.
Meanwhile, new U.S. data showed inflation rising in line with expectations, with further increases likely due to the conflict. This could delay any interest rate cuts by the Federal Reserve.
In Japan, consumer confidence declined in March, reflecting concerns about the economic impact of the Middle East conflict, though the yen showed little response. The Bank of Japan indicated that financial conditions remained supportive due to negative real interest rates.
Other currencies remained fairly stable, with the Australian and New Zealand dollars edging higher. In the cryptocurrency market, bitcoin fell slightly to around $70,680.
Gold is once again being driven primarily by interest rates rather than risk sentiment, with US Treasury yields taking the lead as markets head into a heavy US data schedule.
The inverse relationship between gold and yields has strengthened notably, placing key inflation readings like CPI and core PCE at the center of attention. Prices are currently moving within a clear range, with support around $4700 and resistance between $4800 and $4850. The next directional move will likely depend on whether yields continue rising or begin to ease, while ongoing developments surrounding the US–Iran ceasefire remain a secondary influence.
This renewed sensitivity to yields signals a return to more traditional macro dynamics, following a period where gold traded more like a high-volatility risk asset.
Whether this rate-driven relationship will persist is still uncertain. However, with correlation coefficients currently sitting in the high negative 0.9 range across both short- and long-term Treasury yields, gold is now highly sensitive to movements in interest rates. This sharp linkage brings not only developments in the US–Iran ceasefire into focus, but also an upcoming wave of US economic data that is likely to challenge and validate the strength of this relationship in the near term.
Inflation data is set to put this relationship to the test.
While the Fed’s preferred inflation gauge, the core PCE deflator, is due later today, it may carry less weight as it reflects February data and predates the energy price shock linked to the Iran conflict. Instead, markets may focus more on income and spending figures for clues on consumption and broader economic momentum in the March quarter. Strong data could reignite concerns about rising inflation, while weaker numbers may ease pressure by signaling softer demand and hiring.
Following a weak 10-year Treasury auction midweek, attention may also turn to the 30-year bond auction for its impact on yields. Still, Friday’s release of March CPI is expected to be the key event. Headline inflation is likely to rise due to energy costs, but the critical question is whether those pressures spill into core inflation. Any reading above the 0.3% forecast could push markets to reconsider the possibility of Fed rate hikes rather than cuts this year.
Inflation expectations will also be in focus, with the University of Michigan’s 5-year outlook offering timely insight into consumer sentiment around future prices, wages, and spending.
If inflation surprises to the upside, Treasury yields are likely to climb—potentially weighing on gold given their strong inverse relationship. Conversely, softer inflation data could support bullion. Beyond economic data, developments surrounding the US–Iran ceasefire remain an important underlying risk factor.
Price action remains orderly and well-defined.
On the daily chart, the presence of a bearish pin bar reinforces the earlier signal that sellers are active in the $4800–$4850 zone, establishing it as a key overhead resistance area for traders.
A closer look at the H4 timeframe confirms both this resistance and the overall clarity of gold’s price action, especially given the broader macro volatility. The $4700 level, which previously acted as resistance, has now flipped into support and serves as the first downside level to watch. Below that, $4600 and $4550 emerge as additional support zones if the current range breaks.
On the upside, a sustained move above $4850 would open the door toward $4975, with the 50-day moving average sitting in between as a potential intermediate hurdle. Momentum indicators such as RSI (14) and MACD remain neutral, offering no strong directional bias and reinforcing the importance of reacting to price behavior around key levels.
From a short-term trading perspective, long positions could be considered above $4700 with tight risk control below that level, targeting a move back toward $4850 resistance. However, conviction in this setup is limited, and a confirmed bounce from $4700 would provide a more reliable entry signal.
Silver futures are trading within a key VC PMI decision zone after being rejected from the Daily Sell 1 level around $77.68 and failing to maintain momentum toward Daily Sell 2 at $79.96. Prices have since moved back below the Daily Mean of $75.51 and are now testing the Daily Buy 1 level at $73.23, indicating a shift from a bullish expansion phase into a mean reversion setup.
Based on VC PMI probabilities, a move into the Buy 1 level carries roughly a 90% chance of reverting back toward the mean. If the $73.23 level fails to hold, the market could extend its decline toward Daily Buy 2 at $71.06, where extreme conditions—with a 95% probability—often draw in institutional buying. The overlap with the Weekly Mean around $72.30 further strengthens this area as a key support pivot.
From a cyclical standpoint, the market is approaching a critical inflection period between April 8–10, when a directional move is likely to emerge. If prices hold above Buy 1 during this window, a rebound toward $75.53 and possibly a retest of $77.68 becomes the higher-probability scenario. On the other hand, a drop into Buy 2 within this timeframe could signal a final capitulation before a broader upward move.
Square of 9 geometry supports this structure, highlighting the $72–$73 area as a harmonic support zone, while upside levels at $77, $80, and $82 correspond to rotational resistance. A sustained breakout above $80.87 (Weekly Sell 2) would indicate a fractal shift, pushing the market into a higher trading range and confirming a longer-term bullish continuation.
Volume behavior points to accumulation during pullbacks, suggesting weaker long positions are being shaken out while stronger participants build exposure ahead of the next expansion phase. This reinforces the view that the current decline is corrective rather than structural.
Strategy: Buyers may consider gradually scaling in near Buy 1 and Buy 2 with disciplined risk control. Rather than chasing upward momentum, traders should wait for confirmation of reversal signals within the cycle window. A move back above the mean would signal a return of bullish momentum.
A Middle East ceasefire sparked a strong global rally, boosting previously underperforming country ETFs and cyclical sectors domestically.
Oil prices tumbled, bond yields declined, and the VIX dropped toward 20—pointing to a possible shift in market regime.
Early signs of technical strength are appearing, but sustained momentum will be key to confirming the rally’s durability.
“I want you all to forget the flight plan. From this moment on, we are improvising a new mission.”
These were the words of Gene Kranz to his Houston team after an explosion struck Apollo 13. Faced with a sudden crisis, he led a pivot away from the original objective of landing on the moon, improvising a new mission under severe constraints.
A Familiar Setup, Rewritten Script
More than half a century later, Americans are once again circling the moon, even as markets absorb a fresh wave of macroeconomic shocks. Under normal circumstances, attention would be turning to Q1 earnings, upcoming inflation data, and signals from the Fed—but this time is different.
The narrative is shifting. Global equities are surging on news of a two-week ceasefire between the U.S. and Iran. While both sides are claiming success, the true beneficiaries may be investors who stayed committed to buying the dip.
Stock Market Reacts: Risk-On Reigns
The S&P 500 surged nearly 3% in premarket trading on Wednesday, April 8, echoing the explosive “post–Liberation Day” rally seen almost exactly a year earlier. As expected, leadership came from some of the most beaten-down corners of the market: Asia-Pacific ETFs like iShares MSCI South Korea ETF (EWY), iShares MSCI Taiwan ETF (EWT), iShares MSCI Japan ETF (EWJ), and iShares MSCI India ETF (INDA); Europe via Vanguard FTSE Europe ETF (VGK); and U.S. small caps through iShares Russell 2000 ETF (IWM). Cyclical industries also joined the surge, including homebuilders SPDR S&P Homebuilders ETF (XHB) and airlines U.S. Global Jets ETF (JETS), alongside strength in crypto and gold.
At the same time, energy markets moved sharply in the opposite direction. Oil plunged roughly 12%, dragging energy stocks lower. Bond yields declined, the U.S. dollar weakened, and the CBOE Volatility Index (VIX) broke its upward trend—classic signals of a broad “risk-on” shift.
I had planned to focus on bank stocks, but it makes more sense to examine several geopolitically sensitive charts first—to assess whether this rally has real staying power.
Tools of the Trade
To start, traders should take a look at StockCharts ACP (Advanced Charting Platform)—a highly interactive, web-based charting platform built to elevate how you analyze market behavior. It becomes especially valuable during periods of heightened volatility, whether moves unfold during trading hours or after the close.
I had it up and running at 6 p.m. ET on Tuesday, just as the SPDR S&P 500 ETF Trust (SPY) began to edge higher—before accelerating sharply, almost like a launch sequence counting down.
For now, though, StockCharts SharpCharts will do the job perfectly well.
South Korea Leads the Charge
Starting with one of the highest-beta country ETFs, the iShares MSCI South Korea ETF (EWY) surged nearly 10% ahead of Wednesday’s open. From its $113 low at the end of March, the post-ceasefire rally quickly extended to about 23%.
Technically, EWY has now pushed firmly above its 50-day moving average—a level that previously acted as resistance earlier in the month. That shift suggests improving momentum. With the all-time high sitting roughly 11% higher, the former resistance zone around $129 may now serve as a key support level.
For a clearer view of extended-hours activity, enabling premarket and after-hours data is essential. Taking it further, adjusting moving averages (e.g., doubling from 50 to 100 and 200 to 400) and using a 195-minute chart interval (two bars per day) helps surface important trend levels that might otherwise be missed outside regular trading hours.
Looking ahead, bulls should focus on the gap near $147. This level is particularly significant due to the heavy volume-by-price activity during the prior selloff—often a hallmark of a blow-off top. Still, with momentum building, South Korean equities appear poised to make another attempt toward the $150 level.
Global Equities vs. Homebuilders: A Clear Split
Turning to the domestic market, homebuilders tell a different story. As Brent and WTI crude surged toward $120 per barrel, the accompanying rise in interest rates quickly stopped the homebuilders’ rally. While oil-sensitive international ETFs—especially those tied to economies reliant on the Strait of Hormuz—declined sharply last month, U.S. industrial sectors that depend on lower Treasury yields also came under pressure.
The SPDR S&P Homebuilders ETF (XHB) looks notably weaker than EWY and other Asia-Pacific ETFs. Even with a premarket move above $100, it still trades below both its 50-day and 200-day moving averages. Sitting roughly 20% below its late-2024 peak and its high from two months ago, the sector isn’t signaling confidence yet. However, the RSI momentum indicator has just crossed above 50, which technicians typically view as a positive sign. Since momentum often leads price, this could point to a near-term rebound.
That said, XHB’s overall technical picture remains messy: strong resistance sits in the $120–$125 range, while buying interest has consistently emerged in the upper-$90s. A clearer bullish outlook would likely require a decisive breakout to new highs.
Is the Volatility Regime Shifting?
Let’s wrap up with a look at market volatility. The Cboe Volatility Index had been steadily climbing since late last year, raising concerns among macro investors, as moderately elevated volatility often signals weaker performance for the S&P 500.
However, that trend has recently reversed following the temporary reopening of the Strait of Hormuz. The VIX has now broken its multi-month uptrend and recorded a clear lower low. Despite heightened expectations, volatility never reached the dramatic spike many anticipated—it topped out just above 35, only nine days after the Iran conflict began. The combination of high volatility, surging oil prices, and poor investor sentiment made March particularly challenging.
For confirmation of a new short-term volatility regime, a weekly close below 20 on the VIX would be encouraging. Historically, April tends to be a calmer month and has delivered some of the strongest global equity returns since 1988. That said, skeptics point to typically weaker second quarters during midterm election years. My view: volatility may ease in the near term, but it shouldn’t be ignored as we move toward the summer months.
The Bottom Line
Stocks surged Tuesday night after news of a temporary two-week ceasefire between the U.S. and Iran, shifting attention away from upcoming economic data like PCE inflation and March CPI. While earnings season still feels a bit off, JPMorgan Chase is set to kick things off next Tuesday morning.
The S&P 500 has climbed back above its 200-day moving average, while the Cboe Volatility Index has eased toward the 20 level. Meanwhile, several country ETFs that were heavily sold in March are now showing strong early rebounds.
The next few sessions will be crucial—markets need continued technical follow-through to sustain this bullish momentum.
U.S. President Donald Trump said Wednesday night that American ships, aircraft, and troops will stay positioned around Iran until a “real agreement” is secured with Tehran. In a social media post, he warned that fighting could begin if no deal is reached, though he suggested that outcome is unlikely.
He reiterated that any agreement must ensure Iran has no nuclear weapons and that the Strait of Hormuz remains open and secure, adding that such terms had effectively been settled long ago.
His remarks follow a tentative two-week ceasefire between the U.S. and Iran earlier this week. However, Iran quickly accused both the U.S. and Israel of breaching elements of a proposed peace framework, rejected planned talks in Pakistan as “unreasonable,” and called for Lebanon to be included in any broader deal. Meanwhile, Israel continued strikes in Lebanon late Wednesday.
Trump has repeatedly claimed that U.S. and Israeli actions severely weakened Iran’s naval, missile, and nuclear capabilities. Still, Iran has continued military operations against U.S., Israeli, and Gulf targets, while keeping the Strait of Hormuz—an essential global shipping corridor—largely restricted. Iranian officials have also rejected U.S. demands to halt uranium enrichment.
Direct negotiations between Washington and Tehran—the first since tensions escalated in late February—are scheduled to take place in Pakistan on Friday, though the agenda and potential ceasefire terms remain unclear.
Earlier this year, the U.S. carried out its largest Middle East military buildup since 2003, deploying two aircraft carriers, multiple strike groups, and roughly 50,000 troops to the region.
Goldman Sachs slightly lowered its second-quarter oil price outlook after the U.S.–Iran two-week ceasefire, which includes reopening the Strait of Hormuz, though it maintained its medium-term forecasts and warned that risks still lean to the upside.
Oil prices dropped to the mid-$90s per barrel following the announcement, in line with Goldman’s expectations that energy flows through the Strait would begin recovering quickly and that Persian Gulf exports would gradually return to pre-war levels within about a month.
The bank cut its Q2 forecasts for Brent and WTI to $90 and $87 per barrel, respectively, from earlier estimates of $99 and $91, citing a reduced geopolitical risk premium and early signs of improving oil flows. However, it left its second-half projections unchanged, with Brent seen at $82 and $80, and WTI at $77 and $75.
Despite the ceasefire, Goldman cautioned that the situation remains fragile and uncertain, with upside risks to prices driven by the possibility of prolonged disruptions or ongoing production losses. In a downside scenario where the ceasefire breaks down and reopening of the Strait is delayed, Brent could average $100 in Q4. In a more severe case involving sustained supply losses of 2 million barrels per day, prices could rise as high as $115.
On natural gas, European TTF prices fell sharply after the ceasefire. Goldman lowered its Q2 TTF forecast to 50 EUR/MWh from 70, citing weak Chinese LNG demand that has kept European supply relatively strong. Its second-half outlook remained broadly unchanged at 42 EUR/MWh, though risks are still skewed higher. If LNG flows are disrupted further, prices could surge above 75 EUR/MWh due to the need for significant demand destruction.
The dollar stayed fragile on Thursday following broad losses, as investors closely watched whether the uneasy ceasefire between the U.S. and Iran would hold. The truce appeared uncertain, with Israel continuing its conflict with Hezbollah in Lebanon and Tehran accusing both Washington and Tel Aviv of breaching the agreement, calling further peace talks unreasonable. Meanwhile, the Strait of Hormuz remained restricted, with ships requiring permits to pass, prompting higher oil prices as traders awaited clearer conditions.
U.S. President Donald Trump said American military forces would remain deployed around Iran until the terms of the deal were fully met. Analysts noted growing skepticism over whether the ceasefire could last or even be finalized. The dollar index was largely unchanged at 99.07, while the euro dipped slightly, sterling edged higher, and the yen weakened after giving back earlier gains.
The prolonged Middle East tensions have fueled expectations of more expansionary fiscal policy, contributing to yen weakness. Markets are currently pricing in a moderate chance of a Bank of Japan rate hike later this month, though this outlook could shift if the ceasefire collapses. Japan’s weakening consumer confidence and ongoing economic concerns tied to the conflict further complicate the central bank’s decision.
BOJ Governor Kazuo Ueda reiterated that real interest rates remain negative, keeping financial conditions loose. The dollar has benefited overall from the conflict, partly because the U.S. is a net energy exporter, unlike many oil-importing economies such as Japan and parts of Europe.
The five-week conflict has disrupted global energy supplies significantly, and despite the ceasefire, Iran retains increased influence over shipping through the Strait of Hormuz. Upcoming U.S. economic data, including personal spending and inflation measures, could influence the dollar’s direction, with strong figures potentially supporting a rebound.
Elsewhere, the Australian dollar edged lower, the New Zealand dollar gained slightly, and cryptocurrencies declined, with bitcoin and Ethereum both posting losses.
Could markets be misjudging both oil and the war, as this analyst argues?
Possibly—but what about the relationship between oil and gold? The mainstream narrative suggests that surging oil prices are a bearish signal for gold, based on claims that “gold yields no interest” and that “the Fed might raise rates by a quarter point (though it’s unlikely), while real inflation runs near 15%,” leading to the conclusion that “gold should decline sharply against fiat currencies.”
Western analysis of oil, war, and gold is deeply troubling—arguably even reprehensible. It feels like something straight out of a Nineteen Eighty-Four… except it’s happening in reality.
A closer look at currency market dynamics suggests that as interest rates rise, the heavily indebted U.S. government faces increasing borrowing needs to sustain its finances. This pressure can lead to policies that shift the burden beyond its borders, affecting global economic stability.
History offers parallels—such as Ancient Rome—where excessive debt strained state behavior and credibility. Some argue that similar pressures are emerging in modern fiscal systems.
In simple terms, critics of fiat systems view government-issued currency as vulnerable to mismanagement, while seeing gold as a more reliable store of value for individuals worldwide.
What are the most attractive price levels for investors to accumulate more gold? Looking at the daily chart, the $4,400 range previously acted as a strong buying zone, while $4,100 represented a secondary level of support.
That said, investors may benefit more from focusing on time rather than precise price points. If gold trades within a range for the rest of the year, a disciplined accumulation strategy—such as monthly purchases (or weekly for more aggressive investors)—could be more effective.
Time-based buying helps reduce the emotional stress of trying to predict short-term price movements, which often leads to cycles of fear and greed.
Ultimately, steadily increasing gold holdings may matter more than timing the exact entry. Still, from a price perspective, the $5,600, $3,900, and $3,500 levels could all serve as attractive accumulation zones if the market pulls back.
If gold were to climb into the $6,500–$7,500 range, then $5,600 could become a particularly significant support level—potentially one of the most important in the market’s history. From there, some bullish scenarios suggest the possibility of a powerful rally toward $15,000–$20,000.
Such dramatic price action would likely require major catalysts—such as sustained inflation, escalating debt pressures, geopolitical instability, or a significant loss of confidence in fiat currencies.
The U.S. interest rate chart is drawing attention, with what appears to be a large inverse head-and-shoulders pattern suggesting a potential move toward the 7%–8% range.
At the same time, many argue that the real inflation experienced by average Americans may be closer to 8%–15%, higher than official figures. If that view gains traction, the prevailing institutional narrative—where rising rates are seen as negative for gold—could shift.
Instead, rising rates might come to be interpreted as a signal that inflation is persistent and that government financing pressures are intensifying. In that scenario, investors could increasingly turn to gold, viewing it as a hedge and continuing to accumulate it over time.
A long-term view of the 40-year U.S. inflation–deflation cycle suggests that policy shifts could have major consequences. If a future Fed leader—such as Kevin Warsh—were to scale back quantitative easing, government borrowing pressures would likely remain.
Even without aggressive rate hikes from the Federal Reserve, market forces themselves could push interest rates higher.
For investors, maintaining a focus on the broader macro picture is essential. Key factors shaping the landscape include inflation trends, tariffs, geopolitical tensions, elevated equity valuations, debt ceiling challenges, and potential shifts in global economic leadership.
Critics argue that instead of implementing significant spending cuts, policymakers have relied on measures like tariffs, which may contribute to inflationary pressure. At the same time, rising fiscal deficits and geopolitical risks could undermine confidence in government bonds, prompting central banks and institutional investors to reduce their holdings.
This dynamic may create a feedback loop: higher debt levels, rising borrowing costs, and declining bond demand reinforcing one another.
In that context, some bullish perspectives suggest that gold could see substantial long-term gains, while interest rates could continue trending higher—though projections as extreme as $20,000 gold or 20% rates remain highly speculative and dependent on extraordinary economic conditions.
And what about the miners? The GDX chart looks particularly impressive, with a clear inverse head-and-shoulders pattern forming. The head developed around the critical $85 support level, where the 14,7,7 Stochastics oscillator also signaled a bottom.
After a brief two-day pullback, price is now hovering near $92—potentially setting up as a springboard for the next upward move. At the same time, a broader buy signal from the 20,40,10 MACD indicator appears to be on the verge of triggering—possibly as soon as today.
The Federal Reserve is navigating one of its toughest policy backdrops in years as the conflict with Iran unsettles global energy markets and clouds the outlook for both inflation and growth.
Heightened geopolitical volatility is forcing policymakers into a difficult balancing act: tightening too much could push the economy into recession, while easing prematurely risks fueling inflation again. For now, the most prudent approach appears to be holding rates steady until incoming data provide clearer direction on policy.
Cleveland Fed President Beth Hammack reinforced this stance in a recent AP interview, indicating a preference to keep rates unchanged “for quite some time.” However, she acknowledged flexibility, noting that rate cuts could be warranted if the labor market weakens משמעותfully, while further hikes may be needed if inflation remains persistently above target.
Meanwhile, the Treasury market has shifted its expectations. After a prolonged period of dovish positioning, investors are now assigning a higher probability to near-term rate hikes. This shift is evident in the policy-sensitive 2-year Treasury yield—around 3.84% as of April 6—trading above the median effective Fed funds rate of 3.64%, signaling a renewed tilt toward a more hawkish outlook for the first time since 2022.
The outlook for inflation and economic growth remains uncertain, with rising concern that risks may tilt toward higher prices, slower growth—or both.
IMF Managing Director Kristalina Georgieva warned that “all roads now lead to higher prices and weaker growth,” highlighting a global environment marked by heightened uncertainty. Speaking to Reuters, she pointed to multiple risk factors—including geopolitical tensions, rapid technological change, climate disruptions, and shifting demographics—and stressed the need for vigilance even after the current shock passes.
Against this backdrop, the Federal Reserve’s policy stance remains slightly restrictive. Based on a basic model incorporating unemployment and year-over-year CPI changes, current settings still lean tight, giving the central bank room to remain patient. This supports a wait-and-see approach, allowing policymakers to assess incoming data before making any decisive shifts.
Chicago Fed President Austan Goolsbee signaled that an interest rate increase may be approaching. When asked to assess economic risks on a color scale—from crisis-level red to optimistic green—he described the outlook as “at least orange,” suggesting conditions are concerning and far from ideal. Recent movements in the Treasury market appear to reflect a similar level of caution.
However, because inflation and broader economic data tend to lag, the Federal Reserve is likely to remain patient while it evaluates how the economy responds to the conflict with Iran. The difficulty lies in not delaying too long, as inflation or slowing growth could outpace policy actions, forcing the Fed into a reactive stance. This scenario echoes its delayed response during the 2021–2022 inflation surge—an error policymakers are keen to avoid repeating.
At the same time, moving too quickly carries its own risks, potentially worsening inflationary pressures or hindering growth. Ultimately, the Fed’s task is less about identifying a perfect policy and more about staying flexible in an unpredictable environment. One thing is clear: whenever the next policy move comes, it will be made amid significant uncertainty.
Markets have rebounded strongly after President Donald Trump chose to halt military action against Iran, but improved risk sentiment doesn’t change the bigger picture—oil prices are likely to stay elevated.
A clear relief rally is underway. US equity futures jumped almost immediately following the announcement of a two-week pause, with the Dow, S&P 500, and Nasdaq-100 all moving sharply higher. Meanwhile, oil prices, which had surged on fears of supply disruptions in the Strait of Hormuz, retreated as traders quickly unwound worst-case positions.
The speed of the reaction highlights how markets had been positioned for escalation. Defensive strategies were widespread, volatility was high, and crude prices had already priced in a significant geopolitical premium. Removing even part of that risk triggered a rapid reversal.
This strong rally also reflects how stretched investor sentiment had become. Markets were preparing for a scenario where a substantial share of global oil supply could be disrupted. Even a temporary easing of those fears prompted a swift shift back into equities.
Equity markets had already hinted at a possible de-escalation. Despite increasingly aggressive rhetoric, indices had begun to stabilize, suggesting investors anticipated some form of pause. The confirmation has now accelerated the move back into risk assets.
Technology stocks are expected to lead the recovery. The sector had been hit hardest by rising yields and risk aversion, but slightly lower oil prices help ease inflation concerns, supporting valuations—especially for large-cap and AI-driven companies.
Consumer sectors should also benefit quickly. Lower oil prices reduce fuel costs, boosting household purchasing power. Airlines, travel firms, and retailers are particularly well positioned to gain from improved sentiment and lower input expenses.
Financial stocks are also likely to rise. Greater stability encourages deal-making, strengthens capital markets activity, and eases pressure on credit conditions. Banks typically perform better when uncertainty declines and risk appetite increases.
Energy stocks, however, face a more mixed outlook. In the short term, falling crude prices may weigh on them. But underlying supply constraints remain unresolved, inventories are still tight, and geopolitical fragmentation continues to influence energy flows.
There’s a reason oil prices remain significantly higher this year. The risks go beyond the current conflict. Even if shipping through Hormuz resumes, it only provides temporary relief and does not fix deeper vulnerabilities in global energy supply chains.
As a result, oil is unlikely to fall back to previous lows anytime soon. A geopolitical premium is now built into prices, and traders will continue to factor in the risk of renewed disruptions.
Attention now turns to whether the two-week pause will hold. Temporary ceasefires often come with uncertainty, effectively starting a countdown. Markets will be watching closely to see if diplomacy can turn this into a longer-term solution.
Key factors include compliance with the pause, coordination over shipping routes, and the tone of ongoing negotiations. Meaningful progress could extend the rally further, lifting industrials, cyclical sectors, and emerging markets.
However, if diplomacy fails, sentiment could reverse quickly. Oil prices would likely surge again, volatility would return, and recent equity gains could be erased.
For now, investors are navigating a narrow path between opportunity and risk. The current rally is driven by reduced immediate fear, but underlying tensions remain unresolved—and energy markets continue to reflect that uncertainty.
Positioning for short-term gains may be reasonable, but any sustained upside will depend entirely on whether diplomatic efforts lead to lasting progress.
Bitcoin edged higher on Tuesday, recovering from earlier losses as risk appetite improved after Pakistan urged President Donald Trump to extend his deadline for Iran to reopen the vital Strait of Hormuz.
Market sentiment had previously been weighed down by stalled U.S.-Iran negotiations and Trump’s warning that Iran could face severe consequences if no agreement was reached by his deadline.
The world’s largest cryptocurrency was last trading 0.5% higher at $69,845.4 as of 17:43 ET (21:43 GMT).
Pakistan calls for a deadline extension and proposes a two-week ceasefire.
Pakistan, now a key intermediary between the U.S. and Iran, said diplomatic efforts to end the Middle East conflict are advancing steadily and could yield meaningful results in the near term.
Prime Minister Shehbaz Sharif urged President Trump to extend his deadline by two weeks to give negotiations more time, while also calling on Iran to reopen the Strait of Hormuz for the same period as a goodwill gesture. He further appealed to all sides to observe a two-week ceasefire to create space for diplomacy and work toward a lasting resolution.
According to Reuters, Tehran is responding positively to the proposal, while Axios reported that Trump has been informed of Pakistan’s initiative, citing the White House press secretary.
Trump’s Tuesday night deadline approaches.
Earlier on Tuesday, Trump warned that “a whole civilization will die tonight,” while expressing reluctance but suggesting the outcome seemed likely. He had already threatened to strike Iran’s bridges and power infrastructure if no deal was reached by his 20:00 ET deadline.
He also insisted that any ceasefire must include Iran reopening the Strait of Hormuz, which has effectively been closed since the conflict began, pushing global oil prices higher.
Reuters reported that Iran denied any negotiations with the U.S., accusing Washington of seeking surrender under pressure. Meanwhile, Iran’s Tasnim news agency said Tehran could target additional oil facilities, including those linked to Saudi Aramco, if U.S. attacks on energy infrastructure proceed.
An analyst at Nexo Dispatch noted that markets remain cautious rather than panicked, with investors waiting for the deadline to pass before taking a clearer stance.
Inflation data due later this week is in focus.
Bitcoin has increasingly moved in line with overall risk sentiment, as geopolitical tensions overshadow earlier optimism about diplomatic progress.
Attention is now shifting to upcoming U.S. economic data, particularly the March consumer price index due Friday. Rising energy costs tied to the Middle East conflict are expected to lift inflation, which could strengthen expectations that interest rates will stay higher for longer.
Such a backdrop may weigh on Bitcoin, as the asset typically underperforms in a high-rate environment.
According to Nexo’s Kalchev, ongoing energy-driven price pressures mean each inflation reading this week carries outsized importance for crypto—cooler data could revive hopes for rate cuts, while stronger figures would reinforce the higher-for-longer outlook.
Bitcoin ETFs record their largest daily inflows since February.
Bitcoin exchange-traded funds (ETFs) recorded their largest daily inflows since late February on Monday, as investors positioned ahead of the Iran deadline.
The funds saw a total of $471.3 million in inflows, led by BlackRock’s IBIT with $181.9 million. Fidelity’s FBTC and ARKB followed, attracting $147.3 million and $118.8 million, respectively, according to SoSoValue. Notably, no ETF reported any outflows during the session.
Most altcoins also rebounded on Tuesday, moving in line with Bitcoin’s gains.
Ethereum edged up 0.1% to $2,141.62, while XRP rose slightly by 0.1% to $1.3366. Solana gained 1.7%, and Cardano increased 0.4%. Among meme tokens, Dogecoin advanced 1.6%.
U.S. President Donald Trump on Tuesday agreed to a two-week ceasefire with Iran just hours before his deadline for Tehran to reopen the Strait of Hormuz or face major strikes on civilian infrastructure. The move marked a sharp reversal from his earlier warning that catastrophic consequences would follow if his demands were ignored. Pakistan’s military chief Asim Munir and Prime Minister Shehbaz Sharif played a key role in brokering the deal, with talks potentially set to continue in Islamabad.
The agreement hinges on Iran easing its blockade of the strategic waterway, which carries about 20% of global oil shipments. In response, Iran signaled it would halt counterattacks and allow safe passage if hostilities against it cease. While Trump hailed the deal as a “total victory” and a step toward long-term peace in the Middle East, Iranian officials framed it as a win for their own conditions being accepted.
Despite optimism, uncertainty remains over whether the ceasefire will hold, with some officials viewing it as a temporary confidence-building measure. Israel backed the pause in strikes on Iran but indicated the truce does not extend to Lebanon, highlighting conflicting interpretations of the agreement. Meanwhile, hostilities appeared to continue shortly after the announcement, with missile activity reported and defensive systems activated across the region.
Markets reacted positively to the news, with oil prices dropping, stocks rising, and the dollar weakening amid hopes that trade through the Strait of Hormuz could resume. Global leaders welcomed the development, noting both the economic risks and human toll of the six-week conflict, which has killed more than 5,000 people. Analysts suggest the ceasefire may reflect growing pressure on Trump to de-escalate a prolonged and unpopular war, while still framing the outcome as a strategic success.
The U.S. dollar fell to a one-month low in Wednesday’s Asian session, while major currencies such as the euro, yen, Australian dollar, and British pound surged after President Donald Trump announced a two-week ceasefire agreement with Iran.
The yen gained 0.8% to 158.36 per dollar, the euro rose 0.7% to $1.1674, sterling advanced 0.8% to $1.34, and the Aussie jumped 1.1% to $0.7054. Earlier, Trump had issued strong threats against Iran’s civilian infrastructure, warning of severe consequences if his demands were ignored, drawing global criticism.
Market sentiment quickly shifted toward risk-taking following the ceasefire news, which came shortly before a U.S. deadline for Iran to reopen the Strait of Hormuz. Analysts noted that reopening the key shipping route could further support the current rally, though uncertainty remains over the coming two weeks, leaving currencies exposed to potential pullbacks.
Attention then moved to central bank policy outlooks as oil prices plunged. Brent crude dropped 13.4% to $94.68 per barrel, though it stayed elevated compared to pre-conflict levels.
The New Zealand dollar rose 1.5% to $0.5819 after the country’s central bank held its policy rate at 2.25% for a second consecutive meeting, while signaling readiness to act if inflation rises. Meanwhile, Fed funds futures suggested a roughly even chance of a 25-basis-point rate cut by the Federal Reserve in December, a shift from the previous day’s stronger expectation that rates would remain unchanged.
The dollar index slipped for a third straight session to 98.838, its lowest since March 11. Elsewhere, the South Korean won climbed 1.6% despite renewed tensions on the Korean Peninsula, where North Korea launched additional ballistic missiles.
Cryptocurrencies also advanced, with bitcoin rising 2.9% to $71,327.07 and ether gaining 5.6% to $2,233.90.
Bitcoin slipped below $69,000 on Tuesday as risk sentiment weakened ahead of a deadline set by U.S. President Donald Trump for Iran to reopen the Strait of Hormuz or risk military action.
The cryptocurrency was last down 0.8% at $68,525.1 as of 03:06 ET (07:06 GMT).
It had briefly climbed above $70,000 on Monday on hopes of a ceasefire, but was unable to sustain the gains.
Traders on edge as Trump’s deadline for Iran draws near, stoking fears of U.S. strikes and market volatility.
Markets are bracing for possible U.S. strikes on Iran as a deadline set by President Donald Trump approaches.
Sentiment worsened after Iran rejected a U.S.-backed ceasefire plan, instead calling for broader terms, increasing fears of escalation.
Trump has warned Iran could be “taken out” if it fails to comply by his 8 p.m. ET deadline, including potential strikes on critical infrastructure such as power plants and bridges.
The standoff has rattled global markets, pushing oil above $110 per barrel as concerns grow over disruptions in the Strait of Hormuz, a key route for global crude supply.
Rising energy prices have intensified inflation worries and boosted demand for safe-haven assets like the U.S. dollar.
Bitcoin has been trading more closely with overall risk sentiment, with geopolitical tensions outweighing earlier hopes for diplomatic progress.
Attention is now shifting to upcoming U.S. inflation data, especially Friday’s CPI report, which is expected to show upward pressure from higher energy costs—potentially keeping interest rates elevated for longer, a backdrop that could weigh further on Bitcoin.
Most altcoins extended losses on Tuesday as risk-off sentiment persisted in crypto markets.
Ethereum, the second-largest cryptocurrency, fell 1.5% to $2,103.92, while XRP dropped 2.4% to $1.31.
Solana and Polygon each declined about 3%, and Cardano lost more than 4%.
Gold prices dipped in Asian trade on Tuesday, marking a third consecutive day of losses, as investors grappled with inflation and interest-rate concerns ahead of U.S. President Donald Trump’s looming deadline on Iran. Spot gold eased about 0.2% to roughly $4,640 an ounce by early U.S. trading, while U.S. gold futures also retreated. Markets had closed lower on Monday after a volatile session.
Trump’s warning to Iran fuels concerns about rising inflation.
Trump’s escalating rhetoric on Iran added to inflation concerns, even as geopolitical tensions intensified. He warned that Iran could face severe consequences if it failed to reopen the Strait of Hormuz by his Tuesday 8 p.m. ET deadline, increasing fears of a wider conflict in the Middle East.
The standoff has already disrupted global energy supplies and driven oil prices higher, further fueling inflation expectations and clouding the outlook for monetary policy.
Although gold is usually supported by geopolitical uncertainty, it has instead weakened as rising oil prices feed inflation worries and reduce the likelihood of near-term interest rate cuts by the U.S. Federal Reserve.
Higher interest rates tend to weigh on non-yielding assets like gold, while a stronger dollar has also added pressure on bullion prices.
Iran has turned down a U.S. proposal for a ceasefire.
Diplomatic efforts to ease the conflict have made limited headway. Iran has rejected a U.S.-backed proposal for a 45-day ceasefire and a phased reopening of the Strait of Hormuz.
Instead, Tehran is pushing for a comprehensive settlement that includes sanctions relief, security assurances, and compensation for damages.
The absence of any breakthrough has increased uncertainty in financial markets, with investors closely monitoring developments ahead of Trump’s deadline.
Market participants are also awaiting key U.S. inflation figures due on Friday, which are expected to offer further signals on the Federal Reserve’s interest rate path.
In other precious metals, silver declined 0.9% to $72.16 per ounce, while platinum fell 1% to $1,963.60 per ounce. Meanwhile, copper prices moved higher, with benchmark London Metal Exchange futures rising 0.7% to $12,422.5 a ton, and U.S. copper futures edging up 0.3% to $5.62 per pound.
Sterling fell on Tuesday, trading around $1.3234 at 03:50 ET, as the U.S. dollar held firm ahead of a White House deadline linked to the U.S.–Iran conflict.
The decline extended recent losses, with GBP/USD briefly dipping to an intraday low of $1.3211, while the 52-week low remains at $1.2721.
The dollar gained support from heightened geopolitical uncertainty as investors awaited clarity on a potential ceasefire. A failure to reach an agreement could lead to U.S. and Israeli strikes on Iranian civilian infrastructure, increasing the risk of retaliatory action across the Gulf region.
Rising energy prices have also bolstered the greenback. Further gains in oil and gas amid escalating tensions would be “unambiguously dollar-positive,” according to ING strategist Chris Turner.
Stronger U.S. domestic data has added to dollar strength. The March jobs report surprised to the upside, while markets now largely expect the Federal Reserve’s policy stance to remain unchanged this year, contrasting with expectations for additional rate hikes among other major central banks.
ING noted that stronger activity data and higher energy costs could shift expectations toward Fed tightening. Investors are now focused on Wednesday’s Federal Open Market Committee minutes and Friday’s March CPI report for further guidance.
Headline U.S. inflation is forecast to rise to 3.4% year-on-year from 2.4%. Comments from New York Fed President John Williams will also be closely watched for any change in tone.
ING expects the dollar index (DXY) to stay supported within a 100–100.50 range.
Elsewhere, the euro remained under pressure, with EUR/USD at $1.1544 and trading within a 1.1420–1.1640 band. Markets have reduced expectations of an April ECB rate hike to just below 50%, though around 75 basis points of tightening is still priced in for the year.
ING warned that if the ECB holds off on an April move despite elevated energy prices, the euro could face additional downside pressure.
In Central and Eastern Europe, markets followed global trends. Czech inflation is expected to rise due to higher fuel costs, while Romania’s central bank is projected to keep rates at 6.50% despite persistent double-digit inflation. Poland’s central bank is also expected to maintain its 3.75% rate, with forward guidance later in the week in focus.
In Asia-Pacific, the Reserve Bank of New Zealand is widely expected to keep rates unchanged at 2.25% on Wednesday. The New Zealand dollar has underperformed the Australian dollar this year, and without a hawkish surprise, that divergence may continue.
Thinner liquidity later in the week due to holidays could amplify price swings driven by geopolitical developments.
Markets tilted back toward buyers, but it’s still too early to call a sustained rally. The S&P 500 led the move, breaking above downtrend resistance, though it has yet to test its 20-day moving average. A fresh MACD buy signal emerged, but its strength remains questionable as the indicator is still below the zero line.
The Russell 2000 (IWM) closed above its 20-day moving average but still needs to overcome more meaningful resistance at prior highs. After holding firmly above its 200-day MA, it has generated fresh buy signals in both On-Balance Volume and MACD. The index is also showing relative outperformance versus its peers.
The Nasdaq Composite remains below key range support and downtrend resistance. While the past three sessions saw constructive buying—with new buy signals in MACD and On-Balance Volume—the broader picture is largely unchanged, and the index still leans bearish.
Bitcoin has seen little change in its overall setup, but still tilts in favor of the bulls and may offer a trading opportunity. From a technical standpoint, there’s a confirmed buy signal in On-Balance Volume and a potential buy trigger emerging in the MACD.
The Dow Jones Industrial Average has successfully back-tested its breakout and held above the 20-day moving average. The next step is a push toward the 47,000 level. The move is supported by buy signals in both MACD and On-Balance Volume, with the index also outperforming its peers.
Indices that have rallied over the past three sessions are unlikely to extend gains into a fourth, or at least don’t offer attractive long setups. Bitcoin continues to present the most compelling long opportunity. On the short side, there’s limited conviction—though the Nasdaq Composite could provide a setup on a test of the 47K level.
This week will remain driven by developments in the Middle East, although a packed schedule of economic data—including the FOMC March minutes, February personal income, and March CPI—will also draw significant focus.
President Donald Trump said Wednesday night that the United States could wind down its role in the Iran conflict within two to three weeks, offering a potential exit from tensions that have unsettled energy markets since late February. Still, oil prices remain elevated amid ongoing concerns over the Strait of Hormuz, which Trump indicated the U.S. would leave to other nations to reopen.
However, over the weekend, Trump warned that if the strait is not reopened immediately, Monday would mark “Obliteration Day,” with the U.S. prepared to strike Iran’s power infrastructure.
The March 17–18 Federal Reserve minutes (Wednesday) will provide insight into how policymakers viewed the early phase of the conflict. Meanwhile, the March CPI report (Friday) will offer the first indication of how rising gasoline prices are feeding into broader consumer inflation.
Below are the key U.S. economic releases likely to influence investor expectations for growth, inflation, and the path of monetary policy this week:
GDP
Thursday’s final Q4 2025 GDP revision is expected at 0.7% (SAAR), a backward-looking figure that is unlikely to sway markets, having been weighed down by the government shutdown. The bigger focus is on Q1 2026, where the Federal Reserve Bank of Atlanta’s GDPNow model has eased to 1.6% (see chart).
We believe unusually severe winter weather in December, January, and February weighed on recent real GDP growth. Over this period, there was a notable rise in the number of workers who either missed work or shifted to part-time due to harsher-than-normal conditions (see chart).
CPI
The March CPI report (Friday) is the most important release of the week. The Federal Reserve Bank of Cleveland’s Inflation Nowcasting model suggests headline and core inflation rose 0.84% and 0.20% m/m, respectively, or 3.25% and 2.60% y/y—up from 2.40% and 2.50% in February (see chart).
The historical link between oil prices and headline CPI makes the expected March increase largely predictable; every major surge in crude has typically been followed by a rise in headline inflation (see charts). We expect oil prices to peak within the next two months, although this will depend on a swift resolution of tensions in the Middle East.
Unemployment
Friday’s payrolls report surprised to the upside, providing reassurance about the near-term strength of the labor market. Initial jobless claims (Thursday) have continued to trend lower, with the four-week moving average at 207,800 (see chart). So far, claims data show no signs that the war is weakening labor market conditions.
Consumer Sentiment
The preliminary University of Michigan Consumer Sentiment survey for April is expected to ease to 52.0 from 53.3 in March, with expectations already subdued at 51.7 (see chart). Meanwhile, The Conference Board consumer confidence surprised to the upside last week at 91.8, suggesting sentiment may be more resilient than consensus expectations imply.
Oil surged at the Asian open on Monday, bonds declined, and equities were mixed as Donald Trump warned of “hell” if Iran fails to meet his Strait of Hormuz deadline.
Crude prices advanced after the Easter break, with the ongoing U.S.-Israel conflict with Iran continuing to disrupt global supply.
The dollar remained firm, while the yen hovered near the key 160-per-dollar level amid market unease over escalating Iran tensions and Trump’s deadline.
Japan’s benchmark yields climbed to a 27-year high as Middle East conflict fueled inflation concerns and strong U.S. jobs data reduced expectations for early rate cuts.
Gold edged lower, weighed down by a stronger dollar, as elevated oil prices and robust U.S. labor data dampened hopes for Federal Reserve easing.
Dow Jones futures ticked higher Sunday night, with S&P 500 and Nasdaq futures also posting modest gains as investors remained cautious amid fresh U.S.–Iran tensions and rising oil prices.
The S&P 500 advanced during the holiday-shortened week, breaking a five-week losing streak. Earlier, the index had recorded its worst quarter since 2022, weighed down by late-February declines linked to the conflict and surging energy costs. However, markets rebounded last week despite continued gains in crude oil.
All three major indexes ended their five-week slides, each rising at least 3%. Still, equities have faced pressure this year due to concerns over AI disruption, weakness in private credit, and ongoing Middle East uncertainty, leaving the S&P 500 roughly 6% below its late-January peak.
U.S. Economic Data & Earnings Preview
Investors are closely watching upcoming inflation data, particularly Friday’s March Consumer Price Index, which is expected to rise 0.9% month-over-month—an early indication of the inflationary impact from the war-driven surge in energy prices. U.S. crude oil has climbed roughly 90% so far this year, pushing average gasoline prices above $4 per gallon for the first time in more than three years.
Another key release comes Thursday with the Personal Consumption Expenditures report, a preferred inflation gauge for the Federal Reserve and a crucial input for its interest-rate decisions.
Economic calendar:
Monday (Apr 6): Donald Trump holds a press conference at the Oval Office at 1:00 p.m.
Tuesday (Apr 7): Austan Goolsbee participates in a live Q&A in Detroit at 12:35 p.m.
Wednesday (Apr 8): Federal Reserve releases minutes from its March meeting at 2:00 p.m.
Thursday (Apr 9): February PCE report is published.
Friday (Apr 10): March CPI data is released at 8:30 a.m., with forecasts pointing to a 0.9% monthly increase.
Earnings calendar:
Wednesday (Apr 8): Delta Air Lines reports Q1 results before the open, while Constellation Brands posts its fiscal Q4 earnings.
Delta’s recent performance reflects the typical volatility of the airline sector, where fuel costs, labor expenses, and consumer demand fluctuate. The company has held up relatively well by focusing on higher-income travelers who are less sensitive to inflation, even as demand for economy-class seats weakened. In Q4, main-cabin revenue dropped 7% to $5.62 billion, while premium ticket revenue increased 9% to nearly $5.7 billion.
The stock reaction to Delta’s January 14 earnings was muted: adjusted EPS declined 13% year-over-year to $1.55, slightly beating expectations, while revenue rose 3% to $16 billion. Looking ahead, the company projects full-year adjusted EPS of $6.50–$7.50 (midpoint $7.00, below the $7.25 consensus) and Q1 adjusted EPS of $0.50–$0.90, roughly in line with market estimates.
Technical Analysis
DJIA Technical Outlook
The Dow Jones Industrial Average recently broke out above a descending channel, which has now turned into support around 45,760.
As long as the index holds above this level, it is likely to extend its rally toward 47,430, followed by a potential short-term pullback. A clear breakout above 47,430 would signal further upside, with the next target near 48,400.
Notably, the index successfully retested and rebounded from the previous all-time high zone around 45,000—an encouraging sign that the broader uptrend remains intact.
Nasdaq 100 Technical Outlook
The Nasdaq-100 has rebounded from the previously identified support near 23,000.
To maintain upward momentum, the index needs to stay above 23,990, which would open the way for a move toward 24,330 this week. However, a rejection at the 24,330 level could push prices back down toward the 23,000 support zone.
In the near term, the NDX is likely to trade within a range of 23,000 to 24,330 until a decisive breakout establishes a clearer direction.
S&P 500 Technical Outlook
The S&P 500 rebounded from the 6,335–6,340 support zone and delivered a strong rally last week, in line with the previous outlook.
To continue the upward trend, the index needs to break above the 6,610–6,615 resistance area, which would open the path toward 6,705.
If that breakout fails, the SPX is likely to move sideways within a 6,510–6,610 range, with potential downside risk extending to around 6,475.
Weekly U.S. Indices Probability Map
The U.S. weekly probability map for March 30 to April 3, 2026 indicates that the following week (April 6–10) has historically been bullish for major U.S. indices, suggesting a favorable environment for upward momentum.
These probability maps are based on historical seasonality trends, while sentiment indicators are generated using a scoring system derived from those seasonal patterns.
Iran and the United States have received a proposal outlining a path to end hostilities and reopen the Strait of Hormuz, according to multiple media reports citing informed sources, with the plan potentially taking effect as early as Monday.
As reported by AP, the initiative—drafted by Pakistan, Egypt, and Turkey—was shared with both sides overnight and follows a two-phase structure: an immediate ceasefire followed by a comprehensive agreement. A source told Reuters that all elements must be agreed the same day, with the initial arrangement expected to take the form of a memorandum of understanding finalized electronically via Pakistan, which has acted as the sole communication channel.
Pakistan’s army chief, Field Marshal Asim Munir, was reportedly in continuous contact overnight with U.S. Vice President JD Vance, special envoy Steve Witkoff, and Iranian Foreign Minister Abbas Araqchi.
Axios earlier reported that U.S., Iranian, and regional officials were discussing a potential 45-day ceasefire as part of a broader two-stage deal that could ultimately end the conflict. Under the proposal—dubbed the “Islamabad Accord”—a ceasefire would take effect immediately, reopening the Strait, while 15 to 20 days would be used to finalize a wider settlement, with in-person talks planned in Islamabad.
The final agreement is expected to include Iran pledging not to pursue nuclear weapons in exchange for sanctions relief and the release of frozen assets. However, sources in Pakistan said Iran has yet to commit, despite intensified diplomatic efforts, and has not responded to proposals backed by Pakistan, China, and the United States.
Iran has prepared its reply to the proposed ceasefire terms, according to a foreign ministry spokesperson.
Iran has outlined its positions and demands in response to recent ceasefire proposals delivered through intermediaries, a foreign ministry spokesperson said Monday, stressing that negotiations cannot proceed under ultimatums or threats of war crimes.
Spokesperson Esmaeil Baghaei noted that Tehran’s requirements—based on national interests—have already been communicated via intermediary channels, while earlier U.S. proposals, including a 15-point plan, were rejected as excessive.
He emphasized that clearly stating Iran’s legitimate demands should not be seen as compromise, but as confidence in defending its stance. Baghaei added that Iran has prepared its responses and will disclose further details in due course.
US and Iran consider a peace proposal as Trump warns of severe retaliation if the Strait remains closed.
The United States and Iran have received an outline for ending the conflict, but Tehran has refused to immediately reopen the Strait of Hormuz, even after Donald Trump warned of severe consequences if no deal is reached by Tuesday.
According to a source, the proposal follows a two-stage plan: an immediate ceasefire, followed by a broader agreement to be finalized within 15–20 days. Pakistan’s army chief, Asim Munir, has reportedly been in continuous contact with U.S. Vice President JD Vance, envoy Steve Witkoff, and Iran’s foreign minister Abbas Araqchi.
Iran, however, has rejected reopening the Strait under a temporary truce and dismissed imposed deadlines, while also expressing doubts about Washington’s commitment to a lasting ceasefire.
Earlier, Axios reported that the U.S., Iran, and regional mediators were exploring a potential 45-day ceasefire as part of a phased deal toward ending the war.
Trump, posting on Truth Social, issued a deadline of Tuesday evening, threatening further strikes on Iran’s infrastructure if the Strait remains closed.
Meanwhile, airstrikes continued across the region, more than five weeks into the conflict involving the U.S., Israel, and Iran. Tehran has responded by effectively shutting the Strait—through which about 20% of global oil and gas flows—and launching attacks on Israel, U.S. bases, and energy sites in the Gulf.
Officials in the UAE emphasized that any agreement must ensure free passage through the Strait, warning that failing to curb Iran’s nuclear and missile capabilities could lead to greater regional instability.
Despite repeated U.S. claims of weakening Iran’s military capacity, recent Iranian strikes on petrochemical facilities and vessels in Kuwait, Bahrain, and the UAE highlight its continued ability to retaliate.
The conflict has caused heavy casualties: thousands have died in Iran, including many civilians, while Israel and Lebanon have also suffered significant losses as fighting spreads, including clashes with Iran-backed Hezbollah forces.
Asian currencies moved without a clear trend on Monday, while the dollar remained steady as investors weighed escalating geopolitical tensions in the Middle East against signs of renewed ceasefire efforts.
The US Dollar Index inched up 0.1% following recent gains, with its futures also rising 0.1% as of 02:52 ET (06:52 GMT).
Trump issues ultimatum to Iran; Axios reports ongoing ceasefire negotiations
Trump issued a deadline for Iran to reopen the Strait of Hormuz, while reports from Axios pointed to ongoing ceasefire discussions. Traders closely watched the situation as he warned Tehran to resume tanker traffic by 8 p.m. Eastern Time on Tuesday or risk strikes on key infrastructure such as power plants and bridges.
Market sentiment improved slightly after Axios reported that the U.S., Iran, and regional mediators were negotiating a potential 45-day ceasefire, although no deal had been finalized.
In currency markets, USD/JPY remained largely unchanged, while USD/KRW slipped 0.3%. Regional currencies were also shaped by persistently high oil prices following a recent surge, which typically weigh on major importers like Japan, South Korea, and India by worsening their trade balances.
Meanwhile, USD/CNY fell 0.1%, USD/SGD was steady, and AUD/USD rose 0.3%.
Indian rupee weakens; RBI policy decision expected later this week
The Indian rupee weakened, with the USD/INR pair rising 0.6% to 93.281 on Monday, after touching a more than two-week low of 92.585 in the previous session.
The currency had strengthened over the past five sessions, supported by measures from the central bank.
Attention now turns to the Reserve Bank of India’s policy decision on Wednesday, where rates are widely expected to remain unchanged despite the rupee’s decline.
Meanwhile, investors are also reacting to stronger-than-expected U.S. payroll data released on Friday, which has reinforced expectations that the Federal Reserve could keep interest rates higher for longer.
Goldman Sachs Group Inc. reported that hedge funds offloaded global equities in March at the fastest pace in 13 years, marking the second-largest wave of selling since its prime brokerage began tracking the data in 2011.
The selloff was largely driven by a surge in short positions, as investors bet on further market weakness amid ongoing conflict in Iran. Global equities reflected this pressure, with the MSCI All-Country World Index dropping 7.4%—its worst monthly performance since 2022—while the S&P 500 Index fell 5.1% over the same period.
Fast-moving hedge funds increasingly used exchange-traded funds (ETFs) to express bearish views, with short positions in large-cap equity ETFs driving a 17% rise in overall short exposure across U.S.-listed ETFs.
In the U.S., selling was widespread, hitting eight out of 11 sectors, with the heaviest outflows seen in economically sensitive areas such as industrials, materials, and financials.
At the same time, fund managers rotated into more defensive assets, buying consumer staples stocks at the fastest pace since July 2025—driven entirely by new long positions.
Meanwhile, hedge funds turned net buyers of technology, media, and telecom stocks for the first time in four months, though this was mainly due to short covering rather than fresh bullish bets.
UBS remains bullish on gold, expecting prices to hit fresh highs this year as upside risks continue to build, according to strategist Joni Teves in a Thursday note.
Gold has faced pressure recently, as markets reacted to the inflationary effects of rising oil prices and the possibility of further interest rate hikes. Higher U.S. real yields and a stronger dollar have also weighed on the metal.
Despite this, Teves views recent declines as buying opportunities. He noted that the likelihood of gold extending its bull run over the next few years is increasing, particularly if weaker economic growth leads to fiscal or monetary stimulus—factors that would support higher prices. UBS reiterated that its overall outlook remains unchanged, continuing to expect new highs this year and encouraging investors to use pullbacks to build positions.
The bank now forecasts gold to average $5,000 per ounce in 2026, slightly lowered from its previous $5,200 estimate due to recent price adjustments after January’s peak. Projections for 2027 and 2028 remain unchanged at $4,800 and $4,250, respectively.
Teves also pointed out that speculative positions have been largely cleared out, while ETF outflows remain limited, creating room for renewed investor demand. Strong inflows into gold ETFs in China and steady domestic physical demand are expected to support imports through the second quarter. UBS believes the market is currently underinvested and sees any dip toward $4,000 as an attractive entry point. The bank also highlighted a structural shift, with more investors—both public and private—treating gold as a long-term strategic asset for diversification and portfolio protection.
For silver, UBS lowered its 2026 forecast to $91.9 per ounce from $105, though it still expects silver to outperform gold during rallies. However, Teves cautioned that silver’s industrial exposure makes it vulnerable to global economic slowdowns, which could weaken demand and sentiment. As a result, the gold-to-silver ratio may struggle to revisit earlier lows and is more likely to bottom in the 50–60 range rather than around 40.
Platinum and palladium face similar challenges from softer industrial demand, although potential supply disruptions—especially if Middle East tensions affect South African mining—could offer some support.
Currencies moved within narrow ranges on Friday as investors stayed cautious amid ongoing Middle East tensions, while reduced liquidity from the Good Friday holiday kept market activity subdued.
The U.S. dollar was largely steady after gaining 0.4% in the prior session, supported by safe-haven demand following remarks from U.S. President Donald Trump regarding Iran.
Tensions surrounding Iran remained elevated, with Trump signaling the possibility of expanded military action in the coming weeks and warning that key infrastructure—such as bridges and power facilities—could be targeted.
However, sentiment showed slight improvement on Thursday after Iran indicated it was working with Oman on a framework to manage shipping through the Strait of Hormuz, easing fears of disruptions along a critical oil route.
In Asia, the Japanese yen held flat, with USD/JPY trading near the closely watched 160 level. Japan’s finance minister also cautioned that authorities were prepared to intervene against speculative currency moves amid rising volatility.
Other regional currencies, including the South Korean won and Singapore dollar, saw limited movement.
Meanwhile, the Indian rupee weakened slightly to 92.71 per dollar but remained on track for a weekly gain of over 2%, recovering from earlier losses after support measures from the Reserve Bank of India helped stabilize the currency.
The RBI imposed limits on banks’ foreign exchange positions and restricted non-deliverable forward trades, prompting the unwinding of speculative bets and increased dollar selling in the domestic market.
Elsewhere, the Chinese yuan edged lower. Data released earlier showed China’s services sector growth slowed in March, with the Ratingdog Services PMI declining from February’s recent peak.
Investors are now focusing on the upcoming U.S. nonfarm payrolls report, which may offer further insight into the Federal Reserve’s interest rate outlook.
For the first time, India’s mutual fund industry is now permitted to include silver within equity and hybrid portfolio structures, marking a significant shift in asset allocation options.
To put this into perspective, India is already the world’s most silver-intensive consumer market in bullion and investment demand. Silver imports reached a record 247.4 million ounces (Moz) in 2024, while holdings in silver ETFs surged about 195% year-on-year—from roughly 13 Moz at the end of 2023 to 38.6 Moz by the end of 2024, nearly tripling within a single year. This growth reflects a deeply rooted cultural preference for silver that is not matched in most Western markets.
Despite this strong demand base, India’s large institutional capital pools previously had no scalable or direct route to allocate to silver ETFs through standard equity and hybrid fund structures.
As of April 1, 2026, that constraint has been lifted.
What SEBI Has Changed and Why It Is Important
India’s Securities and Exchange Board of India has officially introduced two linked reforms today, reshaping the way mutual funds in India are able to invest in silver.
The valuation change is largely technical but still important: funds benchmarked to the London price previously traded at a persistent divergence from actual silver prices in Mumbai. That spread acted as a structural barrier to institutional participation. Its removal effectively eliminates an arbitrage that had made silver ETF exposure in India less precise for fund managers.
The allocation change, however, is the more consequential structural shift.
India’s mutual fund industry manages around ₹82 trillion (about $950 billion) in assets under management as of February 2026. Equity and hybrid schemes form the largest segment. Before this reform, these schemes were not permitted to allocate to silver at all. The new framework changes that, though access is limited to the residual allocation bucket—assets left after meeting core equity or hybrid mandates—capped at 35% and shared among gold, InvITs, and debt instruments as competing options.
To put the scale in perspective:
A 0.1% allocation from equity and hybrid AUM into silver ETFs would translate to roughly $950 million in new demand, or about 13 Moz at current prices.
A 0.5% allocation would imply around $4.75 billion, or approximately 65 Moz.
A 1.0% allocation would equate to about $9.5 billion, or roughly 130 Moz.
These figures represent potential scale rather than immediate inflows; actual deployment will depend on how quickly fund managers adopt the new flexibility and is expected to unfold gradually. Moreover, this is a simplified upper-bound illustration, as silver must compete within the residual bucket alongside other asset classes such as gold, InvITs, and debt. Analysts cited by the Economic Times suggest most equity schemes are unlikely to fully utilize the 35% cap and will instead treat precious metals as a tactical, not structural, allocation.
Even so, when set against a sixth consecutive structural silver deficit projected at around 67 Moz by Metals Focus and the Silver Institute, even conservative participation levels could be material relative to the underlying supply shortfall.
The growth trend that was already in motion
What makes this reform significant is the existing momentum it builds upon. Even before institutional access was expanded, Indian retail investors were already fueling strong growth in silver ETPs:
That nearly threefold increase between 2023 and 2024—and almost fivefold growth over two years—was driven entirely by retail investors and fund categories that already had permission to hold silver. The institutional equity and hybrid segment contributed nothing to that expansion.
The SEBI reform today layers institutional access onto a base that was already accelerating at a 63% annual growth rate before 2024, before surging 195% in 2024 alone. The key question is no longer whether institutional capital will eventually flow into silver through this channel, but how quickly fund managers begin acting on a mandate that did not exist until now.
Why Institutional Flows Behave Differently
Retail silver demand in India is inherently cyclical and seasonal. Wedding seasons drive jewelry and silverware purchases, while festivals spur buying of coins and bars. This demand is substantial—reflected in 247.4 Moz of imports in 2024—but it fluctuates strongly with the calendar.
Institutional allocations operate on a different mechanism. Once a fund’s mandate includes silver ETFs, exposure is expressed as a portfolio weight and rebalanced systematically over time. It does not switch off after festivals, weaken during sentiment downturns, or disappear in corrections. The first clear signal of adoption will likely appear in AMFI monthly flow data, which tracks how mutual funds are reallocating across asset classes, showing whether managers are actively implementing the new framework or taking a cautious, wait-and-see approach.
The structural significance, therefore, is not immediate multi-billion-dollar inflows. It is the creation of a permanent allocation channel in a market that already combines the world’s largest physical silver demand base with a rapidly expanding institutional asset management system.
The SEBI reform is one component. The broader story is the convergence of multiple catalysts within a very short time window.
Gold futures continue to display a strong bullish monthly structure, with momentum remaining firmly upward as prices hold above the VC PMI mean at $4,761. This level acts as a key equilibrium point, and sustained trading above it is typically interpreted as a sign of institutional accumulation and ongoing trend strength.
The recent move into the $4,815–$4,820 area suggests the market is shifting from a consolidation phase into a broader expansion phase. At the same time, rising volatility is increasingly aligned with upward price continuation, supporting a bias toward further gains.
From a VC PMI perspective, the market has held above the Buy 1 level at $4,047, where historical demand typically emerges with a high probability (around 90%) of mean reversion. The fact that price has not retested this level further strengthens the bullish structure and suggests continued buyer dominance.
On the upside, the next key structural reference points are Sell 1 at $5,392 and Sell 2 at $6,106, which are viewed as extended deviation zones above the mean. As price moves closer to these areas, conditions tend to favor profit-taking rather than new long entries.
Cycle analysis also points to a favorable momentum phase extending into early to mid-April, supporting continued upside expansion in line with the recent breakout above the mean. A key cycle turning point is expected around mid-April, where the market may either accelerate toward Sell 1 or enter a period of consolidation. Looking further ahead into May–June, broader cycle structure continues to lean bullish, supporting the potential for higher highs and a sustained move toward and potentially beyond the $5,000 level.
Square of 9 geometry further supports this outlook, with key harmonic resistance emerging around the $4,950–$5,050 zone, followed by a larger expansion node near $5,392 (Sell 1). A decisive break and sustained trade above $5,050 would signal a shift into a higher-momentum geometric phase, increasing the likelihood of continuation toward upper projected levels. These price zones are interpreted as natural vibration points where both time and price align, reinforcing the probability of trend persistence.
Overall market conditions remain bullish while price holds above $4,761. The preferred strategy continues to favor buying dips rather than selling strength, as long as this structural support remains intact. A breakdown back below the mean would weaken momentum and return the market to a neutral posture.
There is currently no indication of an “earnings recession,” and first-quarter corporate results are expected to show continued strength, with earnings surprises considered a normal pattern. In the fourth quarter, S&P 500 earnings increased at an annualized rate of 14.1%, while analysts are projecting roughly 14% growth for the first quarter.
On the labor front, ADP reported 62,000 private-sector jobs were added in March, exceeding economists’ forecast of 40,000. The increase was partly driven by the resolution of the Kaiser healthcare strike and improved weather conditions that supported construction hiring. However, manufacturing employment declined by 11,000, while trade, transportation, and utilities saw the largest losses, totaling 58,000 jobs.
Retail activity also provided positive signals for growth, with the Commerce Department reporting a 0.6% rise in February retail sales, slightly above expectations of 0.5%. Auto sales increased by 1.2%, suggesting stronger demand for durable goods, and gains were recorded in 10 of 13 retail categories.
Consumer sentiment also improved modestly, as the Conference Board’s index rose to 91.8 in March from 91 in February. The present situation sub-index increased significantly, while the expectations component slipped slightly. The improvement in sentiment was likely supported by better weather conditions during the month.
On the geopolitical front, President Trump is expected to address the nation, following remarks from both him and Secretary of State Marco Rubio suggesting that an end to the conflict may be approaching. Trump indicated that U.S. forces could begin withdrawing within a few weeks.
However, risks remain around the Strait of Hormuz, where shipping conditions are still unstable despite an increase in traffic. Recent attacks, including one targeting a Kuwaiti oil tanker, highlight ongoing tensions. U.S. Defense Secretary Pete Hegseth emphasized the need for allied nations to help secure and reopen the waterway. The UAE is reportedly preparing to support efforts to restore access, including pursuing a UN Security Council resolution.
Overall, there is an expectation that the administration is seeking to reduce crude oil prices by stabilizing the Strait of Hormuz. Ensuring the resumption of fertilizer shipments through the passage is also seen as critical, given its importance for agricultural productivity and food price stability during the planting season.